
Radiomics Analysis of Brain [18F]FDG PET/CT to Predict Alzheimer’s Disease in Patients with Amyloid PET Positivity: A Preliminary Report on the Application of SPM Cortical Segmentation, Pyradiomics and Machine-Learning Analysis

 ,
,  ,
, 
 ,
,  ,
,  , , , ,

Abstract
1. Introduction
2. Materials and Methods
2.1. PET/CT Acquisition Protocol
2.2. Qualitative Evaluation of FDG PET
2.3. Image Pre-Processing and ROI Selection
2.4. Extraction of Radiomics Features and Machine Learning Classification
3. Results
Analysis of Radiomics Features
- −
- ROI 1
- original_glcm_Idmn
- original_glcm_Id: with the following values of SS 84.92%, SP 75.13%, PR 73.75%, AC 79.56% (p < 0.001).
- −
- ROI 2
- original_glcm_MaximumProbability: with the following values of SS 88.67%, SP 46.81%, PR 59.47%, AC 65.57% (p < 0.001).
- −
- ROI 3
- original_glcm_Id: with the following values of SS 93.83%, SP 61.80%, PR 67.51%, AC 76.15% (p < 0.001).
- −
- ROI 4
- original_glcm_MaximumProbability
- original_firstorder_Maximum: with the following values of SS 86.33%, SP 64.93%, PR 66.88%, AC 74.58% (p < 0.001).
- −
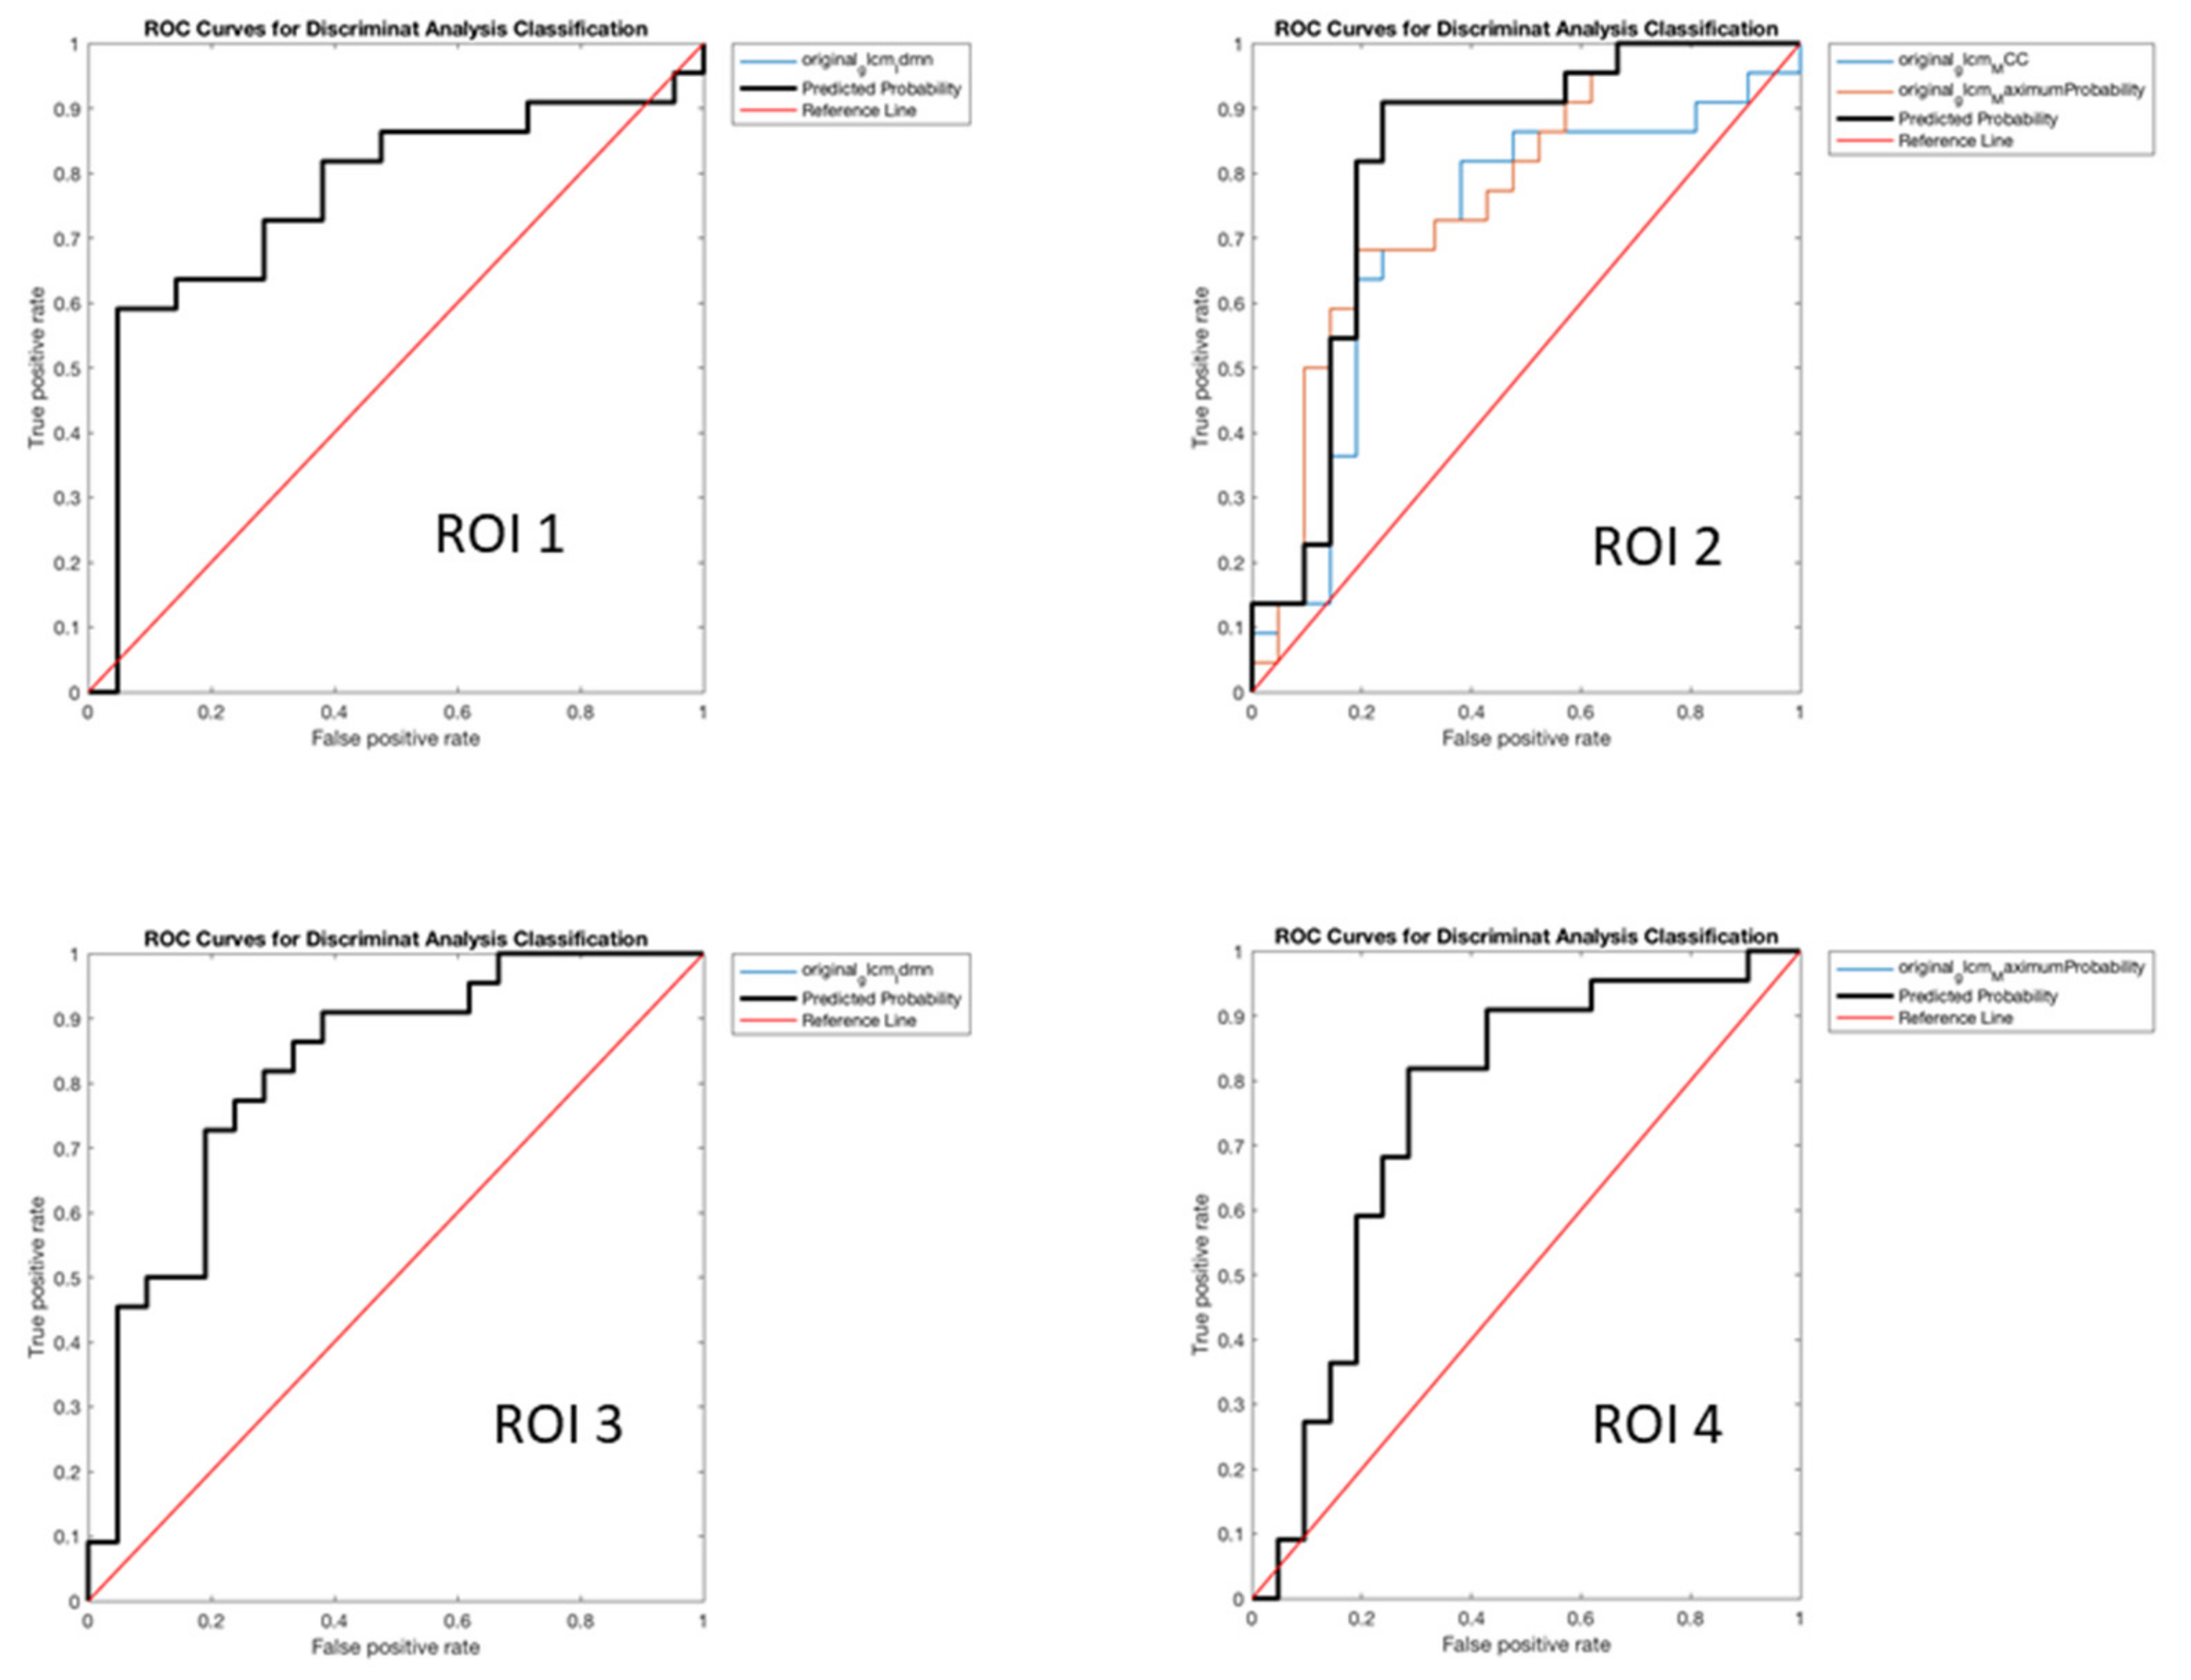
- ROI 1
- original_glcm_Idmn: with the following values of SS 66.39%, SP 57.51%, PR 58.46%, AC 61.51% and (p = 0.004).
- −
- ROI 2
- original_glcm_MCC
- original_glcm_MaximumProbability: with the following values of SS 75.16%, SP 80.50%, PR 77.68%, AC 78.05% and (p = 0.002).
- −
- ROI 3
- original_glcm_Idmn: with the following values of SS 80.88%, SP 76.85%, PR 75.63%, AC 78.76% and (p < 0.001).
- −
- ROI 4
- original_glcm_MaximumProbability: with the following values of SS 75.50%, SP 55.25%, PR 59.53%, AC 64.96% (p = 0.0040).
4. Discussion
5. Conclusions
Author Contributions
Funding
Institutional Review Board Statement
Informed Consent Statement
Acknowledgments
Conflicts of Interest
References
- Castellani, R.J.; Rolston, R.K.; Smith, M.A. Alzheimer Disease. Dis.-A-Mon. DM 2010, 56, 484–546. [Google Scholar] [CrossRef] [PubMed]
- Cistaro, A.; Quartuccio, N.; Cassalia, L.; Vai, D.; Guerra, U.P.; Atzori, C.; Rainero, I.; Imperiale, D. Brain 18F-Florbetapir PET/CT Findings in an Early-onset Alzheimer Disease Patient Carrying Presenilin-1 G378E Mutation. Alzheimer Dis. Assoc. Disord. 2021. [Google Scholar] [CrossRef]
- Cistaro, A.; Alongi, P.; Caobelli, F.; Cassalia, L. Radiotracers for Amyloid Imaging in Neurodegenerative Disease: State-of-the-Art and Novel Concepts. Curr. Med. Chem. 2018, 25, 3131–3140. [Google Scholar] [CrossRef]
- Abrahamson, E.E.; Head, E.; Lott, I.T.; Handen, B.L.; Mufson, E.J.; Christian, B.T.; Klunk, W.E.; Ikonomovic, M.D. Neuropathological correlates of amyloid PET imaging in Down syndrome. Dev. Neurobiol. 2019, 79, 750–766. [Google Scholar] [CrossRef] [PubMed]
- Lee, B.; Leavitt, M.J.; Bernick, C.B.; Leger, G.C.; Rabinovici, G.; Banks, S.J. A Systematic Review of Positron Emission Tomography of Tau, Amyloid Beta, and Neuroinflammation in Chronic Traumatic Encephalopathy: The Evidence to Date. J. Neurotrauma 2018, 35, 2015–2024. [Google Scholar] [CrossRef]
- Petrou, M.; Dwamena, B.; Foerster, B.R.; MacEachern, M.; Bohnen, N.I.; Müller, M.L.; Albin, R.L.; Frey, K.A. Amyloid deposition in Parkinson’s disease and cognitive impairment: A systematic review. Mov. Disord. 2015, 30, 928–935. [Google Scholar] [CrossRef]
- Jack, C.R., Jr.; Bennett, D.A.; Blennow, K.; Carrillo, M.C.; Dunn, B.; Haeberlein, S.B.; Holtzman, D.M.; Jagust, W.; Jessen, F.; Karlawish, J.; et al. NIA-AA Research Framework: Toward a biological definition of Alzheimer’s disease. Alzheimers Dement. 2018, 14, 535–562. [Google Scholar] [CrossRef]
- Sorbi, S.; Hort, J.; Erkinjuntti, T.; Fladby, T.; Gainotti, G.; Gürvit, H.; Nacmias, B.; Pasquier, F.; Popescu, B.O.; Rektorova, I.; et al. EFNS-ENS Guidelines on the diagnosis and management of disorders associated with dementia. Eur. J. Neurol. 2012, 19, 1159–1179. [Google Scholar] [CrossRef]
- Ashburner, J.; Friston, K. Unified segmentation. NeuroImage 2005, 26, 839–851. [Google Scholar] [CrossRef]
- Lange, C.; Suppa, P.; Frings, L.; Brenner, W.; Spies, L.; Buchert, R. Optimization of Statistical Single Subject Analysis of Brain FDG PET for the Prognosis of Mild Cognitive Impairment-to-Alzheimer’s Disease Conversion. J. Alzheimers Dis. 2016, 49, 945–959. [Google Scholar] [CrossRef]
- Moretti, D.V.; Pievani, M.; Pini, L.; Guerra, U.P.; Paghera, B.; Frisoni, G.B. Cerebral PET glucose hypometabolism in subjects with mild cognitive impairment and higher EEG high-alpha/low-alpha frequency power ratio. Neurobiol. Aging 2017, 58, 213–224. [Google Scholar] [CrossRef] [PubMed]
- Fornacon-Wood, I.; Mistry, H.; Ackermann, C.J.; Blackhall, F.; McPartlin, A.; Faivre-Finn, C.; Price, G.J.; O’Connor, J.P.B. Reliability and prognostic value of radiomic features are highly dependent on choice of feature extraction platform. Eur. Radiol. 2020, 30, 6241–6250. [Google Scholar] [CrossRef] [PubMed]
- van Griethuysen, J.J.M.; Fedorov, A.; Parmar, C.; Hosny, A.; Aucoin, N.; Narayan, V.; Beets-Tan, R.G.H.; Fillion-Robin, J.-C.; Pieper, S.; Aerts, H.J.W.L. Computational Radiomics System to Decode the Radiographic Phenotype. Cancer Res. 2017, 77, e104–e107. [Google Scholar] [CrossRef]
- Barone, S.; Cannella, R.; Comelli, A.; Pellegrino, A.; Salvaggio, G.; Stefano, A.; Vernuccio, F. Hybrid descriptive-inferential method for key feature selection in prostate cancer radiomics. Appl. Stoch. Model. Bus. Ind. 2021, 37, 961–972. [Google Scholar] [CrossRef]
- Comelli, A.; Stefano, A.; Bignardi, S.; Russo, G.; Sabini, M.G.; Ippolito, M.; Barone, S.; Yezzi, A. Active contour algorithm with discriminant analysis for delineating tumors in positron emission tomography. Artif. Intell. Med. 2019, 94, 67–78. [Google Scholar] [CrossRef] [PubMed]
- Alongi, P.; Stefano, A.; Comelli, A.; Laudicella, R.; Scalisi, S.; Arnone, G.; Barone, S.; Spada, M.; Purpura, P.; Bartolotta, T.V.; et al. Radiomics analysis of 18F-Choline PET/CT in the prediction of disease outcome in high-risk prostate cancer: An explorative study on machine learning feature classification in 94 patients. Eur. Radiol. 2021, 31, 4595–4605. [Google Scholar] [CrossRef]
- Fodero-Tavoletti, M.T.; Cappai, R.; McLean, C.A.; Pike, K.E.; Adlard, P.A.; Cowie, T.; Connor, A.R.; Masters, C.L.; Rowe, C.C.; Villemagne, V.L. Amyloid Imaging in Alzheimer’s Disease and Other Dementias. Brain Imaging Behav. 2009, 3, 246–261. [Google Scholar] [CrossRef]
- Braak, H.; Braak, E. Neuropathological stageing of Alzheimer-related changes. Acta Neuropathol. 1991, 82, 239–259. [Google Scholar] [CrossRef]
- Palmqvist, S.; Schöll, M.; Strandberg, O.; Mattsson-Carlgren, N.; Stomrud, E.; Zetterberg, H.; Blennow, K.; Landau, S.; Jagust, W.; Hansson, O. Earliest accumulation of β-amyloid occurs within the default-mode network and concurrently affects brain connectivity. Nat. Commun. 2017, 8, 1214. [Google Scholar] [CrossRef]
- Berti, V.; Pupi, A.; Mosconi, L. PET/CT in diagnosis of dementia. Ann. N. Y. Acad. Sci. 2011, 1228, 81–92. [Google Scholar] [CrossRef]
- Galavis, P.; Hollensen, C.; Jallow, N.; Paliwal, B.; Jeraj, R. Variability of textural features in FDG PET images due to different acquisition modes and reconstruction parameters. Acta Oncol. 2010, 49, 1012–1016. [Google Scholar] [CrossRef] [PubMed]
- Shirvaikar, M.; Huang, N.; Dong, X.N. The Measurement of Bone Quality Using Gray Level Co-Occurrence Matrix Textural Features. J. Med. Imaging Health Inform. 2016, 6, 1357–1362. [Google Scholar] [CrossRef] [PubMed][Green Version]
- Zhou, H.; Jiang, J.; Lu, J.; Wang, M.; Zhang, H.; Zuo, C.; Initiative, A.D.N. Dual-Model Radiomic Biomarkers Predict Development of Mild Cognitive Impairment Progression to Alzheimer’s Disease. Front. Neurosci. 2019, 12, 1045. [Google Scholar] [CrossRef] [PubMed]
- Li, Y.; Jiang, J.; Lu, J.; Jiang, J.; Zhang, H.; Zuo, C. Radiomics: A novel feature extraction method for brain neuron degeneration disease using 18F-FDG PET imaging and its implementation for Alzheimer’s disease and mild cognitive impairment. Ther. Adv. Neurol. Disord. 2019, 12, 1756286419838682. [Google Scholar] [CrossRef]
- Zhou, P.; Zeng, R.; Yu, L.; Feng, Y.; Chen, C.; Li, F.; Liu, Y.; Huang, Y.; Huang, Z.; Initiative, T.A.D.N. Deep-Learning Radiomics for Discrimination Conversion of Alzheimer’s Disease in Patients with Mild Cognitive Impairment: A Study Based on 18F-FDG PET Imaging. Front. Aging Neurosci. 2021, 13, 764872. [Google Scholar] [CrossRef]
- Jiang, J.; Wang, M.; Alberts, I.; Sun, X.; Li, T.; Rominger, A.; Zuo, C.; Han, Y.; Shi, K.; Initiative, F.T.A.D.N. Using radiomics-based modelling to predict individual progression from mild cognitive impairment to Alzheimer’s disease. Eur. J. Pediatr. 2022, 1–11. [Google Scholar] [CrossRef]


| ROI 1 | Areas | Label Index | ROI 2 | Areas | Label Index | ROI 3 | Areas | Label Index | ROI 4 | Areas | Label Index |
|---|---|---|---|---|---|---|---|---|---|---|---|
| Right Hippocampus | 47 | Right (AOrG anterior orbital gyrus | 104 | Right FuG fusiform gyrus | 122 | Right PO parietal operculum | 174 | ||||
| Right PHG parahippocampal gyrus | 170 | Right MOrG medial orbital gyrus | 146 | Right GRe gyrus rectus | 124 | Right PoG postcentral gyrus | 176 | ||||
| Right Ent entorhinal area | 116 | Right OpIFGopercular part of the inferior frontal gyrus | 162 | Right ITG inferior temporal gyrus | 132 | Right SPL superior parietal lobule | 198 | ||||
| Right MTG middle temporal gyrus | 154 | Right OrIFG orbital part of the inferior frontal gyrus | 164 | Right TMP temporal pole | 202 | Right PCgG posterior cingulate gyrus | 166 | ||||
| Left Hippocampus | 48 | Right MFC medial frontal cortex | 140 | Left FuG fusiform gyrus | 123 | Right PCuprecuneus | 168 | ||||
| Left PHG parahippocampal gyrus | 171 | Right MFG middle frontal gyrus | 142 | Left GRe gyrus rectus | 125 | Left PoG postcentral gyrus | 177 | ||||
| Left Ent entorhinal area | 117 | Left MOrG medial orbital gyrus | 147 | Left ITG inferior temporal gyrus | 133 | Left PO parietal operculum | 175 | ||||
| Left MTG middle temporal gyrus | 155 | Left AOrG anterior orbital gyrus | 105 | Left TMP temporal pole | 203 | Left SPL superior parietal lobule | 199 | ||||
| Left OpIFGopercular part of the inferior frontal gyrus | 163 | Left PCuprecuneus | 169 | ||||||||
| Left OrIFG orbital part of the inferior frontal gyrus | 165 | Left PCgG posterior cingulate gyrus | 167 | ||||||||
| Left MFC medial frontal cortex | 141 | ||||||||||
| Left MFG middle frontal gyrus | 143 |
| pt N° | Sex | Age | Schooling | MMSE | CDR | MRI | FDG PET | Amy-PET | Final Diagnosis (MDT) |
|---|---|---|---|---|---|---|---|---|---|
| 1 | F | 64 | 21 | 19 | 1 | 1 | 1 | 1 | 1 |
| 2 | M | 81 | 5 | 27 | 0 | 0 | 0 | 0 | 0 |
| 3 | F | 59 | 8 | 23 | 0.5 | 1 | 0 | 0 | 0 |
| 4 | M | 63 | 18 | 21 | 1 | 1 | 1 | 1 | 1 |
| 5 | F | 79 | 5 | 20 | 0.5 | 1 | 0 | 0 | 0 |
| 6 | F | 80 | 5 | 18 | 2 | 1 | 1 | 1 | 1 |
| 7 | F | 75 | 5 | 22 | 1 | 1 | 1 | 1 | 1 |
| 8 | F | 72 | 5 | 12 | 1 | 1 | 1 | 1 | 1 |
| 9 | F | 77 | 5 | 19 | 2 | 1 | 0 | 0 | 0 |
| 10 | F | 71 | 13 | 20 | 2 | 1 | 1 | 1 | 1 |
| 11 | F | 75 | 5 | 17 | 2 | 1 | 1 | 0 | 0 |
| 12 | F | 83 | 5 | 20 | 1 | 1 | 0 | 0 | 0 |
| 13 | M | 58 | 18 | 9 | 2 | 1 | 1 | 1 | 1 |
| 14 | F | 61 | 13 | 22 | 2 | 0 | 0 | 1 | 1 |
| 15 | M | 66 | 13 | 21 | 1 | 0 | 1 | 1 | 1 |
| 16 | F | 75 | 8 | 26 | 0.5 | 1 | 0 | 0 | 0 |
| 17 | F | 53 | 13 | 13 | 1 | 1 | 1 | 1 | 1 |
| 18 | M | 66 | 8 | 28 | 0.5 | 1 | 1 | 1 | 1 |
| 19 | M | 72 | 18 | 24 | 0.5 | 1 | 0 | 0 | 0 |
| 20 | M | 79 | 13 | 17 | 1 | 1 | 1 | 1 | 1 |
| 21 | M | 69 | 13 | 28 | 0.5 | 1 | 1 | 0 | 0 |
| 22 | F | 73 | 13 | 25 | 1 | 1 | 1 | 1 | 1 |
| 23 | M | 76 | 8 | 28 | 0.5 | 1 | 1 | 0 | 0 |
| 24 | M | 74 | 5 | 29 | 0.5 | 1 | 0 | 0 | 0 |
| 25 | M | 61 | 18 | 22 | 2 | 0 | 1 | 1 | 1 |
| 26 | F | 70 | 8 | 25 | 1 | 1 | 1 | 0 | 0 |
| 27 | F | 68 | 13 | 15 | 2 | 1 | 1 | 1 | 1 |
| 28 | M | 65 | 8 | 25 | 0,5 | 1 | 1 | 1 | 1 |
| 29 | M | 80 | 8 | 18 | 1 | 1 | 0 | 0 | 0 |
| 30 | F | 71 | 5 | 4 | 3 | 0 | 1 | 1 | 1 |
| 31 | M | 78 | 8 | 13 | 1 | 1 | 1 | 0 | 0 |
| 32 | F | 74 | 8 | 10 | 2 | 1 | 1 | 1 | 1 |
| 33 | M | 80 | 0 | 18 | 1 | 1 | 0 | 0 | 0 |
| 34 | M | 78 | 5 | 22 | 0.5 | 1 | 0 | 0 | 0 |
| 35 | M | 71 | 0 | 17 | 1 | 1 | 1 | 0 | 0 |
| 36 | M | 58 | 8 | 21 | 1 | 1 | 1 | 1 | 1 |
| 37 | F | 63 | 18 | 24 | 1 | 1 | 0 | 0 | 0 |
| 38 | F | 74 | 5 | 28 | 0.5 | 1 | 1 | 1 | 1 |
| 39 | M | 77 | 5 | 30 | 0.5 | 1 | 0 | 0 | 0 |
| 40 | M | 65 | 8 | 20 | 1 | 0 | 1 | 1 | 1 |
| 41 | M | 62 | 17 | 21,46 | 0.5 | 1 | 1 | 1 | 0 |
| 42 | F | 77 | 5 | 22 | 1 | 1 | 1 | 1 | 1 |
| 43 | F | 66 | 8 | 26 | 0.5 | 1 | 0 | 0 | 0 |
| Features Selected for Each ROI | Sensitivity [%] | Specificity [%] | Precision [%] | Accuracy [%] | p-Value |
|---|---|---|---|---|---|
| ROI 1 | |||||
| original_glcm_Idmn original_glcm_Id | 84.92 | 75.13 | 73.75 | 79.56 | <0.05 |
| ROI 2 | |||||
| original_glcm_MCC | 88.67 | 46.81 | 59.47 | 65.57 | <0.05 |
| ROI 3 | |||||
| original_glcm_Id | 93.83 | 61.80 | 67.51 | 76.15 | <0.05 |
| ROI 4 | |||||
| original_glcm_Maximum Probability | 86.33 | 64.93 | 66.88 | 74.58 | <0.05 |
| Features Selected for Each ROI | Sensitivity [%] | Specificity [%] | Precision [%] | Accuracy [%] | p-Value |
|---|---|---|---|---|---|
| ROI 1 | |||||
| original_glcm_Idmn | 66.39 | 57.51 | 58.46 | 61.51 | 0.004 |
| ROI 2 | |||||
| original_glcm_MCC original_glcm_MaximumProbability | 75.16 | 80.50 | 77.68 | 78.05 | 0.002 |
| ROI 3 | |||||
| original_glcm_Idmn | 80.88 | 76.85 | 75.63 | 78.76 | <0.05 |
| ROI 4 | |||||
| original_glcm_Maximum Probability original_firstorder_Maximum | 75.50 | 55.25 | 59.53 | 64.96 | 0.004 |
Publisher’s Note: MDPI stays neutral with regard to jurisdictional claims in published maps and institutional affiliations. |
© 2022 by the authors. Licensee MDPI, Basel, Switzerland. This article is an open access article distributed under the terms and conditions of the Creative Commons Attribution (CC BY) license (https://creativecommons.org/licenses/by/4.0/).
Share and Cite
Alongi, P.; Laudicella, R.; Panasiti, F.; Stefano, A.; Comelli, A.; Giaccone, P.; Arnone, A.; Minutoli, F.; Quartuccio, N.; Cupidi, C.; et al. Radiomics Analysis of Brain [18F]FDG PET/CT to Predict Alzheimer’s Disease in Patients with Amyloid PET Positivity: A Preliminary Report on the Application of SPM Cortical Segmentation, Pyradiomics and Machine-Learning Analysis. Diagnostics 2022, 12, 933. https://doi.org/10.3390/diagnostics12040933
Alongi P, Laudicella R, Panasiti F, Stefano A, Comelli A, Giaccone P, Arnone A, Minutoli F, Quartuccio N, Cupidi C, et al. Radiomics Analysis of Brain [18F]FDG PET/CT to Predict Alzheimer’s Disease in Patients with Amyloid PET Positivity: A Preliminary Report on the Application of SPM Cortical Segmentation, Pyradiomics and Machine-Learning Analysis. Diagnostics. 2022; 12(4):933. https://doi.org/10.3390/diagnostics12040933
Chicago/Turabian StyleAlongi, Pierpaolo, Riccardo Laudicella, Francesco Panasiti, Alessandro Stefano, Albert Comelli, Paolo Giaccone, Annachiara Arnone, Fabio Minutoli, Natale Quartuccio, Chiara Cupidi, and et al. 2022. "Radiomics Analysis of Brain [18F]FDG PET/CT to Predict Alzheimer’s Disease in Patients with Amyloid PET Positivity: A Preliminary Report on the Application of SPM Cortical Segmentation, Pyradiomics and Machine-Learning Analysis" Diagnostics 12, no. 4: 933. https://doi.org/10.3390/diagnostics12040933
APA StyleAlongi, P., Laudicella, R., Panasiti, F., Stefano, A., Comelli, A., Giaccone, P., Arnone, A., Minutoli, F., Quartuccio, N., Cupidi, C., Arnone, G., Piccoli, T., Grimaldi, L. M. E., Baldari, S., & Russo, G. (2022). Radiomics Analysis of Brain [18F]FDG PET/CT to Predict Alzheimer’s Disease in Patients with Amyloid PET Positivity: A Preliminary Report on the Application of SPM Cortical Segmentation, Pyradiomics and Machine-Learning Analysis. Diagnostics, 12(4), 933. https://doi.org/10.3390/diagnostics12040933