
QUCoughScope: An Intelligent Application to Detect COVID-19 Patients Using Cough and Breath Sounds

 , , , ,
  ,
,  , and
, and 
Abstract
:1. Introduction
2. Methodology
2.1. Dataset Description
2.2. Pre-Processing Stage
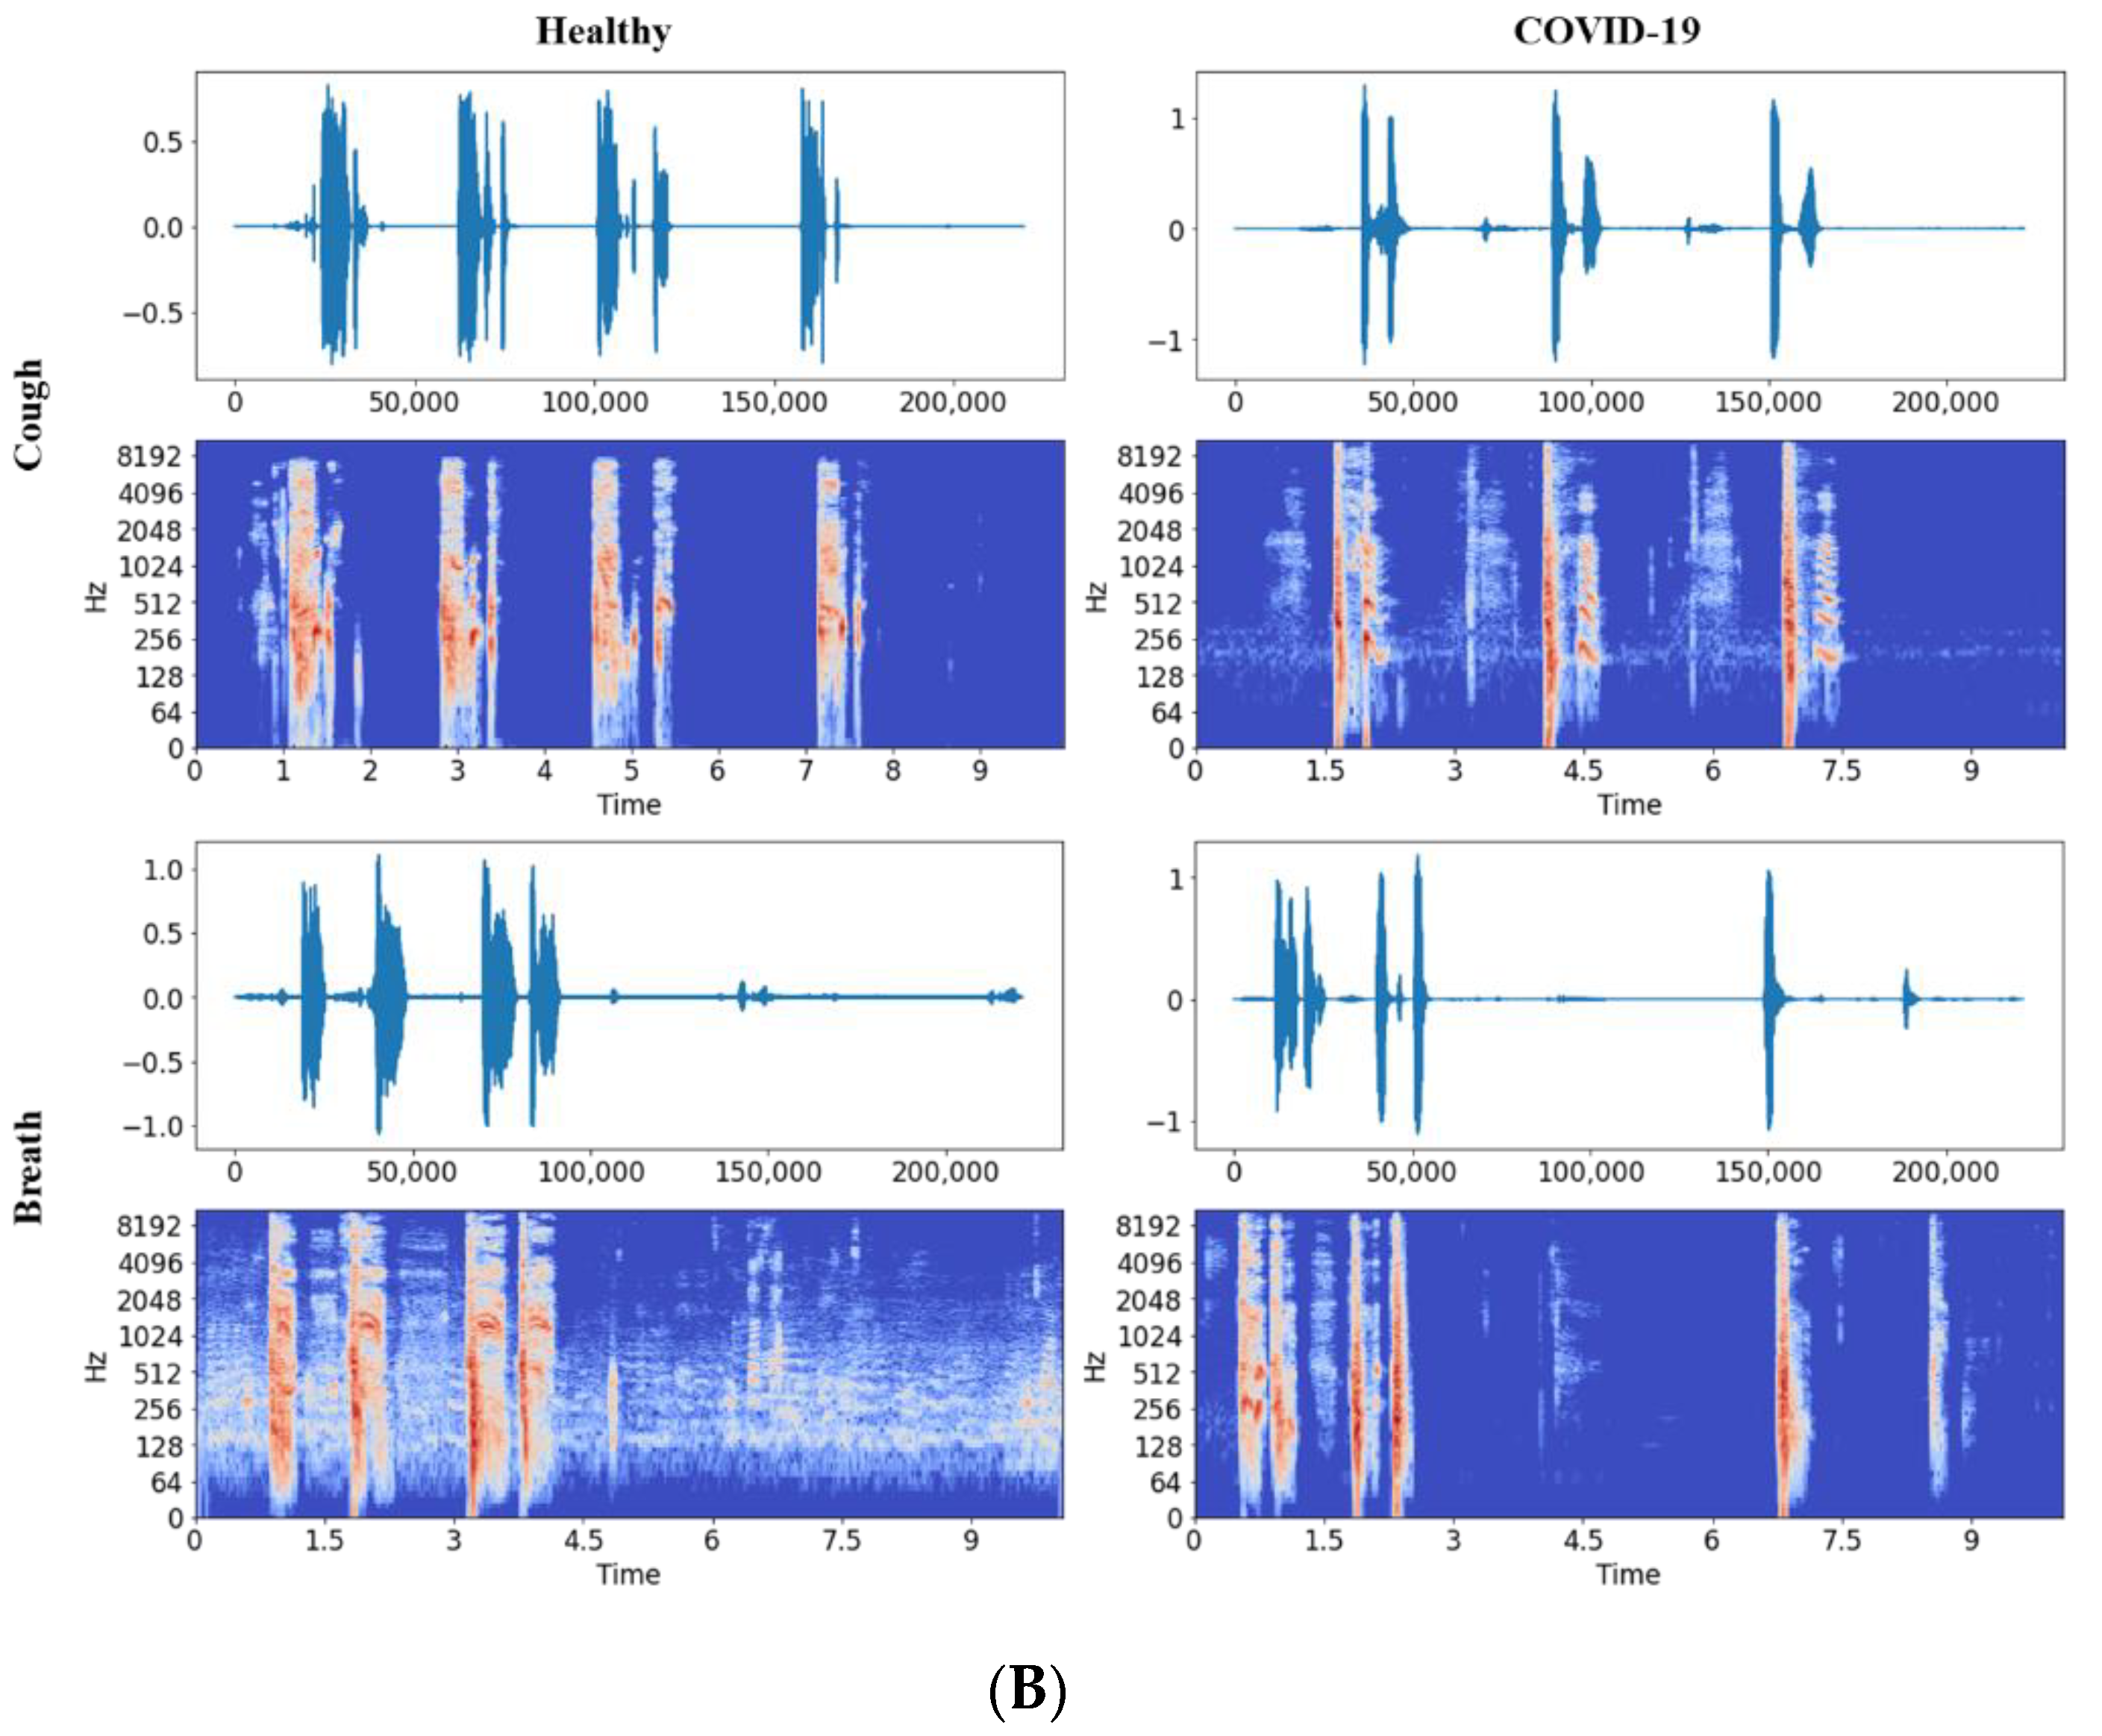
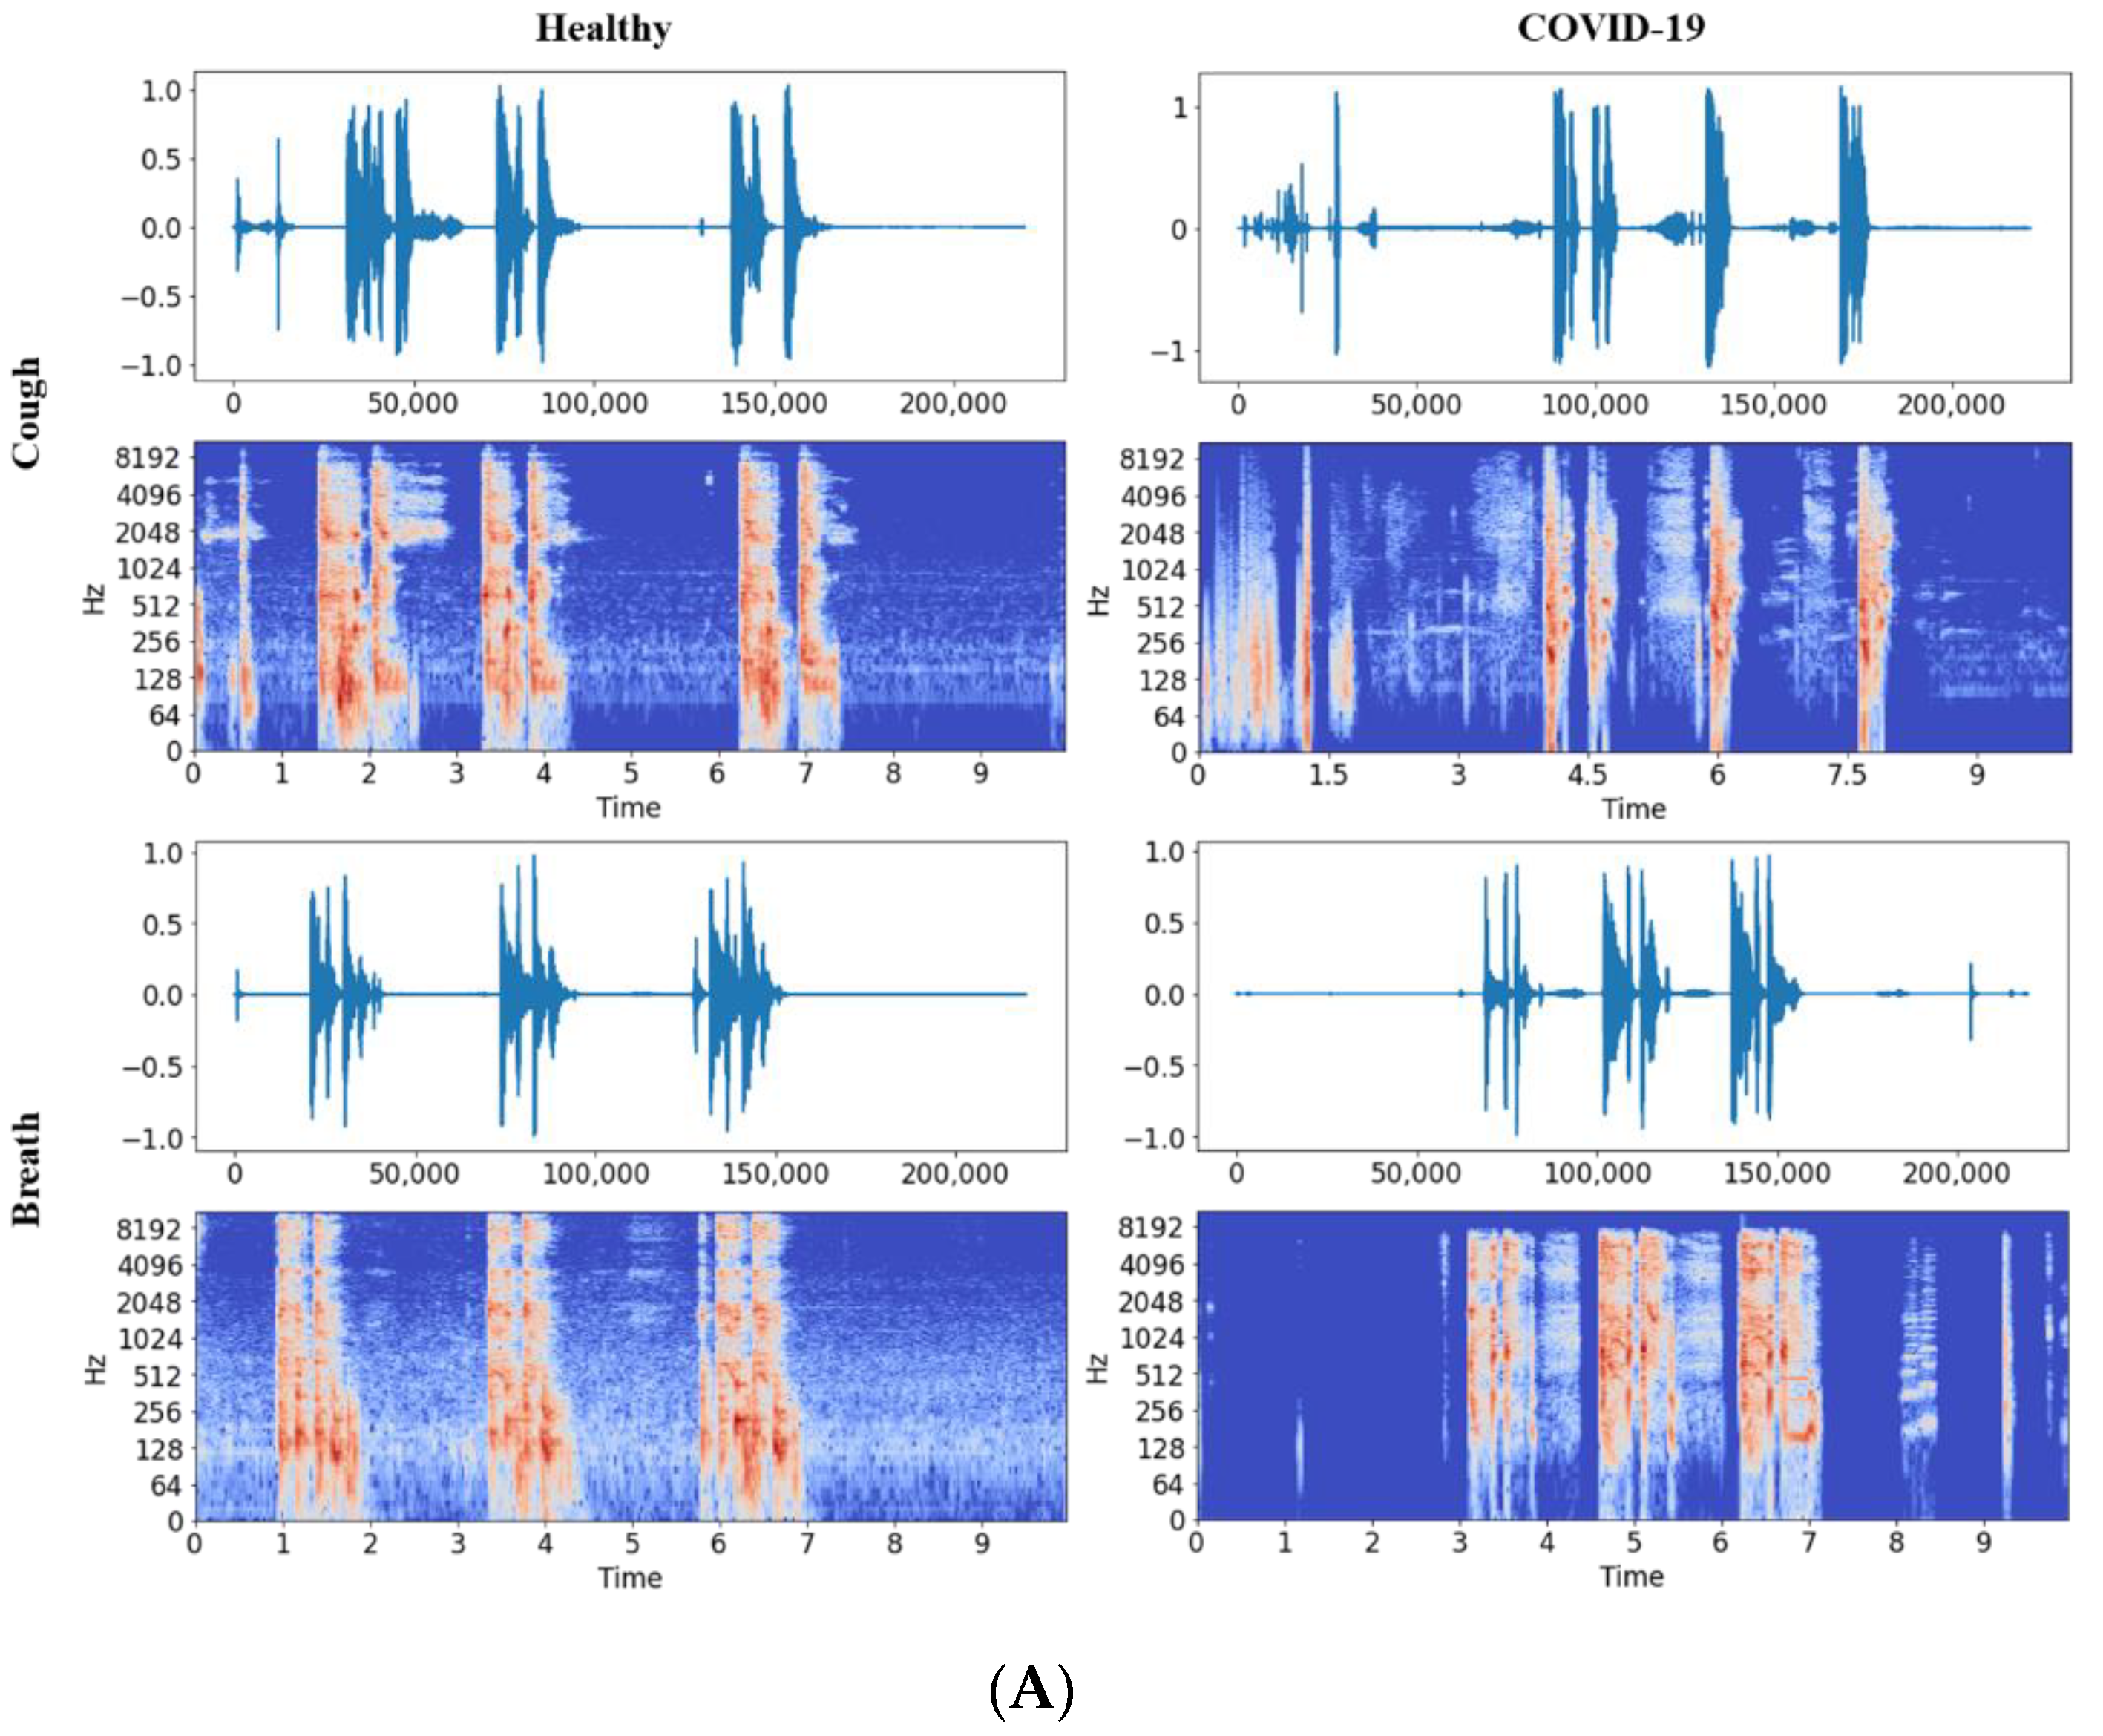
2.2.1. Audio to Spectrogram Conversion
2.2.2. Five-Fold Cross-Validation
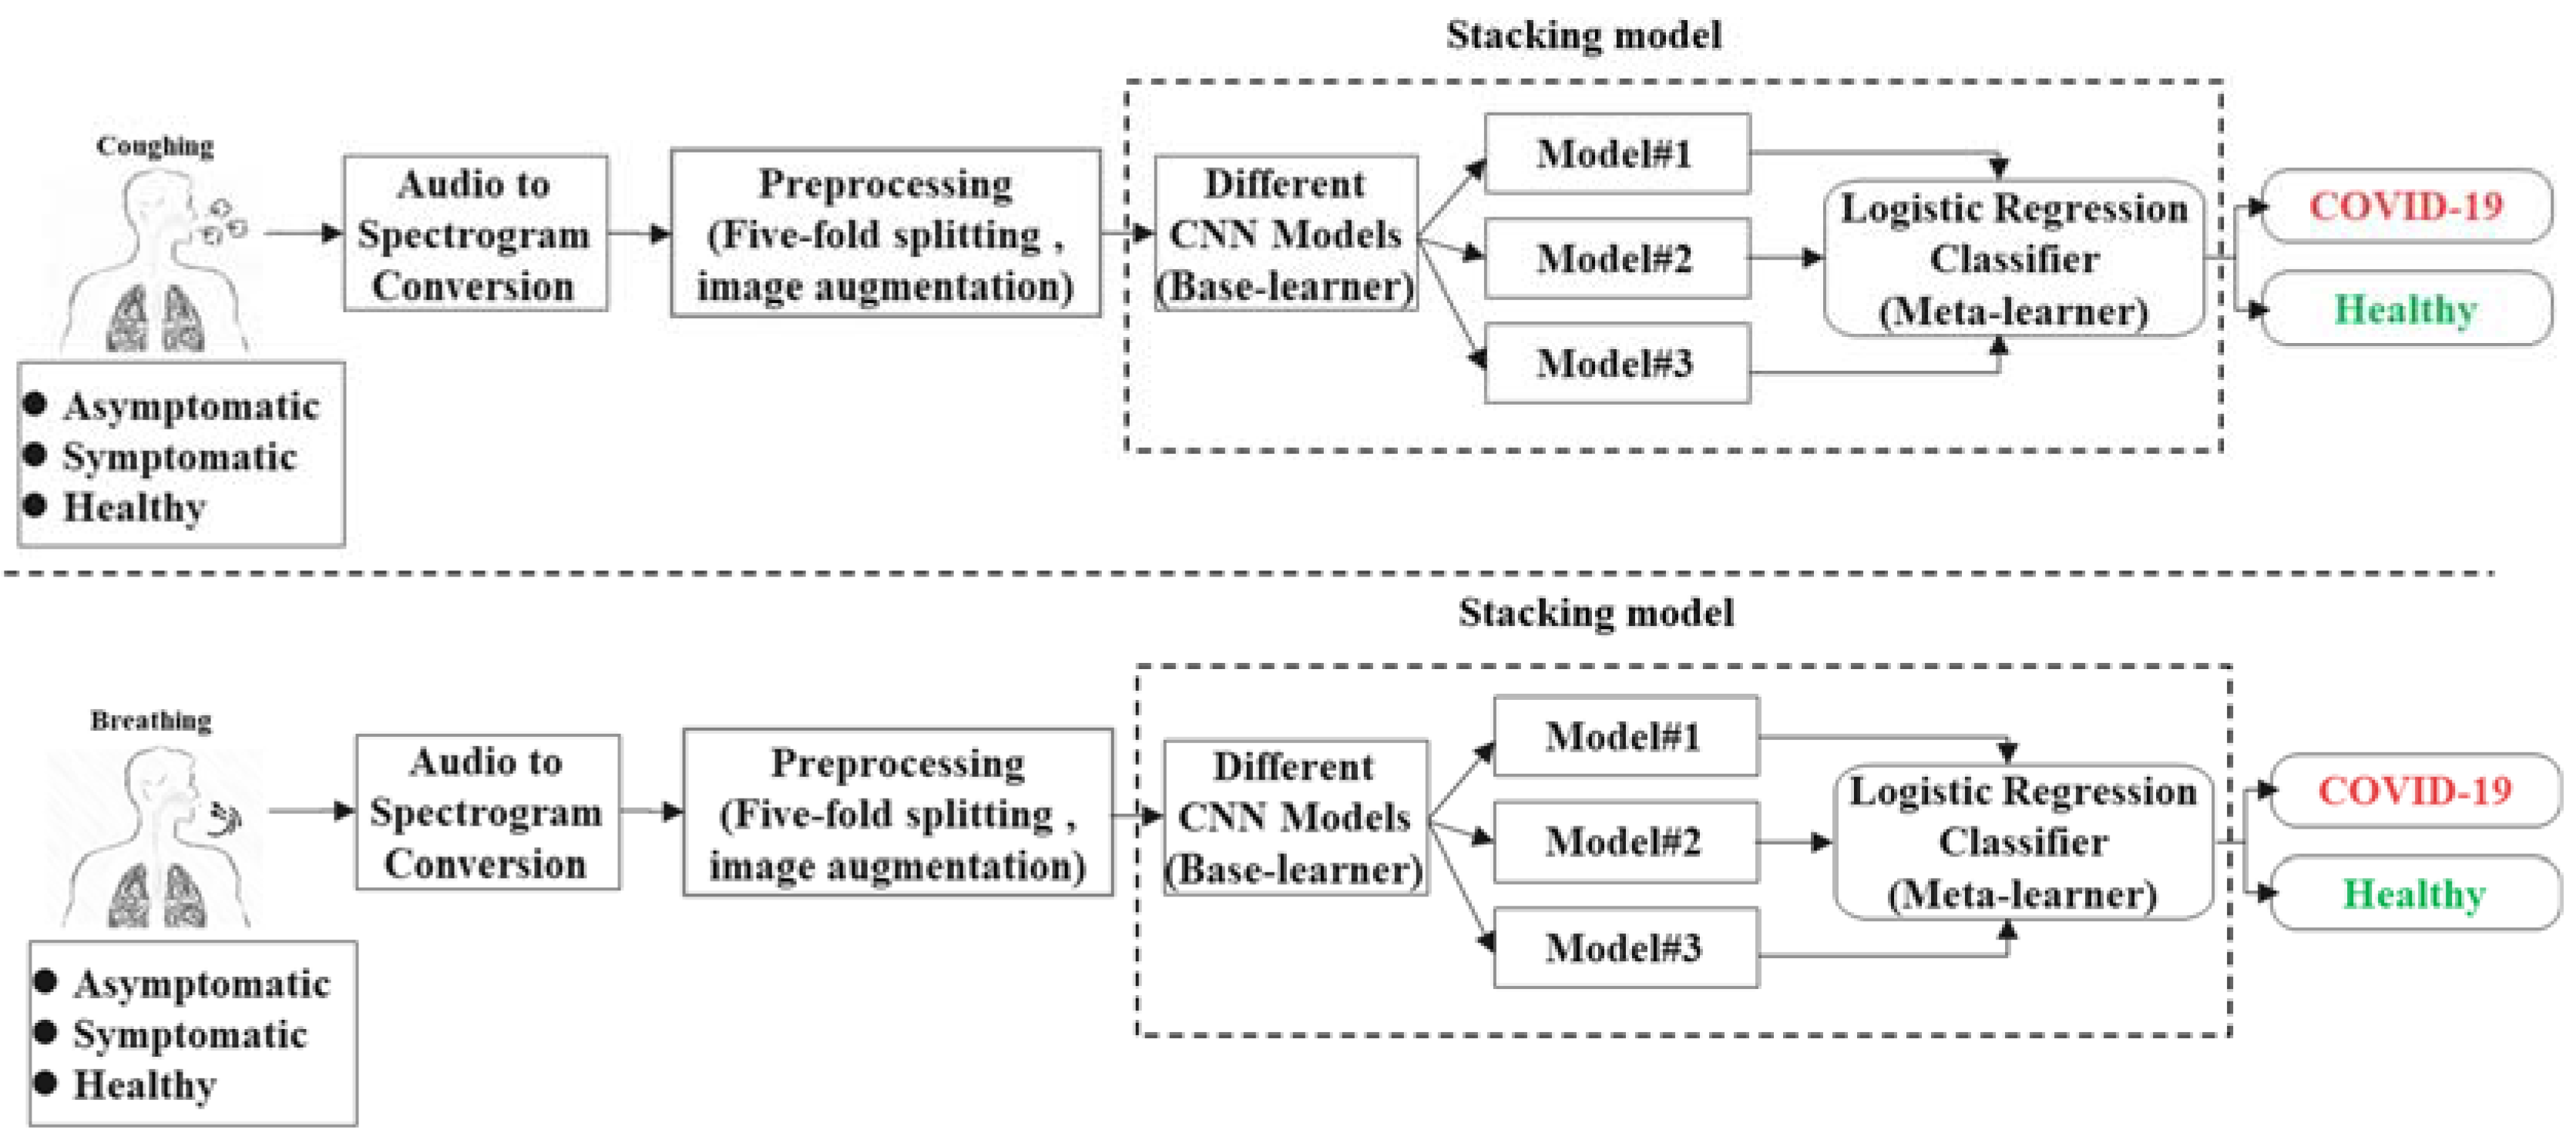
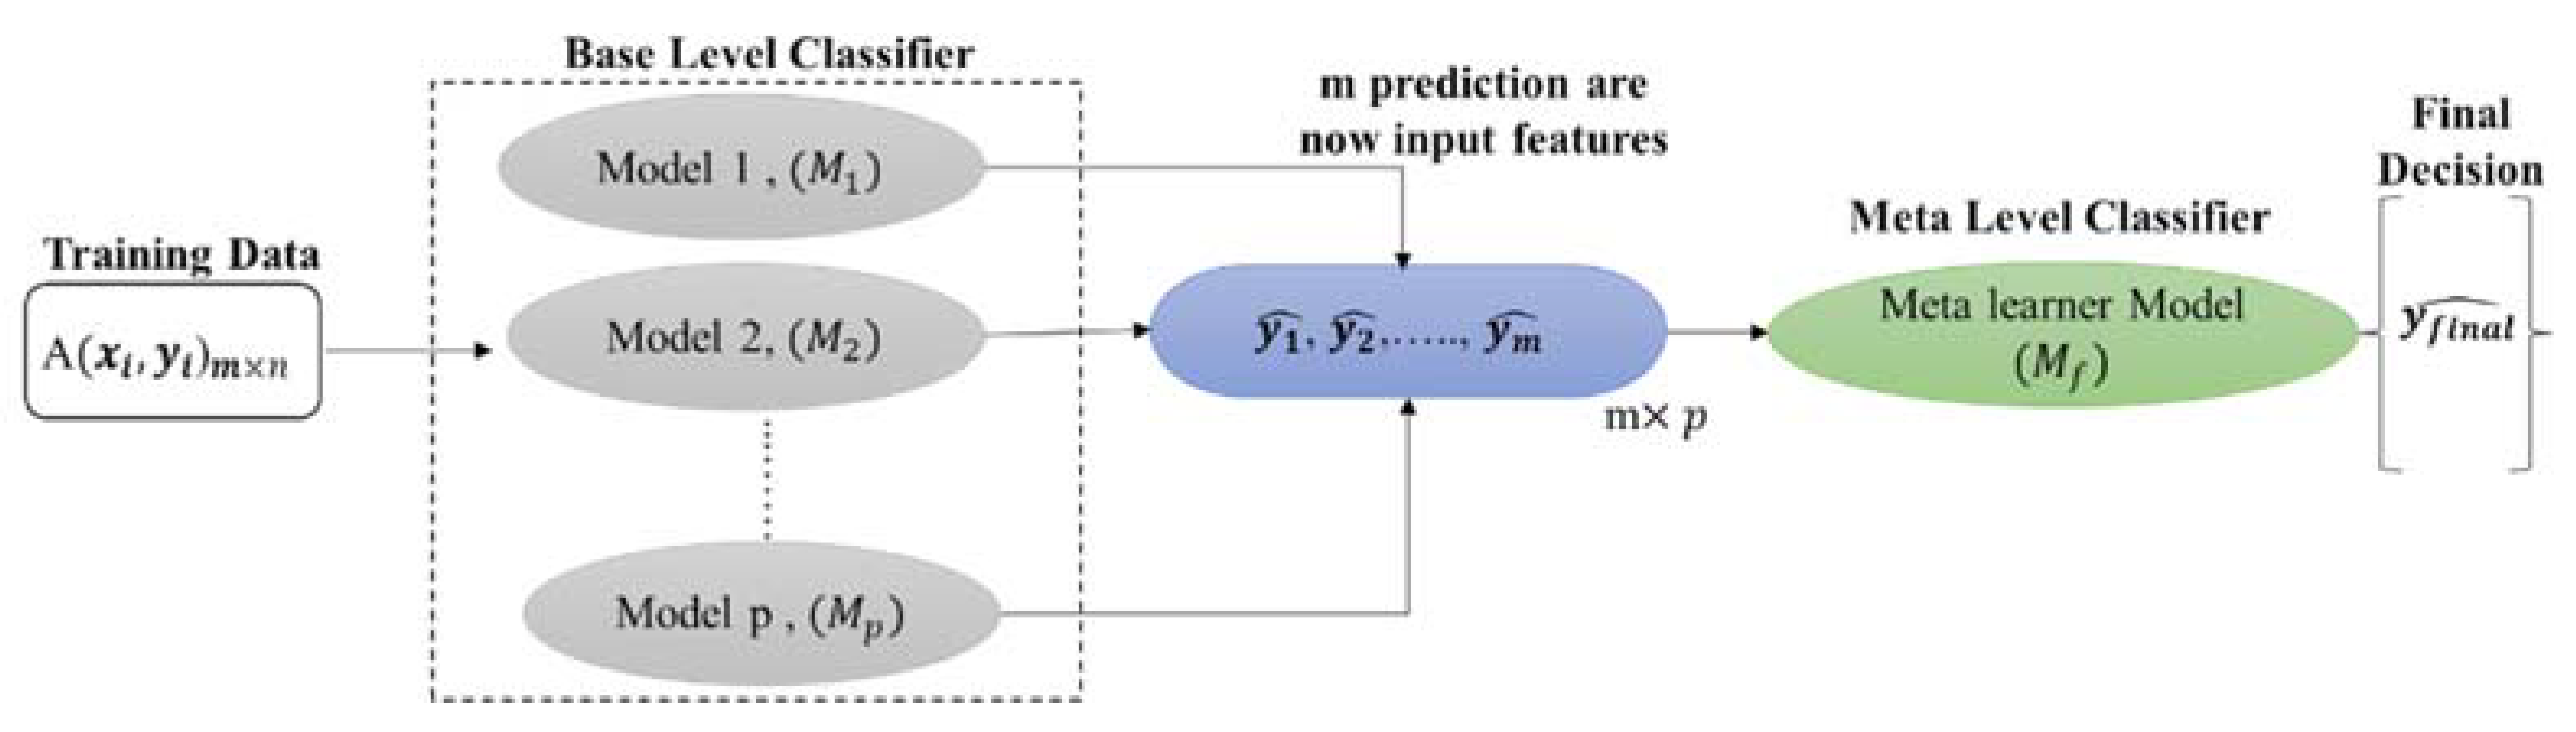
2.3. Stacking Model Development
| Algorithm 1: Stacking classification |
| Input: Output: a stacking classifier H 1: Step 1: learn base-level classifiers 2: for t = 1 to T do 3: based on D 4: end for 5: Step 2: construct new data set of predictions 6: for i =1 to m do 7: 8: end for 9: Step 3: learn a meta-classifier 10: 11: return H |
2.4. Performance Metrics
3. Results and Discussion
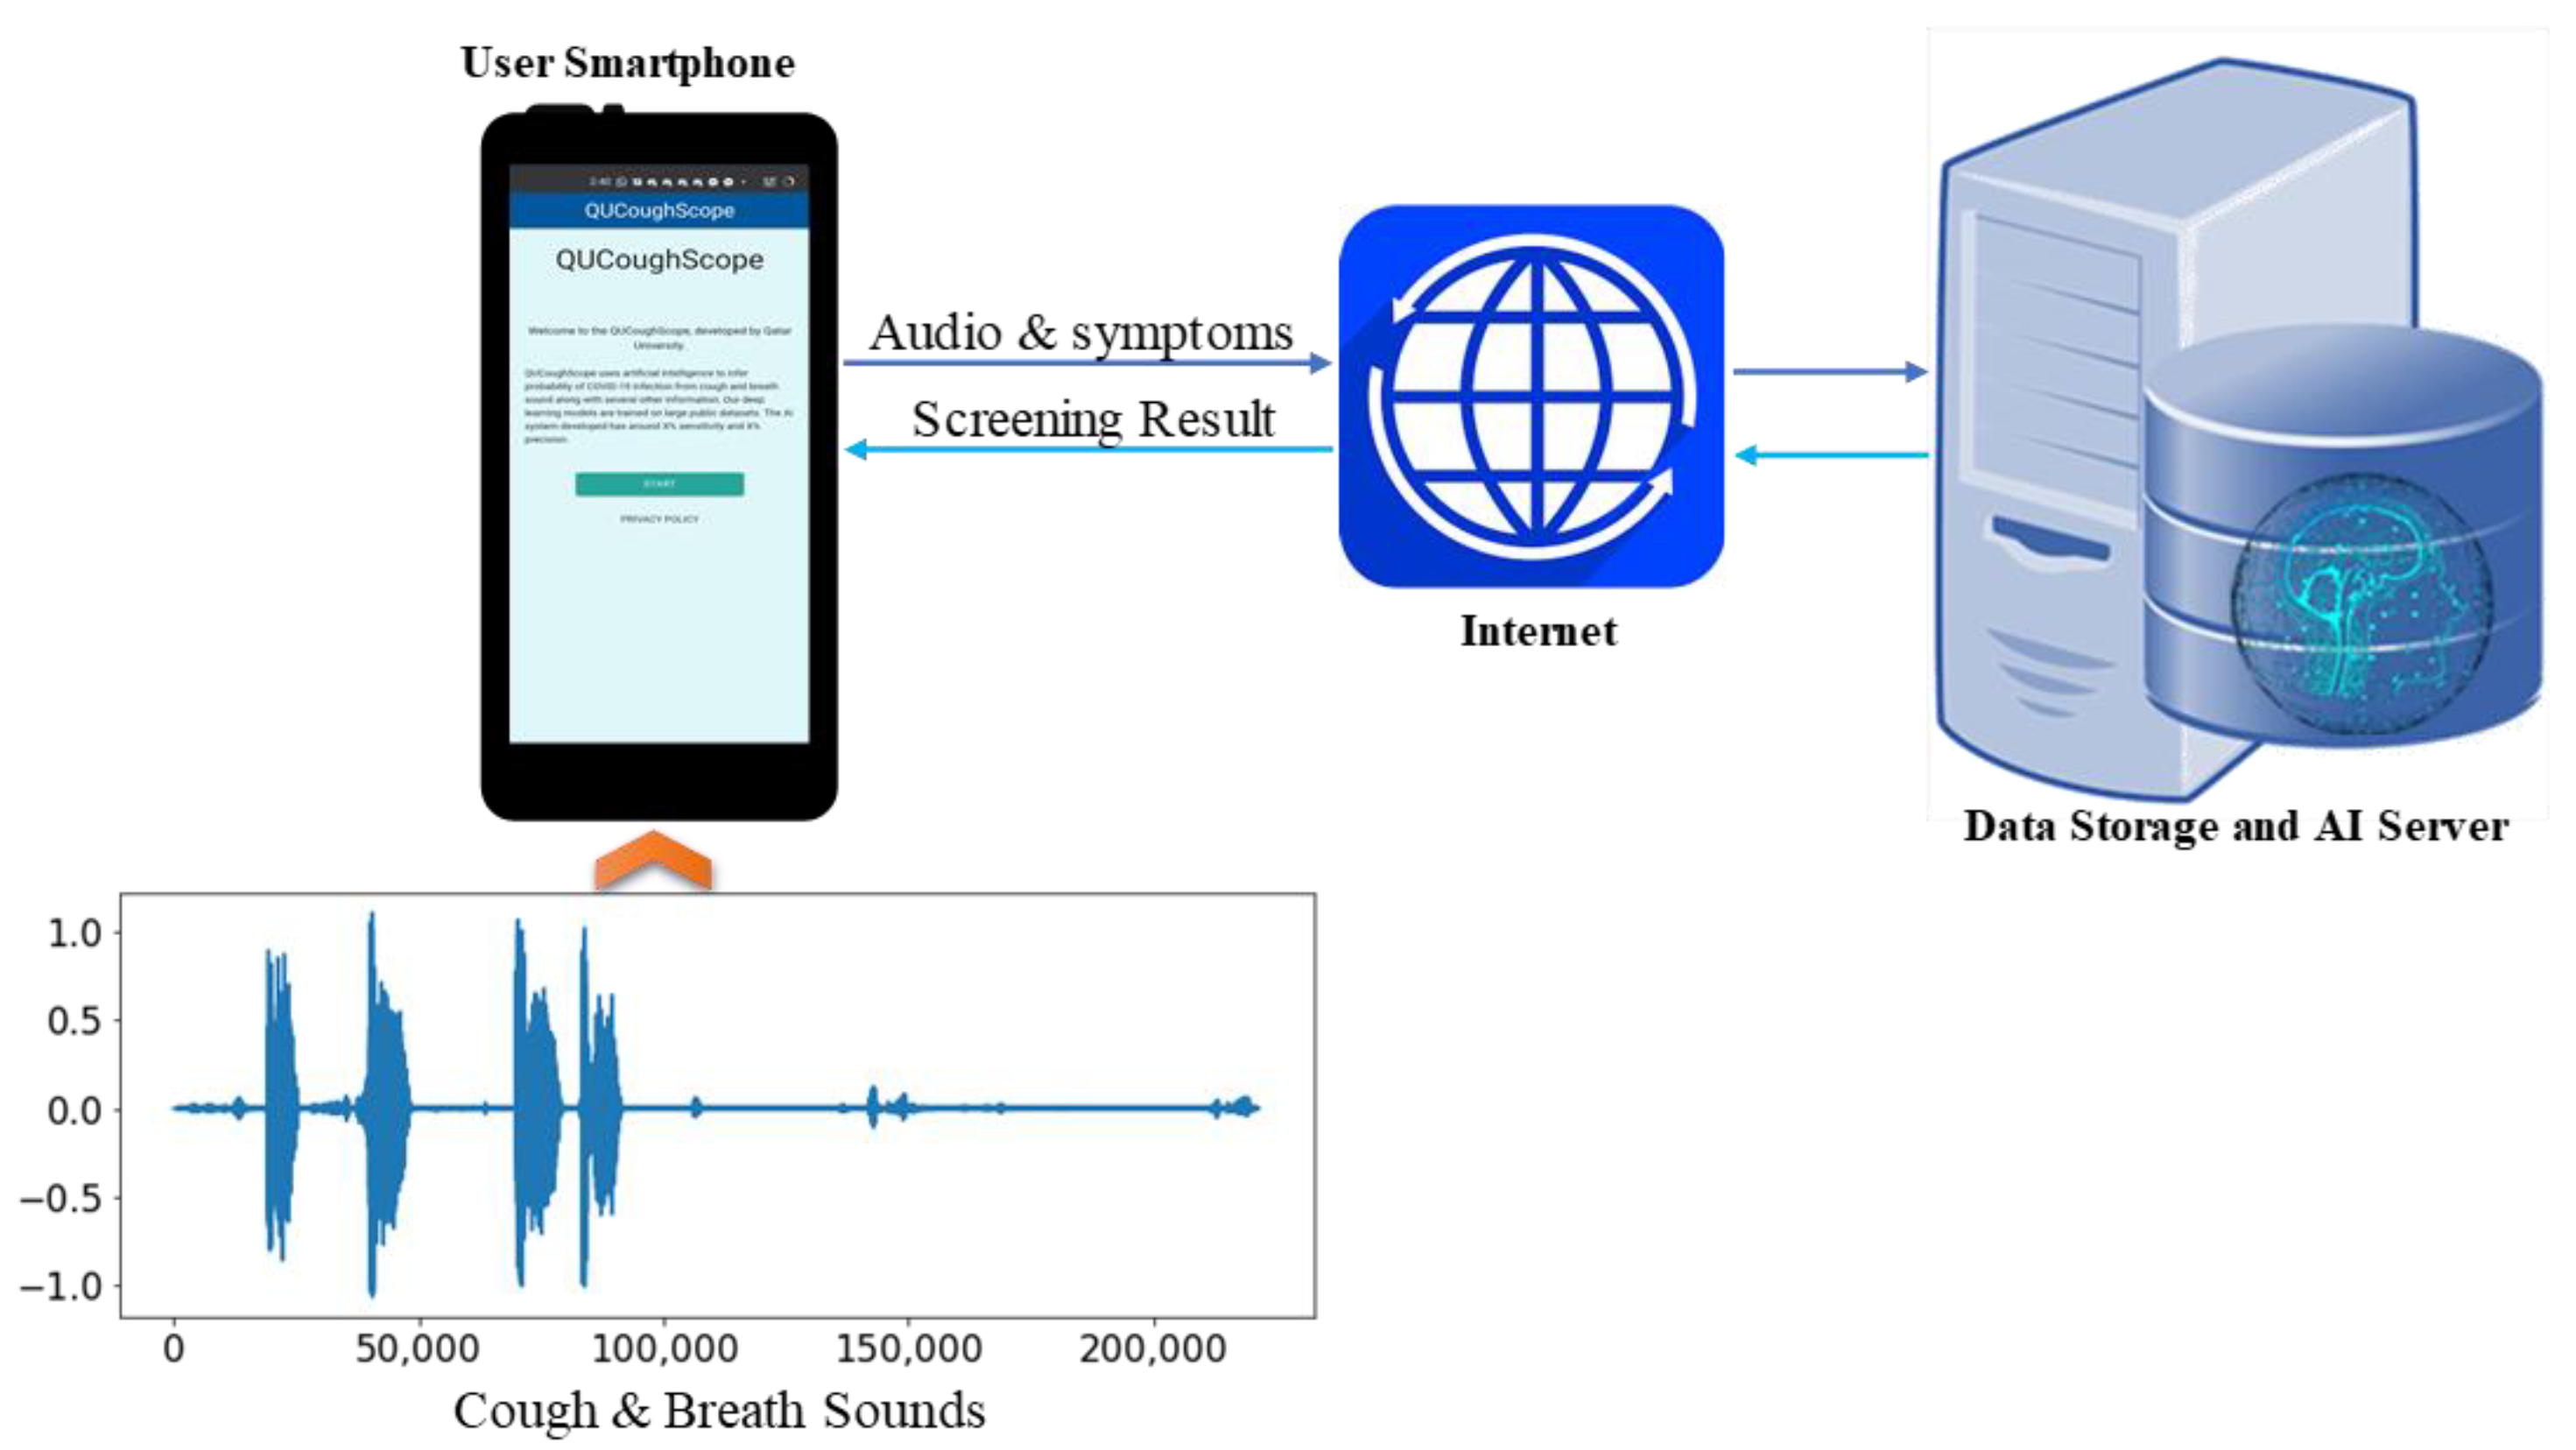
AI-Enabled Application for COVID-19 Detection
4. Conclusions
Author Contributions
Funding
Institutional Review Board Statement
Informed Consent Statement
Data Availability Statement
Acknowledgments
Conflicts of Interest
References
- COVID-19 CORONAVIRUS PANDEMIC. Available online: https://www.worldometers.info/coronavirus/ (accessed on 20 June 2021).
- Pormohammad, A.; Ghorbani, S.; Khatami, A.; Farzi, R.; Baradaran, B.; Turner, D.L.; Turner, R.J.; Bahr, N.C.; Idrovo, J.P. Comparison of confirmed COVID-19 with SARS and MERS cases-Clinical characteristics, laboratory findings, radiographic signs and outcomes: A systematic review and meta-analysis. Rev. Med. Virol. 2020, 30, e21122020. [Google Scholar] [CrossRef] [PubMed]
- Felsenstein, S.; Hedrich, C.M. COVID-19 in children and young people. Lancet Rheumatol. 2020, 2, e514–e516. [Google Scholar] [CrossRef]
- Sattar, N.; Ho, F.K.; Gill, J.M.; Ghouri, N.; Gray, S.R.; Celis-Morales, C.A.; Katikireddi, S.V.; Berry, C.; Pell, J.P.; McMurray, J.J. BMI and future risk for COVID-19 infection and death across sex, age and ethnicity: Preliminary findings from UK biobank. Diabetes Metab. Syndr. Clin. Res. Rev. 2020, 14, 1149–1151. [Google Scholar] [CrossRef] [PubMed]
- Wise, J. COVID-19: UK cases of variant from India rise by 160% in a week. BMJ Br. Med. J. 2021, 373, n1315. [Google Scholar] [CrossRef]
- Jain, V.K.; Iyengar, K.; Vaish, A.; Vaishya, R. Differential mortality in COVID-19 patients from India and western countries. Diabetes Metab. Syndr. Clin. Res. Rev. 2020, 14, 1037–1041. [Google Scholar] [CrossRef]
- Scohy, A.; Anantharajah, A.; Bodéus, M.; Kabamba-Mukadi, B.; Verroken, A.; Rodriguez-Villalobos, H. Low performance of rapid antigen detection test as frontline testing for COVID-19 diagnosis. J. Clin. Virol. 2020, 129, 104455. [Google Scholar] [CrossRef]
- Khandker, S.S.; Nik Hashim, N.H.H.; Deris, Z.Z.; Shueb, R.H.; Islam, M.A. Diagnostic accuracy of rapid antigen test kits for detecting SARS-CoV-2: A systematic review and meta-analysis of 17,171 suspected COVID-19 patients. J. Clin. Med. 2021, 10, 3493. [Google Scholar] [CrossRef]
- Albert, E.; Torres, I.; Bueno, F.; Huntley, D.; Molla, E.; Fernández-Fuentes, M.Á.; Martínez, M.; Poujois, S.; Forqué, L.; Valdivia, A. Field evaluation of a rapid antigen test (Panbio™ COVID-19 Ag Rapid Test Device) for COVID-19 diagnosis in primary healthcare centres. Clin. Microbiol. Infect. 2021, 27, 472.e7–472.e10. [Google Scholar] [CrossRef]
- Chowdhury, M.E.; Khandakar, A.; Qiblawey, Y.; Reaz, M.B.I.; Islam, M.T.; Touati, F. Machine learning in wearable biomedical systems. In Sports Science and Human Health-Different Approaches; IntechOpen: Rijeka, Croatia, 2020. [Google Scholar]
- Chowdhury, M.E.; Rahman, T.; Khandakar, A.; Mazhar, R.; Kadir, M.A.; Mahbub, Z.B.; Islam, K.R.; Khan, M.S.; Iqbal, A.; Al Emadi, N. Can AI help in screening viral and COVID-19 pneumonia? IEEE Access 2020, 8, 132665–132676. [Google Scholar] [CrossRef]
- Rahman, T.; Khandakar, A.; Qiblawey, Y.; Tahir, A.; Kiranyaz, S.; Kashem, S.B.A.; Islam, M.T.; Al Maadeed, S.; Zughaier, S.M.; Khan, M.S. Exploring the effect of image enhancement techniques on COVID-19 detection using chest X-ray images. Comput. Biol. Med. 2021, 132, 104319. [Google Scholar] [CrossRef]
- Tahir, A.; Qiblawey, Y.; Khandakar, A.; Rahman, T.; Khurshid, U.; Musharavati, F.; Islam, M.; Kiranyaz, S.; Chowdhury, M. Deep Learning for Reliable Classification of COVID-19, MERS, and SARS from Chest X-Ray Images. Cogn. Comput. 2022, 1–21. [Google Scholar] [CrossRef] [PubMed]
- Tahir, A.M.; Chowdhury, M.E.; Khandakar, A.; Rahman, T.; Qiblawey, Y.; Khurshid, U.; Kiranyaz, S.; Ibtehaz, N.; Rahman, M.S.; Al-Madeed, S. COVID-19 Infection Localization and Severity Grading from Chest X-ray Images. arXiv 2021, arXiv:2103.07985. [Google Scholar] [CrossRef] [PubMed]
- Qiblawey, Y.; Tahir, A.; Chowdhury, M.E.; Khandakar, A.; Kiranyaz, S.; Rahman, T.; Ibtehaz, N.; Mahmud, S.; Maadeed, S.A.; Musharavati, F. Detection and severity classification of COVID-19 in CT images using deep learning. Diagnostics 2021, 11, 893. [Google Scholar] [CrossRef] [PubMed]
- Zhao, J.; Zhang, Y.; He, X.; Xie, P. COVID-ct-dataset: A ct scan dataset about COVID-19. arXiv 2020, arXiv:2003.13865. [Google Scholar]
- He, X.; Yang, X.; Zhang, S.; Zhao, J.; Zhang, Y.; Xing, E.; Xie, P. Sample-efficient deep learning for COVID-19 diagnosis based on CT scans. medrxiv 2020. [Google Scholar] [CrossRef]
- Rahman, T.; Akinbi, A.; Chowdhury, M.E.; Rashid, T.A.; Şengür, A.; Khandakar, A.; Islam, K.R.; Ismael, A.M. COV-ECGNET: COVID-19 detection using ECG trace images with deep convolutional neural network. Health Inf. Sci. Syst. 2022, 10, 1–16. [Google Scholar] [CrossRef]
- Hasoon, N.; Fadel, A.H.; Hameed, R.S.; Mostafa, S.A.; Khalaf, B.A.; Mohammed, M.A.; Nedoma, J. COVID-19 anomaly detection and classification method based on supervised machine learning of chest X-ray images. Results Phys. 2020, 31, 105045. [Google Scholar] [CrossRef]
- Alyasseri, Z.A.A.; Al-Betar, M.A.; Doush, I.A.; Awadallah, M.A.; Abasi, A.K.; Makhadmeh, S.N.; Alomari, O.A.; Abdulkareem, K.H.; Adam, A.; Damasevicius, R.; et al. Review on COVID-19 diagnosis models based on machine learning and deep learning approaches. Expert Syst. 2021, 39, e12759. [Google Scholar] [CrossRef]
- Al-Waisy, A.; Mohammed, M.A.; Al-Fahdawi, S.; Maashi, M.; Garcia-Zapirain, B.; Abdulkareem, K.H.; Mostafa, S.A.; Le, D.N. COVID-DeepNet: Hybrid multimodal deep learning system for improving COVID-19 pneumonia detection in chest X-ray images. Comput. Mater. Contin. 2021, 67, 2409–2429. [Google Scholar] [CrossRef]
- Abdulkareem, K.H.; Mohammed, M.A.; Salim, A.; Arif, M.; Geman, O.; Gupta, D.; Khanna, A. Realizing an effective COVID-19 diagnosis system based on machine learning and IOT in smart hospital environment. IEEE Internet Things J. 2021, 8, 15919–15928. [Google Scholar] [CrossRef]
- Obaid, O.I.; Mohammed, M.A.; Mostafa, S.A. Long Short-Term Memory Approach for Coronavirus Disease Predicti. J. Inf. Technol. Manag. 2020, 12, 11–21. [Google Scholar]
- Khan, K.N.; Khan, F.A.; Abid, A.; Olmez, T.; Dokur, Z.; Khandakar, A.; Chowdhury, M.E.; Khan, M.S. Deep Learning Based Classification of Unsegmented Phonocardiogram Spectrograms Leveraging Transfer Learning. arXiv 2020, arXiv:2012.08406. [Google Scholar] [CrossRef] [PubMed]
- Chowdhury, M.E.; Khandakar, A.; Alzoubi, K.; Mansoor, S.; Tahir, A.M.; Reaz, M.B.I.; Al-Emadi, N. Real-time smart-digital stethoscope system for heart diseases monitoring. Sensors 2019, 19, 2781. [Google Scholar] [CrossRef] [PubMed] [Green Version]
- Mu, W.; Yin, B.; Huang, X.; Xu, J.; Du, Z. Environmental sound classification using temporal-frequency attention based convolutional neural network. Sci. Rep. 2021, 11, 1–14. [Google Scholar]
- Connolly, J.H.; Edmonds, E.A.; Guzy, J.; Johnson, S.; Woodcock, A. Automatic speech recognition based on spectrogram reading. Int. J. Man-Mach. Stud. 1986, 24, 611–621. [Google Scholar] [CrossRef]
- Arias-Vergara, T.; Klumpp, P.; Vasquez-Correa, J.C.; Noeth, E.; Orozco-Arroyave, J.R.; Schuster, M. Multi-channel spectrograms for speech processing applications using deep learning methods. Pattern Anal. Appl. 2021, 24, 423–431. [Google Scholar] [CrossRef]
- Badshah, A.M.; Ahmad, J.; Rahim, N.; Baik, S.W. Speech emotion recognition from spectrograms with deep convolutional neural network. In Proceedings of the 2017 International Conference on Platform Technology and Service (PlatCon), Busan, Korea, 13–15 February 2017; pp. 1–5. [Google Scholar]
- Deshpande, G.; Schuller, B. An overview on audio, signal, speech, & language processing for COVID-19. arXiv 2020, arXiv:2005.08579. [Google Scholar]
- Nasreddine Belkacem, A.; Ouhbi, S.; Lakas, A.; Benkhelifa, E.; Chen, C. End-to-End AI-Based Point-of-Care Diagnosis System for Classifying Respiratory Illnesses and Early Detection of COVID-19. arXiv 2020, arXiv:2006.15469. [Google Scholar]
- Schuller, B.W.; Schuller, D.M.; Qian, K.; Liu, J.; Zheng, H.; Li, X. COVID-19 and computer audition: An overview on what speech & sound analysis could contribute in the SARS-CoV-2 corona crisis. arXiv 2020, arXiv:2003.11117. [Google Scholar]
- Pramono, R.X.A.; Bowyer, S.; Rodriguez-Villegas, E. Automatic adventitious respiratory sound analysis: A systematic review. PLoS ONE 2017, 12, e01779262017. [Google Scholar]
- Li, S.-H.; Lin, B.-S.; Tsai, C.-H.; Yang, C.-T.; Lin, B.-S. Design of wearable breathing sound monitoring system for real-time wheeze detection. Sensors 2017, 17, 171. [Google Scholar] [CrossRef] [PubMed] [Green Version]
- Oletic, D.; Bilas, V. Energy-efficient respiratory sounds sensing for personal mobile asthma monitoring. IEEE Sens. J. 2016, 16, 8295–8303. [Google Scholar] [CrossRef]
- Brabenec, L.; Mekyska, J.; Galaz, Z.; Rektorova, I. Speech disorders in Parkinson’s disease: Early diagnostics and effects of medication and brain stimulation. J. Neural Transm. 2017, 124, 303–334. [Google Scholar] [CrossRef] [PubMed]
- Erdogdu Sakar, B.; Serbes, G.; Sakar, C.O. Analyzing the effectiveness of vocal features in early telediagnosis of Parkinson’s disease. PLoS ONE 2017, 12, e01824282017. [Google Scholar] [CrossRef] [PubMed] [Green Version]
- Maor, E.; Sara, J.D.; Orbelo, D.M.; Lerman, L.O.; Levanon, Y.; Lerman, A. Voice signal characteristics are independently associated with coronary artery disease. Mayo Clin. Proc. 2018, 93, 840–847. [Google Scholar] [CrossRef]
- Banerjee, D.; Islam, K.; Xue, K.; Mei, G.; Xiao, L.; Zhang, G.; Xu, R.; Lei, C.; Ji, S.; Li, J. A deep transfer learning approach for improved post-traumatic stress disorder diagnosis. Knowl. Inf. Syst. 2019, 60, 1693–1724. [Google Scholar] [CrossRef]
- Faurholt-Jepsen, M.; Busk, J.; Frost, M.; Vinberg, M.; Christensen, E.M.; Winther, O.; Bardram, J.E.; Kessing, L.V. Voice analysis as an objective state marker in bipolar disorder. Transl. Psychiatry 2016, 6, e856. [Google Scholar] [CrossRef] [Green Version]
- hui Huang, Y.; jun Meng, S.; Zhang, Y.; sheng Wu, S.; Zhang, Y.; wei Zhang, Y.; xiang Ye, Y.; feng Wei, Q.; gui Zhao, N.; ping Jiang, J. The respiratory sound features of COVID-19 patients fill gaps between clinical data and screening methods. medRxiv 2020. [Google Scholar] [CrossRef] [Green Version]
- Imran, A.; Posokhova, I.; Qureshi, H.N.; Masood, U.; Riaz, M.S.; Ali, K.; John, C.N.; Hussain, M.I.; Nabeel, M. AI4COVID-19: AI enabled preliminary diagnosis for COVID-19 from cough samples via an app. Inform. Med. Unlocked 2020, 20, 100378. [Google Scholar] [CrossRef]
- Cohen-McFarlane, M.; Goubran, R.; Knoefel, F. Novel coronavirus cough database: NoCoCoDa. IEEE Access 2020, 8, 154087–154094. [Google Scholar] [CrossRef]
- Grant, D.; McLane, I.; West, J. Rapid and scalable COVID-19 screening using speech, breath, and cough recordings. In Proceedings of the 2021 IEEE EMBS International Conference on Biomedical and Health Informatics (BHI), Athens, Greece, 21 September 2021; pp. 1–6. [Google Scholar]
- Mouawad, P.; Dubnov, T.; Dubnov, S. Robust Detection of COVID-19 in Cough Sounds. SN Comput. Sci. 2021, 2, 1–13. [Google Scholar] [CrossRef] [PubMed]
- Erdoğan, Y.E.; Narin, A. COVID-19 detection with traditional and deep features on cough acoustic signals. Comput. Biol. Med. 2021, 136, 104765. [Google Scholar] [CrossRef] [PubMed]
- Pahar, M.; Klopper, M.; Warren, R.; Niesler, T. COVID-19 Cough Classification using Machine Learning and Global Smartphone Recordings. Comput. Biol. Med. 2021, 135, 104572. [Google Scholar] [CrossRef] [PubMed]
- Sharma, N.; Krishnan, P.; Kumar, R.; Ramoji, S.; Chetupalli, S.R.; Ghosh, P.K.; Ganapathy, S. Coswara--A Database of Breathing, Cough, and Voice Sounds for COVID-19 Diagnosis. arXiv 2020, arXiv:2005.10548. [Google Scholar]
- COVID-19 Screening by Cough Sound Analysis. Available online: https://coughtest.online (accessed on 7 August 2021).
- Pal, A.; Sankarasubbu, M. Pay attention to the cough: Early diagnosis of COVID-19 using interpretable symptoms embeddings with cough sound signal processing. In Proceedings of the 36th Annual ACM Symposium on Applied Computing, Virtual, 22–26 March 2021; pp. 620–628. [Google Scholar]
- Bagad, P.; Dalmia, A.; Doshi, J.; Nagrani, A.; Bhamare, P.; Mahale, A.; Rane, S.; Agarwal, N.; Panicker, R. Cough against COVID: Evidence of COVID-19 signature in cough sounds. arXiv 2020, arXiv:2009.08790. [Google Scholar]
- Laguarta, J.; Hueto, F.; Subirana, B. COVID-19 artificial intelligence diagnosis using only cough recordings. IEEE Open J. Eng. Med. Biol. 2020, 1, 275–281. [Google Scholar] [CrossRef] [PubMed]
- Belkacem, A.N.; Ouhbi, S.; Lakas, A.; Benkhelifa, E.; Chen, C. End-to-End AI-Based Point-of-Care Diagnosis System for Classifying Respiratory Illnesses and Early Detection of COVID-19: A Theoretical Framework. Front. Med. 2021, 8, 372. [Google Scholar] [CrossRef]
- Rahman, M.A.; Hossain, M.S.; Alrajeh, N.A.; Gupta, B. A multimodal, multimedia point-of-care deep learning framework for COVID-19 diagnosis. ACM Trans. Multimid. Comput. Commun. Appl. 2021, 17, 1–24. [Google Scholar] [CrossRef]
- Brown, C.; Chauhan, J.; Grammenos, A.; Han, J.; Hasthanasombat, A.; Spathis, D.; Xia, T.; Cicuta, P.; Mascolo, C. Exploring automatic diagnosis of COVID-19 from crowdsourced respiratory sound data. In Proceedings of the 26th ACM SIGKDD International Conference on Knowledge Discovery & Data Mining, Virtual, 23–27 August 2021; pp. 3474–3484. [Google Scholar]
- Coppock, H.; Gaskell, A.; Tzirakis, P.; Baird, A.; Jones, L.; Schuller, B. End-to-end convolutional neural network enables COVID-19 detection from breath and cough audio: A pilot study. BMJ Innov. 2021, 7, 356–362. [Google Scholar] [CrossRef]
- Kumar, L.K.; Alphonse, P. Automatic Diagnosis of COVID-19 Disease using Deep Convolutional Neural Network with Multi-Feature Channel from Respiratory Sound Data: Cough, Voice, and Breath. Alex. Eng. J. 2021, 61, 1319–1334. [Google Scholar]
- Orlandic, L.; Teijeiro, T.; Atienza, D. The COUGHVID crowdsourcing dataset, a corpus for the study of large-scale cough analysis algorithms. Sci. Data 2021, 8, 1–10. [Google Scholar] [CrossRef] [PubMed]
- Available online: https://www.kaggle.com/tawsifurrahman/qucoughscope-covid19-cough-dataset (accessed on 1 January 2022).
- Rahman, T.; Khandakar, A.; Kadir, M.A.; Islam, K.R.; Islam, K.F.; Mazhar, R.; Hamid, T.; Islam, M.T.; Kashem, S.; Mahbub, Z.B. Reliable tuberculosis detection using chest X-ray with deep learning, segmentation and visualization. IEEE Access 2020, 8, 191586–191601. [Google Scholar] [CrossRef]
- Tahir, A.; Qiblawey, Y.; Khandakar, A.; Rahman, T.; Khurshid, U.; Musharavati, F.; Islam, M.; Kiranyaz, S.; Chowdhury, M.E. Coronavirus: Comparing COVID-19, SARS and MERS in the eyes of AI. arXiv 2020, arXiv:2005.11524. [Google Scholar]
- Rahman, T.; Chowdhury, M.E.; Khandakar, A.; Islam, K.R.; Islam, K.F.; Mahbub, Z.B.; Kadir, M.A.; Kashem, S. Transfer learning with deep convolutional neural network (CNN) for pneumonia detection using chest X-ray. Appl. Sci. 2020, 10, 3233. [Google Scholar] [CrossRef]
- Chowdhury, M.E.; Rahman, T.; Khandakar, A.; Al-Madeed, S.; Zughaier, S.M.; Doi, S.A.; Hassen, H.; Islam, M.T. An early warning tool for predicting mortality risk of COVID-19 patients using machine learning. Cogn. Comput. 2021, 1–16. [Google Scholar] [CrossRef]
- Overfitting in Machine Learning: What It Is and How to Prevent It. Available online: https://elitedatascience.com/overfitting-in-machine-learning (accessed on 7 July 2020).
- ResNet, AlexNet, VGGNet, Inception: Understanding Various Architectures of Convolutional Networks. Available online: https://cv-tricks.com/cnn/understand-resnet-alexnet-vgg-inception/ (accessed on 23 December 2020).
- DenseNet: Better CNN Model than ResNet. Available online: http://www.programmersought.com/article/7780717554/ (accessed on 29 December 2020).
- Sandler, M.; Howard, A.; Zhu, M.; Zhmoginov, A.; Chen, L.-C. Mobilenetv2: Inverted residuals and linear bottlenecks. In Proceedings of the IEEE Conference on Computer Vision and Pattern Recognition, Salt Lake City, UT, USA, 18–23 June 2018; pp. 4510–4520. [Google Scholar]
- Tan, M.; Le, Q. Efficientnet: Rethinking model scaling for convolutional neural networks. In Proceedings of the International Conference on Machine Learning, Long Beach, CA, USA, 9–15 June 2019; pp. 6105–6114. [Google Scholar]
- Khandakar, A.; Chowdhury, M.E.; Reaz, M.B.I.; Ali, S.H.M.; Hasan, M.A.; Kiranyaz, S.; Rahman, T.; Alfkey, R.; Bakar, A.A.A.; Malik, R.A. A machine learning model for early detection of diabetic foot using thermogram images. Comput. Biol. Med. 2021, 137, 104838. [Google Scholar] [CrossRef]
- QUCoughScope. Available online: https://nibtehaz.github.io/qu-cough-scope/ (accessed on 7 June 2021).
- Despotovic, V.; Ismael, M.; Cornil, M.; Mc Call, R.; Fagherazzi, G. Detection of COVID-19 from voice, cough and breathing patterns: Dataset and preliminary results. Comput. Biol. Med. 2021, 138, 104944. [Google Scholar] [CrossRef]
- Islam, R.; Abdel-Raheem, E.; Tarique, M. A study of using cough sounds and deep neural networks for the early detection of COVID-19. Biomed. Eng. Adv. 2022, 3, 100025. [Google Scholar] [CrossRef]


| Experiments | Healthy | COVID-19 | ||
|---|---|---|---|---|
| Cambridge | QU | Cambridge | QU | |
| Symptomatic (Cough/Breath) | 264 | 32 | 54 | 18 |
| Asymptomatic (Cough/Breath) | 318 | 213 | 87 | 78 |
| Total | 582 | 245 | 141 | 96 |
| Pipelines | COVID-19 | Healthy |
|---|---|---|
| Pipeline I (Symptomatic) |
|
|
| Pipeline II (Asymptomatic) |
|
|
| Categories | Classes | Total Samples | Training Samples | Validation Samples | Test Samples |
|---|---|---|---|---|---|
| Symptomatic (Cough/Breath) | Healthy | 296 | 213 × 10 = 2130 | 24 | 59 |
| COVID-19 | 72 | 52 × 38 = 1976 | 6 | 14 | |
| Asymptomatic (Cough/Breath) | Healthy | 531 | 383 × 5 = 1915 | 42 | 106 |
| COVID-19 | 165 | 119 × 17 = 2023 | 13 | 33 |
| Training Parameters for Classification | ||||||
|---|---|---|---|---|---|---|
| Batch Size | Learning Rate | Number of Epochs | Epoch Patience | Stopping Criteria | Optimizer | |
| Parameters | 32 | 0.001 | 30 | 15 | 15 | ADAM |
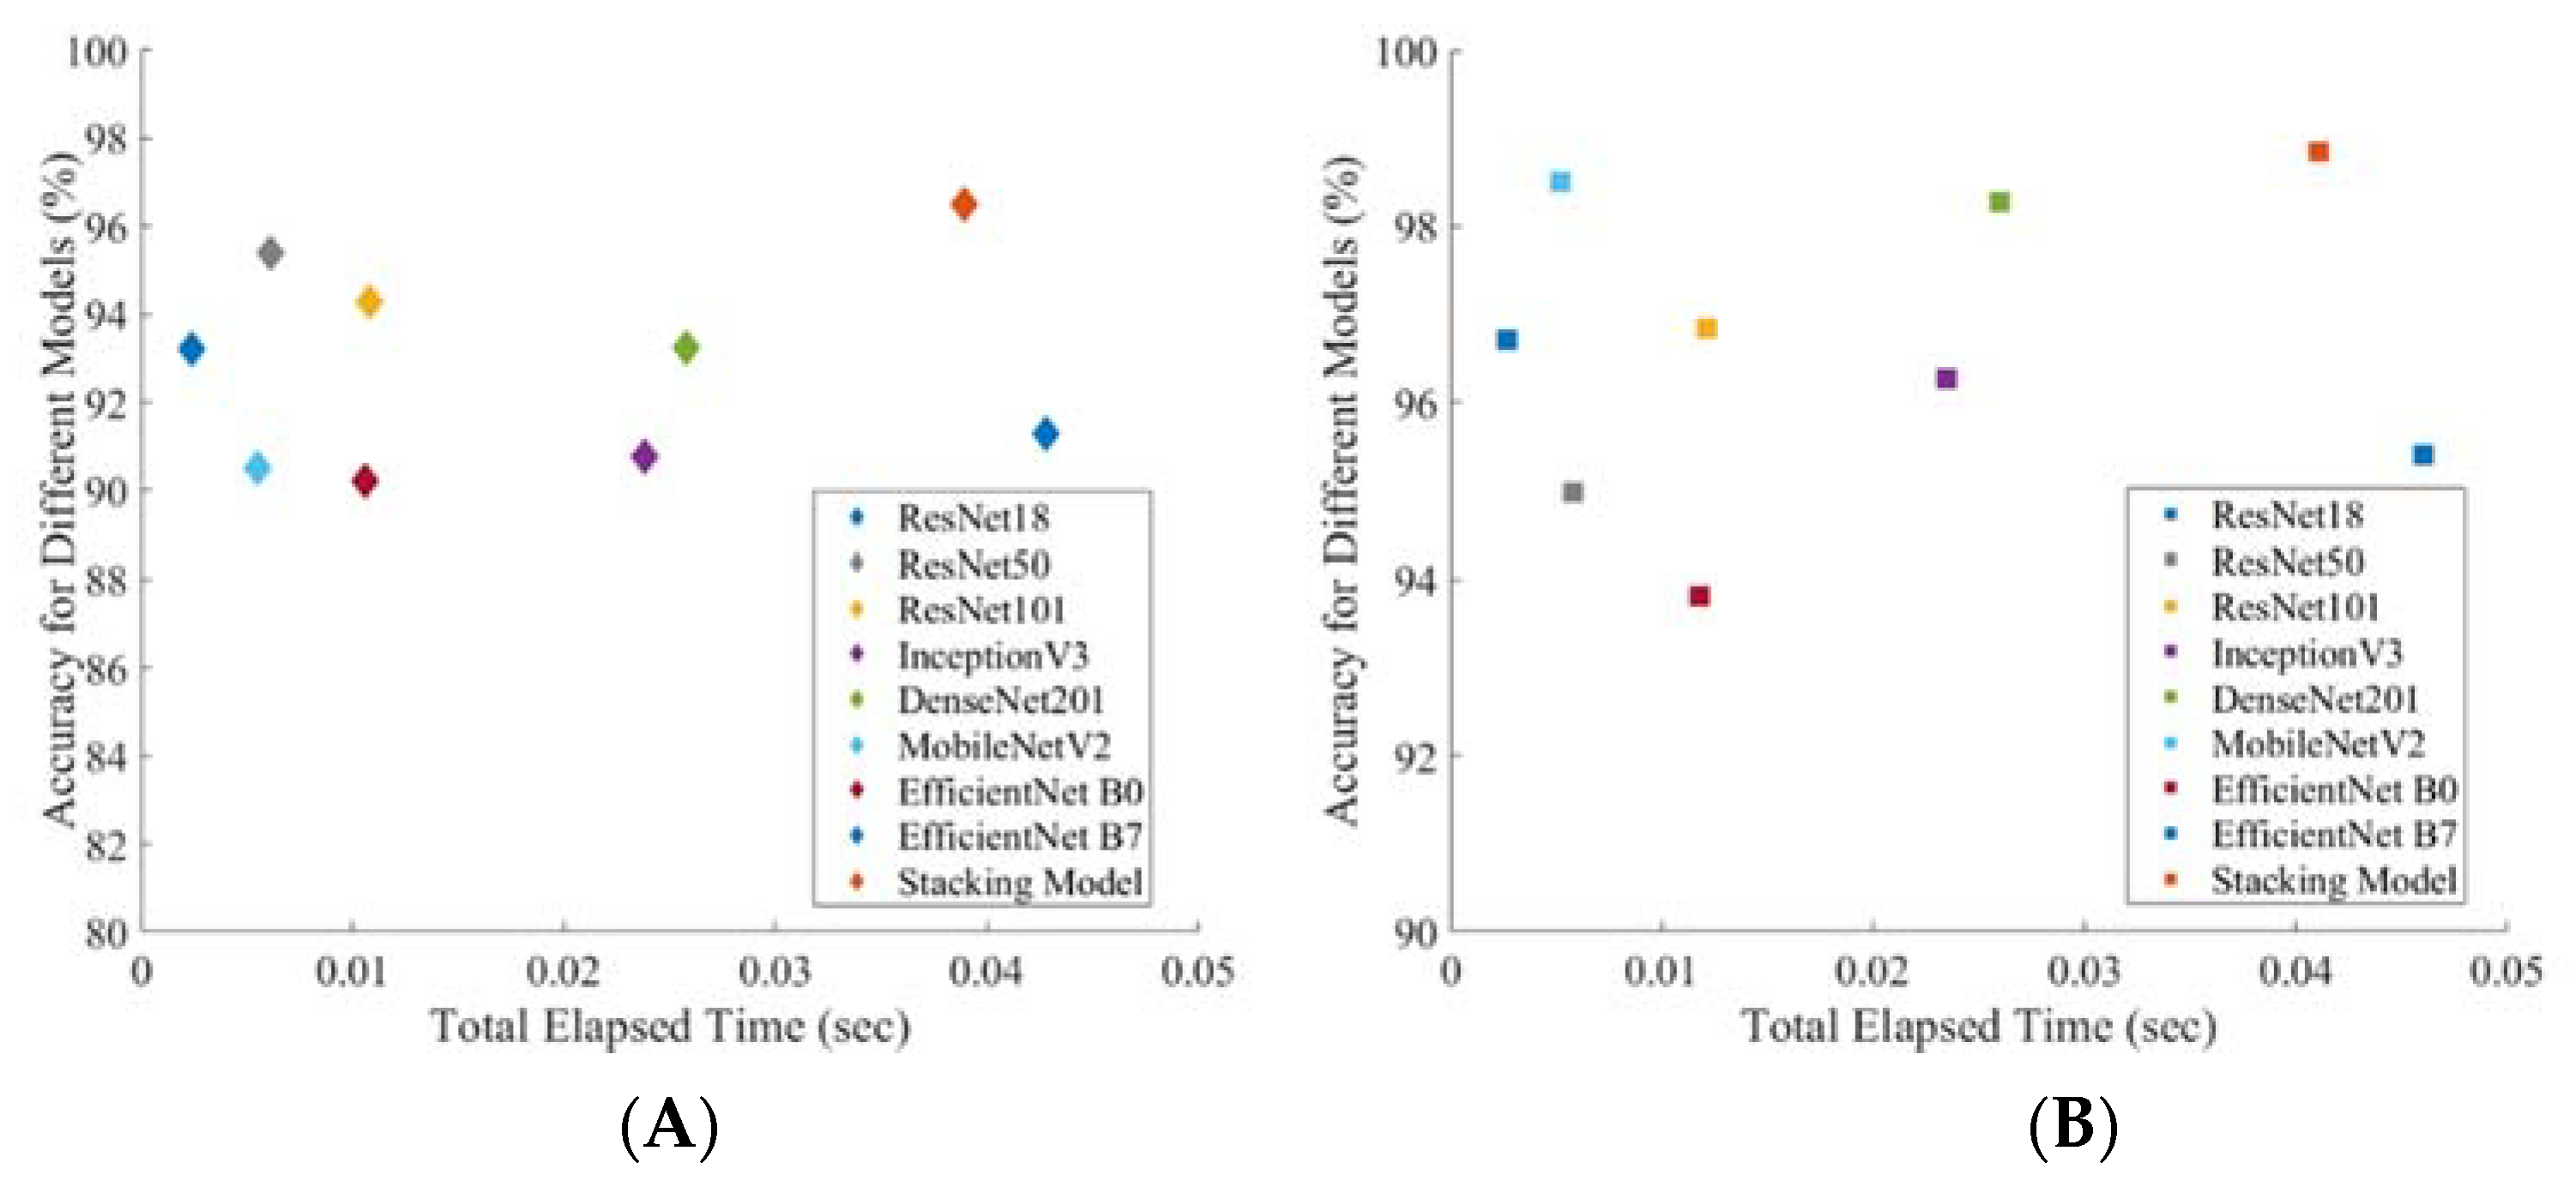
| (A) | |||||||
| Scheme | Network | Overall | Weighted 95% CI | Inference Time (Sec) | |||
| Accuracy | Precision | Sensitivity | F1-Score | Specificity | |||
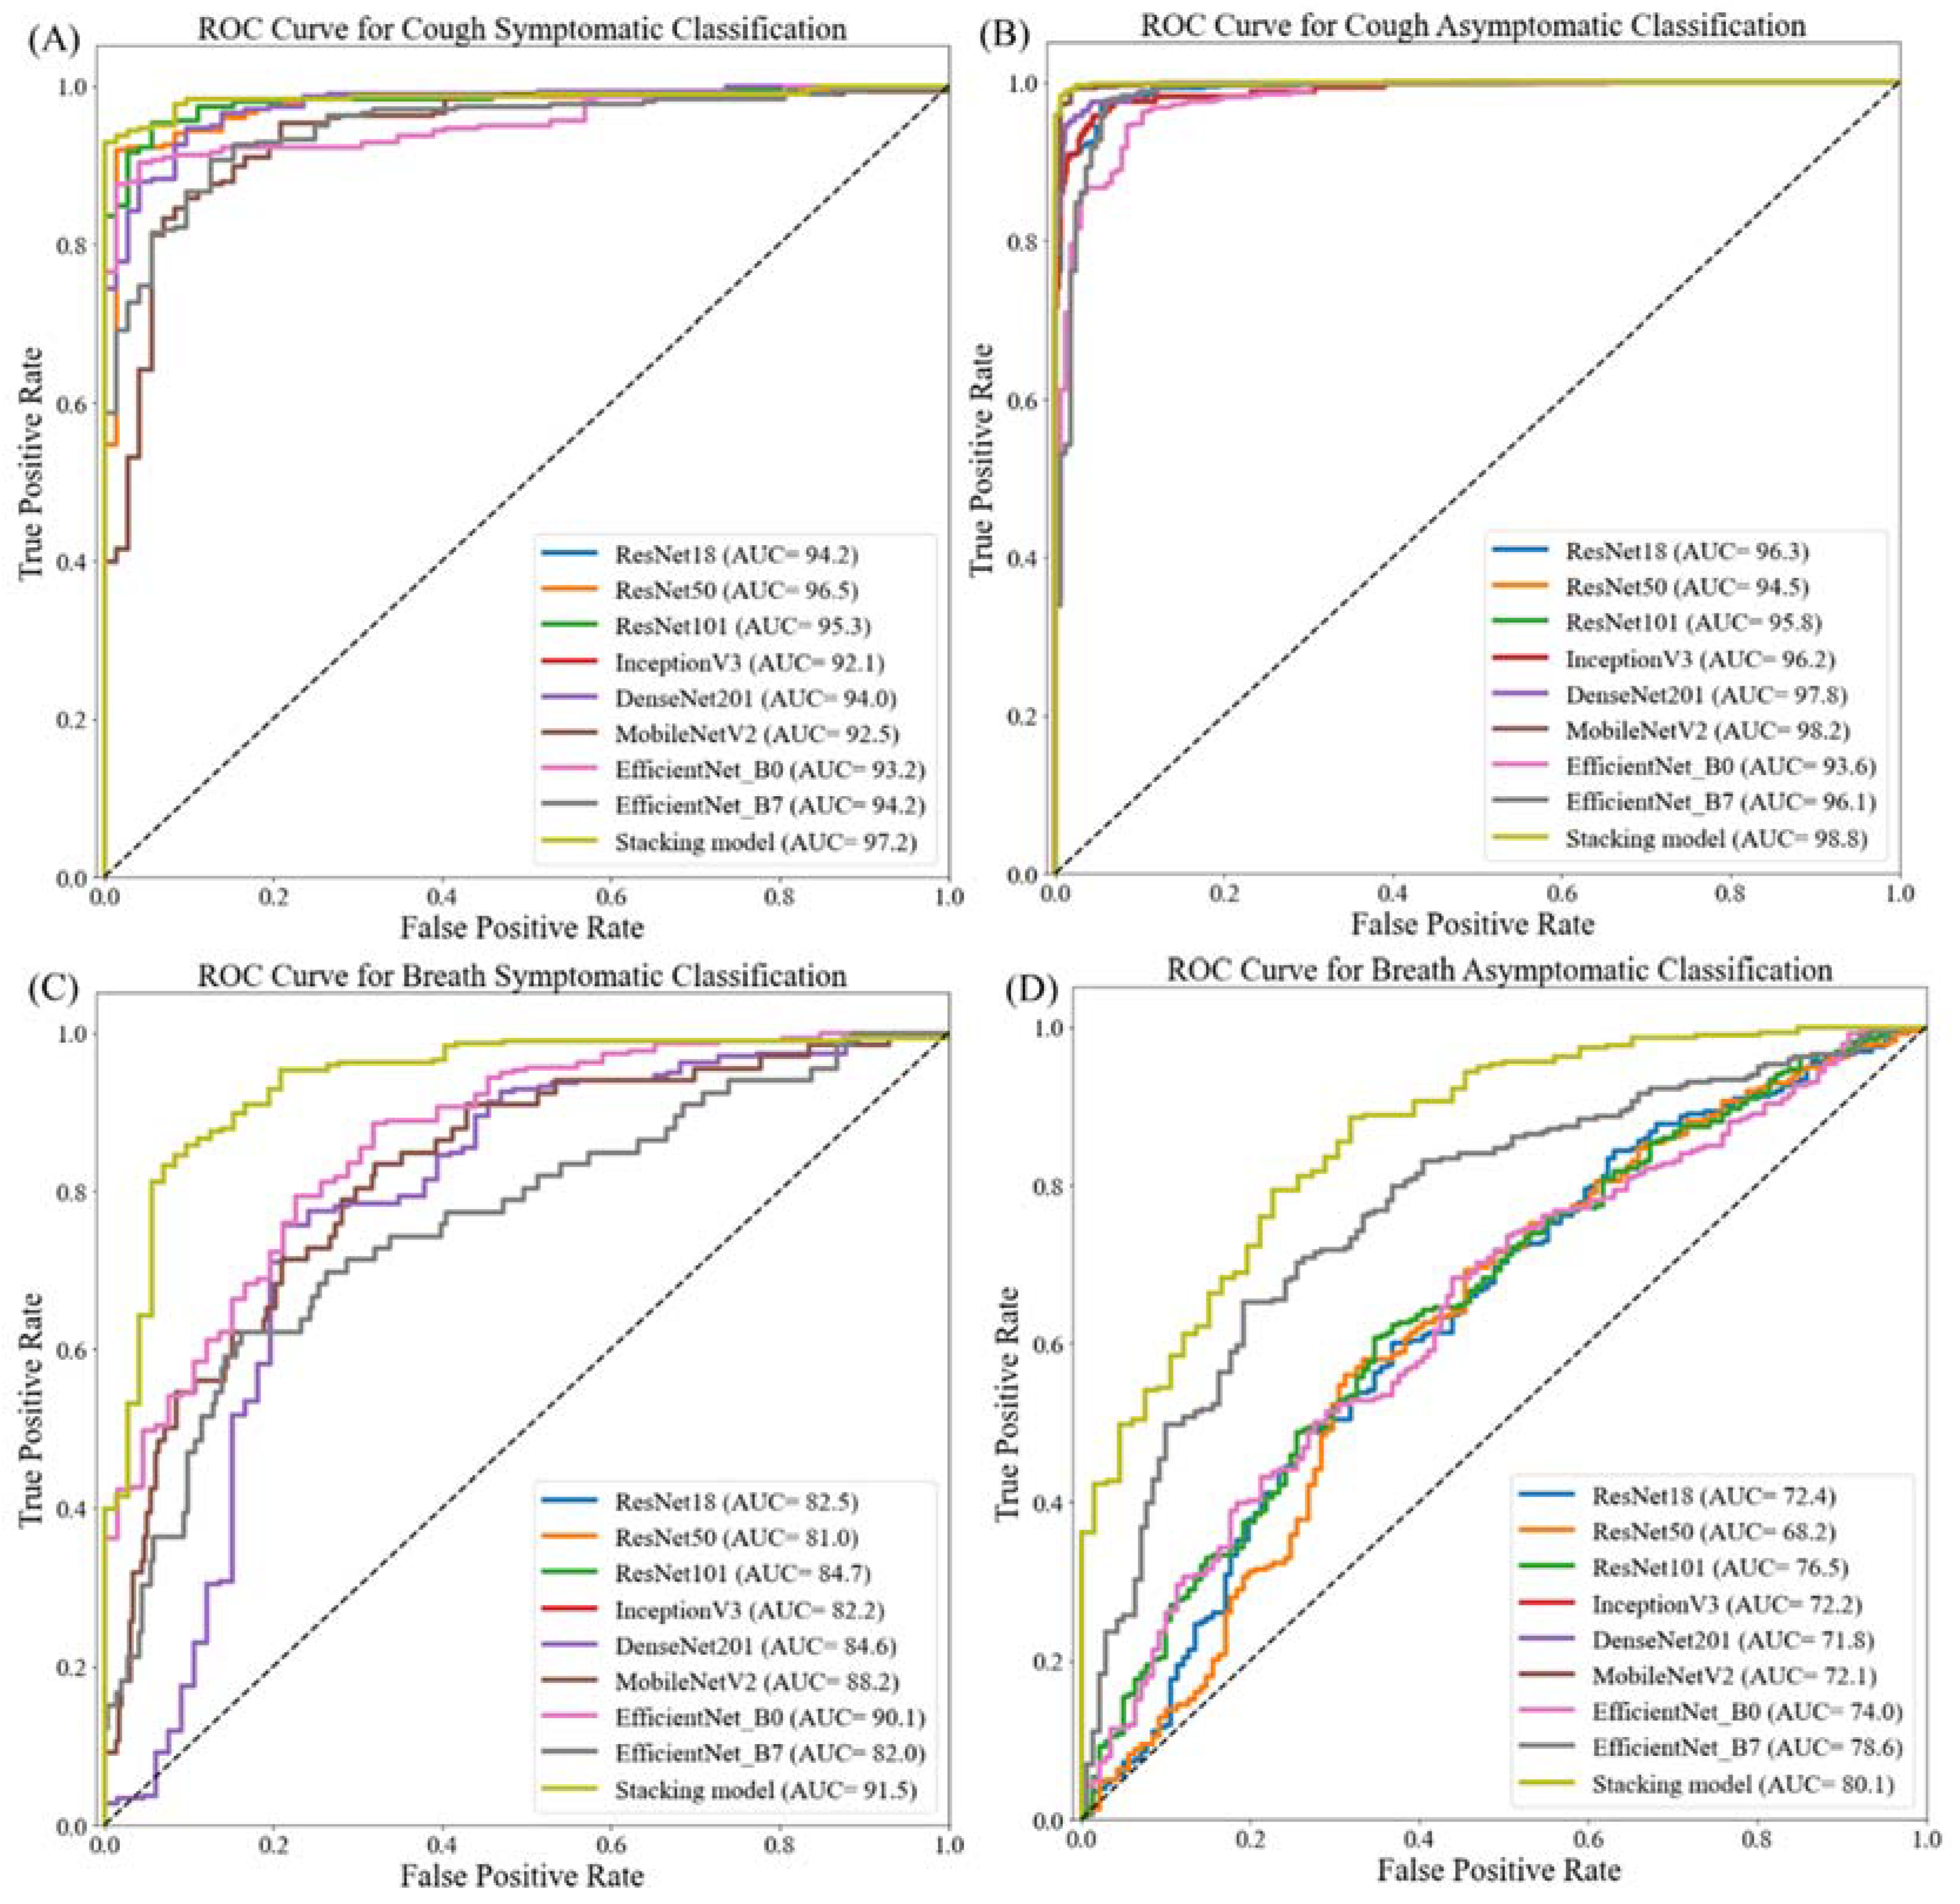
| Symptomatic | Resnet18 | 93.20 ± 2.57 | 93.65 ± 2.49 | 93.21 ± 2.57 | 93.35 ± 2.55 | 89.94 ± 3.07 | 0.0024 |
| Resnet50 | 95.38 ± 2.14 | 95.41 ± 2.14 | 95.38 ± 2.14 | 95.39 ± 2.14 | 90.47 ± 3.00 | 0.0061 | |
| Resnet101 | 94.29 ± 2.37 | 95.41 ± 2.14 | 94.29 ± 2.37 | 94.53 ± 2.32 | 97.56 ± 1.58 | 0.0108 | |
| Inception_v3 | 90.76 ± 2.96 | 91.53 ± 2.84 | 90.76 ± 2.96 | 91.02 ± 2.92 | 86.19 ± 3.52 | 0.0238 | |
| DenseNet201 | 93.25 ± 2.56 | 93.78 ± 2.47 | 93.21 ± 2.57 | 93.39 ± 2.54 | 90.99 ± 2.93 | 0.0258 | |
| Mobilenetv2 | 90.49 ± 3.00 | 90.78 ± 2.96 | 90.49 ± 3.00 | 90.61 ± 2.98 | 81.92 ± 3.93 | 0.0055 | |
| EfficientNet_B0 | 90.20 ± 2.89 | 90.15 ± 2.90 | 91.30 ± 2.88 | 91.20 ± 2.89 | 78.97 ± 4.16 | 0.0106 | |
| EfficientNet_B7 | 91.30 ± 2.88 | 91.40 ± 2.86 | 91.31 ± 2.88 | 91.35 ± 2.87 | 82.12 ± 3.92 | 0.0428 | |
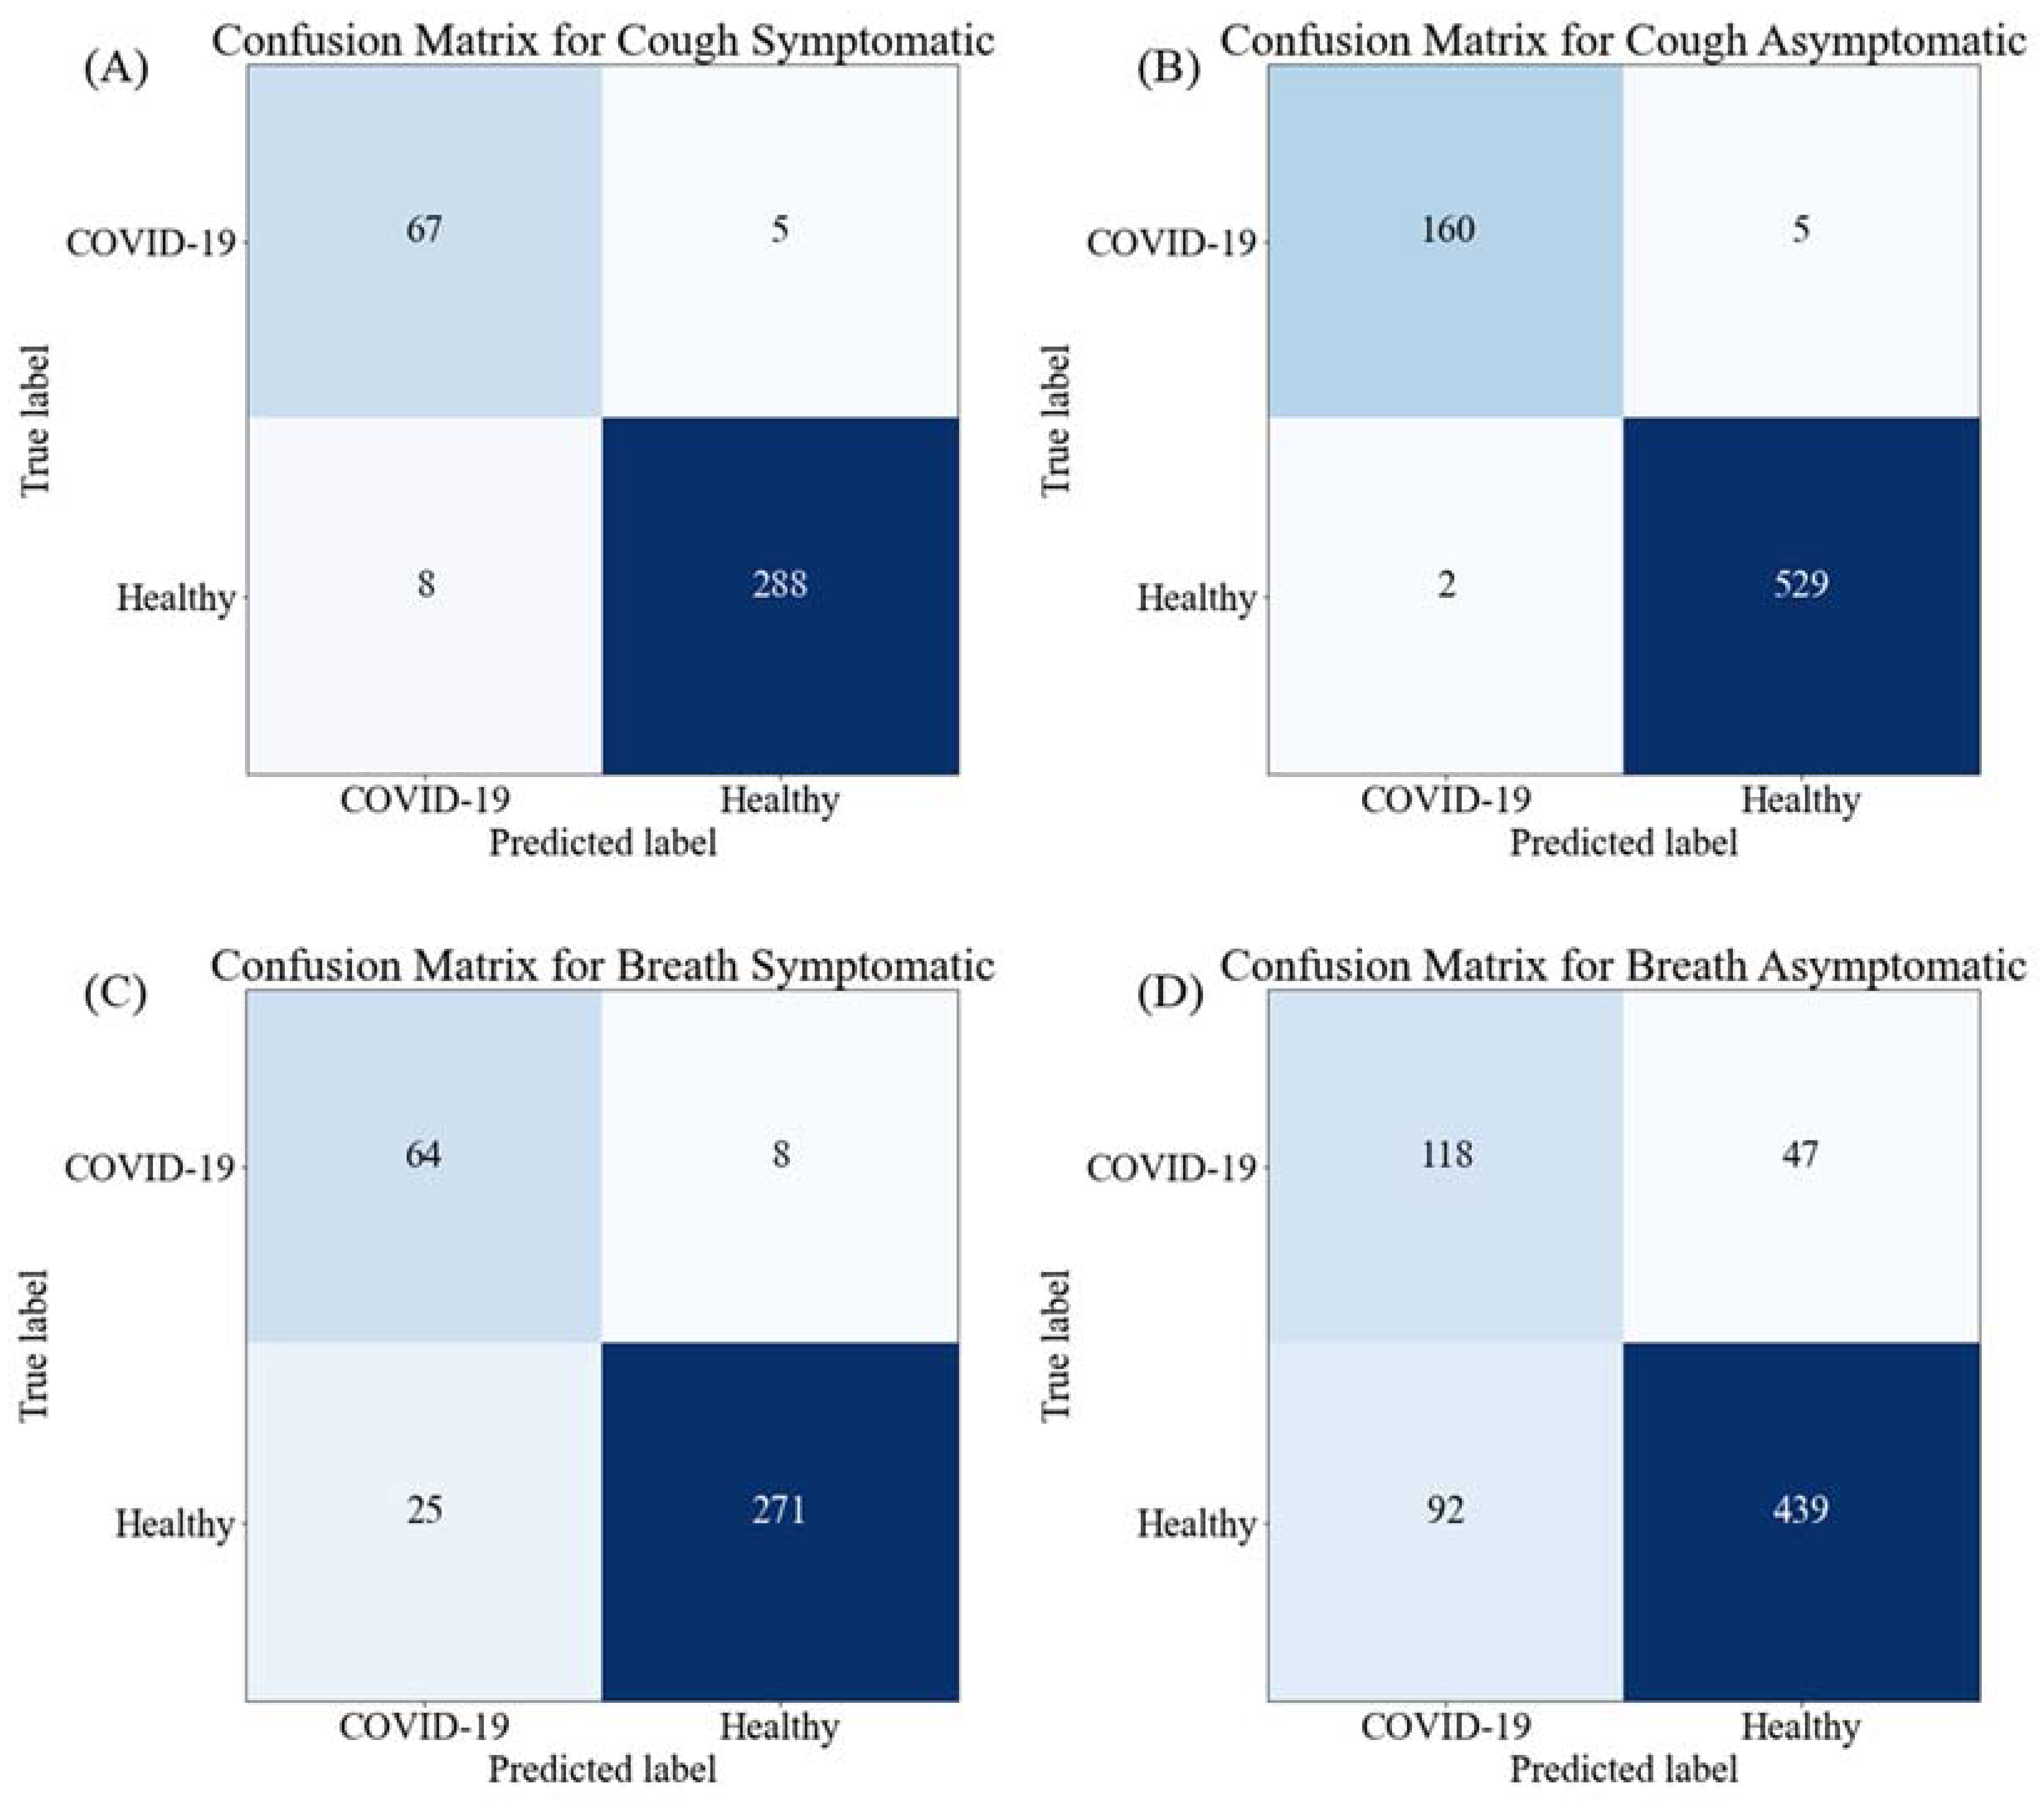
| Stacking CNN model | 96.50 ± 1.88 | 96.30 ± 1.93 | 96.42 ± 1.90 | 96.32 ± 1.92 | 95.47 ± 2.12 | 0.0389 | |
| Asymptomatic | Resnet18 | 96.70 ± 1.33 | 96.68 ± 1.33 | 96.69 ± 1.33 | 96.66 ± 1.33 | 92.29 ± 1.98 | 0.0027 |
| Resnet50 | 94.97 ± 1.62 | 95.12 ± 1.60 | 94.98 ± 1.62 | 94.80 ± 1.65 | 85.07 ± 2.65 | 0.0058 | |
| Resnet101 | 96.84 ± 1.30 | 96.84 ± 1.30 | 96.84 ± 1.30 | 96.84 ± 1.30 | 94.42 ± 1.71 | 0.0121 | |
| Inception_v3 | 96.26 ± 1.41 | 96.30 ± 1.40 | 96.27 ± 1.41 | 96.19 ± 1.42 | 89.65 ± 2.26 | 0.0235 | |
| DenseNet201 | 98.28 ± 0.97 | 98.27 ± 0.97 | 96.28 ± 1.41 | 97.11 ± 1.24 | 99.20 ± 0.66 | 0.0260 | |
| Mobilenetv2 | 98.50 ± 0.90 | 98.30 ± 0.96 | 96.45 ± 1.37 | 97.25 ± 1.21 | 99.20 ± 0.66 | 0.0052 | |
| EfficientNet_B0 | 93.82 ± 1.79 | 93.74 ± 1.80 | 93.82 ± 1.79 | 93.72 ± 1.80 | 85.96 ± 2.58 | 0.0118 | |
| EfficientNet_B7 | 95.40 ± 1.56 | 95.40 ± 1.56 | 95.40 ± 1.56 | 95.31 ± 1.57 | 88.13 ± 2.40 | 0.046 | |
| Stacking CNN model | 98.85 ± 0.79 | 97.76 ± 1.10 | 97.01 ± 1.27 | 97.41 ± 1.18 | 99.6 ± 0.47 | 0.0411 | |
| (B) | |||||||
| Scheme | Network | Overall | Weighted 95% CI | Inference Time (sec) | |||
| Accuracy | Precision | Sensitivity | F1-Score | Specificity | |||
| Symptomatic | Resnet18 | 81.49 ± 3.97 | 70.27 ± 4.67 | 82.27 ± 3.90 | 75.80 ± 4.38 | 81.49 ± 3.97 | 0.0027 |
| Resnet50 | 80.66 ± 4.04 | 70.83 ± 4.64 | 81.83 ± 3.94 | 75.93 ± 4.37 | 80.67 ± 4.03 | 0.0060 | |
| Resnet101 | 84.53 ± 3.69 | 73.01 ± 4.54 | 84.01 ± 3.74 | 78.12 ± 4.22 | 84.53 ± 3.69 | 0.0098 | |
| Inception_v3 | 81.49 ± 3.97 | 71.05 ± 4.63 | 82.05 ± 3.92 | 76.15 ± 4.35 | 81.49 ± 3.97 | 0.0254 | |
| DenseNet201 | 83.98 ± 3.75 | 72.43 ± 4.57 | 83.43 ± 3.8 | 77.54 ± 4.26 | 83.98 ± 3.75 | 0.026 | |
| Mobilenetv2 | 87.57 ± 3.37 | 69.50 ± 4.7 | 87.50 ± 3.38 | 77.47 ± 4.27 | 87.57 ± 3.37 | 0.0048 | |
| EfficientNet_B0 | 90.33 ± 3.02 | 70.28 ± 4.67 | 90.28 ± 3.03 | 79.03 ± 4.16 | 90.33 ± 3.02 | 0.0104 | |
| EfficientNet_B7 | 81.77 ± 3.94 | 70.99 ± 4.64 | 81.99 ± 3.93 | 76.09 ± 4.36 | 81.77 ± 3.94 | 0.0434 | |
| Stacking CNN model | 91.03 ± 2.92 | 71.91 ± 4.59 | 88.9 ± 3.21 | 79.62 ± 4.12 | 91.5 ± 2.85 | 0.0265 | |
| Asymptomatic | Resnet18 | 66.75 ± 3.50 | 53.95 ± 3.7 | 66.66 ± 3.50 | 59.64 ± 3.64 | 78.54 ± 3.05 | 0.0025 |
| Resnet50 | 66.67 ± 3.50 | 55.45 ± 3.69 | 66.67 ± 3.50 | 60.54 ± 3.63 | 75.27 ± 3.21 | 0.0047 | |
| Resnet101 | 69.72 ± 3.41 | 56.45 ± 3.68 | 69.71 ± 3.41 | 62.38 ± 3.60 | 73.52 ± 3.28 | 0.0118 | |
| Inception_v3 | 67.10 ± 3.49 | 57.10 ± 3.68 | 68.26 ± 3.46 | 62.18 ± 3.60 | 81.25 ± 2.90 | 0.0243 | |
| DenseNet201 | 67.97 ± 3.47 | 55.91 ± 3.69 | 67.97 ± 3.47 | 61.35 ± 3.62 | 79.88 ± 2.98 | 0.0271 | |
| MobileNetv2 | 68.40 ± 3.45 | 53.22 ± 3.71 | 67.10 ± 3.49 | 59.36 ± 3.65 | 78.54 ± 3.05 | 0.0048 | |
| EfficientNet_B0 | 68.30± 3.46 | 57.45 ± 3.67 | 68.62 ± 3.45 | 62.54 ± 3.60 | 76.50 ± 3.15 | 0.0128 | |
| EfficientNet_B7 | 75.60 ± 3.19 | 54.20 ± 3.70 | 72.59 ± 3.31 | 62.06 ± 3.61 | 80.20 ± 2.96 | 0.0511 | |
| Stacking CNN model | 80.01 ± 2.97 | 56.02 ± 3.69 | 72.04 ± 3.33 | 63.3 ± 3.58 | 82.67 ± 2.81 | 0.0687 | |
| Papers | Dataset | Phenomenon | Reported Method | Performance |
|---|---|---|---|---|
| N. Sharma (2020) [48] | Healthy and COVID-19-positive: 941 | Cough, Breathing, Vowel, and Counting (1–20) | Random forest classifier using spectral contrast, MFCC, spectral roll-off, spectral centroid, mean square energy, polynomial fit, zero-crossing rate, spectral bandwidth, and spectral flatness. | Accuracy: 76.74% |
| C. Brown et al. (2021) [55] | COVID-19-positive: 141, Non-COVID: 298, COVID-19-positive with Cough: 54, Non-COVID-19 with Cough: 32, Non-COVID-19 asthma: 20 | Cough and Breathing | CNN-based approach using spectrogram, spectral centroid, MFCC. | Accuracy: 80% |
| V. Espotovic (2021) [71] | COVID-19-Positive: 84, COVID-19-Negative: 419 | Cough and Breathing | Ensemble-boosted approach using spectrogram and wavelet. | Accuracy: 88.52% |
| R.Islam (2022) [72] | COVID-19-Positve: 50, Healthy: 50 | Cough | CNN-based approach using zero-crossing rate, energy, energy entropy, spectral centroid, spectral entropy, spectral flux, spectral roll-offs, MFCC. | Accuracy: 88.52% |
| Proposed Study | COVID-19-Positve: 237, Healthy: 827 | Cough and Breathing | Stacking-based CNN based approach using spectograms | For symptomatic, accuracy: 96.5% and for asymptomatic, accuracy: 98.85% |
Publisher’s Note: MDPI stays neutral with regard to jurisdictional claims in published maps and institutional affiliations. |
© 2022 by the authors. Licensee MDPI, Basel, Switzerland. This article is an open access article distributed under the terms and conditions of the Creative Commons Attribution (CC BY) license (https://creativecommons.org/licenses/by/4.0/).
Share and Cite
Rahman, T.; Ibtehaz, N.; Khandakar, A.; Hossain, M.S.A.; Mekki, Y.M.S.; Ezeddin, M.; Bhuiyan, E.H.; Ayari, M.A.; Tahir, A.; Qiblawey, Y.; et al. QUCoughScope: An Intelligent Application to Detect COVID-19 Patients Using Cough and Breath Sounds. Diagnostics 2022, 12, 920. https://doi.org/10.3390/diagnostics12040920
Rahman T, Ibtehaz N, Khandakar A, Hossain MSA, Mekki YMS, Ezeddin M, Bhuiyan EH, Ayari MA, Tahir A, Qiblawey Y, et al. QUCoughScope: An Intelligent Application to Detect COVID-19 Patients Using Cough and Breath Sounds. Diagnostics. 2022; 12(4):920. https://doi.org/10.3390/diagnostics12040920
Chicago/Turabian StyleRahman, Tawsifur, Nabil Ibtehaz, Amith Khandakar, Md Sakib Abrar Hossain, Yosra Magdi Salih Mekki, Maymouna Ezeddin, Enamul Haque Bhuiyan, Mohamed Arselene Ayari, Anas Tahir, Yazan Qiblawey, and et al. 2022. "QUCoughScope: An Intelligent Application to Detect COVID-19 Patients Using Cough and Breath Sounds" Diagnostics 12, no. 4: 920. https://doi.org/10.3390/diagnostics12040920
APA StyleRahman, T., Ibtehaz, N., Khandakar, A., Hossain, M. S. A., Mekki, Y. M. S., Ezeddin, M., Bhuiyan, E. H., Ayari, M. A., Tahir, A., Qiblawey, Y., Mahmud, S., Zughaier, S. M., Abbas, T., Al-Maadeed, S., & Chowdhury, M. E. H. (2022). QUCoughScope: An Intelligent Application to Detect COVID-19 Patients Using Cough and Breath Sounds. Diagnostics, 12(4), 920. https://doi.org/10.3390/diagnostics12040920