
Pediatric Exposures to Neurotoxicants: A Review of Magnetic Resonance Imaging and Spectroscopy Findings


Abstract
:1. Introduction
2. Heavy Metals
2.1. Lead Exposure and Intelligence
2.1.1. Initial Magnetic Resonance Spectroscopy Evaluations of Children with Elevated Blood Lead Concentrations
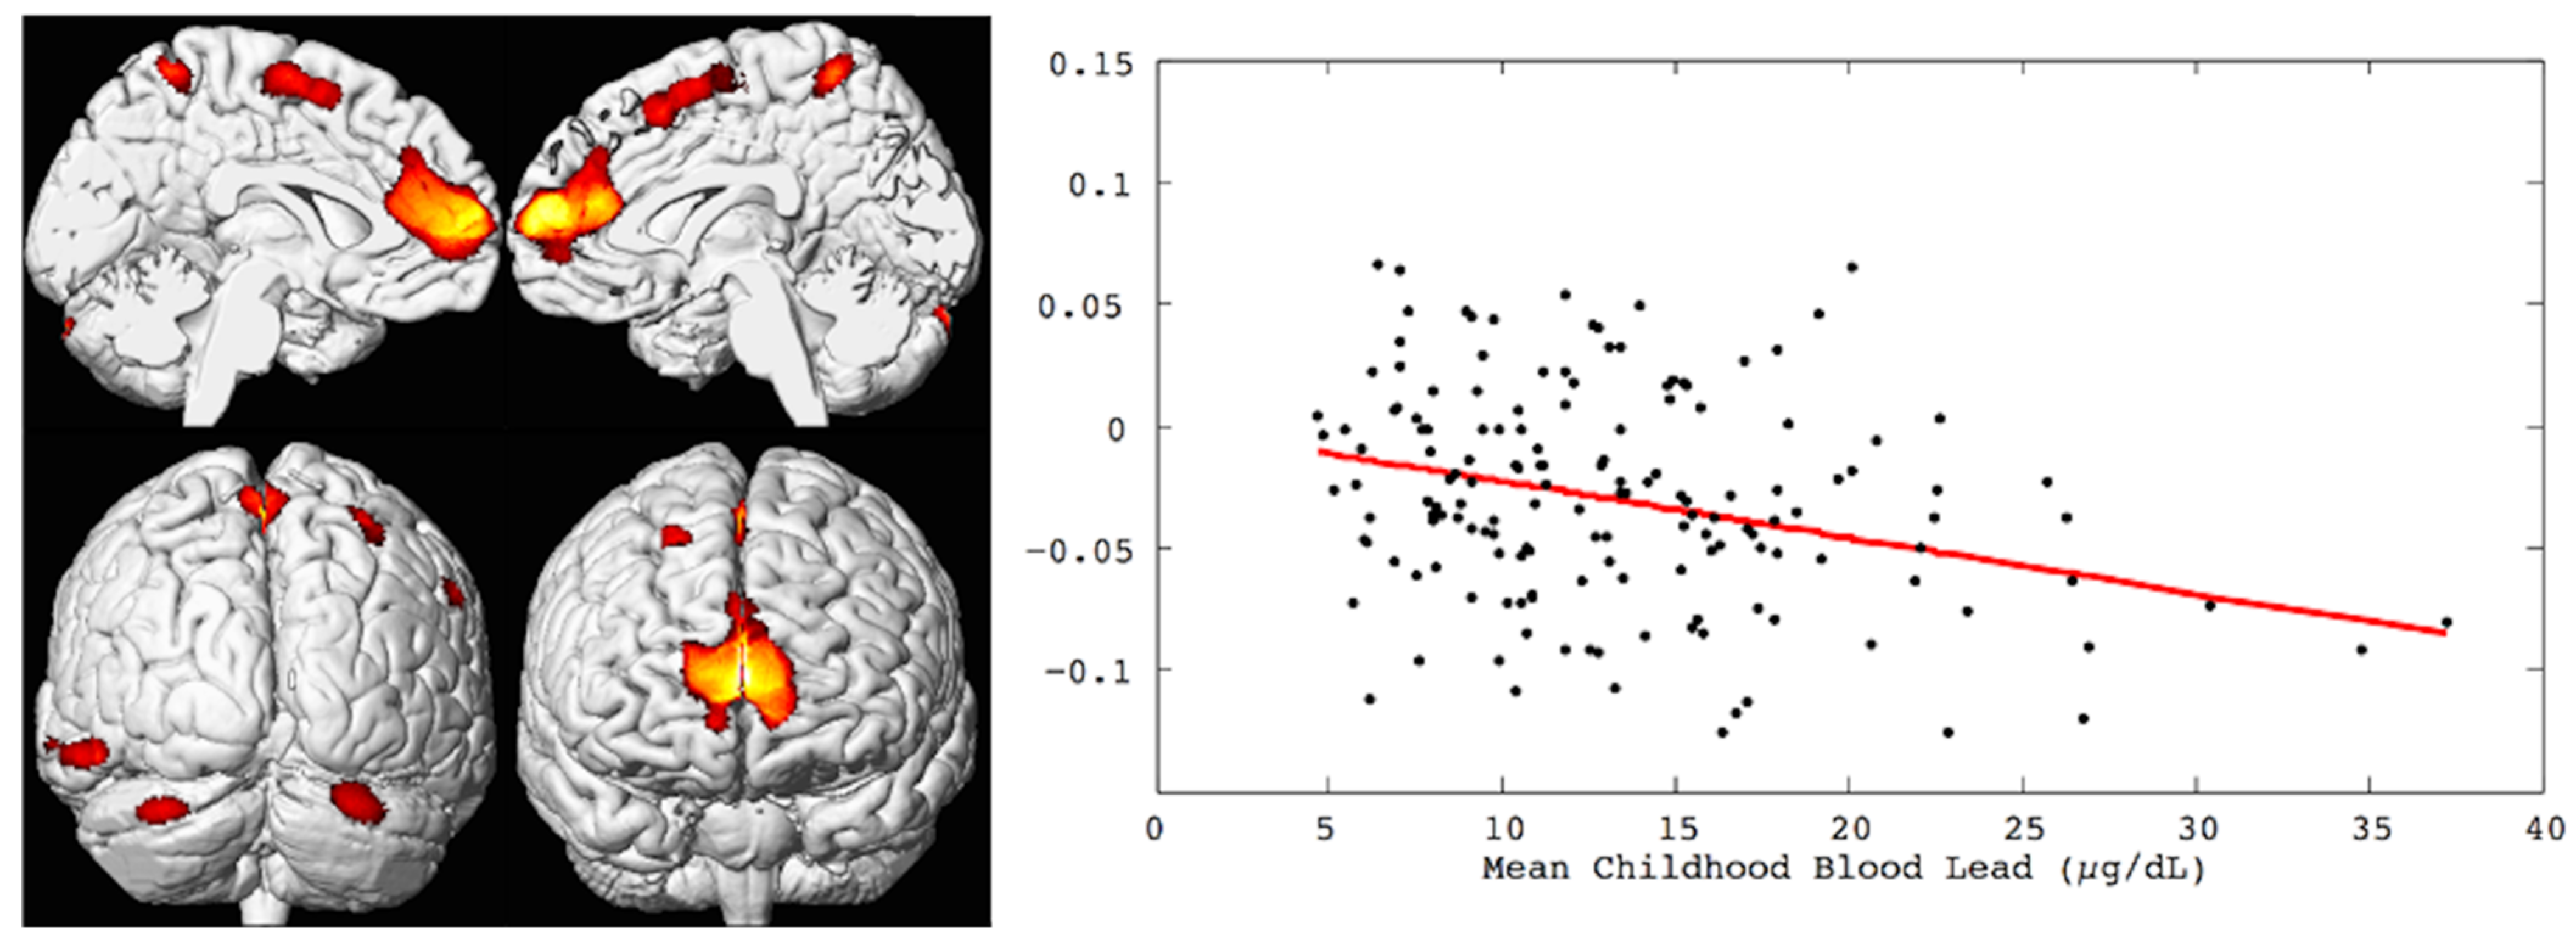
2.1.2. Multimodal Neuroimaging of the Cincinnati Lead Study
2.1.3. Neuroimaging of the Dunedin New Zealand Study Evaluating the Effects of Childhood Lead Exposure
2.1.4. The ABCD Study, Morphometry and Lead Exposure Risk
2.1.5. Fetal Brain Functional MRI and Lead Exposure
2.2. Manganese Characteristics and MRI
2.2.1. Canadian Children, Manganese in the Water, Pallidal Signal Indices and Morphometry
2.2.2. Italian Adolescents, Manganese, and Resting State Functional Magnetic Resonance Imaging
3. Air Pollutants
3.1. Pre- and Postnatal Polycyclic Aromatic Hydrocarbons and Morphological MRI in Urban Children
3.2. Barcelona Schools Study of Polycyclic Aromatic Hydrocarbons
3.3. Morphological MRI of Children and Adolescents from The Netherlands Exposed to Air Pollution
3.4. Morphological MRI and Magnetic Resonance Spectroscopy of Cincinnati Children Exposed to Traffic Related Air Pollution
3.5. The ABCD Study, Morphological MRI and PM2.5 Exposure
4. Pesticides
4.1. Prenatal Chlorpyrifos Exposure and Morphometric MRI in New York Children
4.2. Prenatal Organophosphate Exposure and Morphometric MRI in Generation R Study Subset
4.3. Prenatal Organophosphate Exposure and Motor Inhibition Functional Magnetic Resonance Imaging
5. Environmental Tobacco Smoke
5.1. ETS, Multimodal MRI, Cognitive Control Circuitry in Urban Children
5.2. ETS, Go-No-Go fMRI
6. Flame Retardants
7. Summary
Funding
Data Availability Statement
Conflicts of Interest
Abbreviations
| 3D | three dimensional |
| ABCD Study | Adolescent Brain Cognitive Development Study |
| AD | axial diffusivity |
| BA | Brodmann area |
| Cho | cholines |
| CLS | Cincinnati Lead Study |
| cm | centimeter |
| CPF | chlopyrifos |
| Cr | Creatine |
| DAP | diakylphosphates |
| DE | diethyl alkyl phosphate metabolites |
| DM | dimethyl alkyl phosphate metabolites |
| DTI | Diffusion Tensor Imaging |
| ETS | environmental tobacco smoke |
| FA | fractional anisotropy |
| fMRI | functional magnetic resonance imaging |
| FSIQ | Full Scale Intelligence Quotient |
| Glx | glutamate and glutamine |
| iFC | intrinsic functional connectivity |
| IFG | inferior frontal gyrus |
| MD | mean diffusivity |
| μg/L | micrograms per liter |
| μg/dL | micrograms per deciliter |
| mm | millimeter |
| Mn | manganese |
| MRI | magnetic resonance imaging |
| MRS | magnetic resonance spectroscopy |
| mTBM | multivariate tensor-based morphometry |
| NO2 | nitrogen dioxide |
| OP | organophosphate pesticides |
| PAH | polycyclic aromatic hydrocarbons |
| PBDE | polybrominated diphenyl ether |
| pg/m3 | picograms per cubic meter |
| PI | pallidal index |
| PM | particulate matter |
| PM2.5 | particulate matter less than 2.5 microns |
| RD | radial diffusivity |
| rsfMRI | resting state functional magnetic resonance imaging |
| SD | standard deviation |
| TRAP | traffic related air pollution |
| SPM | statistical parameter mapping |
| VBM | voxel-based morphometry |
References
- Wolff, M.S.; Buckley, J.P.; Engel, S.M.; McConnell, R.S.; Barr, D.B. Emerging exposures of developmental toxicants. Curr. Opin. Pediatr. 2017, 29, 218–224. [Google Scholar] [CrossRef] [PubMed] [Green Version]
- Bellinger, D.C. Comparing the population neurodevelopmental burdens associated with children’s exposures to environmental chemicals and other risk factors. Neurotoxicology 2012, 33, 641–643. [Google Scholar] [CrossRef] [PubMed]
- Bellinger, D.C. A strategy for comparing the contributions of environmental chemicals and other risk factors to neurodevelopment of children. Environ. Health Perspect. 2012, 120, 501–507. [Google Scholar] [CrossRef] [PubMed]
- Trope, I.; Lopez-Villegas, D.; Lenkinski, R.E. Magnetic resonance imaging and spectroscopy of regional brain structure in a 10-year-old boy with elevated blood lead levels. Pediatrics 1998, 101, E7. [Google Scholar] [CrossRef] [PubMed] [Green Version]
- Trope, I.; Lopez-Villegas, D.; Cecil, K.M.; Lenkinski, R.E. Exposure to lead appears to selectively alter metabolism of cortical gray matter. Pediatrics 2001, 107, 1437–1442. [Google Scholar] [CrossRef]
- Ashburner, J.; Friston, K.J. Voxel-based morphometry--the methods. Neuroimage 2000, 11, 805–821. [Google Scholar] [CrossRef] [Green Version]
- Cecil, K.M.; Brubaker, C.J.; Adler, C.M.; Dietrich, K.N.; Altaye, M.; Egelhoff, J.C.; Wessel, S.; Elangovan, I.; Hornung, R.; Jarvis, K.; et al. Decreased brain volume in adults with childhood lead exposure. PLoS Med. 2008, 5, e112. [Google Scholar] [CrossRef]
- Beckwith, T.J.; Dietrich, K.N.; Wright, J.P.; Altaye, M.; Cecil, K.M. Reduced regional volumes associated with total psychopathy scores in an adult population with childhood lead exposure. Neurotoxicology 2018, 67, 1–26. [Google Scholar] [CrossRef]
- Beckwith, T.J.; Dietrich, K.N.; Wright, J.P.; Altaye, M.; Cecil, K.M. Criminal arrests associated with reduced regional brain volumes in an adult population with documented childhood lead exposure. Environ. Res. 2021, 201, 111559. [Google Scholar] [CrossRef]
- Cecil, K.M.; Dietrich, K.N.; Altaye, M.; Egelhoff, J.C.; Lindquist, D.M.; Brubaker, C.J.; Lanphear, B.P. Proton magnetic resonance spectroscopy in adults with childhood lead exposure. Environ. Health Perspect. 2011, 119, 403–408. [Google Scholar] [CrossRef] [Green Version]
- Brubaker, C.J.; Schmithorst, V.J.; Haynes, E.N.; Dietrich, K.N.; Egelhoff, J.C.; Lindquist, D.M.; Lanphear, B.P.; Cecil, K.M. Altered myelination and axonal integrity in adults with childhood lead exposure: A diffusion tensor imaging study. Neurotoxicology 2009, 30, 867–875. [Google Scholar] [CrossRef] [PubMed] [Green Version]
- Yuan, W.; Holland, S.K.; Cecil, K.M.; Dietrich, K.N.; Wessel, S.D.; Altaye, M.; Hornung, R.W.; Ris, M.D.; Egelhoff, J.C.; Lanphear, B.P. The impact of early childhood lead exposure on brain organization: A functional magnetic resonance imaging study of language function. Pediatrics 2006, 118, 971–977. [Google Scholar] [CrossRef] [PubMed] [Green Version]
- Fischl, B. FreeSurfer. Neuroimage 2012, 62, 774–781. [Google Scholar] [CrossRef] [PubMed] [Green Version]
- Reuben, A.; Elliott, M.L.; Abraham, W.C.; Broadbent, J.; Houts, R.M.; Ireland, D.; Knodt, A.R.; Poulton, R.; Ramrakha, S.; Hariri, A.R.; et al. Association of Childhood Lead Exposure With MRI Measurements of Structural Brain Integrity in Midlife. JAMA 2020, 324, 1970–1979. [Google Scholar] [CrossRef] [PubMed]
- Marshall, A.T.; Betts, S.; Kan, E.C.; McConnell, R.; Lanphear, B.P.; Sowell, E.R. Association of lead-exposure risk and family income with childhood brain outcomes. Nat. Med. 2020, 26, 91–97. [Google Scholar] [CrossRef]
- Marshall, A.T.; McConnell, R.; Lanphear, B.P.; Thompson, W.K.; Herting, M.M.; Sowell, E.R. Risk of lead exposure, subcortical brain structure, and cognition in a large cohort of 9- to 10-year-old children. PLoS ONE 2021, 16, e0258469. [Google Scholar] [CrossRef]
- Thomason, M.E.; Hect, J.L.; Rauh, V.A.; Trentacosta, C.; Wheelock, M.D.; Eggebrecht, A.T.; Espinoza-Heredia, C.; Burt, S.A. Prenatal lead exposure impacts cross-hemispheric and long-range connectivity in the human fetal brain. Neuroimage 2019, 191, 186–192. [Google Scholar] [CrossRef]
- Lanphear, B.P.; Hornung, R.; Khoury, J.; Yolton, K.; Baghurst, P.; Bellinger, D.C.; Canfield, R.L.; Dietrich, K.N.; Bornschein, R.; Greene, T.; et al. Low-level environmental lead exposure and children’s intellectual function: An international pooled analysis. Environ. Health Perspect. 2005, 113, 894–899. [Google Scholar] [CrossRef]
- Dietrich, K.N.; Berger, O.G.; Succop, P.A. Lead exposure and the motor developmental status of urban six-year-old children in the Cincinnati Prospective Study. Pediatrics 1993, 91, 301–307. [Google Scholar]
- Dietrich, K.N.; Ris, M.D.; Succop, P.A.; Berger, O.G.; Bornschein, R.L. Early exposure to lead and juvenile delinquency. Neurotoxicol. Teratol. 2001, 23, 511–518. [Google Scholar] [CrossRef]
- Wright, J.P.; Lanphear, B.P.; Dietrich, K.N.; Bolger, M.; Tully, L.; Cecil, K.M.; Sacarellos, C. Developmental lead exposure and adult criminal behavior: A 30-year prospective birth cohort study. Neurotoxicol. Teratol. 2021, 85, 106960. [Google Scholar] [CrossRef] [PubMed]
- Blood Lead Reference Value. Available online: https://www.cdc.gov/nceh/lead/data/blood-lead-reference-value.htm (accessed on 5 January 2022).
- Karcher, N.R.; Schiffman, J.; Barch, D.M. Environmental Risk Factors and Psychotic-like Experiences in Children Aged 9-10. J. Am. Acad. Child. Adolesc. Psychiatry 2021, 60, 490–500. [Google Scholar] [CrossRef] [PubMed]
- Mendonca-Dias, M.H.; Gaggelli, E.; Lauterbur, P.C. Paramagnetic contrast agents in nuclear magnetic resonance medical imaging. Semin Nucl. Med. 1983, 13, 364–376. [Google Scholar] [CrossRef]
- Bouchard, M.; Laforest, F.; Vandelac, L.; Bellinger, D.; Mergler, D. Hair manganese and hyperactive behaviors: Pilot study of school-age children exposed through tap water. Environ. Health Perspect. 2007, 115, 122–127. [Google Scholar] [CrossRef] [PubMed] [Green Version]
- Oulhote, Y.; Mergler, D.; Barbeau, B.; Bellinger, D.C.; Bouffard, T.; Brodeur, M.E.; Saint-Amour, D.; Legrand, M.; Sauve, S.; Bouchard, M.F. Neurobehavioral function in school-age children exposed to manganese in drinking water. Environ. Health Perspect. 2014, 122, 1343–1350. [Google Scholar] [CrossRef]
- Dion, L.A.; Bouchard, M.F.; Sauve, S.; Barbeau, B.; Tucholka, A.; Major, P.; Gilbert, G.; Mergler, D.; Saint-Amour, D. MRI pallidal signal in children exposed to manganese in drinking water. Neurotoxicology 2016, 53, 124–131. [Google Scholar] [CrossRef]
- Lao, Y.; Dion, L.A.; Gilbert, G.; Bouchard, M.F.; Rocha, G.; Wang, Y.; Lepore, N.; Saint-Amour, D. Mapping the basal ganglia alterations in children chronically exposed to manganese. Sci. Rep. 2017, 7, 41804. [Google Scholar] [CrossRef] [Green Version]
- de Water, E.; Papazaharias, D.M.; Ambrosi, C.; Mascaro, L.; Iannilli, E.; Gasparotti, R.; Lucchini, R.G.; Austin, C.; Arora, M.; Tang, C.Y.; et al. Early-life dentine manganese concentrations and intrinsic functional brain connectivity in adolescents: A pilot study. PLoS ONE 2019, 14, e0220790. [Google Scholar] [CrossRef] [Green Version]
- Peterson, B.S.; Rauh, V.A.; Bansal, R.; Hao, X.; Toth, Z.; Nati, G.; Walsh, K.; Miller, R.L.; Arias, F.; Semanek, D.; et al. Effects of prenatal exposure to air pollutants (polycyclic aromatic hydrocarbons) on the development of brain white matter, cognition, and behavior in later childhood. JAMA Psychiatry 2015, 72, 531–540. [Google Scholar] [CrossRef]
- Mortamais, M.; Pujol, J.; van Drooge, B.L.; Macia, D.; Martinez-Vilavella, G.; Reynes, C.; Sabatier, R.; Rivas, I.; Grimalt, J.; Forns, J.; et al. Effect of exposure to polycyclic aromatic hydrocarbons on basal ganglia and attention-deficit hyperactivity disorder symptoms in primary school children. Environ. Int. 2017, 105, 12–19. [Google Scholar] [CrossRef] [Green Version]
- Guxens, M.; Lubczynska, M.J.; Muetzel, R.L.; Dalmau-Bueno, A.; Jaddoe, V.W.V.; Hoek, G.; van der Lugt, A.; Verhulst, F.C.; White, T.; Brunekreef, B.; et al. Air Pollution Exposure During Fetal Life, Brain Morphology, and Cognitive Function in School-Age Children. Biol. Psychiatry 2018, 84, 295–303. [Google Scholar] [CrossRef] [PubMed] [Green Version]
- Lubczynska, M.J.; Muetzel, R.L.; El Marroun, H.; Hoek, G.; Kooter, I.M.; Thomson, E.M.; Hillegers, M.; Vernooij, M.W.; White, T.; Tiemeier, H.; et al. Air pollution exposure during pregnancy and childhood and brain morphology in preadolescents. Environ. Res. 2021, 198, 110446. [Google Scholar] [CrossRef] [PubMed]
- Beckwith, T.; Cecil, K.; Altaye, M.; Severs, R.; Wolfe, C.; Percy, Z.; Maloney, T.; Yolton, K.; LeMasters, G.; Brunst, K.; et al. Reduced gray matter volume and cortical thickness associated with traffic-related air pollution in a longitudinally studied pediatric cohort. PLoS ONE 2020, 15, e0228092. [Google Scholar] [CrossRef] [PubMed]
- Brunst, K.J.; Ryan, P.H.; Altaye, M.; Yolton, K.; Maloney, T.; Beckwith, T.; LeMasters, G.; Cecil, K.M. Myo-inositol mediates the effects of traffic-related air pollution on generalized anxiety symptoms at age 12years. Environ. Res. 2019, 175, 71–78. [Google Scholar] [CrossRef]
- Cserbik, D.; Chen, J.C.; McConnell, R.; Berhane, K.; Sowell, E.R.; Schwartz, J.; Hackman, D.A.; Kan, E.; Fan, C.C.; Herting, M.M. Fine particulate matter exposure during childhood relates to hemispheric-specific differences in brain structure. Environ. Int. 2020, 143, 105933. [Google Scholar] [CrossRef]
- Rauh, V.A.; Perera, F.P.; Horton, M.K.; Whyatt, R.M.; Bansal, R.; Hao, X.; Liu, J.; Barr, D.B.; Slotkin, T.A.; Peterson, B.S. Brain anomalies in children exposed prenatally to a common organophosphate pesticide. Proc. Natl. Acad. Sci. USA 2012, 109, 7871–7876. [Google Scholar] [CrossRef] [Green Version]
- van den Dries, M.A.; Lamballais, S.; El Marroun, H.; Pronk, A.; Spaan, S.; Ferguson, K.K.; Longnecker, M.P.; Tiemeier, H.; Guxens, M. Prenatal exposure to organophosphate pesticides and brain morphology and white matter microstructure in preadolescents. Environ. Res. 2020, 191, 110047. [Google Scholar] [CrossRef]
- Binter, A.C.; Bannier, E.; Saint-Amour, D.; Simon, G.; Barillot, C.; Monfort, C.; Cordier, S.; Pele, F.; Chevrier, C. Exposure of pregnant women to organophosphate insecticides and child motor inhibition at the age of 10–12 years evaluated by fMRI. Environ. Res. 2020, 188, 109859. [Google Scholar] [CrossRef]
- Margolis, A.E.; Pagliaccio, D.; Ramphal, B.; Banker, S.; Thomas, L.; Robinson, M.; Honda, M.; Sussman, T.; Posner, J.; Kannan, K.; et al. Prenatal environmental tobacco smoke exposure alters children’s cognitive control circuitry: A preliminary study. Environ. Int. 2021, 155, 106516. [Google Scholar] [CrossRef]
- Bennett, D.S.; Mohamed, F.B.; Carmody, D.P.; Bendersky, M.; Patel, S.; Khorrami, M.; Faro, S.H.; Lewis, M. Response inhibition among early adolescents prenatally exposed to tobacco: An fMRI study. Neurotoxicol. Teratol. 2009, 31, 283–290. [Google Scholar] [CrossRef] [Green Version]
- de Water, E.; Curtin, P.; Zilverstand, A.; Sjodin, A.; Bonilla, A.; Herbstman, J.B.; Ramirez, J.; Margolis, A.E.; Bansal, R.; Whyatt, R.M.; et al. A preliminary study on prenatal polybrominated diphenyl ether serum concentrations and intrinsic functional network organization and executive functioning in childhood. J. Child. Psychol. Psychiatry 2019, 60, 1010–1020. [Google Scholar] [CrossRef] [PubMed]


| Exposure Assessment | Imaging Method | Age at Imaging | Key Findings | Reference |
|---|---|---|---|---|
| Childhood Blood | MRS | Child | Reduced NAA/Cr in middle frontal cortex | Trope et al. [4,5] |
| Childhood Blood | MRI: SPM, VBM [6] | Adult | Reduced frontal cortex and white matter volumes | Cecil et al. [7] |
| Childhood Blood | MRI: SPM, VBM [6] | Adult | Reduced frontal cortex and white matter volumes | Beckwith et al. [8,9] |
| Childhood Blood | MRS | Adult | Reduced metabolite concentrations | Cecil et al. [10] |
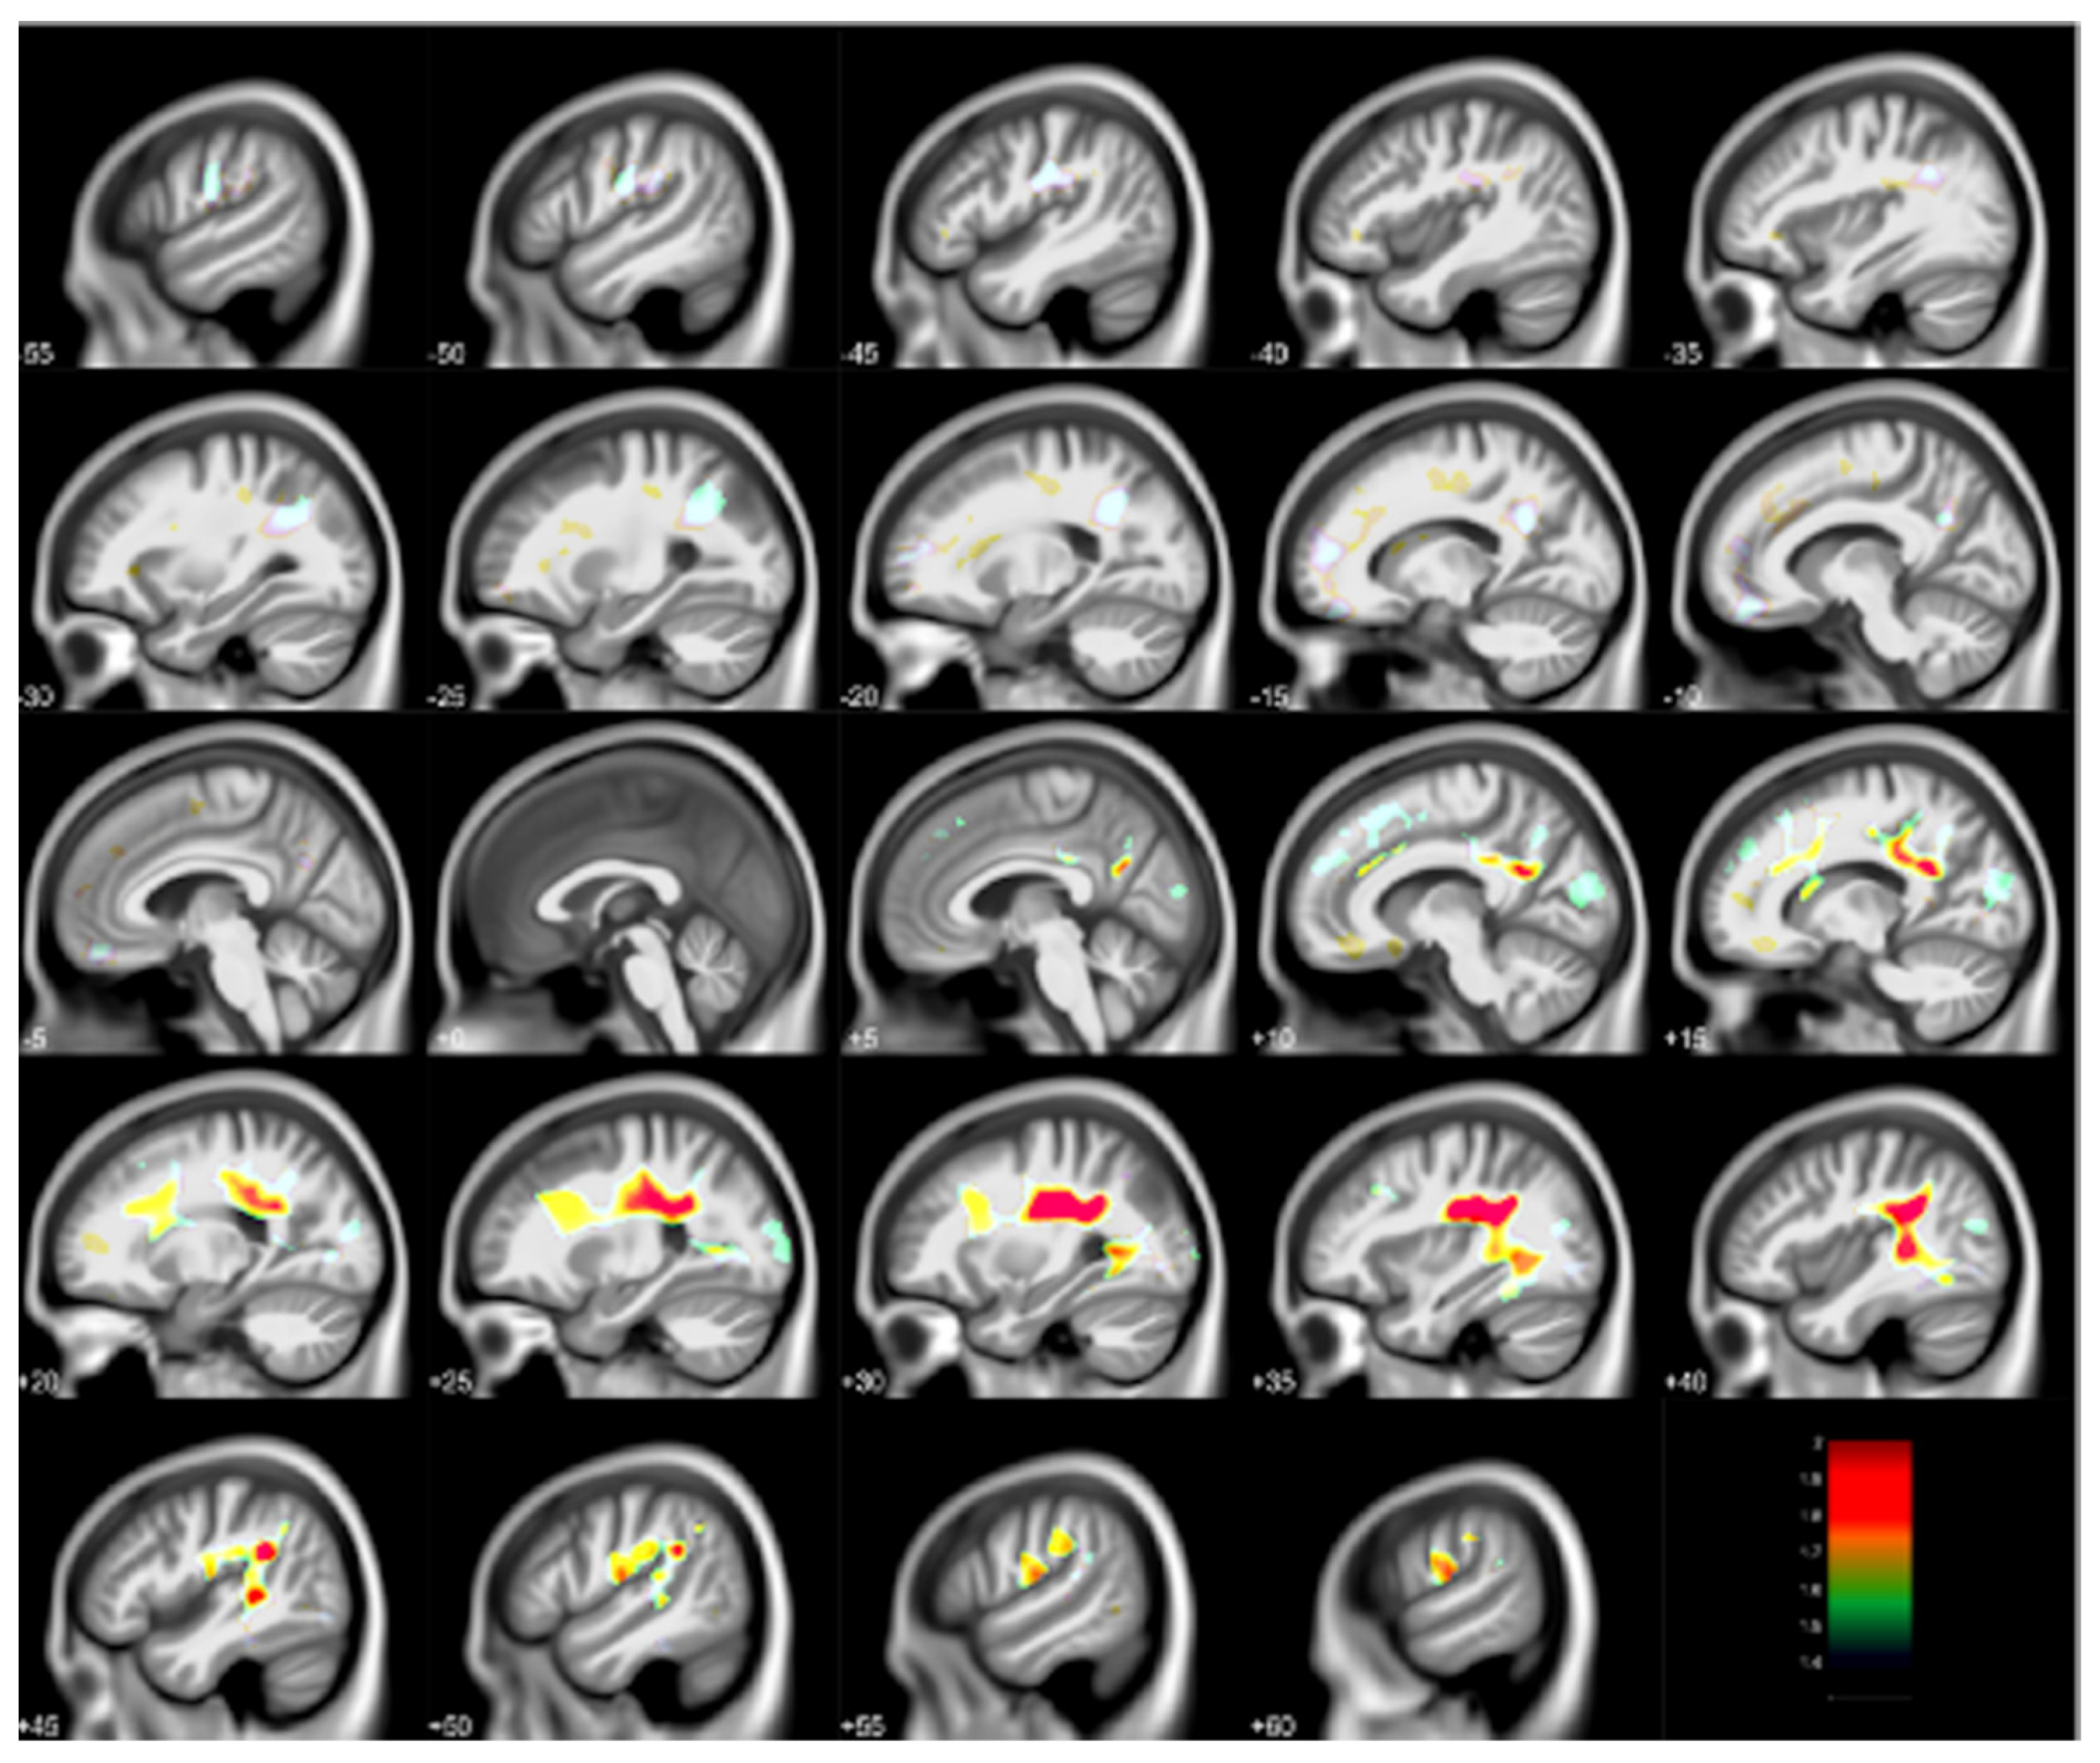
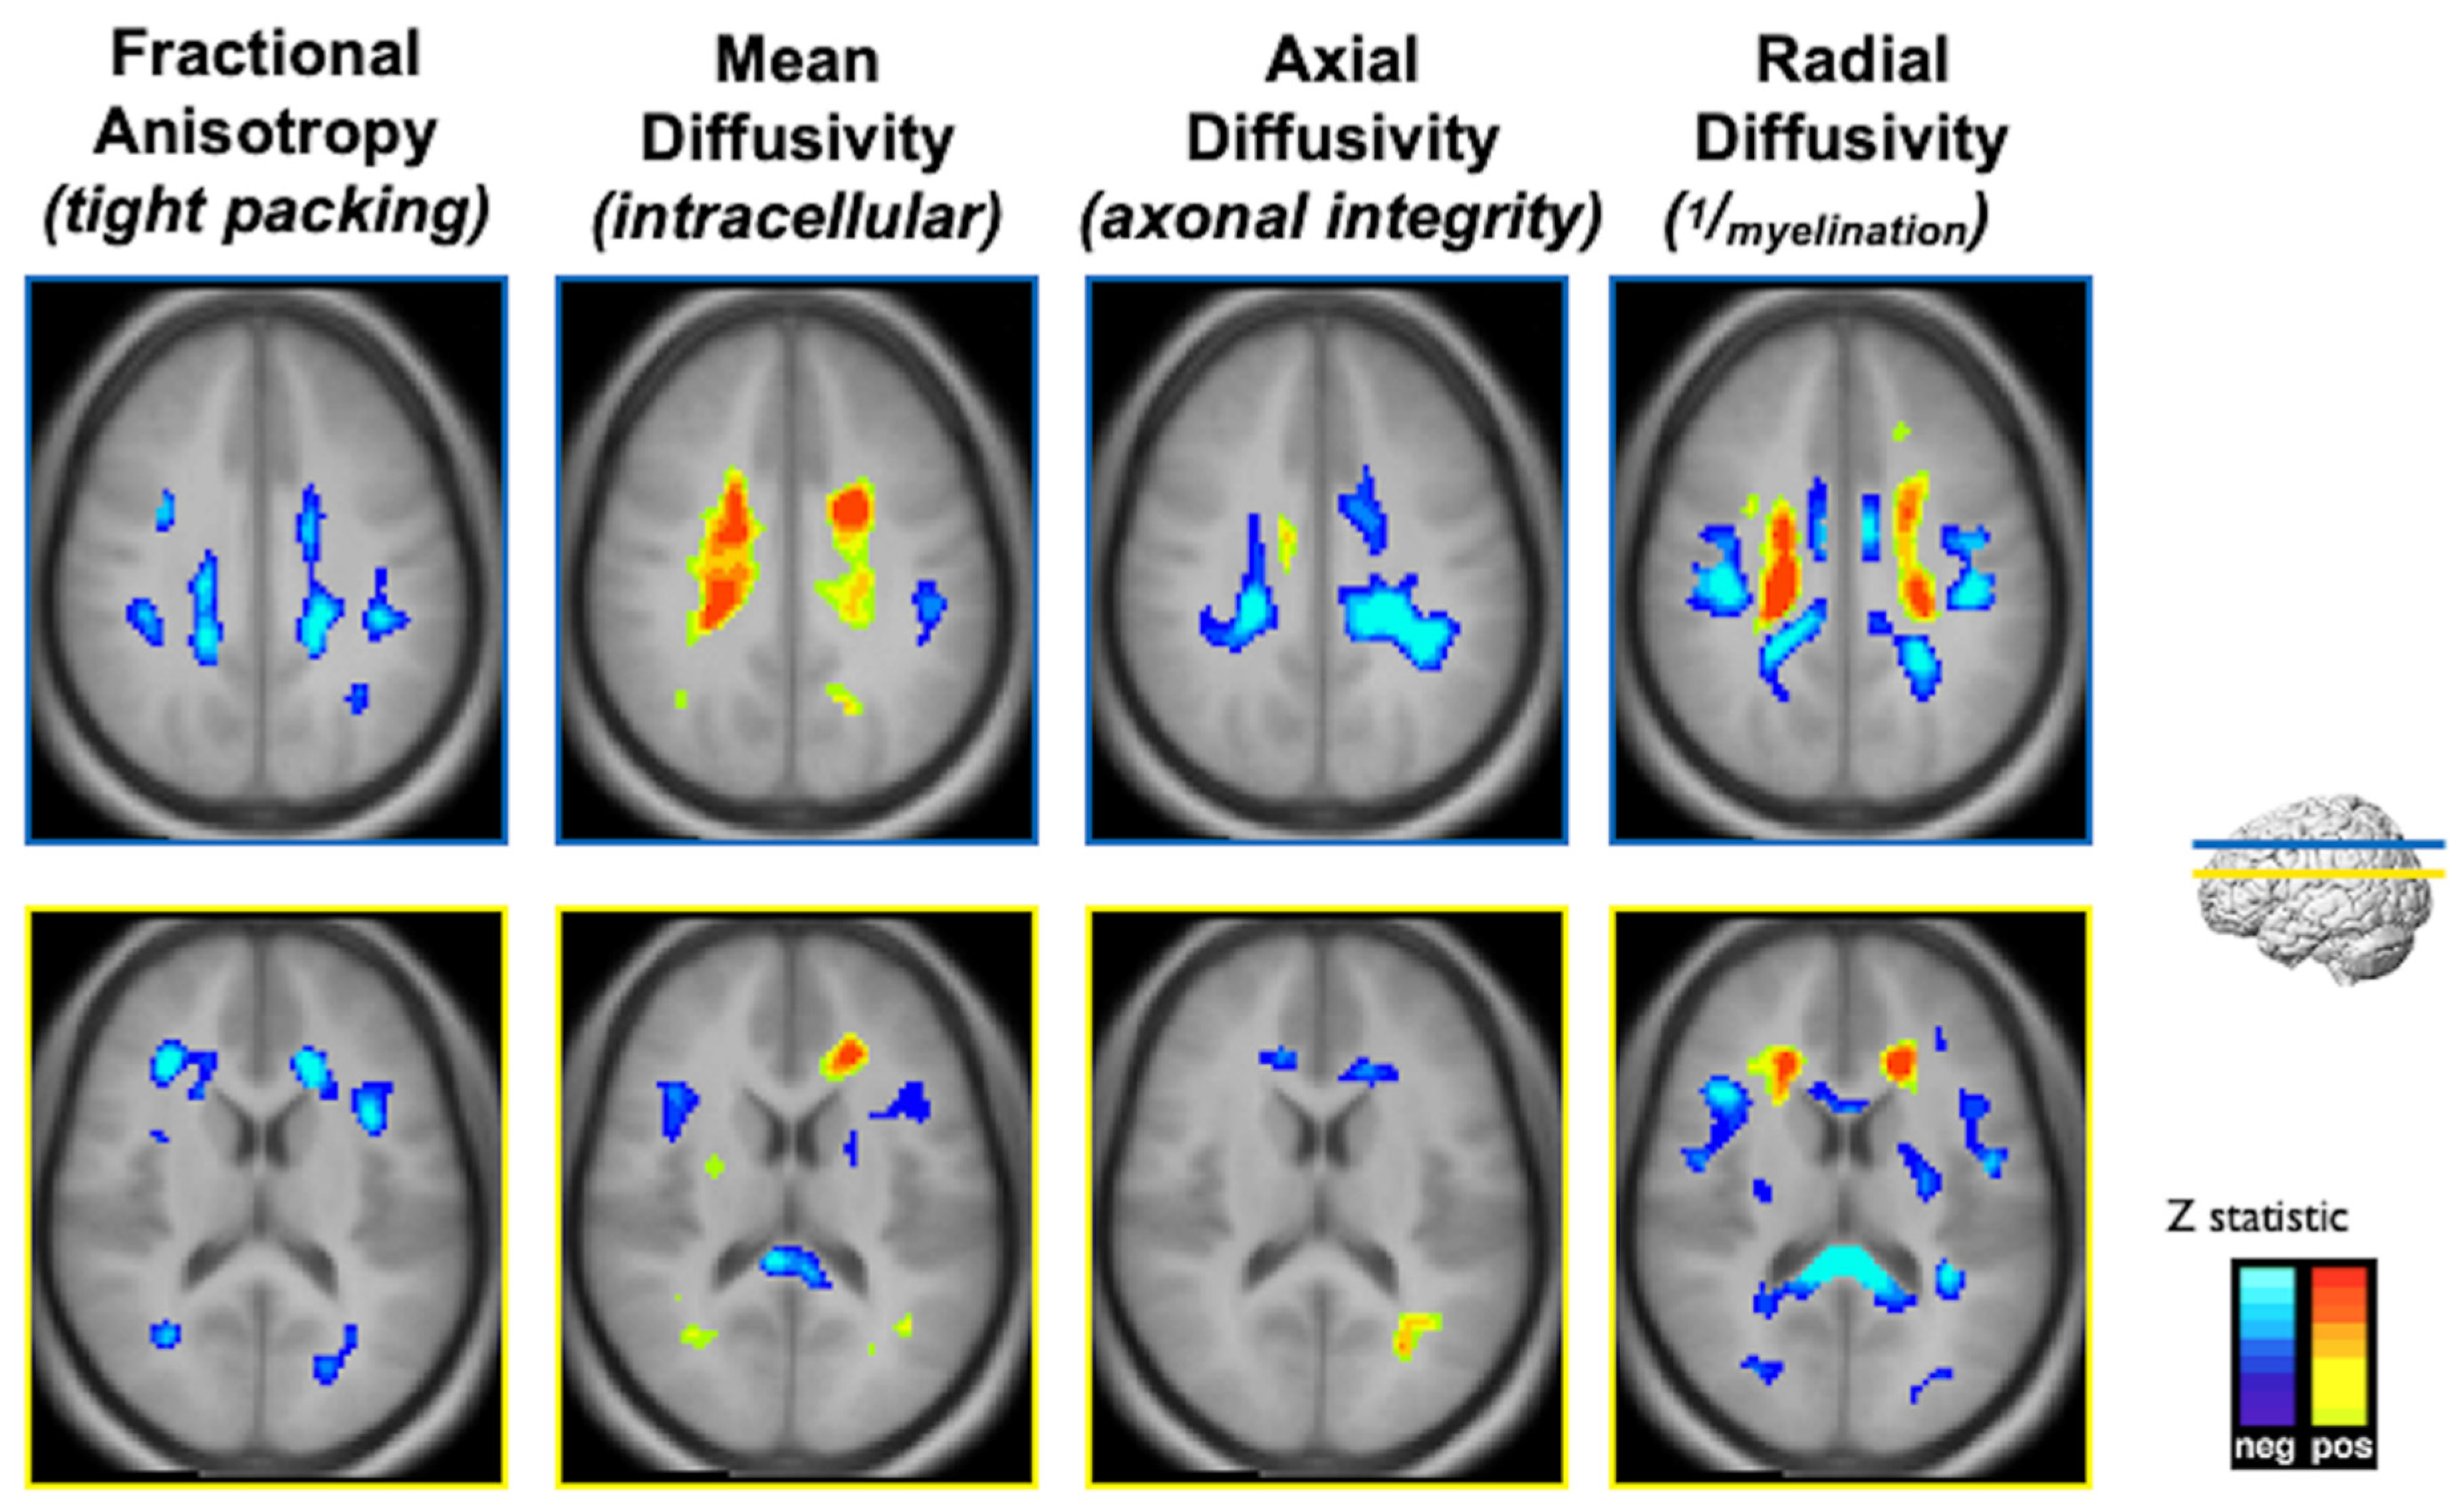
| Childhood Blood | DTI | Adult | Two disparate patterns of DTI metrics with injury and compensation | Brubaker et al. [11] |
| Childhood Blood | Task fMRI | Adult | Two disparate patterns of activation with injury and compensation using verb generation task | Yuan et al. [12] |
| Childhood Blood | MRI: FreeSurfer [13] | Adult | Reduced cortical surface area, hippocampus volume | Reuben et al. [14] |
| Childhood Blood | Diffusion | Adult | Lower FA | Reuben et al. [14] |
| Childhood Blood | BrainAge | Adult | Older estimated brain age by 0.77 years | Reuben et al. [14] |
| Lead Risk from Home Age, Income | MRI: FreeSurfer [13] | Child | Reduced cortical volume, cortical surface area, corpus callosum volume | Marshall et al. [15,16] |
| Newborn Blood Spot | fMRI | Fetus | Different neural connectivity patterns | Thomason et al. [17] |
| Exposure Assessment | Imaging Method | Age at Imaging | Key Findings | Author, Citation |
|---|---|---|---|---|
| Prenatal, Postnatal PAH | MRI | Child | 3rd Trimester PAH with reduced white matter surface | Peterson et al. [30] |
| Childhood PAH | MRI: FreeSurfer [13] | Child | Reduced caudate nucleus volume | Mortamais et al. [31] |
| Prenatal NO2, PM | MRI: FreeSurfer [13] | Child | Reduced cortex thickness: right hemisphere 0.045 thinner for each 5 mg/m3 increase of PM2.5 | Guxens et al. [32] |
| Prenatal and Childhood NO2, PM | MRI: FreeSurfer [13] | Adolescent | Reduced corpus callosal, hippocampal volumes, cortical thickness; for childhood exposures, larger cortical surface area; for prenatal exposures, larger amygdala and cerebellum volumes | Lubczynska et al. [33] |
| Early Childhood TRAP | MRI: SPM, VBM [6] | Adolescent | Reduced gray matter volumes, cortical thickness in sensorimotor regions, cerebellum | Beckwith et al. [34] |
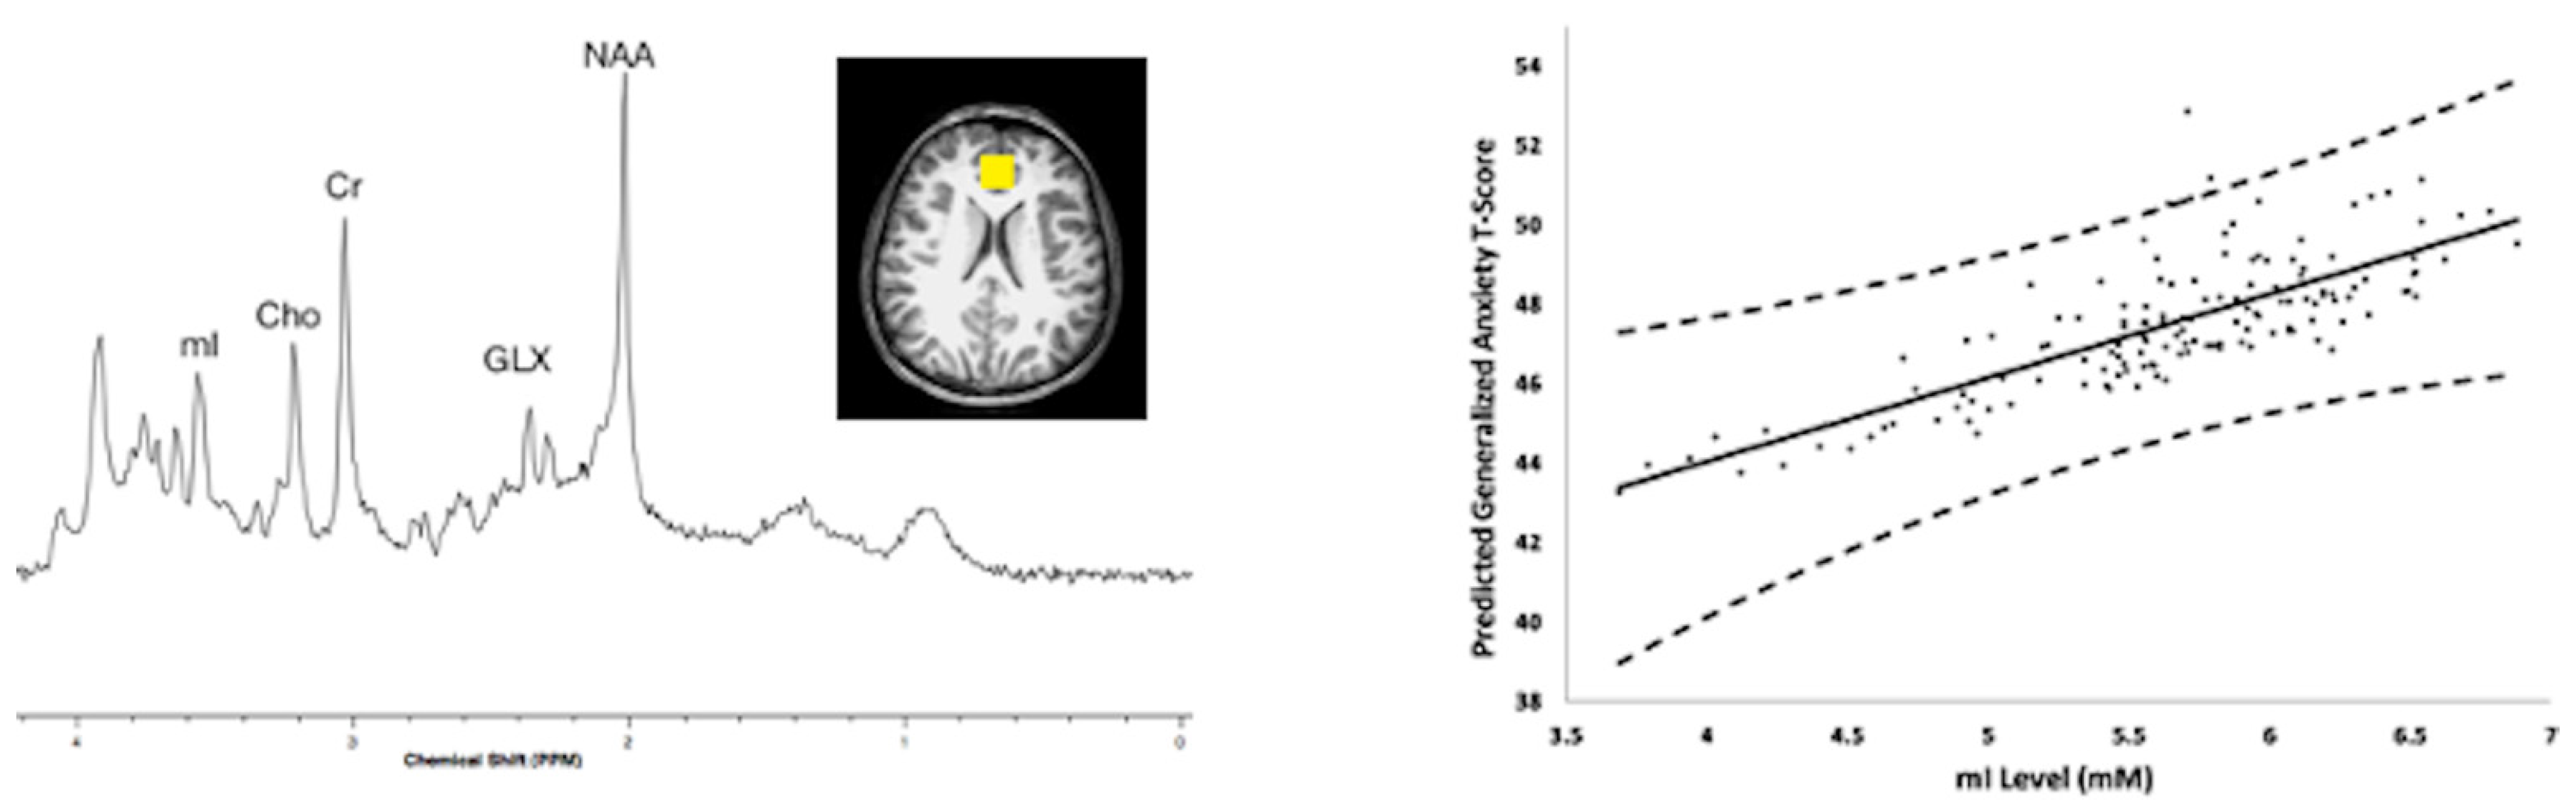
| Childhood TRAP | MRS | Adolescent | Higher myo-inositol concentrations within medial frontal lobe, anterior cingulate cortex | Brunst et al. [35] |
| Childhood PM2.5 | MRI: FreeSurfer [13] | Child | Regional associations with cortical surface area, cortical thickness, and volume | Cserbik et al. [36] |
Publisher’s Note: MDPI stays neutral with regard to jurisdictional claims in published maps and institutional affiliations. |
© 2022 by the author. Licensee MDPI, Basel, Switzerland. This article is an open access article distributed under the terms and conditions of the Creative Commons Attribution (CC BY) license (https://creativecommons.org/licenses/by/4.0/).
Share and Cite
Cecil, K.M. Pediatric Exposures to Neurotoxicants: A Review of Magnetic Resonance Imaging and Spectroscopy Findings. Diagnostics 2022, 12, 641. https://doi.org/10.3390/diagnostics12030641
Cecil KM. Pediatric Exposures to Neurotoxicants: A Review of Magnetic Resonance Imaging and Spectroscopy Findings. Diagnostics. 2022; 12(3):641. https://doi.org/10.3390/diagnostics12030641
Chicago/Turabian StyleCecil, Kim M. 2022. "Pediatric Exposures to Neurotoxicants: A Review of Magnetic Resonance Imaging and Spectroscopy Findings" Diagnostics 12, no. 3: 641. https://doi.org/10.3390/diagnostics12030641
APA StyleCecil, K. M. (2022). Pediatric Exposures to Neurotoxicants: A Review of Magnetic Resonance Imaging and Spectroscopy Findings. Diagnostics, 12(3), 641. https://doi.org/10.3390/diagnostics12030641