
Computer-Assisted Pterygium Screening System: A Review


 , and
, and
Abstract
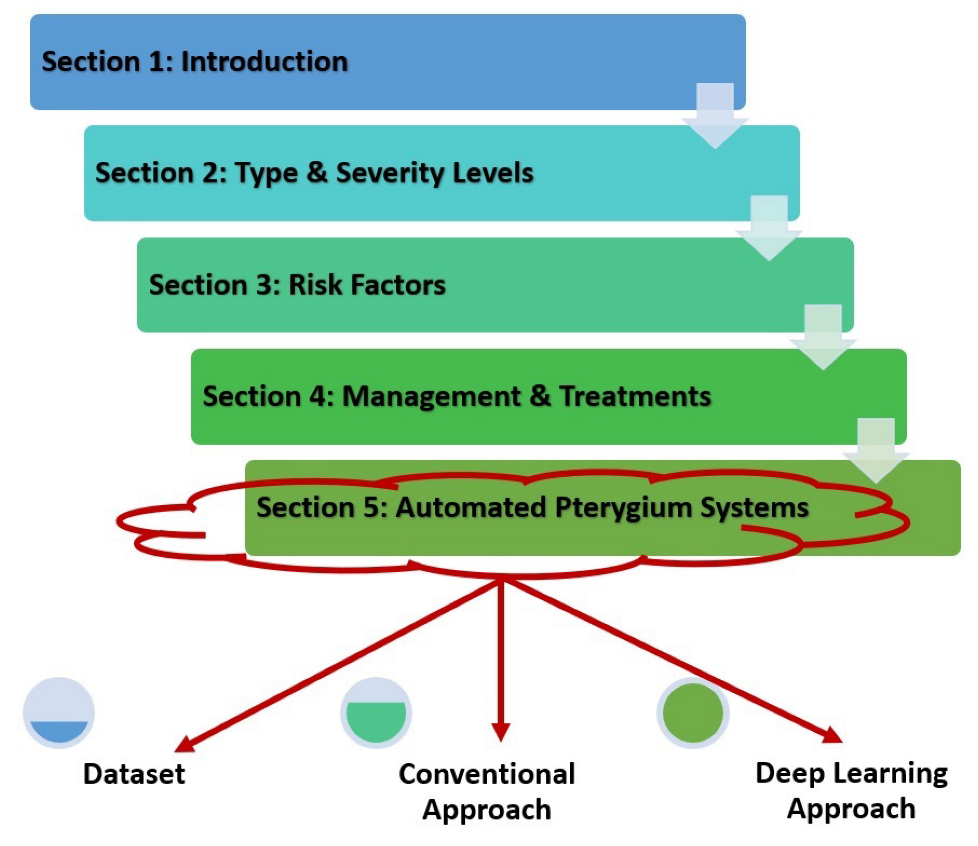
:1. Introduction
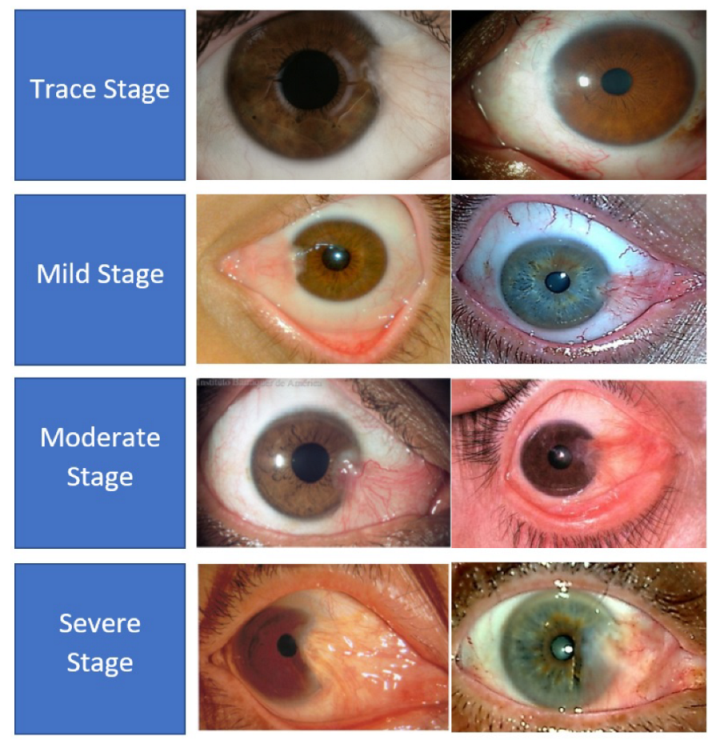
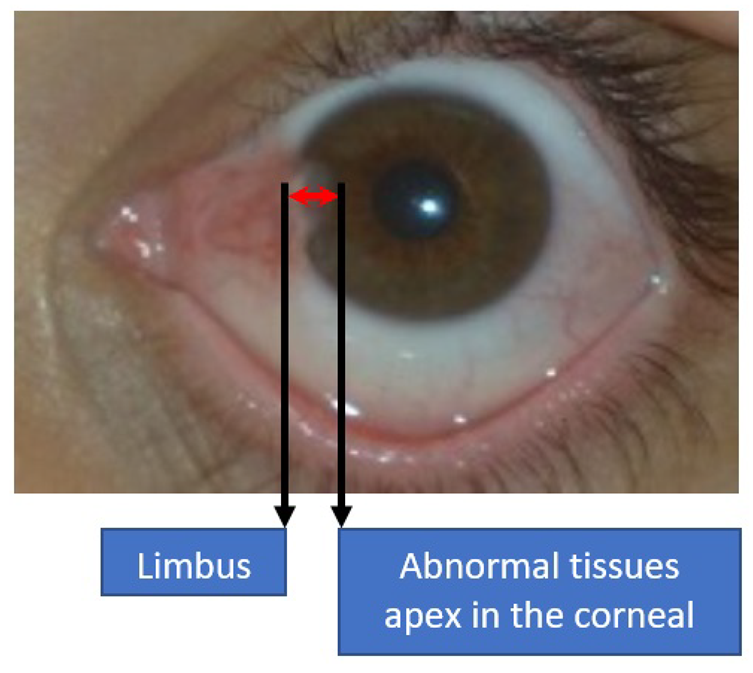
2. Pterygium Type and Severity Levels
3. Pterygium Risk Factors
4. Pterygium Management and Treatment
5. Automated Pterygium Detection and Localization
5.1. Dataset
5.2. Conventional Approach to Automated Pterygium System
5.3. Deep Learning Approach to Automated Pterygium System
6. Conclusions and Future Works
- 1
- Development of a comprehensive lesion dataset that can be used to determine the severity level. The current research focuses on identifying the severity level, without performing exact measurement of the lesions’ encroachment onto the corneal region. Even with the combination of the dataset from both Abdani et al. [33] and Cai et al. [23], the total annotated lesion data amounts to only 810 images, which is far from the ideal number of training data.
- 2
- Data augmentation through synthetically generated images using generative adversarial network (GAN). At present, none of the research has implemented GAN to augment the training data. Based on past research, only the explicit transformation of the original data through rotation and blurring functions has been implemented to increase the number of training data. The synthetic data can be generated according to the specific label by using conditional GAN to balance out the number of training data between various classes [53].
- 3
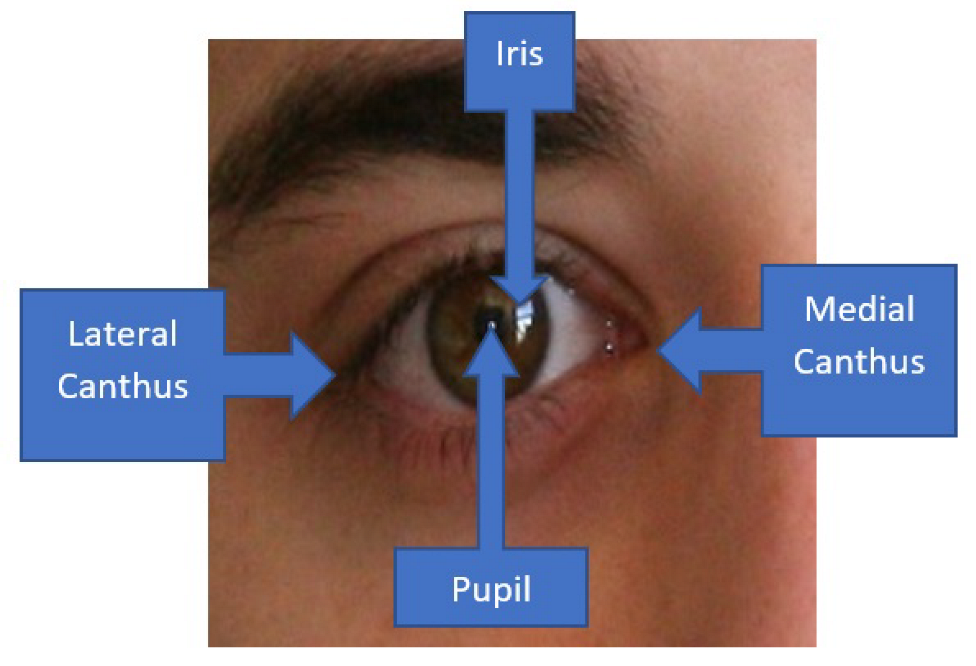
- Integrate an attention mechanism into the classification and segmentation networks, whereby the lesions are normally observed at certain locations. The likelihood of pterygium tissue to originate from the medial canthus is also higher compared to the lateral canthus, which indicates that certain regions should be emphasized more compared to others. The attention mechanism will allocate more weight towards specific locations on the image and, hence, increase the likelihood of accurate classification and segmentation.
Author Contributions
Funding
Institutional Review Board Statement
Informed Consent Statement
Data Availability Statement
Conflicts of Interest
Abbreviations
| IoU | Intersection over Union |
| CNN | Convolutional Neural Networks |
| SVM | Support Vector Machines |
| ANN | Artificial Neural Networks |
| GAN | Generative Adversarial Networks |
| JPEG | Joint Photographic Experts Group |
References
- Denion, E.; Chambaz, A.; Dalens, P.H.; Petitbon, J.; Gérard, M. Plica semilunaris temporal ectopia: Evidence of primary nasal pterygia traction. Cornea 2007, 26, 769–777. [Google Scholar] [CrossRef] [PubMed]
- Hall, A.B. Understanding and managing pterygium. Community Eye Health 2016, 29, 54. [Google Scholar] [PubMed]
- Liu, L.; Wu, J.; Geng, J.; Yuan, Z.; Huang, D. Geographical prevalence and risk factors for pterygium: A systematic review and meta-analysis. BMJ Open 2013, 3, e003787. [Google Scholar] [CrossRef] [PubMed]
- Zulkifley, M.A.; Abdani, S.R.; Zulkifley, N.H. Pterygium-Net: A deep learning approach to pterygium detection and localization. Multimed. Tools Appl. 2019, 78, 34563–34584. [Google Scholar] [CrossRef]
- Safi, H.; Kheirkhah, A.; Mahbod, M.; Molaei, S.; Hashemi, H.; Jabbarvand, M. Correlations between histopathologic changes and clinical features in pterygia. J. Ophthalmic Vis. Res. 2016, 11, 153. [Google Scholar] [CrossRef]
- Huang, P.; Huang, J.; Tepelus, T.; Maram, J.; Sadda, S.; Lee, O.L. Validity of a new comprehensive pterygia grading scale for use in clinical research and clinical trial. Int. Ophthalmol. 2018, 38, 2303–2311. [Google Scholar] [CrossRef]
- Abdani, S.R.; Zulkifley, M.A.; Zulkifley, N.H. Group and Shuffle Convolutional Neural Networks with Pyramid Pooling Module for Automated Pterygium Segmentation. Diagnostics 2021, 11, 1104. [Google Scholar] [CrossRef]
- Zhong, H.; Cha, X.; Wei, T.; Lin, X.; Li, X.; Li, J.; Cai, N.; Li, J.; Su, X.; Yang, Y.; et al. Prevalence of and risk factors for pterygium in rural adult chinese populations of the Bai nationality in Dali: The Yunnan Minority Eye Study. Investig. Ophthalmol. Vis. Sci. 2012, 53, 6617–6621. [Google Scholar] [CrossRef]
- Jiao, W.; Zhou, C.; Wang, T.; Yang, S.; Bi, H.; Liu, L.; Li, Y.; Wang, L. Prevalence and risk factors for pterygium in rural older adults in Shandong Province of China: A cross-sectional study. Biomed Res. Int. 2014, 2014, 658648. [Google Scholar] [CrossRef]
- Wang, Y.; Shan, G.; Gan, L.; Qian, Y.; Chen, T.; Wang, H.; Pan, X.; Wang, W.; Pan, L.; Zhang, X.; et al. Prevalence and associated factors for pterygium in Han and Mongolian adults: A cross-sectional study in inner Mongolian, China. BMC Ophthalmol. 2020, 20, 1–14. [Google Scholar] [CrossRef] [Green Version]
- Malekifar, P.; Esfandiari, H.; Behnaz, N.; Javadi, F.; Azish, S.; Javadi, M.A.; Kalantarion, M. Risk factors for pterygium in Ilam Province, Iran. J. Ophthalmic Vis. Res. 2017, 12, 270. [Google Scholar] [PubMed]
- Cajucom-Uy, H.; Tong, L.; Wong, T.Y.; Tay, W.T.; Saw, S.M. The prevalence of and risk factors for pterygium in an urban Malay population: The Singapore Malay Eye Study (SiMES). Br. J. Ophthalmol. 2010, 94, 977–981. [Google Scholar] [CrossRef] [PubMed]
- Fekadu, S.A.; Assem, A.S.; Adimassu, N.F. Prevalence of pterygium and its associated factors among adults aged 18 years and above in Gambella town, Southwest Ethiopia, May 2019. PLoS ONE 2020, 15, e0237891. [Google Scholar] [CrossRef] [PubMed]
- West, S.; Munoz, B. Prevalence of pterygium in Latinos: Proyecto VER. Br. J. Ophthalmol. 2009, 93, 1287–1290. [Google Scholar] [CrossRef]
- Bahuva, A.; Rao, S.K. Current concepts in management of pterygium. Off. Sci. J. Delhi Ophthalmol. Soc. 2015, 25, 78–84. [Google Scholar]
- Rock, T.; Bartz-Schmidt, K.U.; Röck, D. Management of double-head pterygium with conjunctival autograft and primary closure. Int. Med Case Rep. J. 2020, 13, 111. [Google Scholar] [CrossRef] [Green Version]
- Aminlari, A.; Singh, R.; Liang, D. Management of Pterygium; EyeNet Magazine: San Francisco, CA, USA, 2021. [Google Scholar]
- Janson, B.J.; Sikder, S. Surgical management of pterygium. Ocul. Surf. 2014, 12, 112–119. [Google Scholar] [CrossRef]
- Zaki, W.; Daud, M.; Abdani, S.; Hussain, A.; Mutalib, H. Automated pterygium detection method of anterior segment photographed images. Comput. Methods Programs Biomed. 2018, 154, 71–78. [Google Scholar] [CrossRef]
- Zulkifley, M.A.; Mustafa, M.M.; Hussain, A.; Mustapha, A.; Ramli, S. Robust identification of polyethylene terephthalate (PET) plastics through bayesian decision. PLoS ONE 2014, 9, e114518. [Google Scholar] [CrossRef] [Green Version]
- Yi, X.; Walia, E.; Babyn, P. Generative adversarial network in medical imaging: A review. Med Image Anal. 2019, 58, 101552. [Google Scholar] [CrossRef] [Green Version]
- Fang, X.; Deshmukh, M.; Chee, M.L.; Soh, Z.D.; Teo, Z.L.; Thakur, S.; Goh, J.H.L.; Liu, Y.C.; Husain, R.; Mehta, J.; et al. Deep learning algorithms for automatic detection of pterygium using anterior segment photographs from slit-lamp and hand-held cameras. Br. J. Ophthalmol. 2021, 1136. [Google Scholar] [CrossRef] [PubMed]
- Cai, W.; Xu, J.; Wang, K.; Liu, X.; Xu, W.; Cai, H.; Gao, Y.; Su, Y.; Zhang, M.; Zhu, J.; et al. EyeHealer: A large-scale anterior eye segment dataset with eye structure and lesion annotations. Precis. Clin. Med. 2021, 4, 85–92. [Google Scholar] [CrossRef]
- Bernard, O.; Lalande, A.; Zotti, C.; Cervenansky, F.; Yang, X.; Heng, P.A.; Cetin, I.; Lekadir, K.; Camara, O.; Ballester, M.A.G.; et al. Deep learning techniques for automatic MRI cardiac multi-structures segmentation and diagnosis: Is the problem solved? IEEE Trans. Med Imaging 2018, 37, 2514–2525. [Google Scholar] [CrossRef] [PubMed]
- Hilmi, M.R.; Azemin, M.Z.C.; Kamal, K.M.; Ariffin, A.E. Reliability of Pterygium Redness Grading Software (PRGS) Types of Primary Pterygia Based on Appearance. Sains Malays. 2020, 49, 1015–1020. [Google Scholar] [CrossRef]
- Tan, D.T.; Chee, S.P.; Dear, K.B.; Lim, A.S. Effect of pterygium morphology on pterygium recurrence in a controlled trial comparing conjunctival autografting with bare sclera excision. Arch. Ophthalmol. 1997, 115, 1235–1240. [Google Scholar] [CrossRef] [PubMed]
- Mesquita, R.G.; Figueiredo, E.M. An algorithm for measuring pterygium’s progress in already diagnosed eyes. In Proceedings of the 2012 IEEE International Conference on Acoustics, Speech and Signal Processing (ICASSP), Kyoto, Japan, 25–30 March 2012; pp. 733–736. [Google Scholar]
- Gao, X.; Wong, D.W.K.; Aryaputera, A.W.; Sun, Y.; Cheng, C.Y.; Cheung, C.; Wong, T.Y. Automatic pterygium detection on cornea images to enhance computer-aided cortical cataract grading system. In Proceedings of the 2012 Annual International Conference of the IEEE Engineering in Medicine and Biology Society, San Diego, CA, USA, 28 August–1 September 2012; pp. 4434–4437. [Google Scholar]
- Minami, K.; Miyata, K.; Otani, A.; Tokunaga, T.; Tokuda, S.; Amano, S. Detection of increase in corneal irregularity due to pterygium using Fourier series harmonic analyses with multiple diameters. Jpn. J. Ophthalmol. 2018, 62, 342–348. [Google Scholar] [CrossRef]
- Azemin, M.Z.C.; Gaffur, N.A.; Hilmi, M.R.; Tamrin, M.I.M.; Kamal, K.M. Benchmarked pterygium images for human and machine graders. J. Eng. Appl. Sci. 2016, 11, 2378–2382. [Google Scholar]
- Jais, F.N.; Che Azemin, M.Z.; Hilmi, M.R.; Mohd Tamrin, M.I.; Kamal, K.M. Postsurgery Classification of Best-Corrected Visual Acuity Changes Based on Pterygium Characteristics Using the Machine Learning Technique. Sci. World J. 2021, 2021, 6211006. [Google Scholar] [CrossRef]
- Radzi, H.M.; Khairidzan, M.K.; Zulfaezal, C.A.M.; Azrin, E.A. Corneo-pterygium total area measurements utilising image analysis method. J. Optom. 2019, 12, 272–277. [Google Scholar] [CrossRef]
- Abdani, S.R.; Zulkifley, M.A.; Moubark, A.M. Pterygium Tissues Segmentation using Densely Connected DeepLab. In Proceedings of the 2020 IEEE 10th Symposium on Computer Applications Industrial Electronics (ISCAIE), Malaysia, 18–19 April 2020; pp. 229–232. [Google Scholar]
- Lopez, Y.P.; Aguilera, L.R. Automatic classification of pterygium-non pterygium images using deep learning. In ECCOMAS Thematic Conference on Computational Vision and Medical Image Processing; Springer: Cham, Switzerland, 2019; pp. 391–400. [Google Scholar]
- Abdani, S.R.; Zulkifley, M.A.; Hussain, A. Compact convolutional neural networks for pterygium classification using transfer learning. In Proceedings of the 2019 IEEE International Conference on Signal and Image Processing Applications (ICSIPA), Kuala Lumpur, Malaysia, 17–19 September 2019; pp. 140–143. [Google Scholar]
- Srivastava, N.; Hinton, G.; Krizhevsky, A.; Sutskever, I.; Salakhutdinov, R. Dropout: A Simple Way to Prevent Neural Networks from Overfitting. J. Mach. Learn. Res. 2014, 15, 1929–1958. [Google Scholar]
- Chatfield, K.; Simonyan, K.; Vedaldi, A.; Zisserman, A. Return of the Devil in the Details: Delving Deep into Convolutional Networks. arXiv 2014, arXiv:1405.3531. [Google Scholar]
- Zheng, B.; Liu, Y.; He, K.; Wu, M.; Jin, L.; Jiang, Q.; Zhu, S.; Hao, X.; Wang, C.; Yang, W. Research on an Intelligent Lightweight-Assisted Pterygium Diagnosis Model Based on Anterior Segment Images. Dis. Markers 2021, 2021, 7651462. [Google Scholar] [CrossRef] [PubMed]
- Howard, A.G.; Zhu, M.; Chen, B.; Kalenichenko, D.; Wang, W.; Weyand, T.; Andreetto, M.; Adam, H. MobileNets: Efficient Convolutional Neural Networks for Mobile Vision Applications. arXiv 2017, arXiv:1704.04861. [Google Scholar]
- Krizhevsky, A.; Sutskever, I.; Hinton, G.E. ImageNet Classification with Deep Convolutional Neural Networks. In Proceedings of the 25th International Conference on Neural Information Processing Systems—Volume 1, Lake Tahoe, Nevada, 3–6 December 2012; Curran Associates Inc.: Red Hook, NY, USA, 2012; pp. 1097–1105. [Google Scholar]
- Simonyan, K.; Zisserman, A. Very Deep Convolutional Networks for Large-Scale Image Recognition; Technical Report; University of Oxford: Oxford, UK, 2014. [Google Scholar]
- He, K.; Zhang, X.; Ren, S.; Sun, J. Deep Residual Learning for Image Recognition. In Proceedings of the IEEE Conference on Computer Vision and Pattern Recognition (CVPR), Boston, MA, USA, 7–12 June 2015. [Google Scholar]
- Xu, W.; Jin, L.; Zhu, P.Z.; He, K.; Yang, W.H.; Wu, M.N. Implementation and Application of an Intelligent Pterygium Diagnosis System Based on Deep Learning. Front. Psychol. 2021, 12, 759229. [Google Scholar] [CrossRef]
- Tan, M.; Le, Q. Efficientnet: Rethinking model scaling for convolutional neural networks. In Proceedings of the 36th International Conference on Machine Learning, Long Beach, CA, USA, 9–15 June 2019; pp. 6105–6114. [Google Scholar]
- Chen, L.C.; Papandreou, G.; Kokkinos, I.; Murphy, K.; Yuille, A.L. Semantic Image Segmentation with Deep Convolutional Nets and Fully Connected CRFs. arXiv 2014, arXiv:1412.7062. [Google Scholar]
- Chen, L.; Papandreou, G.; Kokkinos, I.; Murphy, K.; Yuille, A.L. DeepLab: Semantic Image Segmentation with Deep Convolutional Nets, Atrous Convolution, and Fully Connected CRFs. IEEE Trans. Pattern Anal. Mach. Intell. 2018, 40, 834–848. [Google Scholar] [CrossRef] [Green Version]
- Jegou, S.; Drozdzal, M.; Vazquez, D.; Romero, A.; Bengio, Y. The One Hundred Layers Tiramisu: Fully Convolutional DenseNets for Semantic Segmentation. In Proceedings of the 2017 IEEE Conference on Computer Vision and Pattern Recognition Workshops (CVPRW), Honolulu, HI, USA, 21–26 July 2017; pp. 1175–1183. [Google Scholar] [CrossRef] [Green Version]
- Zhao, H.; Shi, J.; Qi, X.; Wang, X.; Jia, J. Pyramid Scene Parsing Network. In Proceedings of the 2017 IEEE Conference on Computer Vision and Pattern Recognition (CVPR), Honolulu, HI, USA, 21–26 July 2017; pp. 6230–6239. [Google Scholar] [CrossRef] [Green Version]
- Sun, K.; Zhao, Y.; Jiang, B.; Cheng, T.; Xiao, B.; Liu, D.; Mu, Y.; Wang, X.; Liu, W.; Wang, J. High-resolution representations for labeling pixels and regions. arXiv 2019, arXiv:1904.04514. [Google Scholar]
- Devalla, S.K.; Renukanand, P.K.; Sreedhar, B.K.; Subramanian, G.; Zhang, L.; Perera, S.; Mari, J.M.; Chin, K.S.; Tun, T.A.; Strouthidis, N.G.; et al. DRUNET: A dilated-residual U-Net deep learning network to segment optic nerve head tissues in optical coherence tomography images. Biomed. Opt. Express 2018, 9, 3244–3265. [Google Scholar] [CrossRef] [Green Version]
- Badrinarayanan, V.; Kendall, A.; Cipolla, R. SegNet: A Deep Convolutional Encoder-Decoder Architecture for Image Segmentation. IEEE Trans. Pattern Anal. Mach. Intell. 2017, 39, 2481–2495. [Google Scholar] [CrossRef]
- Chen, L.C.; Zhu, Y.; Papandreou, G.; Schroff, F.; Adam, H. Encoder-Decoder with Atrous Separable Convolution for Semantic Image Segmentation. In Computer Vision–ECCV 2018; Ferrari, V., Hebert, M., Sminchisescu, C., Weiss, Y., Eds.; Springer International Publishing: Cham, Seitzerland, 2018; pp. 833–851. [Google Scholar]
- Zulkifley, M.A.; Abdani, S.R.; Zulkifley, N.H. COVID-19 Screening using a Lightweight Convolutional Neural Networks with Generative Adversarial Network Data Augmentation. Symmetry 2020, 12, 1530. [Google Scholar] [CrossRef]


| Study | Publication Year | Sample Size | Study Location | Risk Factors |
|---|---|---|---|---|
| West and Munoz [14] | 2009 | 4774 | Arizona, USA | Low income, low educational status, and exposure to sunlight |
| Cajucom-Uy et al. [12] | 2010 | 3282 | Singapore | Increasing age, male, outdoor occupation, and systemic factors |
| Zhong et al. [8] | 2012 | 2133 | Dali, China | Increasing age, lack of formal education, and outdoor occupation |
| Jiao et al. [9] | 2014 | 17,816 | Shangdong Province, China | Older age, outdoor time, educational level, and usage of sunglasses |
| Malefikar et al. [11] | 2017 | 420 | Ilam Province, Iran | Family history of pterygium, cigarette smoking, history of baking, age, and severe blepharitis |
| Wang et al. [10] | 2020 | 2651 | Inner Mongolia, China | Age, outdoor occupation, and time spent in rural areas |
| Fekadu et al. [13] | 2020 | 400 | Gambella, Ethiopia | Male, outdoor occupation, and exposure to sunlight |
| Sources | No. of Samples | Resolution | Format | Iris Colors |
|---|---|---|---|---|
| Australian Pterygium | 30 | 4064 × 2704 | JPEG | Blue and Brown |
| Brazil Pterygium | 30 | 308 × 231 | JPEG | Blue and Brown |
| MILES | 30 | 1747 × 1180 | JPEG | Blue |
| UBIRIS | 30 | 200 × 150 | JPEG | Brown |
| Study | Task | Sample Size | Strength | Weakness |
|---|---|---|---|---|
| Hilmi et al. [25] | Severity grading | 93 pterygium images | Three-class problem; atrophic, intermediate, and fleshy | Relies only on redness information |
| Mesquita and Figueiredo [27] | Tissue growth progress | 58 pterygium images | Good segmentation even if the iris and pterygium tissues look similar in color | Circular Hugh transform only works if the gaze is perpendicular to the camera |
| Gao et al. [28] | Classification: pterygium and non-pterygium | 30 pterygium images and 854 non-pterygium images | Utilizes unique Fisher channel | Too many deterministic thresholds, which will not work when tested on different iris colors |
| Minami et al. [29] | Tissue growth progress | 456 pterygium images | Fourier frequency analysis to represent the growth ring of pterygium tissues | Only six quantized levels to represent the tissue growth |
| Azemin et al. [30] | Severity grading | 68 pterygium images | Utilizes compact ANN with five features as input | Relies heavily only color information without looking at pterygium tissue textures |
| Zaki et al. [19] | Classification: Pterygium and normal | 60 pterygium images and 60 healthy eye images | Gradient-based lesion extraction, which is robust to various iris colors | Their dataset is skewed, whereby the healthy data were captured in a more standardized condition |
| Jais et al. [31] | Severity grading | 93 pterygium images | Analyzes multiple conventional machine learning classifiers | No cross-validation, test dataset comprises only 9 images |
| Radzi et al. [32] | Lesion segmentation | 120 pterygium images | Introduces pixel-based ratio between lesions and non-lesions to determine severity level | Smooth lesion boundary, which is not accurate for most cases |
| Study | Task | Sample Size | Strength | Weakness |
|---|---|---|---|---|
| Lopez and Aquilera [34] | Classifi-cation | 325 pterygium images and 2692 healthy eye images | Perform data augmentation to balance training dataset | A single convolutional layer only |
| Abdani et al. [35] | Classifi-cation | 60 pterygium images and 60 healthy eye images | Analyze various regularization methods and implement transfer learning | Trained using low total number of data |
| Zheng et al. [38] | Classifi-cation | 142 normal images, 144 observed pterygium images, and 150 surgery-required images | Lightweight deep model using MobileNet architectures | Training data are relatively low for training the MobileNet effectively |
| Fang et al. [22] | Classifi-cation | Test data: 217 pterygium images and 6094 healthy eye images | Tested on both slit-lamp and hand-held images | Dataset severely imbalanced with small number of pterygium cases |
| Xu et al. [43] | Classifi-cation | 189 pterygium images, 171 observed pterygium, and 110 surgery-required images | Implement state-of-the-art EfficientNet architecture | Lowest detection for observed pterygium class, even though tested on brown iris color dataset only |
| Pterygium-Net [4] | Locali-zation | 60 pterygium images | Locate the region of pterygium lesions | Bounding box representation is not suitable for slender-shaped tissues |
| Abdani et al. [33] | Segmen-tation | 328 pterygium images | Embed dense feed-forward layer to DeepLab architecture | Dense connection for DeepLab V2 only improves the performance slightly |
| Abdani et al. [7] | Segmen-tation | 328 pterygium images | Embed group and shuffle unit with multi-scale parallel networks | Available dataset is relatively small for complex deep learning architecture |
| EyeHealer [23] | Classifi-cation and Segmentation | 482 pterygium images | Compare with various eye disease | Low number of training data except for cataract and pterygium cases |
Publisher’s Note: MDPI stays neutral with regard to jurisdictional claims in published maps and institutional affiliations. |
© 2022 by the authors. Licensee MDPI, Basel, Switzerland. This article is an open access article distributed under the terms and conditions of the Creative Commons Attribution (CC BY) license (https://creativecommons.org/licenses/by/4.0/).
Share and Cite
Abdani, S.R.; Zulkifley, M.A.; Shahrimin, M.I.; Zulkifley, N.H. Computer-Assisted Pterygium Screening System: A Review. Diagnostics 2022, 12, 639. https://doi.org/10.3390/diagnostics12030639
Abdani SR, Zulkifley MA, Shahrimin MI, Zulkifley NH. Computer-Assisted Pterygium Screening System: A Review. Diagnostics. 2022; 12(3):639. https://doi.org/10.3390/diagnostics12030639
Chicago/Turabian StyleAbdani, Siti Raihanah, Mohd Asyraf Zulkifley, Mohamad Ibrani Shahrimin, and Nuraisyah Hani Zulkifley. 2022. "Computer-Assisted Pterygium Screening System: A Review" Diagnostics 12, no. 3: 639. https://doi.org/10.3390/diagnostics12030639
APA StyleAbdani, S. R., Zulkifley, M. A., Shahrimin, M. I., & Zulkifley, N. H. (2022). Computer-Assisted Pterygium Screening System: A Review. Diagnostics, 12(3), 639. https://doi.org/10.3390/diagnostics12030639