
Development of Mia Phenotyping Using Paper-Based Device

 ,
,
Abstract
1. Introduction
2. Materials and Methods
2.1. Study Design
2.2. Chemical and Material Used
2.3. Fabrication of Paper-Based and 3D-Printed Cassette
2.4. Analysis Criteria
2.5. Validation of Mia Typing Using Real Samples
2.6. PCR-SSP for Mia Genotyping
2.7. Statistical Analysis
3. Results
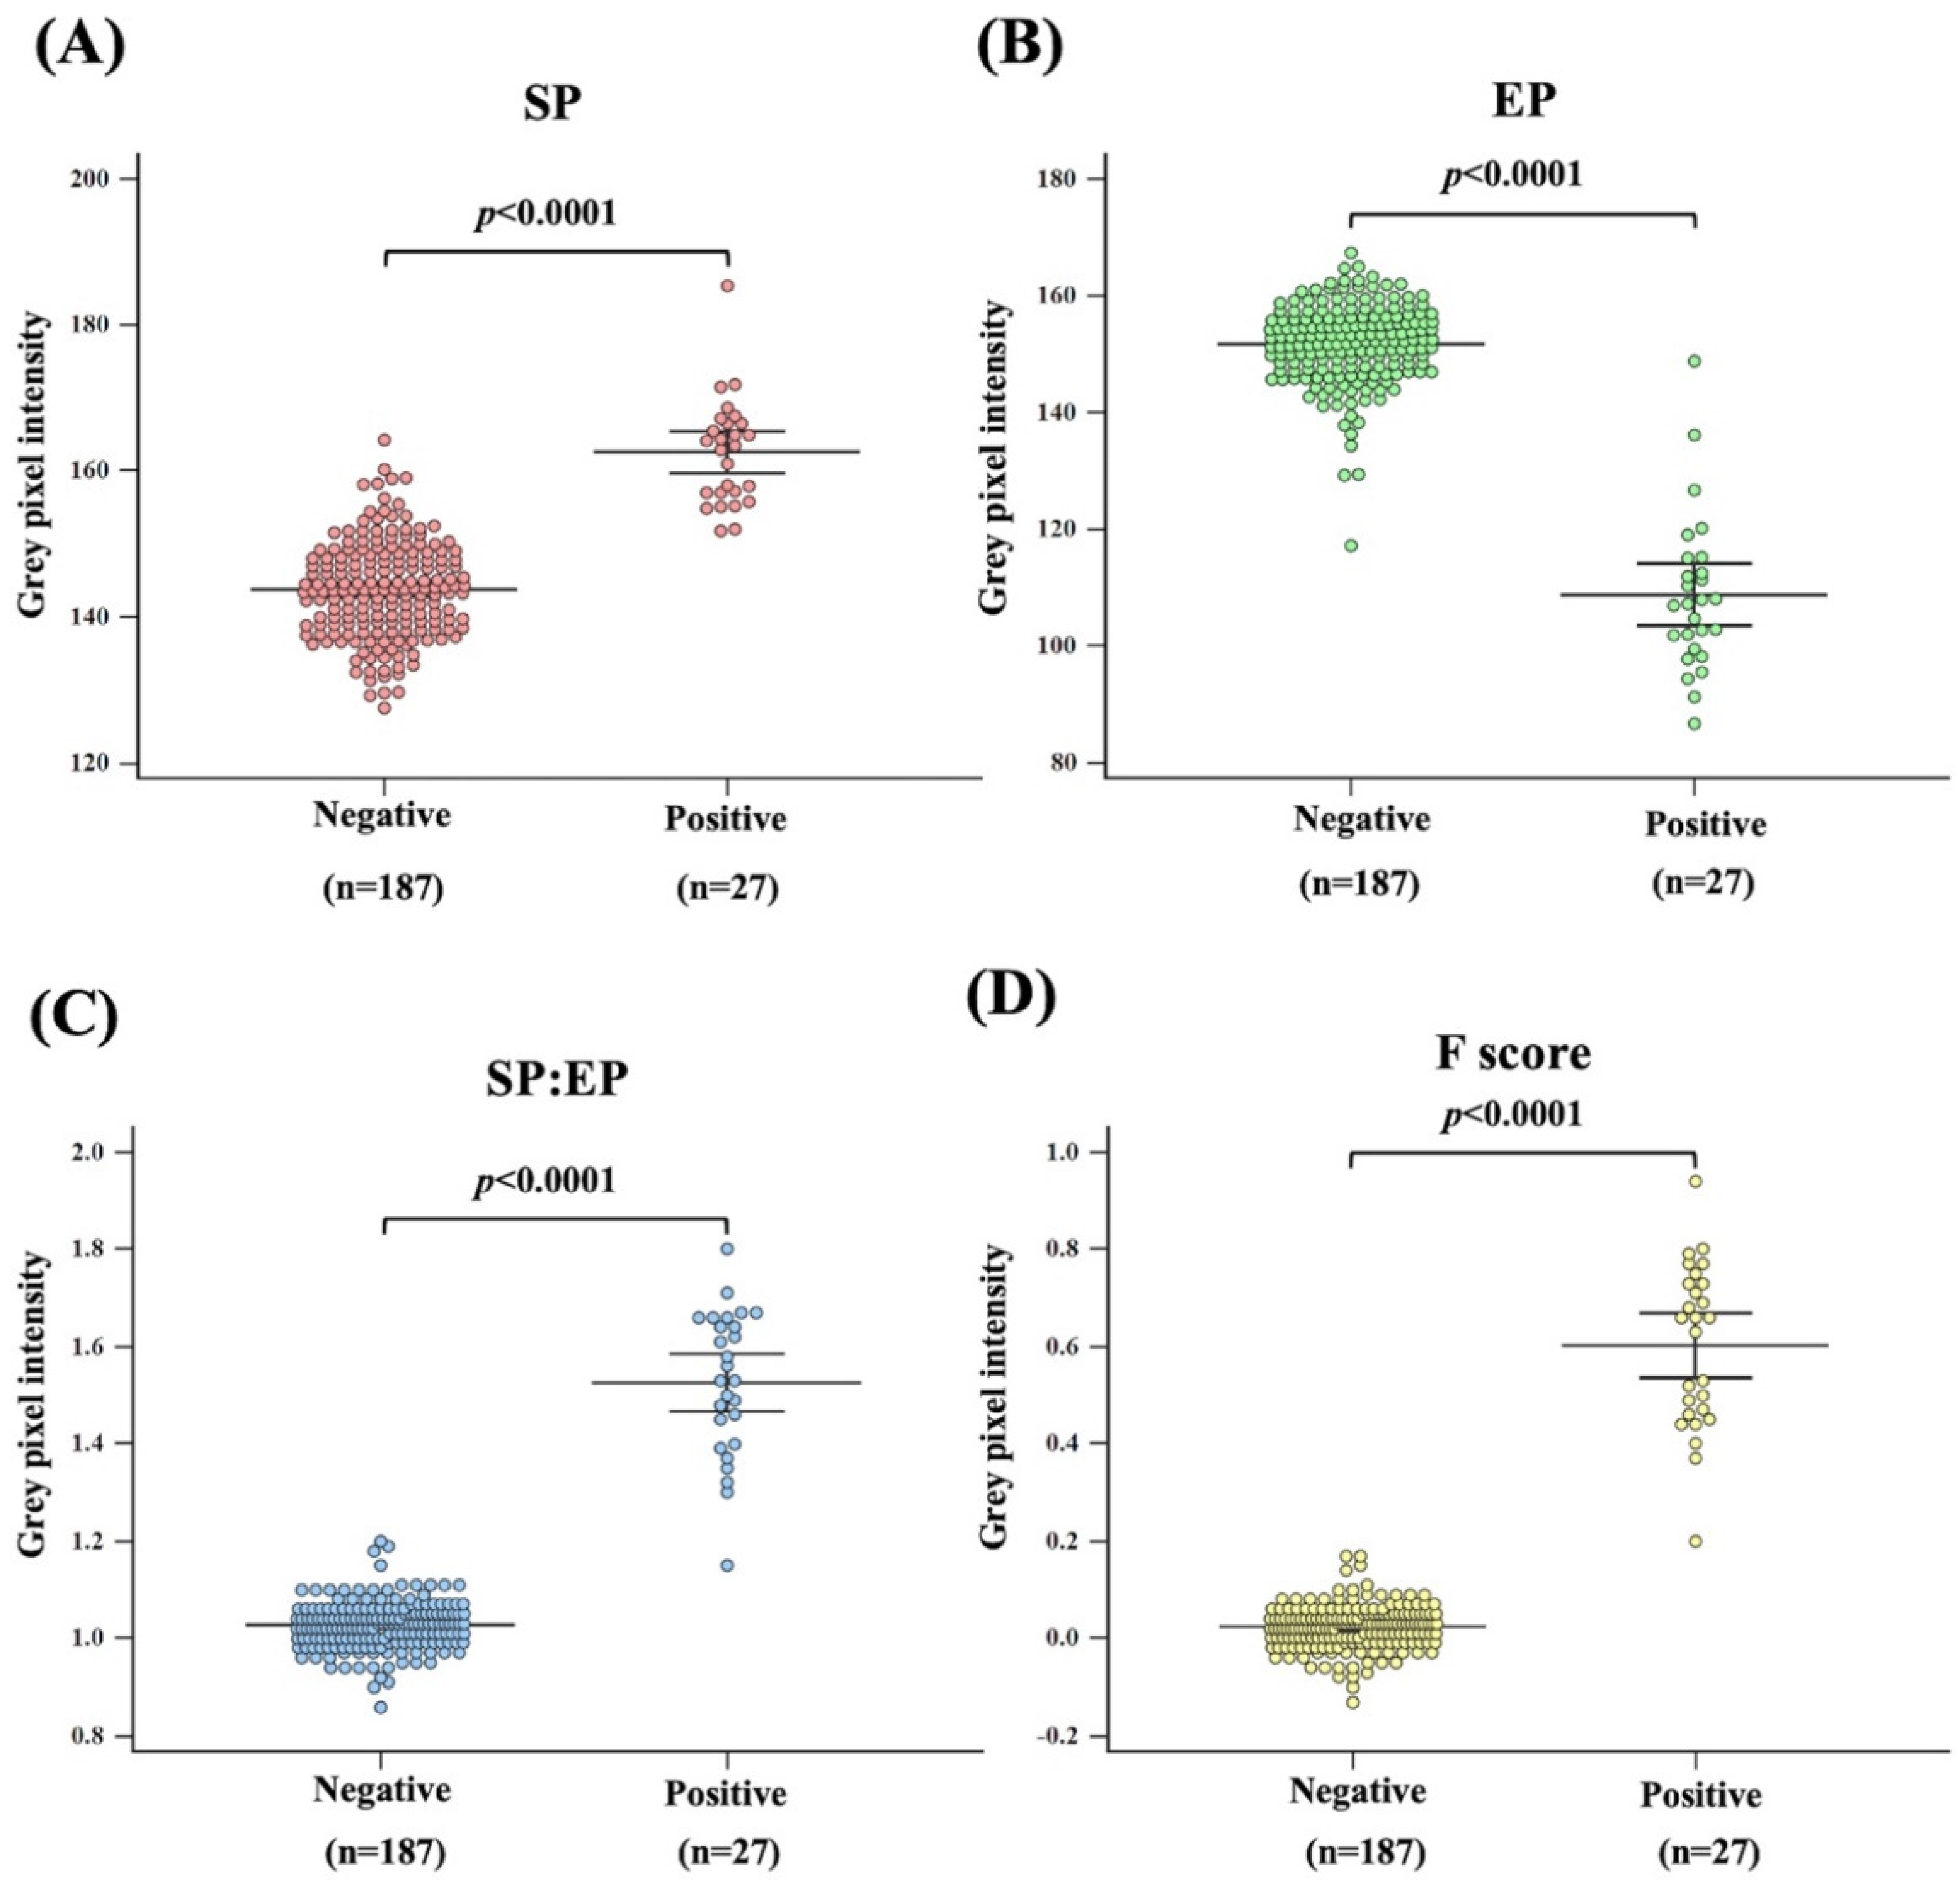
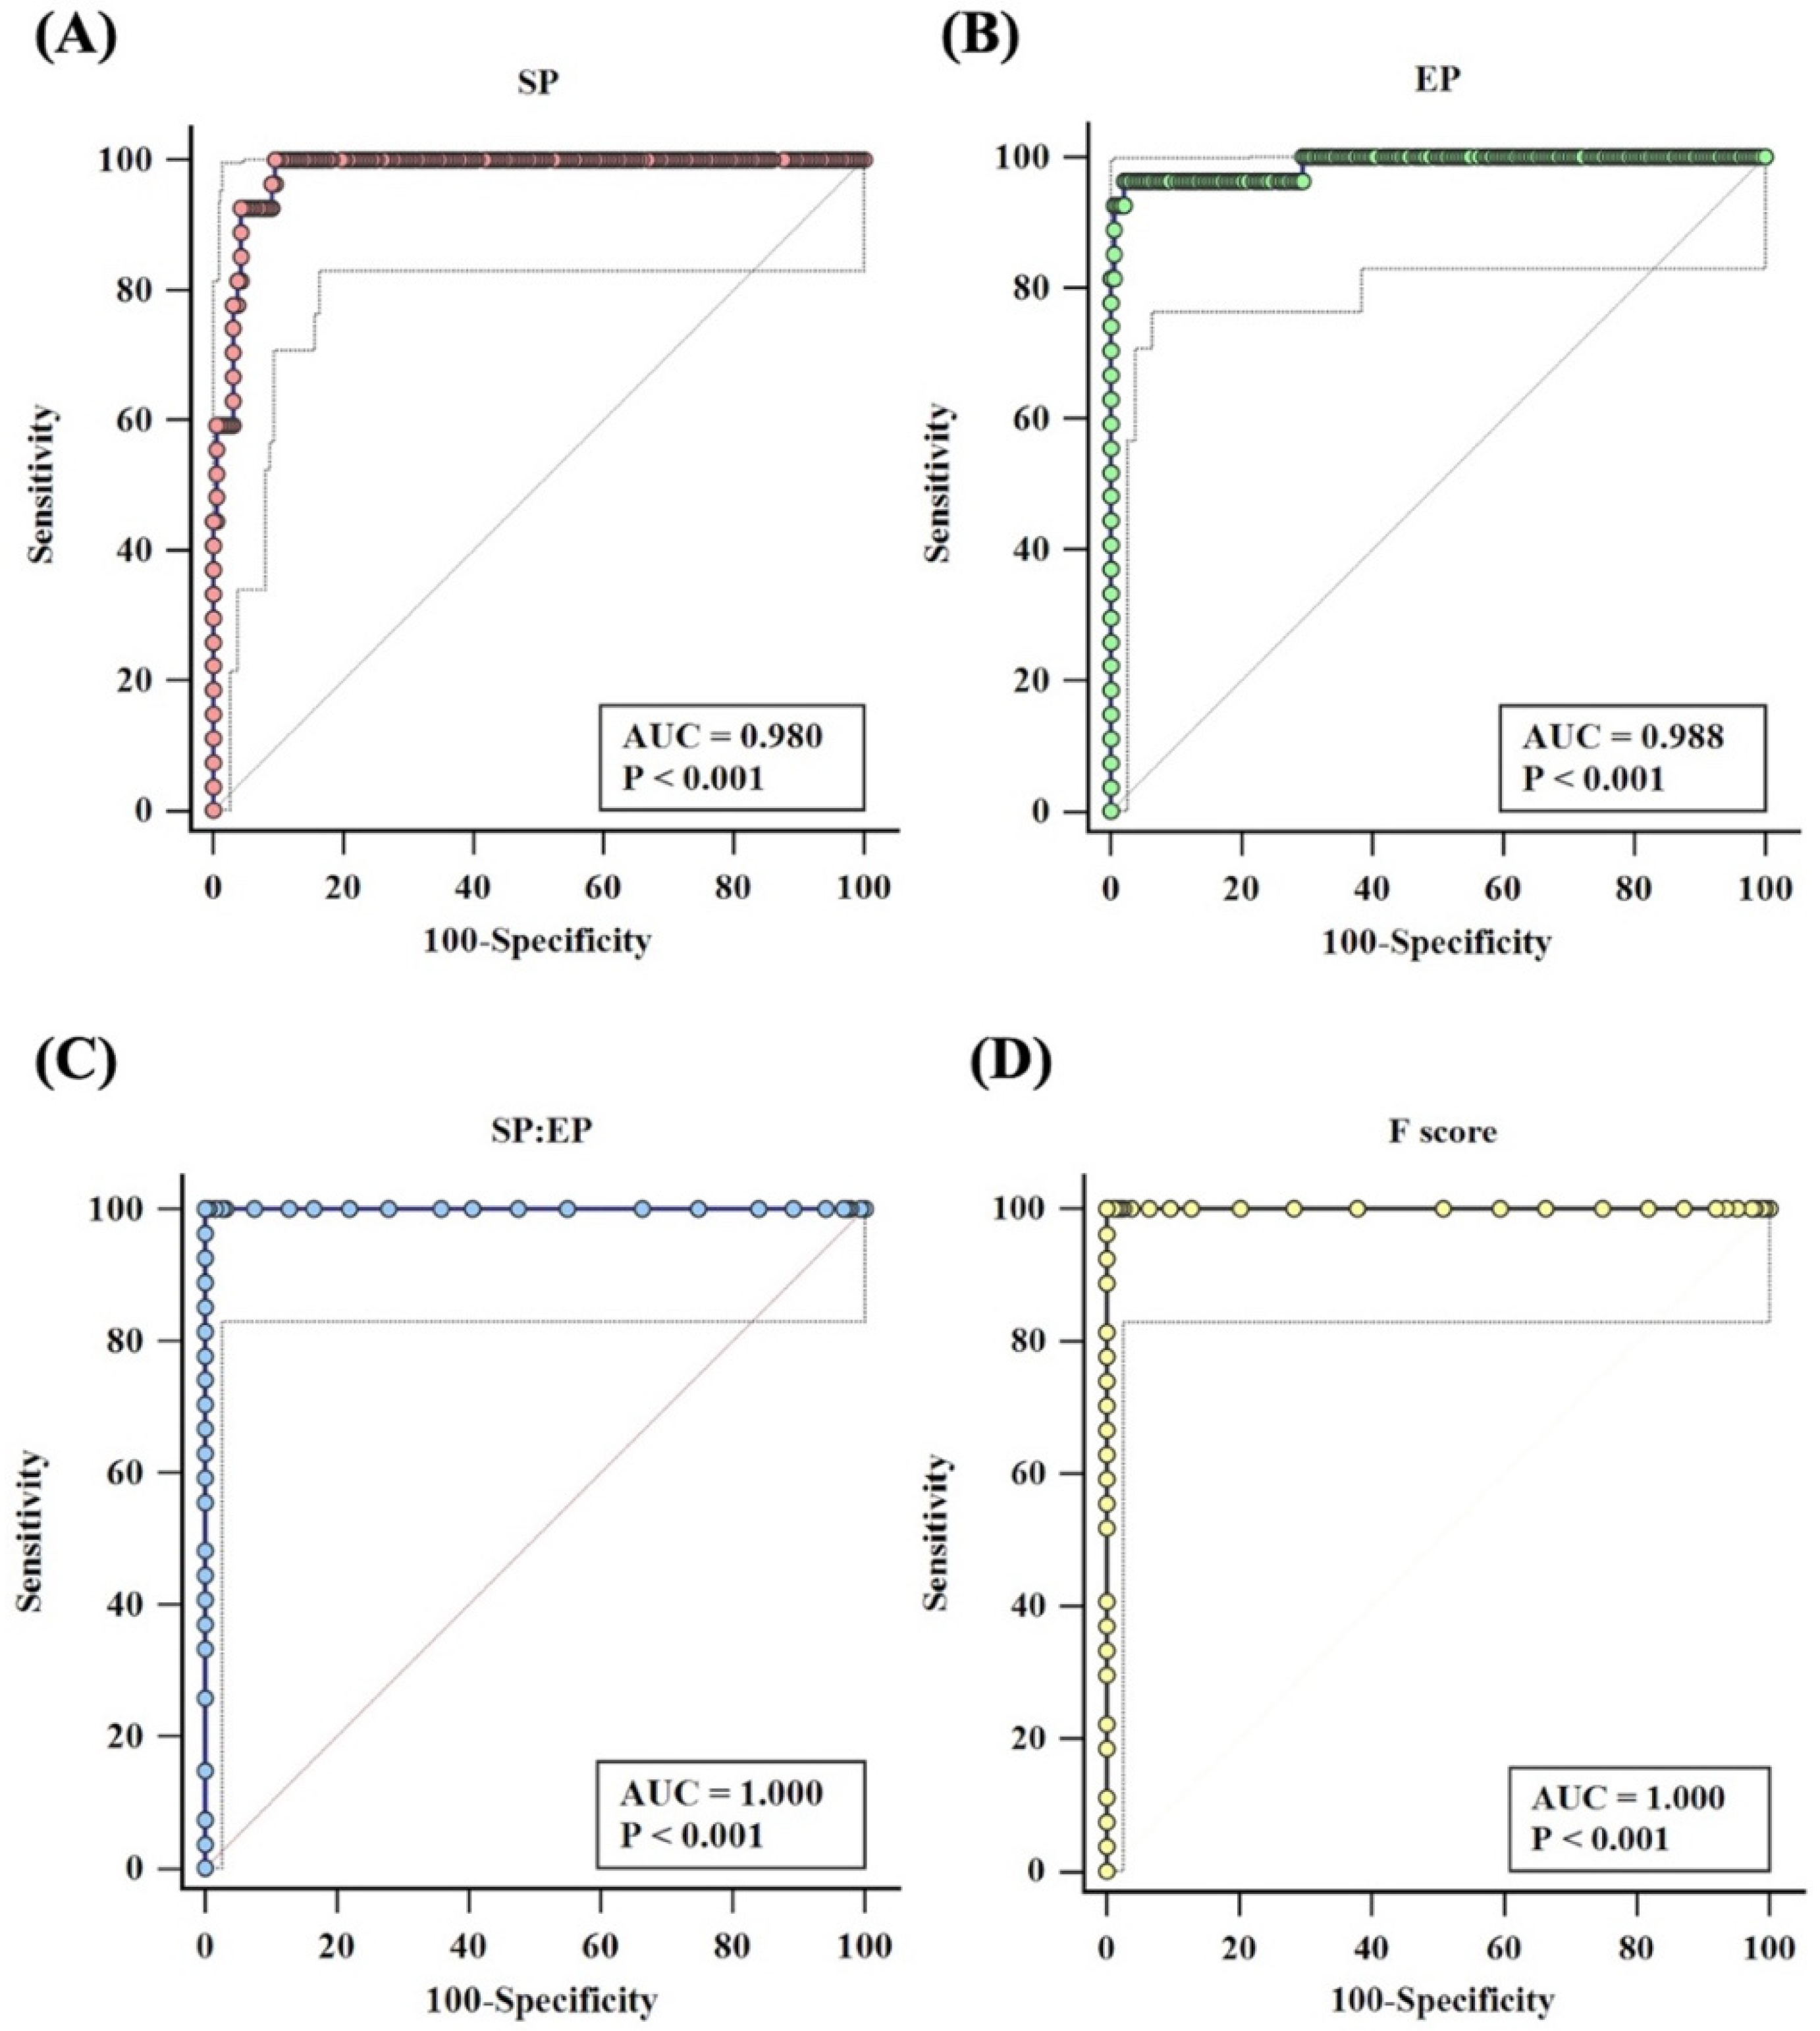
3.1. Analysis Criteria
3.2. Validation of Mia Typing Using Real Samples
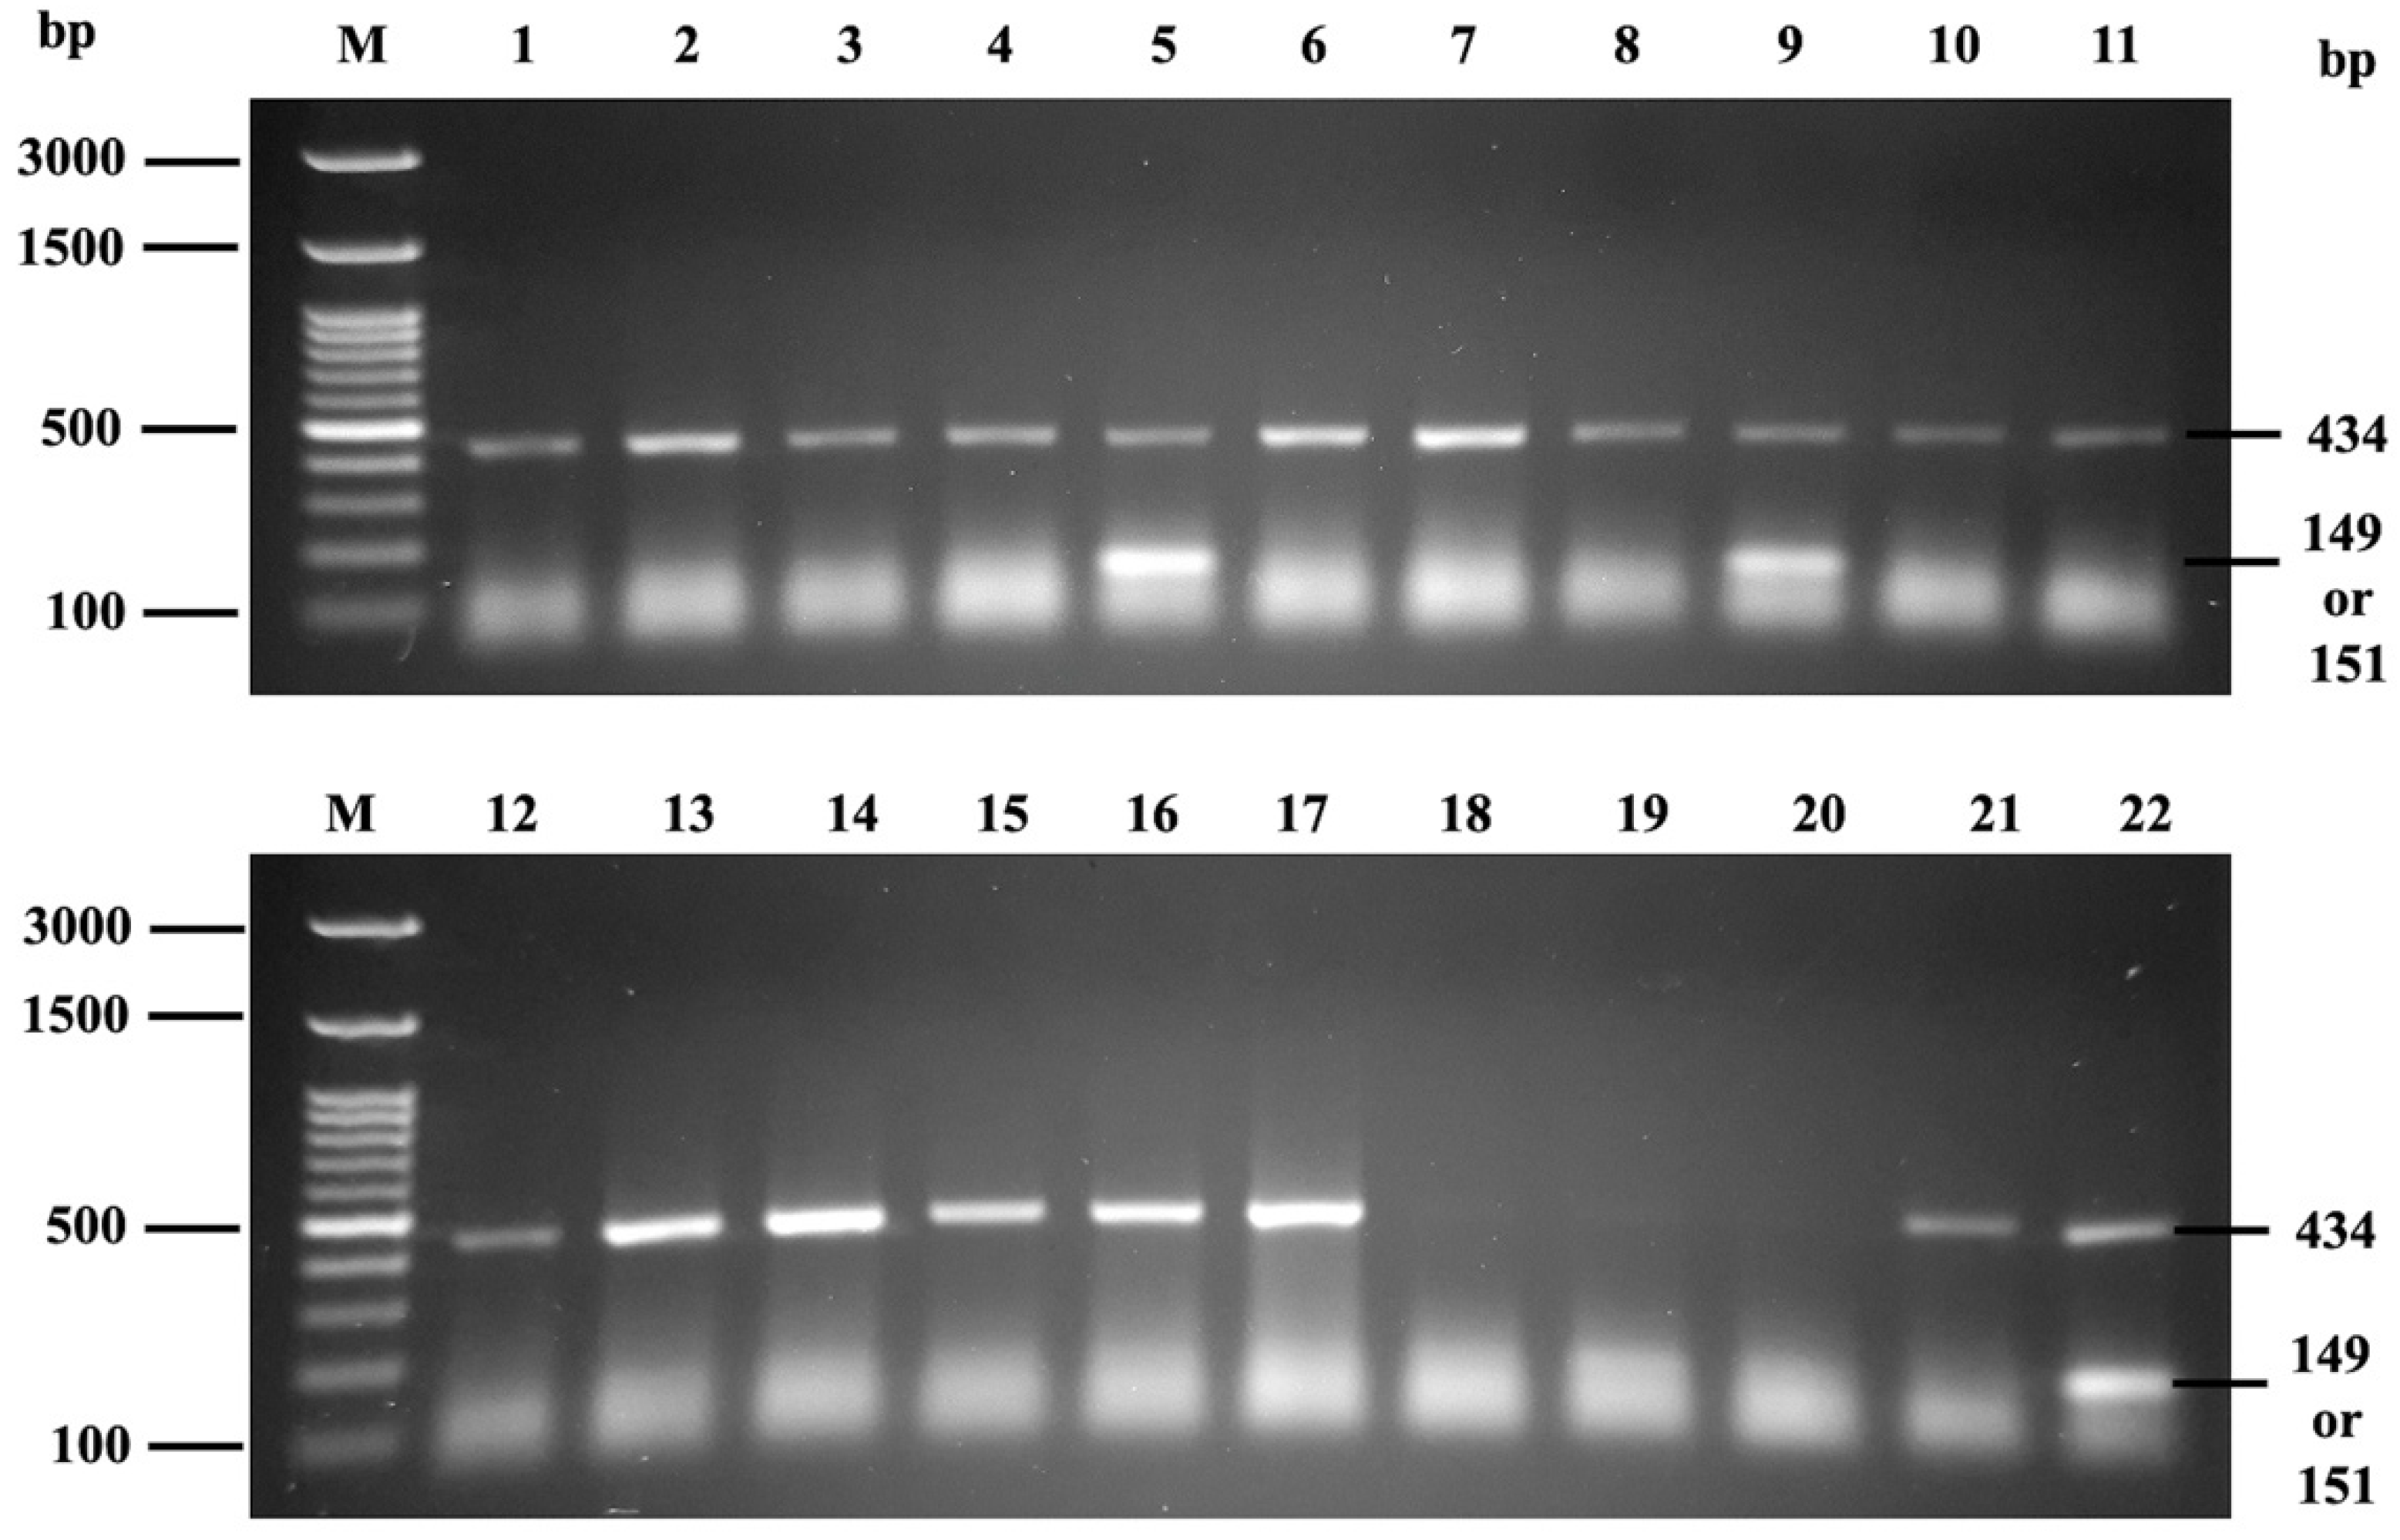
3.3. Phenotype-Genotype Correlation Using PCR-SSP
4. Discussion
5. Conclusions
Supplementary Materials
Author Contributions
Funding
Institutional Review Board Statement
Informed Consent Statement
Data Availability Statement
Acknowledgments
Conflicts of Interest
References
- Lopez, G.H.; Wilson, B.; Turner, R.M.; Millard, G.M.; Fraser, N.S.; Roots, N.M.; Liew, Y.W.; Hyland, C.A.; Flower, R.L. Frequency of Mi a (MNS7) and Classification of Mia-Positive Hybrid Glycophorins in an Australian Blood Donor Population. Transfus. Med. Hemother. 2020, 47, 279–287. [Google Scholar] [CrossRef] [PubMed]
- Lopez, G.H.; Hyland, C.A.; Flower, R.L. Glycophorins and the MNS Blood Group System: A Narrative Review. Ann. Blood 2021, 6, 39. [Google Scholar] [CrossRef]
- Lin, M.; Broadberry, R.E. An Intravascular Hemolytic Transfusion Reaction Due to Anti-‘Mi(a)’ in Taiwan. Vox Sang. 1994, 67, 320. [Google Scholar] [CrossRef]
- Mallari, R.A.; Chan, A.; Powers, R.J.; Pandipati, S.; Bensing, K.M.; Biese, D.; Denomme, G.A. Fetal Inheritance of GP*Mur Causing Severe HDFN in an Unrecognized Case of Maternal Alloimmunization. Transfusion 2020, 60, 870–874. [Google Scholar] [CrossRef] [PubMed]
- Bakhtary, S.; Gikas, A.; Glader, B.; Andrews, J. Anti-Mur as the Most Likely Cause of Mild Hemolytic Disease of the Newborn. Transfusion 2016, 56, 1182–1184. [Google Scholar] [CrossRef]
- Chandanyingyong, D.; Pejrachandra, S. Studies on the Miltenberger Complex Frequency in Thailand and Family Studies. Vox Sang. 1975, 28, 152–155. [Google Scholar] [CrossRef]
- Khosidworachet, W.; Mitundee, S.; Intharanut, K.; Bejrachandra, S. Frequencies of predicted mia antigen among southern thai blood donors. J. Southeast Asian Med. Res. 2021, 6, e0107. [Google Scholar] [CrossRef]
- Romphruk, A.V.; Butryojantho, C.; Jirasakonpat, B.; Junta, N.; Srichai, S.; Puapairoj, C.; Simtong, P. Phenotype frequencies of Rh (C, c, E, e), M, Mia and Kidd blood group systems among ethnic Thai blood donors from the north-east of Thailand. Int. J. Immunogenet. 2019, 46, 160–165. [Google Scholar] [CrossRef]
- Westhoff, C.M. Blood Group Genotyping. Blood 2019, 133, 1814–1820. [Google Scholar] [CrossRef]
- Then, W.L.; Li, M.; McLiesh, H.; Shen, W.; Garnier, G. The Detection of Blood Group Phenotypes Using Paper Diagnostics. Vox Sang. 2015, 108, 186–196. [Google Scholar] [CrossRef]
- Ebrahimi Fana, S.; Paknejad, M.; Aminian, M. Paper Based Analytical Devices for Blood Grouping: A Comprehensive Review. Biomed. Microdevices 2021, 23, 34. [Google Scholar] [CrossRef] [PubMed]
- Li, M.; Then, W.L.; Li, L.; Shen, W. Paper-based device for rapid typing of secondary human blood groups. Anal. Bioanal. Chem. 2014, 406, 669–677. [Google Scholar] [CrossRef] [PubMed]
- Guan, L.; Tian, J.; Cao, R.; Li, M.; Cai, Z.; Shen, W. Barcode-like Paper Sensor for Smartphone Diagnostics: An Application of Blood Typing. Anal. Chem. 2014, 86, 11362–11367. [Google Scholar] [CrossRef] [PubMed]
- Li, M.; Tian, J.; Al-Tamimi, M.; Shen, W. Paper-Based Blood Typing Device That Reports Patient’s Blood Type “in Writing”. Angew. Chem. Int. Ed. 2012, 51, 5497–5501. [Google Scholar] [CrossRef]
- Songjaroen, T.; Laiwattanapaisal, W. Simultaneous Forward and Reverse ABO Blood Group Typing Using a Paper-Based Device and Barcode-like Interpretation. Anal. Chim. Acta 2016, 921, 67–76. [Google Scholar] [CrossRef]
- Chomean, S.; Ingkananth, S.; Kiatchaipar, M.; Kaset, C. Portable Paper-Based Device for ABO and RhD Typing Using Smartphone Interpretation: Optical Answer Sheet Reading Concept. Anal. Chim. Acta 2021, 1180, 338884. [Google Scholar] [CrossRef]
- Lancman, G.; Arinsburg, S.; Jhang, J.; Jay Cho, H.; Jagannath, S.; Madduri, D.; Parekh, S.; Richter, J.; Chari, A. Blood Transfusion Management for Patients Treated with Anti-CD38 Monoclonal Antibodies. Front. Immunol. 2018, 9, 2616. [Google Scholar] [CrossRef]
- Palacajornsuk, P.; Nathalang, O.; Tantimavanich, S.; Bejrachandra, S.; Reid, M.E. Detection of MNS Hybrid Molecules in the Thai Population Using PCR-SSP Technique. Transfus. Med. 2007, 17, 169–174. [Google Scholar] [CrossRef]
- Pipatpanukul, C.; Takeya, S.; Baba, A.; Amarit, R.; Somboonkaew, A.; Sutapun, B.; Kitpoka, P.; Kunakorn, M.; Srikhirin, T. Rh Blood Phenotyping (D, E, e, C, c) Microarrays Using Multichannel Surface Plasmon Resonance Imaging. Biosens. Bioelectron. 2018, 102, 267–275. [Google Scholar] [CrossRef]
- Noiphung, J.; Talalak, K.; Hongwarittorrn, I.; Pupinyo, N.; Thirabowonkitphithan, P.; Laiwattanapaisal, W. A Novel Paper-Based Assay for the Simultaneous Determination of Rh Typing and Forward and Reverse ABO Blood Groups. Biosens. Bioelectron. 2015, 67, 485–489. [Google Scholar] [CrossRef]
- Larpant, N.; Niamsi, W.; Noiphung, J.; Chanakiat, W.; Sakuldamrongpanich, T.; Kittichai, V.; Tongloy, T.; Chuwongin, S.; Boonsang, S.; Laiwattanapaisal, W. Simultaneous Phenotyping of Five Rh Red Blood Cell Antigens on a Paper-Based Analytical Device Combined with Deep Learning for Rapid and Accurate Interpretation. Anal. Chim. Acta 2022, 1207, 339807. [Google Scholar] [CrossRef] [PubMed]
- Mayer, B.; Müller, J.; Candela-García, M.J.; Manteau, A.C.; Weinstock, C.; Pruß, A. Evaluation of the New Lateral Flow Card MDmulticard® Basic Extended Phenotype in Routine Clinical Practice. Transfus. Med. Hemother. 2018, 45, 341–346. [Google Scholar] [CrossRef] [PubMed]
- Caesar, A.; Meyer, S.; Trost, N.; Neuenschwander, K.; Geisen, C.; Frey, B.M.; Gassner, C.; Schwind, P. A Uniform Method for the Simultaneous Blood Group Phenotyping of Fya, Fyb, Jka, Jkb, S, S, P1, k Applying Lateral-Flow Technique. Vox Sang. 2018, 113, 177–184. [Google Scholar] [CrossRef] [PubMed]
- Chen, T.D.; Chen, D.P.; Wang, W.T.; Sun, C.F. MNSs Blood Group Glycophorin Variants in Taiwan: A Genotype-Serotype Correlation Study of “Mia” and Sta with Report of Two New Alleles for Sta. PLoS ONE 2014, 9, e98166. [Google Scholar] [CrossRef]
- Hsu, K.; Lin, Y.C.; Chao, H.P.; Lee, T.Y.; Lin, M.; Chan, Y.S. Assessing the Frequencies of GP.Mur (Mi.III) in Several Southeast Asian Populations by PCR Typing. Transfus. Apher. Sci. 2013, 49, 370–371. [Google Scholar] [CrossRef] [PubMed]
- Wei, L.; Lopez, G.H.; Zhang, Y.; Wen, J.; Wang, Z.; Fu, Y.; Hyland, C.A.; Flower, R.L.; Luo, G.; Ji, Y. Genotyping Analysis of MNS Blood Group GP(B-A-B) Hybrid Glycophorins in the Chinese Southern Han Population Using a High-Resolution Melting Assay. Transfusion 2018, 58, 1763–1771. [Google Scholar] [CrossRef]
- Wei, L.; Shan, Z.G.; Flower, R.L.; Wang, Z.; Wen, J.Z.; Luo, G.P.; Ji, Y.L. The Distribution of MNS Hybrid Glycophorins with Mur Antigen Expression in Chinese Donors Including Identification of a Novel GYP. Bun Allele. Vox Sang. 2016, 111, 308–314. [Google Scholar] [CrossRef]
- Lopez, G.H.; Wei, L.; Ji, Y.; Condon, J.A.; Luo, G.; Hyland, C.A.; Flower, R.L. GYP∗Kip, a Novel GYP(B-A-B) Hybrid Allele, Encoding the MNS48 (KIPP) Antigen. Transfusion 2016, 56, 539–541. [Google Scholar] [CrossRef]
- Oda, A.; Suzuki, Y.; Isa, K.; Ogasawara, K.; Yabe, R.; Kimura, T.; Uchikawa, M.; Tsuno, N.H. GP.MOT: A Novel Glycophorin Variant Identified in a Japanese Blood Donor. Transfusion 2021, 61, 2825–2829. [Google Scholar] [CrossRef]


| STATISTICS | SP | EP | SP: EP Ratio | F-SCORE | ||||
|---|---|---|---|---|---|---|---|---|
| Value | 95%CI | Value | 95%CI | Value | 95%CI | Value | 95%CI | |
| Sensitivity | 62.96% | 42.37% to 80.60% | 96.30% | 81.03% to 99.91% | 100.00% | 87.23% to 100.00% | 100.00% | 87.23% to 100.00% |
| Specificity | 100.00% | 98.05% to 100.00% | 100.00% | 98.06% to 100.00% | 100.00% | 98.05% to 100.00% | 100.00% | 98.05% to 100.00% |
| PPV | 100.00% | - | 100.00% | - | 100.00% | - | 100.00% | - |
| NPV | 96.17% | 93.89% to 97.62% | 99.60% | 97.35% to 99.94% | 100.00% | - | 100.00% | - |
| Accuracy | 96.41% | 92.96% to 98.47% | 99.64% | 97.62% to 100.00% | 100.00% | 98.29% to 100.00% | 100.00% | 98.29% to 100.00% |
Publisher’s Note: MDPI stays neutral with regard to jurisdictional claims in published maps and institutional affiliations. |
© 2022 by the authors. Licensee MDPI, Basel, Switzerland. This article is an open access article distributed under the terms and conditions of the Creative Commons Attribution (CC BY) license (https://creativecommons.org/licenses/by/4.0/).
Share and Cite
Chomean, S.; Attapong, J.; Jitsuvantaya, S.; Poomsaard, K.; Dongwilai, C.; Bunnun, P.; Kaset, C. Development of Mia Phenotyping Using Paper-Based Device. Diagnostics 2022, 12, 3104. https://doi.org/10.3390/diagnostics12123104
Chomean S, Attapong J, Jitsuvantaya S, Poomsaard K, Dongwilai C, Bunnun P, Kaset C. Development of Mia Phenotyping Using Paper-Based Device. Diagnostics. 2022; 12(12):3104. https://doi.org/10.3390/diagnostics12123104
Chicago/Turabian StyleChomean, Sirinart, Jirapat Attapong, Sumittra Jitsuvantaya, Komin Poomsaard, Chadchadaporn Dongwilai, Pished Bunnun, and Chollanot Kaset. 2022. "Development of Mia Phenotyping Using Paper-Based Device" Diagnostics 12, no. 12: 3104. https://doi.org/10.3390/diagnostics12123104
APA StyleChomean, S., Attapong, J., Jitsuvantaya, S., Poomsaard, K., Dongwilai, C., Bunnun, P., & Kaset, C. (2022). Development of Mia Phenotyping Using Paper-Based Device. Diagnostics, 12(12), 3104. https://doi.org/10.3390/diagnostics12123104