
ECG and Biomarker Profile in Patients with Acute Heart Failure: A Pilot Study

 , , ,
, , , 
 ,
,  , , ,
, , , 
Abstract
:1. Introduction
2. Materials and Methods
2.1. Study Design and Population
2.2. Definitions
- left ventricular hypertrophy (LVH) was considered in patients that met the Estes criteria and Morris index (point score ≥ 5);
- correction of the QT interval (QTc) was done using the Fridericia formula;
- a fragmented QRS complex (fQRS) was defined by: the presence of notched R or S or the existence of an additional wave-like RSR’ pattern in the original QRS complex, a duration of <120 ms, not accompanied by a typical bundle branch block;
- poor R-wave progression (PRWP) was considered after exclusion of LVH features: RV3 or RV4 < 2 mm plus a decrease in RV2 to RV3 or RV3 to RV4, RV3 < 1 mm plus < 0.25 mm increase from RV2 to RV3;
- low QRS voltage (LQRSV) was defined as a peak-to-peak QRS amplitude of <5 mm in the limb leads and/or <10 mm in the precordial leads;
- left bundle branch block (LBBB) was defined by: QRS duration > 120 ms, dominant S wave in V1, broad monophasic R wave in lateral leads (DI, aVL, V5, V6), absence of Q wave in lateral leads, prolonged R wave peak time > 60 ms in V5–V6;
- pathological Q wave was considered if: >40 ms wide (>1 mm), >2 mm deep, >25% of depth of QRS complex, seen in leads V1–V3;
- complex premature ventricular contractions (PVC) were considered in the presence of: doublets, triplets or non-sustained ventricular tachycardia (NSVT).
- For cardiac biomarkers the normal range was defined according to the following cut-off values: NT-proBNP < 300 pg/mL, high-sensitive cardiac troponin < 14 ng/L, CK-MB ≤ 16 U/L, D-dimers < 500 µg/L.
2.3. Statistical Analysis
3. Results
3.1. Baseline Characteristics
3.2. Cardiac Biomarkers Profile in AHF and Control Group
3.3. ECG and Holter ECG Parameters in AHF and Control Group
3.4. Correlations of Cardiac Biomarkers with ECG and Holter Parameters
4. Discussion
Limitations of the Study
5. Conclusions
Author Contributions
Funding
Institutional Review Board Statement
Informed Consent Statement
Data Availability Statement
Conflicts of Interest
References
- Savarese, G.; Lund, L.H. Global Public Health Burden of Heart Failure. Card. Fail. Rev. 2017, 3, 7. [Google Scholar] [CrossRef] [PubMed]
- McDonagh, T.A.; Metra, M.; Adamo, M.; Gardner, R.S.; Baumbach, A.; Böhm, M.; Burri, H.; Butler, J.; Čelutkienė, J.; Chioncel, O.; et al. 2021 ESC Guidelines for the Diagnosis and Treatment of Acute and Chronic Heart Failure: Developed by the Task Force for the Diagnosis and Treatment of Acute and Chronic Heart Failure of the European Society of Cardiology (ESC). With the Special Contribution of the Heart Failure Association (HFA) of the ESC. Eur. J. Heart Fail. 2022, 24, 4–131. [Google Scholar] [CrossRef] [PubMed]
- Schwinger, R.H.G. Pathophysiology of Heart Failure. Cardiovasc. Diagn. Ther. 2021, 11, 263–276. [Google Scholar] [CrossRef] [PubMed]
- Kemp, C.D.; Conte, J.V. The Pathophysiology of Heart Failure. Cardiovasc. Pathol. Off. J. Soc. Cardiovasc. Pathol. 2012, 21, 365–371. [Google Scholar] [CrossRef]
- Ottaviani, G.; Radovancevic, R.; Kar, B.; Gregoric, I.; Buja, L.M. Pathological Assessment of End-Stage Heart Failure in Explanted Hearts in Correlation with Hemodynamics in Patients Undergoing Orthotopic Heart Transplantation. Cardiovasc. Pathol. Off. J. Soc. Cardiovasc. Pathol. 2015, 24, 283–289. [Google Scholar] [CrossRef]
- Sarhene, M.; Wang, Y.; Wei, J.; Huang, Y.; Li, M.; Li, L.; Acheampong, E.; Zhengcan, Z.; Xiaoyan, Q.; Yunsheng, X.; et al. Biomarkers in Heart Failure: The Past, Current and Future. Heart Fail. Rev. 2019, 24, 867–903. [Google Scholar] [CrossRef]
- Karaye, K.M.; Sani, M.U. Electrocardiographic Abnormalities in Patients with Heart Failure. Cardiovasc. J. Afr. 2008, 19, 22–25. [Google Scholar]
- Cygankiewicz, I.; Zareba, W.; de Luna, A.B. Prognostic Value of Holter Monitoring in Congestive Heart Failure. Cardiol. J. 2008, 15, 313–323. [Google Scholar]
- Arsenos, P.; Gatzoulis, K.A.; Laina, A.; Doundoulakis, I.; Soulaidopoulos, S.; Kordalis, A.; Oikonomou, G.; Triantafyllou, K.; Fragakis, N.; Vasilikos, V.; et al. QT Interval Extracted from 30-Minute Short Resting Holter ECG Recordings Predicts Mortality in Heart Failure. J. Electrocardiol. 2022, 72, 109–114. [Google Scholar] [CrossRef]
- Dahou, A.; Toubal, O.; Clavel, M.-A.; Beaudoin, J.; Magne, J.; Mathieu, P.; Philippon, F.; Dumesnil, J.G.; Puri, R.; Ribeiro, H.B.; et al. Relationship Between QT Interval and Outcome in Low-Flow Low-Gradient Aortic Stenosis With Low Left Ventricular Ejection Fraction. J. Am. Heart Assoc. 2016, 5, e003980. [Google Scholar] [CrossRef] [Green Version]
- Lin, J.-F.; Hsu, S.-Y.; Wu, S.; Teng, M.-S.; Chou, H.-H.; Cheng, S.-T.; Wu, T.-Y.; Ko, Y.-L. QT Interval Independently Predicts Mortality and Heart Failure in Patients with ST-Elevation Myocardial Infarction. Int. J. Med. Sci. 2015, 12, 968–973. [Google Scholar] [CrossRef] [Green Version]
- Dobson, C.P.; La Rovere, M.T.; Olsen, C.; Berardinangeli, M.; Veniani, M.; Midi, P.; Tavazzi, L.; Haigney, M.; on behalf of GISSI-HF Investigators. 24-Hour QT Variability in Heart Failure. J. Electrocardiol. 2009, 42, 500–504. [Google Scholar] [CrossRef]
- Dobson, C.P.; La Rovere, M.T.; Pinna, G.D.; Goldstein, R.; Olsen, C.; Bernardinangeli, M.; Veniani, M.; Midi, P.; Tavazzi, L.; Haigney, M.; et al. QT Variability Index on 24-Hour Holter Independently Predicts Mortality in Patients with Heart Failure: Analysis of Gruppo Italiano per Lo Studio Della Sopravvivenza Nell’Insufficienza Cardiaca (GISSI-HF) Trial. Heart Rhythm 2011, 8, 1237–1242. [Google Scholar] [CrossRef]
- Haigney, M.C.; Zareba, W.; Gentlesk, P.J.; Goldstein, R.E.; Illovsky, M.; McNitt, S.; Andrews, M.L.; Moss, A.J.; Multicenter Automatic Defibrillator Implantation Trial II Investigators. QT Interval Variability and Spontaneous Ventricular Tachycardia or Fibrillation in the Multicenter Automatic Defibrillator Implantation Trial (MADIT) II Patients. J. Am. Coll. Cardiol. 2004, 44, 1481–1487. [Google Scholar] [CrossRef] [Green Version]
- Galinier, M.; Vialette, J.C.; Fourcade, J.; Cabrol, P.; Dongay, B.; Massabuau, P.; Boveda, S.; Doazan, J.P.; Fauvel, J.M.; Bounhoure, J.P. QT Interval Dispersion as a Predictor of Arrhythmic Events in Congestive Heart Failure. Importance of Aetiology. Eur. Heart J. 1998, 19, 1054–1062. [Google Scholar] [CrossRef] [Green Version]
- Alattar, F.; Imran, N.; Shamoon, F. Fragmented QRS and Ejection Fraction in Heart Failure Patients Admitted to the Hospital. Int. J. Cardiol. Heart Vasc. 2015, 9, 11–14. [Google Scholar] [CrossRef] [Green Version]
- Kusano, K.F. Fragmented QRS Wave as a Marker of Cardiac Events in Various Cardiac Diseases. Circ. J. Off. J. Jpn. Circ. Soc. 2013, 77, 2873–2874. [Google Scholar] [CrossRef] [Green Version]
- Yagi, K.; Imamura, T.; Tada, H.; Liu, J.; Miyamoto, Y.; Ohbatake, A.; Ito, N.; Shikata, M.; Enkaku, A.; Takikawa, A.; et al. Fragmented QRS on Electrocardiography as a Predictor for Diastolic Cardiac Dysfunction in Type 2 Diabetes. J. Diabetes Investig. 2022, 13, 1052–1061. [Google Scholar] [CrossRef]
- Nomura, A.; Konno, T.; Fujita, T.; Tanaka, Y.; Nagata, Y.; Tsuda, T.; Hodatsu, A.; Sakata, K.; Nakamura, H.; Kawashiri, M.-A.; et al. Fragmented QRS Predicts Heart Failure Progression in Patients with Hypertrophic Cardiomyopathy. Circ. J. Off. J. Jpn. Circ. Soc. 2015, 79, 136–143. [Google Scholar] [CrossRef] [Green Version]
- Yamada, S.; Yoshihisa, A.; Sato, Y.; Sato, T.; Kamioka, M.; Kaneshiro, T.; Oikawa, M.; Kobayashi, A.; Suzuki, H.; Ishida, T.; et al. Utility of Heart Rate Turbulence and T-Wave Alternans to Assess Risk for Readmission and Cardiac Death in Hospitalized Heart Failure Patients. J. Cardiovasc. Electrophysiol. 2018, 29, 1257–1264. [Google Scholar] [CrossRef]
- Arsenos, P.; Gatzoulis, K.A.; Dilaveris, P.; Sideris, S.; Tousoulis, D. T Wave Alternans Extracted from 30-Minute Short Resting Holter ECG Recordings Predicts Mortality in Heart Failure. J. Electrocardiol. 2018, 51, 588–591. [Google Scholar] [CrossRef] [PubMed]
- Kawasaki, M.; Yamada, T.; Morita, T.; Furukawa, Y.; Tamaki, S.; Iwasaki, Y.; Kikuchi, A.; Kondo, T.; Takahashi, S.; Kawai, T.; et al. Risk Stratification for Ventricular Tachyarrhythmias by Ambulatory Electrocardiogram-Based Frequency Domain T-Wave Alternans. Pacing Clin. Electrophysiol. PACE 2015, 38, 1425–1433. [Google Scholar] [CrossRef] [PubMed]
- Lewek, J.; Ptaszynski, P.; Klingenheben, T.; Cygankiewicz, I. The Clinical Value of T-Wave Alternans Derived from Holter Monitoring. EP Eur. 2017, 19, 529–534. [Google Scholar] [CrossRef] [PubMed]
- Monedero, I. A Novel ECG Diagnostic System for the Detection of 13 Different Diseases. Eng. Appl. Artif. Intell. 2022, 107, 104536. [Google Scholar] [CrossRef]
- Kaya, Y.; Kuncan, F.; Tekin, R. A New Approach for Congestive Heart Failure and Arrhythmia Classification Using Angle Transformation with LSTM. Arab. J. Sci. Eng. 2022, 47, 10497–10513. [Google Scholar] [CrossRef]
- Akdağ, S.; Kuncan, F.; Kaya, Y. A New Approach for Congestive Heart Failure and Arrhythmia Classification Using Downsampling Local Binary Patterns with LSTM. Turk. J. Electr. Eng. Comput. Sci. 2022, 30, 2145–2164. [Google Scholar] [CrossRef]
- Wang, Y.; Agrafioti, F.; Hatzinakos, D.; Plataniotis, K.N. Analysis of Human Electrocardiogram for Biometric Recognition. EURASIP J. Adv. Signal Process. 2007, 2008, 148658. [Google Scholar] [CrossRef] [Green Version]
- Demir, N.; Kuncan, M.; Kaya, Y.; Kuncan, F. Multi-Layer Co-Occurrence Matrices for Person Identification from ECG Signals. Trait. Signal 2022, 39, 431–440. [Google Scholar] [CrossRef]
- Kamga, P.; Mostafa, R.; Zafar, S. The Use of Wearable ECG Devices in the Clinical Setting: A Review. Curr. Emerg. Hosp. Med. Rep. 2022, 10, 67–72. [Google Scholar] [CrossRef]
- Potter, L.R.; Yoder, A.R.; Flora, D.R.; Antos, L.K.; Dickey, D.M. Natriuretic Peptides: Their Structures, Receptors, Physiologic Functions and Therapeutic Applications. Handb. Exp. Pharmacol. 2009, 191, 341–366. [Google Scholar] [CrossRef] [Green Version]
- Clerico, A.; Vittorini, S.; Passino, C.; Emdin, M. New and Emerging Biomarkers of Heart Failure. Crit. Rev. Clin. Lab. Sci. 2009, 46, 107–128. [Google Scholar] [CrossRef]
- Maisel, A.S.; Duran, J.M.; Wettersten, N. Natriuretic Peptides in Heart Failure. Heart Fail. Clin. 2018, 14, 13–25. [Google Scholar] [CrossRef]
- Joury, A.; Ventura, H.; Krim, S.R. Biomarkers in Heart Failure: Relevance in the Clinical Practice. Int. J. Cardiol. 2022, 363, 196–201. [Google Scholar] [CrossRef]
- Wang, Y.; de Waard, M.C.; Sterner-Kock, A.; Stepan, H.; Schultheiss, H.-P.; Duncker, D.J.; Walther, T. Cardiomyocyte-Restricted over-Expression of C-Type Natriuretic Peptide Prevents Cardiac Hypertrophy Induced by Myocardial Infarction in Mice. Eur. J. Heart Fail. 2007, 9, 548–557. [Google Scholar] [CrossRef]
- Charles, C.J.; Prickett, T.C.R.; Espiner, E.A.; Rademaker, M.T.; Richards, A.M.; Yandle, T.G. Regional Sampling and the Effects of Experimental Heart Failure in Sheep: Differential Responses in A, B and C-Type Natriuretic Peptides. Peptides 2006, 27, 62–68. [Google Scholar] [CrossRef]
- Januzzi, J.L.; van Kimmenade, R.; Lainchbury, J.; Bayes-Genis, A.; Ordonez-Llanos, J.; Santalo-Bel, M.; Pinto, Y.M.; Richards, M. NT-ProBNP Testing for Diagnosis and Short-Term Prognosis in Acute Destabilized Heart Failure: An International Pooled Analysis of 1256 Patients. Eur. Heart J. 2006, 27, 330–337. [Google Scholar] [CrossRef] [Green Version]
- Mueller, C.; McDonald, K.; de Boer, R.A.; Maisel, A.; Cleland, J.G.F.; Kozhuharov, N.; Coats, A.J.S.; Metra, M.; Mebazaa, A.; Ruschitzka, F.; et al. Heart Failure Association of the European Society of Cardiology Practical Guidance on the Use of Natriuretic Peptide Concentrations. Eur. J. Heart Fail. 2019, 21, 715–731. [Google Scholar] [CrossRef] [Green Version]
- Ion, A.; Stafie, C.; Mitu, O.; Ciobanu, C.E.; Halitchi, D.I.; Costache, A.D.; Bobric, C.; Troase, R.; Mitu, I.; Huzum, B.; et al. Biomarkers Utility: At the Borderline between Cardiology and Neurology. J. Cardiovasc. Dev. Dis. 2021, 8, 139. [Google Scholar] [CrossRef]
- Chaulin, A. Cardiac Troponins: Contemporary Biological Data and New Methods of Determination. Vasc. Health Risk Manag. 2021, 17, 299–316. [Google Scholar] [CrossRef]
- ESC Guidelines for the Management of Acute Coronary Syndromes in Patients Presenting without Persistent ST-Segment Elevation|European Heart Journal|Oxford Academic. 2020. Available online: https://academic.oup.com/eurheartj/article/42/14/1289/5898842 (accessed on 27 October 2022).
- ESC Guidelines on Acute Myocardial Infarction in Patients Presenting with ST-Segment Elevation (Management Of). Available online: https://www.escardio.org/Guidelines/Clinical-Practice-Guidelines/Acute-Myocardial-Infarction-in-patients-presenting-with-ST-segment-elevation-Ma (accessed on 27 October 2022).
- Hammarsten, O.; Mair, J.; Möckel, M.; Lindahl, B.; Jaffe, A.S. Possible Mechanisms behind Cardiac Troponin Elevations. Biomarkers 2018, 23, 725–734. [Google Scholar] [CrossRef] [Green Version]
- Jarolim, P. High Sensitivity Cardiac Troponin Assays in the Clinical Laboratories. Clin. Chem. Lab. Med. 2015, 53, 635–652. [Google Scholar] [CrossRef] [Green Version]
- Yilmaz, A.; Yalta, K.; Turgut, O.O.; Yilmaz, M.B.; Ozyol, A.; Kendirlioglu, O.; Karadas, F.; Tandogan, I. Clinical Importance of Elevated CK-MB and Troponin I Levels in Congestive Heart Failure. Adv. Ther. 2006, 23, 1060–1067. [Google Scholar] [CrossRef]
- Savitz, S.T.; Leong, T.; Sung, S.H.; Lee, K.; Rana, J.S.; Tabada, G.; Go, A.S. Contemporary Reevaluation of Race and Ethnicity With Outcomes in Heart Failure. J. Am. Heart Assoc. 2021, 10, e016601. [Google Scholar] [CrossRef]
- Wu, A.H.B.; Christenson, R.H.; Greene, D.N.; Jaffe, A.S.; Kavsak, P.A.; Ordonez-Llanos, J.; Apple, F.S. Clinical Laboratory Practice Recommendations for the Use of Cardiac Troponin in Acute Coronary Syndrome: Expert Opinion from the Academy of the American Association for Clinical Chemistry and the Task Force on Clinical Applications of Cardiac Bio-Markers of the International Federation of Clinical Chemistry and Laboratory Medicine. Clin. Chem. 2018, 64, 645–655. [Google Scholar] [CrossRef]
- Farmakis, D.; Parissis, J.; Lekakis, J.; Filippatos, G. Acute Heart Failure: Epidemiology, Risk Factors, and Prevention. Rev. Esp. Cardiol. Engl. Ed. 2015, 68, 245–248. [Google Scholar] [CrossRef]
- Van den Berge, J.C.; van Vark, L.C.; Postmus, D.; Utens, E.M.W.J.; Hillege, H.L.; Boersma, E.; Lesman-Leegte, I.; Akkerhuis, K.M. Determinants of Quality of Life in Acute Heart Failure Patients with and without Comorbidities: A Prospective, Observational Study. Eur. J. Cardiovasc. Nurs. 2022, 21, 205–212. [Google Scholar] [CrossRef]
- Cagli, K.; Basar, F.N.; Tok, D.; Turak, O.; Basar, O. How to Interpret Liver Function Tests in Heart Failure Patients? Turk. J. Gastroenterol. 2020, 26, 197–203. [Google Scholar] [CrossRef] [Green Version]
- Biegus, J.; Hillege, H.L.; Postmus, D.; Valente, M.A.E.; Bloomfield, D.M.; Cleland, J.G.F.; Cotter, G.; Davison, B.A.; Dittrich, H.C.; Fiuzat, M.; et al. Abnormal Liver Function Tests in Acute Heart Failure: Relationship with Clinical Characteristics and Outcome in the PROTECT Study: Abnormal Liver Function Tests in Acute Heart Failure. Eur. J. Heart Fail. 2016, 18, 830–839. [Google Scholar] [CrossRef] [Green Version]
- Samsky, M.D.; Dunning, A.; DeVore, A.D.; Schulte, P.J.; Starling, R.C.; Wilson Tang, W.H.; Armstrong, P.W.; Ezekowitz, J.A.; Butler, J.; McMurray, J.J.; et al. Liver Function Tests in Patients with Acute Heart Failure and Associated Outcomes: Insights from ASCEND-HF: LFTs in AHF. Eur. J. Heart Fail. 2016, 18, 424–432. [Google Scholar] [CrossRef]
- Odutayo, A.; Hsiao, A.J.; Emdin, C.A. Prevalence of Albuminuria in a General Population Cohort of Patients With Established Chronic Heart Failure. J. Card. Fail. 2016, 22, 33–37. [Google Scholar] [CrossRef]
- Chen, L.; Jin, C.; Chen, L.; Li, M.; Zhong, Y.; Xu, Y. Value of Microalbuminuria in the Diagnosis of Heart Failure with Preserved Ejection Fraction. Herz 2021, 46, 215–221. [Google Scholar] [CrossRef]
- Liang, W.; Liu, Q.; Wang, Q.; Yu, H.; Yu, J. Albuminuria and Dipstick Proteinuria for Predicting Mortality in Heart Failure: A Systematic Review and Meta-Analysis. Front. Cardiovasc. Med. 2021, 8, 665831. [Google Scholar] [CrossRef]
- Shuvy, M.; Zwas, D.R.; Lotan, C.; Keren, A.; Gotsman, I. Albuminuria: Associated With Heart Failure Severity and Impaired Clinical Outcomes. Can. J. Cardiol. 2020, 36, 527–534. [Google Scholar] [CrossRef]
- Desai, A.S.; Mc Causland, F.R. Urinary Sodium as a Heart Failure Biomarker. JACC Heart Fail. 2019, 7, 415–417. [Google Scholar] [CrossRef]
- Martens, P.; Dupont, M.; Verbrugge, F.H.; Damman, K.; Degryse, N.; Nijst, P.; Reynders, C.; Penders, J.; Tang, W.H.W.; Testani, J.; et al. Urinary Sodium Profiling in Chronic Heart Failure to Detect Development of Acute Decompensated Heart Failure. JACC Heart Fail. 2019, 7, 404–414. [Google Scholar] [CrossRef]
- Singh, D.; Shrestha, K.; Testani, J.M.; Verbrugge, F.H.; Dupont, M.; Mullens, W.; Tang, W.H.W. Insufficient Natriuretic Response to Continuous Intravenous Furosemide Is Associated With Poor Long-Term Outcomes in Acute Decompensated Heart Failure. J. Card. Fail. 2014, 20, 392–399. [Google Scholar] [CrossRef] [Green Version]
- Testani, J.M.; Hanberg, J.S.; Cheng, S.; Rao, V.; Onyebeke, C.; Laur, O.; Kula, A.; Chen, M.; Wilson, F.P.; Darlington, A.; et al. Rapid and Highly Accurate Prediction of Poor Loop Diuretic Natriuretic Response in Patients With Heart Failure. Circ. Heart Fail. 2016, 9, e002370. [Google Scholar] [CrossRef] [Green Version]
- Cunningham, J.W.; Sun, J.; Mc Causland, F.R.; Ly, S.; Anstrom, K.J.; Lindenfeld, J.; Givertz, M.M.; Stevenson, L.W.; Lakdawala, N.K. Lower Urine Sodium Predicts Longer Length of Stay in Acute Heart Failure Patients: Insights from the ROSE AHF Trial. Clin. Cardiol. 2020, 43, 43–49. [Google Scholar] [CrossRef]
- Ganes, A.; Davis, J.A.; Virtanen, J.K.; Voutilainen, A.; Tuomainen, T.-P.; Atherton, J.J.; Amerena, J.; Driscoll, A.; Hare, D.L.; Wittert, G.; et al. Urinary Sodium Concentration Predicts Time to Major Adverse Coronary Events and All-Cause Mortality in Men with Heart Failure over a 28–33-Year Period: A Prospective Cohort Study. BMC Cardiovasc. Disord. 2022, 22, 391. [Google Scholar] [CrossRef]
- Knebel, F.; Schimke, I.; Pliet, K.; Schattke, S.; Martin, S.; Borges, A.C.; Baumann, G. NT-ProBNP in Acute Heart Failure: Correlation With Invasively Measured Hemodynamic Parameters During Recompensation. J. Card. Fail. 2005, 11, S38–S41. [Google Scholar] [CrossRef]
- Salah, K.; Stienen, S.; Pinto, Y.M.; Eurlings, L.W.; Metra, M.; Bayes-Genis, A.; Verdiani, V.; Tijssen, J.G.P.; Kok, W.E. Prognosis and NT-ProBNP in Heart Failure Patients with Preserved versus Reduced Ejection Fraction. Heart 2019, 105, 1182–1189. [Google Scholar] [CrossRef] [PubMed] [Green Version]
- Grodin, J.L.; Liebo, M.J.; Butler, J.; Metra, M.; Felker, G.M.; Hernandez, A.F.; Voors, A.A.; Mcmurray, J.J.; Armstrong, P.W.; O’Connor, C.; et al. Prognostic Implications of Changes in Amino-Terminal Pro–B-Type Natriuretic Peptide in Acute Decompensated Heart Failure: Insights From ASCEND-HF. J. Card. Fail. 2019, 25, 703–711. [Google Scholar] [CrossRef] [PubMed]
- Moghtadaei, M.; Polina, I.; Rose, R.A. Electrophysiological Effects of Natriuretic Peptides in the Heart Are Mediated by Multiple Receptor Subtypes. Prog. Biophys. Mol. Biol. 2016, 120, 37–49. [Google Scholar] [CrossRef] [PubMed]
- Springer, J.; Azer, J.; Hua, R.; Robbins, C.; Adamczyk, A.; McBoyle, S.; Bissell, M.B.; Rose, R.A. The Natriuretic Peptides BNP and CNP Increase Heart Rate and Electrical Conduction by Stimulating Ionic Currents in the Sinoatrial Node and Atrial Myocardium Following Activation of Guanylyl Cyclase-Linked Natriuretic Peptide Receptors. J. Mol. Cell. Cardiol. 2012, 52, 1122–1134. [Google Scholar] [CrossRef] [PubMed]
- Marsiliani, D.; Buccelletti, F.; Carroccia, A.; Gilardi, E.; Silveri, N.G.; Franceschi, F. Natriuretic Peptides and Atrial Fibrillation. Eur. Rev. Med. Pharmacol. Sci. 2010, 14, 855–860. [Google Scholar] [PubMed]
- Mabuchi, N.; Tsutamoto, T.; Maeda, K.; Kinoshita, M. Plasma Cardiac Natriuretic Peptides as Biochemical Markers of Recurrence of Atrial Fibrillation in Patients with Mild Congestive Heart Failure. Jpn. Circ. J. 2000, 64, 765–771. [Google Scholar] [CrossRef] [Green Version]
- Wettersten, N.; Maisel, A. Role of Cardiac Troponin Levels in Acute Heart Failure. Card. Fail. Rev. 2015, 1, 102. [Google Scholar] [CrossRef]
- Kociol, R.D.; Pang, P.S.; Gheorghiade, M.; Fonarow, G.C.; O’Connor, C.M.; Felker, G.M. Troponin Elevation in Heart Failure. J. Am. Coll. Cardiol. 2010, 56, 1071–1078. [Google Scholar] [CrossRef] [Green Version]
- Sakhuja, R.; Green, S.; Oestreicher, E.M.; Sluss, P.M.; Lee-Lewandrowski, E.; Lewandrowski, K.B.; Januzzi, J.L. Amino-Terminal pro-Brain Natriuretic Peptide, Brain Natriuretic Peptide, and Troponin T for Prediction of Mortality in Acute Heart Failure. Clin. Chem. 2007, 53, 412–420. [Google Scholar] [CrossRef] [Green Version]
- Peacock, W.F.; De Marco, T.; Fonarow, G.C.; Diercks, D.; Wynne, J.; Apple, F.S.; Wu, A.H.B.; ADHERE Investigators. Cardiac Troponin and Outcome in Acute Heart Failure. N. Engl. J. Med. 2008, 358, 2117–2126. [Google Scholar] [CrossRef] [Green Version]
- Omland, T.; Røsjø, H.; Giannitsis, E.; Agewall, S. Troponins in Heart Failure. Clin. Chim. Acta Int. J. Clin. Chem. 2015, 443, 78–84. [Google Scholar] [CrossRef]
- You, J.J.; Austin, P.C.; Alter, D.A.; Ko, D.T.; Tu, J.V. Relation between Cardiac Troponin I and Mortality in Acute Decompensated Heart Failure. Am. Heart J. 2007, 153, 462–470. [Google Scholar] [CrossRef]
- Braga, J.R.; Tu, J.V.; Austin, P.C.; Chong, A.; You, J.J.; Farkouh, M.E.; Ross, H.J.; Lee, D.S. Outcomes and Care of Patients With Acute Heart Failure Syndromes and Cardiac Troponin Elevation. Circ. Heart Fail. 2013, 6, 193–202. [Google Scholar] [CrossRef] [Green Version]
- Del Carlo, C.H.; Pereira-Barretto, A.C.; Cassaro-Strunz, C.M.; do Rosário Dias de Oliveira Latorre, M.; de Oliveira Junior, M.T.; Ramires, J.A.F. Troponina Cardíaca T Para Estratificação de Risco Na Insuficiência Cardíaca Crônica Descompensada. Arq. Bras. Cardiol. 2009, 92, 372–380. [Google Scholar] [CrossRef] [Green Version]
- Perrone, M.A.; Zaninotto, M.; Masotti, S.; Musetti, V.; Padoan, A.; Prontera, C.; Plebani, M.; Passino, C.; Romeo, F.; Bernardini, S.; et al. The Combined Measurement of High-Sensitivity Cardiac Troponins and Natriuretic Peptides: A Useful Tool for Clinicians? J. Cardiovasc. Med. 2020, 21, 953–963. [Google Scholar] [CrossRef]
- Pascual-Figal, D.A.; Manzano-Fernández, S.; Boronat, M.; Casas, T.; Garrido, I.P.; Bonaque, J.C.; Pastor-Perez, F.; Valdés, M.; Januzzi, J.L. Soluble ST2, High-Sensitivity Troponin T- and N-Terminal pro-B-Type Natriuretic Peptide: Complementary Role for Risk Stratification in Acutely Decompensated Heart Failure. Eur. J. Heart Fail. 2011, 13, 718–725. [Google Scholar] [CrossRef]
- Januzzi, J.L.; Filippatos, G.; Nieminen, M.; Gheorghiade, M. Troponin Elevation in Patients with Heart Failure: On Behalf of the Third Universal Definition of Myocardial Infarction Global Task Force: Heart Failure Section. Eur. Heart J. 2012, 33, 2265–2271. [Google Scholar] [CrossRef] [Green Version]
- Kelly, J. The Electrocardiogram in Heart Failure. Age Ageing 2000, 29, 203–206. [Google Scholar] [CrossRef] [Green Version]
- Václavík, J.; Špinar, J.; Vindiš, D.; Vítovec, J.; Widimský, P.; Číhalík, Č.; Linhart, A.; Málek, F.; Táborský, M.; Dušek, L.; et al. ECG in Patients with Acute Heart Failure Can Predict In-Hospital and Long-Term Mortality. Intern. Emerg. Med. 2014, 9, 283–291. [Google Scholar] [CrossRef]
- Gouda, P.; Brown, P.; Rowe, B.H.; McAlister, F.A.; Ezekowitz, J.A. Insights into the Importance of the Electrocardiogram in Patients with Acute Heart Failure: The ECG in Patients with AHF. Eur. J. Heart Fail. 2016, 18, 1032–1040. [Google Scholar] [CrossRef]
- Dzudie, A.; Milo, O.; Edwards, C.; Cotter, G.; Davison, B.A.; Damasceno, A.; Mayosi, B.M.; Mondo, C.; Ogah, O.; Ojji, D.; et al. Prognostic Significance of ECG Abnormalities for Mortality Risk in Acute Heart Failure: Insight From the Sub-Saharan Africa Survey of Heart Failure (THESUS-HF). J. Card. Fail. 2014, 20, 45–52. [Google Scholar] [CrossRef] [PubMed]
- Sandercock, G.R.H.; Brodie, D.A. The Role of Heart Rate Variability in Prognosis for Different Modes of Death in Chronic Heart Failure. Pacing Clin. Electrophysiol. 2006, 29, 892–904. [Google Scholar] [CrossRef] [PubMed]
- Hoyer, D.; Maestri, R.; La Rovere, M.T.; Domenico Pinna, G. Autonomic Response to Cardiac Dysfunction in Chronic Heart Failure: A Risk Predictor Based on Autonomic Information Flow: Autonomic response to cardiac dysfunction in chronic heart failure. Pacing Clin. Electrophysiol. 2008, 31, 214–220. [Google Scholar] [CrossRef] [PubMed]
- Albakri, A. A Meta-Analysis of ECG Abnormalities (Arrhythmias) in Different Types of Heart Failure. Integr. Mol. Med. 2020, 7, 1–10. [Google Scholar] [CrossRef]
- Purwowiyoto, S.L.; Kusharsamita, H. Arrhythmia-Induced Cardiomyopathy: An Article Review. Open Access Maced. J. Med. Sci. 2022, 10, 49–56. [Google Scholar] [CrossRef]
- Lubitz, S.A.; Benjamin, E.J.; Ellinor, P.T. Atrial Fibrillation in Congestive Heart Failure. Heart Fail. Clin. 2010, 6, 187–200. [Google Scholar] [CrossRef] [Green Version]
- Chen, J.; Johnson, G.; Hellkamp, A.S.; Anderson, J.; Mark, D.B.; Lee, K.L.; Bardy, G.H.; Poole, J.E. Rapid-Rate Nonsustained Ventricular Tachycardia Found on Implantable Cardioverter-Defibrillator Interrogation. J. Am. Coll. Cardiol. 2013, 61, 2161–2168. [Google Scholar] [CrossRef] [Green Version]
- Kanitsoraphan, C.; Rattanawong, P.; Mekraksakit, P.; Chongsathidkiet, P.; Riangwiwat, T.; Kanjanahattakij, N.; Vutthikraivit, W.; Klomjit, S.; Thavaraputta, S. Baseline Fragmented QRS Is Associated with Increased All-Cause Mortality in Heart Failure with Reduced Ejection Fraction: A Systematic Review and Meta-Analysis. Ann. Noninvasive Electrocardiol. 2019, 24, e12597. [Google Scholar] [CrossRef] [Green Version]
- Chan, J.S.K.; Zhou, J.; Lee, S.; Li, A.; Tan, M.; Leung, K.S.K.; Jeevaratnam, K.; Liu, T.; Roever, L.; Liu, Y.; et al. Fragmented QRS Is Independently Predictive of Long-Term Adverse Clinical Outcomes in Asian Patients Hospitalized for Heart Failure: A Retrospective Cohort Study. Front. Cardiovasc. Med. 2021, 8, 738417. [Google Scholar] [CrossRef]
- Engstrom, N.; Letson, H.L.; Ng, K.; Dobson, G.P. Predicting Arrhythmias in Primary Prevention Heart Failure Patients: Picking up the Fragments. Open Heart 2022, 9, e002075. [Google Scholar] [CrossRef]
- Basaran, Y.; Tigen, K.; Karaahmet, T.; Isiklar, I.; Cevik, C.; Gurel, E.; Dundar, C.; Pala, S.; Mahmutyazicioglu, K.; Basaran, O. Fragmented QRS Complexes Are Associated with Cardiac Fibrosis and Significant Intraventricular Systolic Dyssynchrony in Nonischemic Dilated Cardiomyopathy Patients with a Narrow QRS Interval: Fragmented QRS in Nonischemic Dilated Cardiomyopathy. Echocardiography 2011, 28, 62–68. [Google Scholar] [CrossRef]
- Das, M.K.; Zipes, D.P. Fragmented QRS: A Predictor of Mortality and Sudden Cardiac Death. Heart Rhythm 2009, 6, S8–S14. [Google Scholar] [CrossRef]
- Birda, C.; Kumar, S.; Bhalla, A.; Sharma, N.; Kumari, S. Prevalence and Prognostic Significance of Prolonged QTc Interval in Emergency Medical Patients: A Prospective Observational Study. Int. J. Crit. Illn. Inj. Sci. 2018, 8, 28. [Google Scholar] [CrossRef]
- Straus, S.M.J.M.; Kors, J.A.; De Bruin, M.L.; van der Hooft, C.S.; Hofman, A.; Heeringa, J.; Deckers, J.W.; Kingma, J.H.; Sturkenboom, M.C.J.M.; Stricker, B.H.C.; et al. Prolonged QTc Interval and Risk of Sudden Cardiac Death in a Population of Older Adults. J. Am. Coll. Cardiol. 2006, 47, 362–367. [Google Scholar] [CrossRef] [Green Version]
- Gibbs, C.; Thalamus, J.; Kristoffersen, D.T.; Svendsen, M.V.; Holla, Ø.L.; Heldal, K.; Haugaa, K.H.; Hysing, J. QT Prolongation Predicts Short-Term Mortality Independent of Comorbidity. EP Eur. 2019, 21, 1254–1260. [Google Scholar] [CrossRef]
- Tiyantara, M.S.; Furqon, M.; Paramita, S. Pathological Q Wave as an Indicator of Left Ventricular Ejection Fraction in Acute Myocardial Infarction. Med. J. Indones. 2016, 25, 98–103. [Google Scholar] [CrossRef]
- Delewi, R.; IJff, G.; van de Hoef, T.P.; Hirsch, A.; Robbers, L.F.; Nijveldt, R.; van der Laan, A.M.; van der Vleuten, P.A.; Lucas, C.; Tijssen, J.G.P.; et al. Pathological Q Waves in Myocardial Infarction in Patients Treated by Primary PCI. JACC Cardiovasc. Imaging 2013, 6, 324–331. [Google Scholar] [CrossRef] [Green Version]
- Ramos, R.; Albert, X.; Sala, J.; Garcia-Gil, M.; Elosua, R.; Marrugat, J.; Ponjoan, A.; Grau, M.; Morales, M.; Rubió, A.; et al. Prevalence and Incidence of Q-Wave Unrecognized Myocardial Infarction in General Population: Diagnostic Value of the Electrocardiogram. The REGICOR Study. Int. J. Cardiol. 2016, 225, 300–305. [Google Scholar] [CrossRef]
- Pelli, A.; Junttila, M.J.; Kenttä, T.V.; Schlögl, S.; Zabel, M.; Malik, M.; Reichlin, T.; Willems, R.; Vos, M.A.; Harden, M.; et al. Q Waves Are the Strongest Electrocardiographic Variable Associated with Primary Prophylactic Implantable Cardioverter-Defibrillator Benefit: A Prospective Multicentre Study. EP Eur. 2022, 24, 774–783. [Google Scholar] [CrossRef]
- Godsk, P.; Jensen, J.S.; Abildstrøm, S.Z.; Appleyard, M.; Pedersen, S.; Mogelvang, R. Prognostic Significance of Electrocardiographic Q-Waves in a Low-Risk Population. EP Eur. 2012, 14, 1012–1017. [Google Scholar] [CrossRef]
- Schröder, L.C.; Holkeri, A.; Eranti, A.; Haukilahti, M.A.E.; Kerola, T.; Kenttä, T.V.; Noponen, K.; Seppänen, T.; Rissanen, H.; Heliövaara, M.; et al. Poor R-Wave Progression as a Predictor of Sudden Cardiac Death in the General Population and Subjects with Coronary Artery Disease. Heart Rhythm 2022, 19, 952–959. [Google Scholar] [CrossRef] [PubMed]
- Anttila, I.J.T.; Nikus, K.C.; Lehtimaki, T.; Kahonen, M.; on behalf of Health 2000 Survey. Relation of Poor R-Wave Progression to Risk of Cardiovascular Mortality. Eur. Heart J. 2013, 34, P1540. [Google Scholar] [CrossRef]
- Bjurman, C.; Larsson, M.; Johanson, P.; Petzold, M.; Lindahl, B.; Fu, M.L.X.; Hammarsten, O. Small Changes in Troponin T Levels Are Common in Patients with Non–ST-Segment Elevation Myocardial Infarction and Are Linked to Higher Mortality. J. Am. Coll. Cardiol. 2013, 62, 1231–1238. [Google Scholar] [CrossRef] [PubMed] [Green Version]
- Giannitsis, E.; Becker, M.; Kurz, K.; Hess, G.; Zdunek, D.; Katus, H.A. High-Sensitivity Cardiac Troponin T for Early Prediction of Evolving Non–ST-Segment Elevation Myocardial Infarction in Patients with Suspected Acute Coronary Syndrome and Negative Troponin Results on Admission. Clin. Chem. 2010, 56, 642–650. [Google Scholar] [CrossRef] [PubMed] [Green Version]
- Wereski, R.; Chapman, A.R.; Lee, K.K.; Smith, S.W.; Lowe, D.J.; Gray, A.; Mills, N.L. High-Sensitivity Cardiac Troponin Concentrations at Presentation in Patients With ST-Segment Elevation Myocardial Infarction. JAMA Cardiol. 2020, 5, 1302. [Google Scholar] [CrossRef]
- Hartman, M.H.T.; Eppinga, R.N.; Vlaar, P.J.J.; Lexis, C.P.H.; Lipsic, E.; Haeck, J.D.E.; van Veldhuisen, D.J.; van der Horst, I.C.C.; van der Harst, P. The Contemporary Value of Peak Creatine Kinase-MB after ST-Segment Elevation Myocardial Infarction above Other Clinical and Angiographic Characteristics in Predicting Infarct Size, Left Ventricular Ejection Fraction, and Mortality: Peak CK-MB Predicts Infarct Size, LVEF and Mortality. Clin. Cardiol. 2017, 40, 322–328. [Google Scholar] [CrossRef] [Green Version]
- Pöyhönen, P.; Kylmälä, M.; Vesterinen, P.; Kivistö, S.; Holmström, M.; Lauerma, K.; Väänänen, H.; Toivonen, L.; Hänninen, H. Peak CK-MB Has a Strong Association with Chronic Scar Size and Wall Motion Abnormalities after Revascularized Non-Transmural Myocardial Infarction—A Prospective CMR Study. BMC Cardiovasc. Disord. 2018, 18, 27. [Google Scholar] [CrossRef]

| Characteristics | Total (n = 80) | Acute HF (n = 49) | Control Group (n = 31) | p-Value |
|---|---|---|---|---|
| Age, years | 65.18 ± 12.98 (35–88) | 67.98 ± 12.77 (35–88) | 60.74 ± 12.22 (36–87) | 0.014 |
| Area of residence Urban, n (%) Rural, n (%) | 40 (50%) 40 (50%) | 25 (51.0%) 24 (49.0%) | 15 (48.4%) 16 (51.6%) | 0.818 |
| Gender Male, n (%) Female, n (%) | 51 (63.8%) 29 (36.3%) | 28 (57.1%) 21 (42.9%) | 23 (74.2%) 8 (25.8%) | 0.122 |
| Current smoker status, n (%) | 39 (48.8%) | 22 (44.9%) | 17 (54.8%) | 0.386 |
| Excessive Alcohol consumption, n (%) | 23 (28.8%) | 13 (26.5%) | 10 (32.3%) | 0.581 |
| Hypertension, n (%) | 55 (68.8%) | 37 (75.5%) | 18 (58.1%) | 0.101 |
| Hyperlipidemia, n (%) | 33 (41.3%) | 23 (46.9%) | 10 (32.3%) | 0.194 |
| Diabetes, n (%) | 25 (31.3%) | 17 (34.7%) | 8 (25.8%) | 0.403 |
| Hyperuricemia, n (%) | 39 (48.8%) | 26 (53.1%) | 13 (41.9%) | 0.332 |
| Obesity, n (%) | 37 (46.3%) | 22 (44.9%) | 15 (48.4%) | 0.760 |
| CKD, n (%) | 62 (78.5%) | 42 (85.7%) | 20 (66.7%) | 0.046 |
| Anemia, n (%) | 22 (27.5%) | 16 (32.7%) | 6 (19.4%) | 0.194 |
| Infection, n (%) | 20 (25.0%) | 15 (30.6%) | 5 (16.1%) | 0.145 |
| Atrial fibrillation, n (%) | 34 (42.5%) | 26 (53.1%) | 8 (25.8%) | 0.016 |
| COPD, n (%) | 14 (17.5%) | 12 (24.5%) | 2 (6.5%) | 0.039 |
| Ischemic heart disease, n (%) | 29 (36.3%) | 19 (38.8%) | 10 (32.3%) | 0.555 |
| Infection, n (%) | 20 (25.0%) | 15 (30.6%) | 5 (16.1%) | 0.145 |
| Mortality rate, n (%) | 5 (6.3%) | 5 (10.2%) | 0 (0%) | 0.066 |
| Impaired self-care capacity, n (%) | 18 (22.5%) | 16 (32.7%) | 2 (6.5%) | 0.006 |
| Treatment | Total (n = 80) | Acute HF (n = 49) | Control Group (n = 31) | p-Value |
|---|---|---|---|---|
| Loop-diuretics, n (%) | 62 (77.5%) | 47 (95.9%) | 15 (48.4%) | <0.001 |
| MRA, n (%) | 51 (63.8%) | 35 (71.4%) | 16 (51.6%) | 0.072 |
| ACEI/ARBs/ARNi, n (%) | 48 (60.0%) | 29 (59.2%) | 19 (61.3%) | 0.851 |
| SGLT2i, n (%) | 10 (12.5%) | 8 (16.3%) | 2 (6.5%) | 0.193 |
| Beta-blockers, n (%) | 54 (67.5%) | 33 (67.3%) | 21 (67.7%) | 0.971 |
| Calcium-channel blockers, n (%) | 18 (22.5%) | 12 (24.5%) | 6 (19.4%) | 0.592 |
| Digoxin, n (%) | 7 (8.8%) | 4 (8.2%) | 3 (9.7%) | 0.815 |
| Amiodarone, n (%) | 19 (23.8%) | 16 (32.7%) | 3 (9.7%) | 0.019 |
| Dobutamine, n (%) | 6 (7.5%) | 5 (10.2%) | 1 (3.2%) | 0.248 |
| Vasopressor drugs, n (%) | 4 (5.0%) | 4 (8.2%) | 0 (0.0%) | 0.103 |
| Nitroglycerine, n (%) | 17 (21.3%) | 17 (34.7%) | 0 (0.0%) | 0.001 |
| Statine, n (%) | 49 (61.3%) | 33 (67.3%) | 16 (51.6%) | 0.159 |
| Trimetazidine, n (%) | 6 (7.5%) | 4 (8.2%) | 2 (6.5%) | 0.777 |
| CPAP non-invasive ventilation, n (%) | 13 (16.3%) | 13 (26.5%) | 0 (0.0%) | 0.002 |
| Invasive ventilation, n (%) | 4 (5.0%) | 4 (8.2%) | 0 (0.0%) | 0.103 |
| Laboratory Test | Total (n = 80) | Acute HF (n = 49) | Control Group (n = 31) | p-Value | |||
|---|---|---|---|---|---|---|---|
| Mean ± STD | Range (Min–Max) | Mean ± STD | Range (Min–Max) | Mean ± STD | Range (Min–Max) | ||
| Hemoglobin (g/dL) | 13.28 ± 1.98 | 7.6–17.1 | 12.98 ± 2.18 | 7.6–17.1 | 13.76 ± 1.51 | 10.7–16.2 | 0.089 |
| Hematocrit (%) | 40.16 ± 5.97 | 24.5–55.9 | 39.81 ± 6.83 | 24.5–55.9 | 40.72 ± 4.33 | 32.7–48.5 | 0.509 |
| Platelets (×103/µL) | 232.45 ± 73.64 | 59–411 | 234.63 ± 81.033 | 59–401 | 229 ± 61.27 | 130–411 | 0.741 |
| Leukocytes (×109/L) | 10.34 ± 3.87 | 1.38–25.47 | 11.12 ± 4.32 | 1.38–25.47 | 9.11 ± 2.62 | 5.06–16.99 | 0.011 |
| RBCs (×1012/L) | 4.5 ± 0.73 | 2.7–6.5 | 4.48 ± 0.85 | 2.7–6.5 | 4.55 ± 0.49 | 3.5–5.4 | 0.667 |
| CRP (mg/dL) | 2.66 ± 3.98 | 0.03–24.50 | 2.52 ± 2.86 | 0.06–13.63 | 2.88 ± 5.34 | 0.03–24.50 | 0.690 |
| Na+ (mmol/L) | 138.44 ± 4.73 | 116–147 | 137.8 ± 5.62 | 116–147 | 139.45 ± 2.61 | 133–145 | 0.079 |
| K+ (mmol/L) | 4.49 ± 0.63 | 3.3–7.2 | 4.56 ± 0.719 | 3.3–7.2 | 4.37 ± 0.45 | 3.8–5.5 | 0.178 |
| Cl- (mmol/L) | 101.57 ± 9.54 | 36–115 | 100.82 ± 11.44 | 36–115 | 102.92 ± 4.34 | 94–110 | 0.373 |
| Ca2+ (mmol/L) | 8.99 ± 0.58 | 7.68–10.70 | 8.87 ± 0.61 | 7.68–10.2 | 9.19 ± 0.46 | 8.44–10.7 | 0.016 |
| Mg+ (mmol/L) | 8.99 ± 0.58 | 1.46–3.11 | 2.06 ± 0.33 | 1.46–3.11 | 1.97 ± 0.16 | 1.58–2.25 | 0.118 |
| Urea (mg/dL) | 60.34 ± 31.92 | 17–184 | 69.69 ± 34.70 | 24–184 | 45.5 ± 19.71 | 17–95 | 0.001 |
| Creatinine (mg/dL) | 1.19 ± 0.49 | 0.53–3.54 | 1.32 ± 0.54 | 0.71–3.54 | 0.98 ± 0.30 | 0.53–1.81 | 0.002 |
| Urinary ACR (mg/g) | 152.38 ± 337.57 | 3–2256 | 231.61 ± 413.00 | 5–225 | 27.13 ± 26.48 | 3–122.3 | 0.007 |
| Spot UNa (mEq/L) | 71.61 ± 46.95 | 15–220 | 59.29 ± 34.58 | 15–128 | 91.10 ± 57.03 | 15–220 | 0.003 |
| MAU (mg/L) | 122.19 ± 252.67 | 4–1431 | 175.06 ± 308.189 | 4–143 | 38.63 ± 66.122 | 4–286 | 0.018 |
| Spot urine creatinine (mg/dL) | 104.84 ± 90.03 | 11–547.17 | 87.20 ± 65.04 | 11–258 | 132.72 ± 115.17 | 19.66–547.17 | 0.027 |
| Uric acid (mg/dL) | 7.30 ± 2.42 | 1.7–15.7 | 7.79 ± 2.49 | 1.7–15.7 | 6.47 ± 2.11 | 3.3–10.6 | 0.022 |
| TSH (µIU/L) | 2.58 ± 4.40 | 0.12–38 | 3.04 ± 5.57 | 0.14–38 | 1.88 ± 1.13 | 0.12–5.11 | 0.258 |
| Feritin (µg/L) | 220.13 ± 273.24 | 29–2100 | 232 ± 318.12 | 29–210 | 197.37 ± 158.61 | 36–560 | 0.618 |
| Serum iron (µg/dL) | 57.63 ± 33.44 | 11–233 | 50.10 ± 23.93 | 11–103 | 69.93 ± 42.51 | 25–233 | 0.024 |
| Glucose (mg/dL) | 149.21 ± 80.62 | 25–403 | 161.45 ± 86.78 | 25–403 | 127.79 ± 64.50 | 73–366 | 0.057 |
| T-Col (mg/dL) | 163.91 ± 50.74 | 79–292 | 162.14 ± 56.63 | 79–292 | 166.80 ± 40.05 | 101–238 | 0.695 |
| LDL-c (mg/dL) | 113.18 ± 48.23 | 34–247 | 116.13 ± 55.14 | 34–247 | 108.20 ± 33.81 | 45.8–172 | 0.433 |
| HDL-c (mg/dL) | 38.43 ± 13.74 | 11–75 | 36.49 ± 12.57 | 11–68 | 41.60 ± 15.16 | 18–75 | 0.109 |
| TG (mg/dL) | 114.96 ± 65.04 | 32–359 | 112.08 ± 59.94 | 36–354 | 119.67 ± 73.45 | 32–359 | 0.618 |
| Bil (mg/dL) | 1.08 ± 0.91 | 0.2–5.2 | 1.24 ± 1.08 | 0.2–5.2 | 0.83 ± 0.45 | 0.2–2.1 | 0.024 |
| Lactic acid (mg/dL) | 2.15 ± 2.06 | 0.50–10.80 | 2.28 ± 2.18 | 0.70–10.8 | 1.84 ± 1.77 | 0.50–7.40 | 0.495 |
| Serum bicarbonate (mEq/L) | 24.36 ± 4.95 | 15.90–38.30 | 23.98 ± 5.42 | 15.9–38.3 | 25.01 ± 4.01 | 19.20–34.80 | 0.420 |
| GGT (U/L) | 98.30 ± 115.77 | 11–804 | 121.22 ± 136.63 | 11–804 | 60.87 ± 53.02 | 13–216 | 0.007 |
| ALP (U/L) | 108.63 ± 52.19 | 31–348 | 123.57 ± 57.62 | 44–348 | 85.14 ± 30.64 | 31–168 | <0.001 |
| LDH (U/L) | 263.56 ± 107.30 | 138–849 | 298.90 ± 120.25 | 149–849 | 207.03 ± 42.02 | 138–305 | <0.001 |
| Serum total proteins (g/dL) | 6.71 ± 0.69 | 5–8.4 | 6.5 ± 0.71 | 5–8 | 6.93 ± 0.60 | 5.6–8.4 | 0.022 |
| CK-MB (U/L) | 41.16 ± 84.02 | 1.5–732 | 51 ± 105 | 1.5–732 | 26 ± 22 | 5.6–130 | 0.213 |
| CK (U/L) | 347.20 ± 905.00 | 1.5–4567 | 409 ± 965 | 12–603 | 251 ± 809 | 1.5–4567 | 0.453 |
| Myoglobin (ng/mL) | 375.13 ± 661.64 | 25.9–3500 | 290 ± 311 | 25.9–143 | 598 ± 1181 | 53–3500 | 0.489 |
| D-dimer (ng/mL) | 2.43 ± 2.14 | 0.04–8 | 2.57 ± 2.06 | 0.1–8 | 2.21 ± 2.26 | 0.04–7 | 0.470 |
| Characteristics | Acute HF (n = 49) |
|---|---|
| Etiology of HF | |
| Ischemic, n (%) | 24 (51.1%) |
| Alcoholic CMP, n (%) | 5 (10.6%) |
| Valvular, n (%) | 6 (12.8%) |
| HTN, n (%) | 7 (14.9%) |
| NYHA class | |
| Class I, n (%) | 1 (2.1%) |
| Class II, n (%) | 11 (22.9%) |
| Class III, n (%) | 28 (58.3%) |
| Class IV, n (%) | 8 (16.7%) |
| Type of HF | |
| Reduced EF, n (%) | 39 (81.3%) |
| Mildly reduced EF, n (%) | 0 (0.0%) |
| Preserved EF, n (%) | 9 (18.8%) |
| Parameter | Total (n = 80) | Acute HF (n = 49) | Control Group (n = 31) | p-Value | |||
|---|---|---|---|---|---|---|---|
| Mean ± STD | Range (Min–Max) | Mean ± STD | Range (Min–Max) | Mean ± STD | Range (Min–Max) | ||
| LVEF (%) | 35.02 ± 17.62 | 10–76 | 30.00 ± 15.87 | 10–65 | 42.96 ± 17.56 | 12–76 | 0.01 |
| LA area (mm2) | 27.67 ± 10.59 | 13.8–94 | 30.14 ± 12.16 | 13.8–94 | 23.78 ± 5.75 | 14.2–35.1 | 0.008 |
| LVEDD (mm) | 56.95 ± 8.47 | 38–74 | 58.28 ± 7.87 | 44–74 | 54.19 ± 8.19 | 38–74 | 0.029 |
| RVEDD (mm) | 35.37 ± 7.011 | 24–55 | 36.25 ± 7.04 | 25–55 | 34.00 ± 6.84 | 24–51 | 0.165 |
| sPAP (mmHg) | 38.94 ± 22.71 | 10–97 | 45.14 ± 22.51 | 10–97 | 29.31 ± 19.64 | 10–75 | 0.002 |
| TAPSE (mm) | 18.01 ± 4.09 | 7–26 | 17.59 ± 4.27 | 7–26 | 18.68 ± 3.77 | 11–25 | 0.251 |
| MAPSE (mm) | 12.03 ± 2.90 | 5–19 | 11.55 ± 2.70 | 7–19 | 12.81 ± 3.08 | 5–18 | 0.058 |
| Biomarker | Descriptives | Acute HF (n = 49) | Control Group (n = 31) | p-Value (Mann–Whitney Test) | |||
| Values | SEM | Values | SEM | <0.001 | |||
| NT-proBNP (ng/L) | Mean | 11,361.57 | 1273.014 | 370.44 | 86.615 | ||
| 95% CI for mean | Lower bound | 8802.00 | 193.54 | ||||
| Upper bound | 13,921.14 | 547.33 | |||||
| 5% trimmed mean | 10,890.67 | 297.41 | |||||
| Median | 7922.00 | 267.00 | |||||
| Variance | 79,407,713.292 | 232,567.384 | |||||
| STD | 8911.101 | 482.252 | |||||
| Minimum | 1168 | 32 | |||||
| Maximum | 30,000 | 2364 | |||||
| Range | 28,832 | 2332 | |||||
| Interquartile range | 13,187 | 394 | |||||
| Skewness | 0.781 | 0.340 | 2.832 | 0.421 | |||
| Kurtosis | −0.556 | 0.668 | 9.616 | 0.821 | |||
| Shapiro–Wilk test | <0.001 | <0.001 | |||||
| Biomarker | Descriptives | Acute HF (n = 49) | Control Group (n = 31) | p-Value (Mann-Whitney Test) | |||
| Values | SEM | Values | SEM | <0.001 | |||
| hs-cTnI (ng/L) | Mean | 2688.029 | 1089.6966 | 558.547 | 342.4639 | ||
| 95% CI for mean | Lower bound | 497.047 | −140.857 | ||||
| Upper bound | 4879.011 | 1257.952 | |||||
| 5% trimmed mean | 1256.013 | 184.500 | |||||
| Median | 53.000 | 6.430 | |||||
| Variance | 58,184,499.698 | 3,635,726.446 | |||||
| STD | 7627.8765 | 1906.7581 | |||||
| Minimum | 0.0 | 0.1 | |||||
| Maximum | 36,701.0 | 9925.0 | |||||
| Range | 36,701.0 | 9924.9 | |||||
| Interquartile range | 349.0 | 19.5 | |||||
| Skewness | 3.363 | 0.340 | 4.430 | 0.421 | |||
| Kurtosis | 11.124 | 0.668 | 20.867 | 0.821 | |||
| Shapiro–Wilk test | <0.001 | <0.001 | |||||
| Biomarker | Descriptives | Acute HF (n = 49) | Control Group (n = 31) | p-Value (Mann-Whitney Test) | |||
| Values | SEM | Values | SEM | <0.001 | |||
| log NT-proBNP (ng/L) | Mean | 3.8924 | 0.05928 | 2.2943 | 0.09041 | ||
| 95% CI for mean | Lower bound | 3.7733 | 2.1097 | ||||
| Upper bound | 4.0116 | 2.4790 | |||||
| 5% trimmed mean | 3.9034 | 2.2810 | |||||
| Median | 3.8988 | 2.4265 | |||||
| Variance | 0.172 | 0.253 | |||||
| STD | 0.41494 | 0.50340 | |||||
| Minimum | 3.07 | 1.51 | |||||
| Maximum | 4.48 | 3.37 | |||||
| Range | 1.41 | 1.87 | |||||
| Interquartile range | 0.61 | 0.83 | |||||
| Skewness | −0.408 | 0.340 | 0.173 | 0.421 | |||
| Kurtosis | −0.836 | 0.668 | −0.919 | 0.821 | |||
| Shapiro–Wilk test | 0.018 | 0.148 | |||||
| Biomarker | Descriptives | Acute HF (n = 49) | Control Group (n = 31) | p-Value (Mann-Whitney Test) | |||
| Values | SEM | Values | SEM | <0.001 | |||
| log hs-cTnI (ng/L) | Mean | 1.8838 | 0.19265 | 1.0818 | 0.20568 | ||
| 95% CI for mean | Lower bound | 1.4964 | 0.6617 | ||||
| Upper bound | 2.2711 | 1.5018 | |||||
| 5% trimmed mean | 1.9211 | 1.0248 | |||||
| Median | 1.7243 | 0.8082 | |||||
| Variance | 1.819 | 1.311 | |||||
| STD | 1.34853 | 1.14517 | |||||
| Minimum | −1.52 | −1.02 | |||||
| Maximum | 4.56 | 4.00 | |||||
| Range | 6.09 | 5.01 | |||||
| Interquartile range | 1.32 | 0.94 | |||||
| Skewness | −0.213 | 0.340 | 1.110 | 0.421 | |||
| Kurtosis | 0.841 | 0.668 | 0.908 | 0.821 | |||
| Shapiro–Wilk test | 0.022 | 0.002 | |||||
| Parameter | Total (n = 80) | Acute HF (n = 49) | Control Group (n = 31) | p-Value | |||
| Mean ± STD | Range (Min–Max) | Mean ± STD | Range (Min–Max) | Mean ± STD | Range (Min–Max) | ||
| HR (b/min) | 96.96 ± 29.32 | 38–174 | 101.29 ± 28.77 | 38–160 | 90.13 ± 29.34 | 46–174 | 0.098 |
| QRSi (ms) | 88.81 ± 32.20 | 40–180 | 91.94 ± 33.55 | 40–180 | 83.87 ± 29.79 | 40–160 | 0.278 |
| PRi (ms) | 163.19 ± 39.86 | 100–310 | 160.83 ± 50.210 | 100–310 | 165.54 ± 26.72 | 120–230 | 0.687 |
| QTi (ms) | 365.15 ± 65.59 | 220–560 | 368.37 ± 73.77 | 220–560 | 360.37 ± 50.76 | 280–520 | 0.584 |
| cQTi (ms) | 422.61 ± 66.25 | 275–685 | 432.49 ± 79.32 | 275–685 | 407 ± 32.88 | 342–476 | 0.050 |
| Average HR—Holter (b/min) | 78.18 ± 19.01 | 45–136 | 77.13 ± 17.06 | 45–131 | 80.09 ± 22.43 | 47–136 | 0.561 |
| PVCs—Holter (n) | 1591 ± 4231 | 0–2436 | 2119.79 ± 5131.21 | 0–24,364 | 718.95 ± 1491.45 | 0–5419 | 0.121 |
| PVCs—Holter (%) | 1.81 ± 4.56 | 0–26.15 | 0.81 ± 1.51 | 0–26.15 | 0.32 ± 0.41 | 0–5.85 | 0.086 |
| Pattern | Total (n = 80) | Acute HF (n= 49) | Control Group (n= 31) | p-Value |
|---|---|---|---|---|
| Abnormal ECG, n (%) | 58 (72.5%) | 40 (81.6%) | 18 (58.1%) | 0.021 |
| Non-sinus rhythm, n (%) | 33 (41.3%) | 25 (51.0%) | 8 (25.8%) | 0.026 |
| LBBB, n (%) | 9 (11.3%) | 7 (14.3%) | 2 (6.5%) | 0.280 |
| prominent U wave, n (%) | 6 (7.5%) | 6 (12.2%) | 0 (0.0%) | 0.043 |
| pathological Q wave, n (%) | 15 (18.8%) | 12 (24.5%) | 3 (9.7%) | 0.098 |
| negative T wave, n (%) | 33 (41.3%) | 19 (38.8%) | 14 (45.2%) | 0.572 |
| PRWP, n (%) | 40 (50%) | 30 (61.2%) | 10 (32.3%) | 0.012 |
| LQRSV, n (%) | 5 (6.3%) | 3 (6.1%) | 2 (6.5%) | 0.953 |
| fQRS, n (%) | 17 (21.3%) | 13 (26.5%) | 4 (12.9%) | 0.147 |
| ST-segment modification, n (%) | 12 (15%) | 8 (16.3%) | 4 (12.9%) | 0.676 |
| Atrial fibrillation—Holter, n (%) | 22 (36.1%) | 18 (46.2%) | 4 (18.2%) | 0.029 |
| complex PVC’s—Holter, n (%) | 39 (62.9%) | 25 (62.5%) | 14 (63.6%) | 0.929 |
| Ventricular tachycardia—Holter, n (%) | 17 (27.9%) | 13 (33.3%) | 4 (18.2%) | 0.205 |
| HR Variability Parameters | Total (n = 40) | Acute HF (n = 22) | Control Group (n = 18) | p-Value | |||
|---|---|---|---|---|---|---|---|
| Mean ± STD | Range (Min–Max) | Mean ± STD | Range (Min–Max) | Mean ± STD | Range (Min–Max) | ||
| SDNN (ms) | 89.70 ± 40.43 | 25–226 | 85.73 ± 39.62 | 25–226 | 94.56 ± 42.01 | 49–191 | 0.499 |
| SDANN (ms) | 72.50 ± 33.41 | 17–169 | 65.73 ± 29.40 | 17–161 | 80.78 ± 36.89 | 42–169 | 0.159 |
| RMDDS (ms) | 41.65 ± 36 | 12–168 | 49.73 ± 41.98 | 12–168 | 31.78 ± 24.65 | 12–120 | 0.102 |
| HRVTi (ms) | 365 ± 161.56 | 100–810 | 341.36 ± 145.67 | 100–810 | 393.89 ± 179.05 | 210–810 | 0.313 |
| Parameter | NT-proBNP | hs-cTnI | CK-MB | Urinary ACR | Spot UNa |
|---|---|---|---|---|---|
| QRSi | p = 0.733; r = −0.05 | p = 0.853; r = −0.025 | p = 0.672; r = −0.062 | p = 0.324; r = −0.144 | p = 0.138; r = −0.215 |
| PRi | p = 0.090; r = −0.354 | p = 0.358; r = 0.196 | p = 0.559; r = 0.125 | p = 0.341; r = −0.203 | p = 0.484; r = 0.150 |
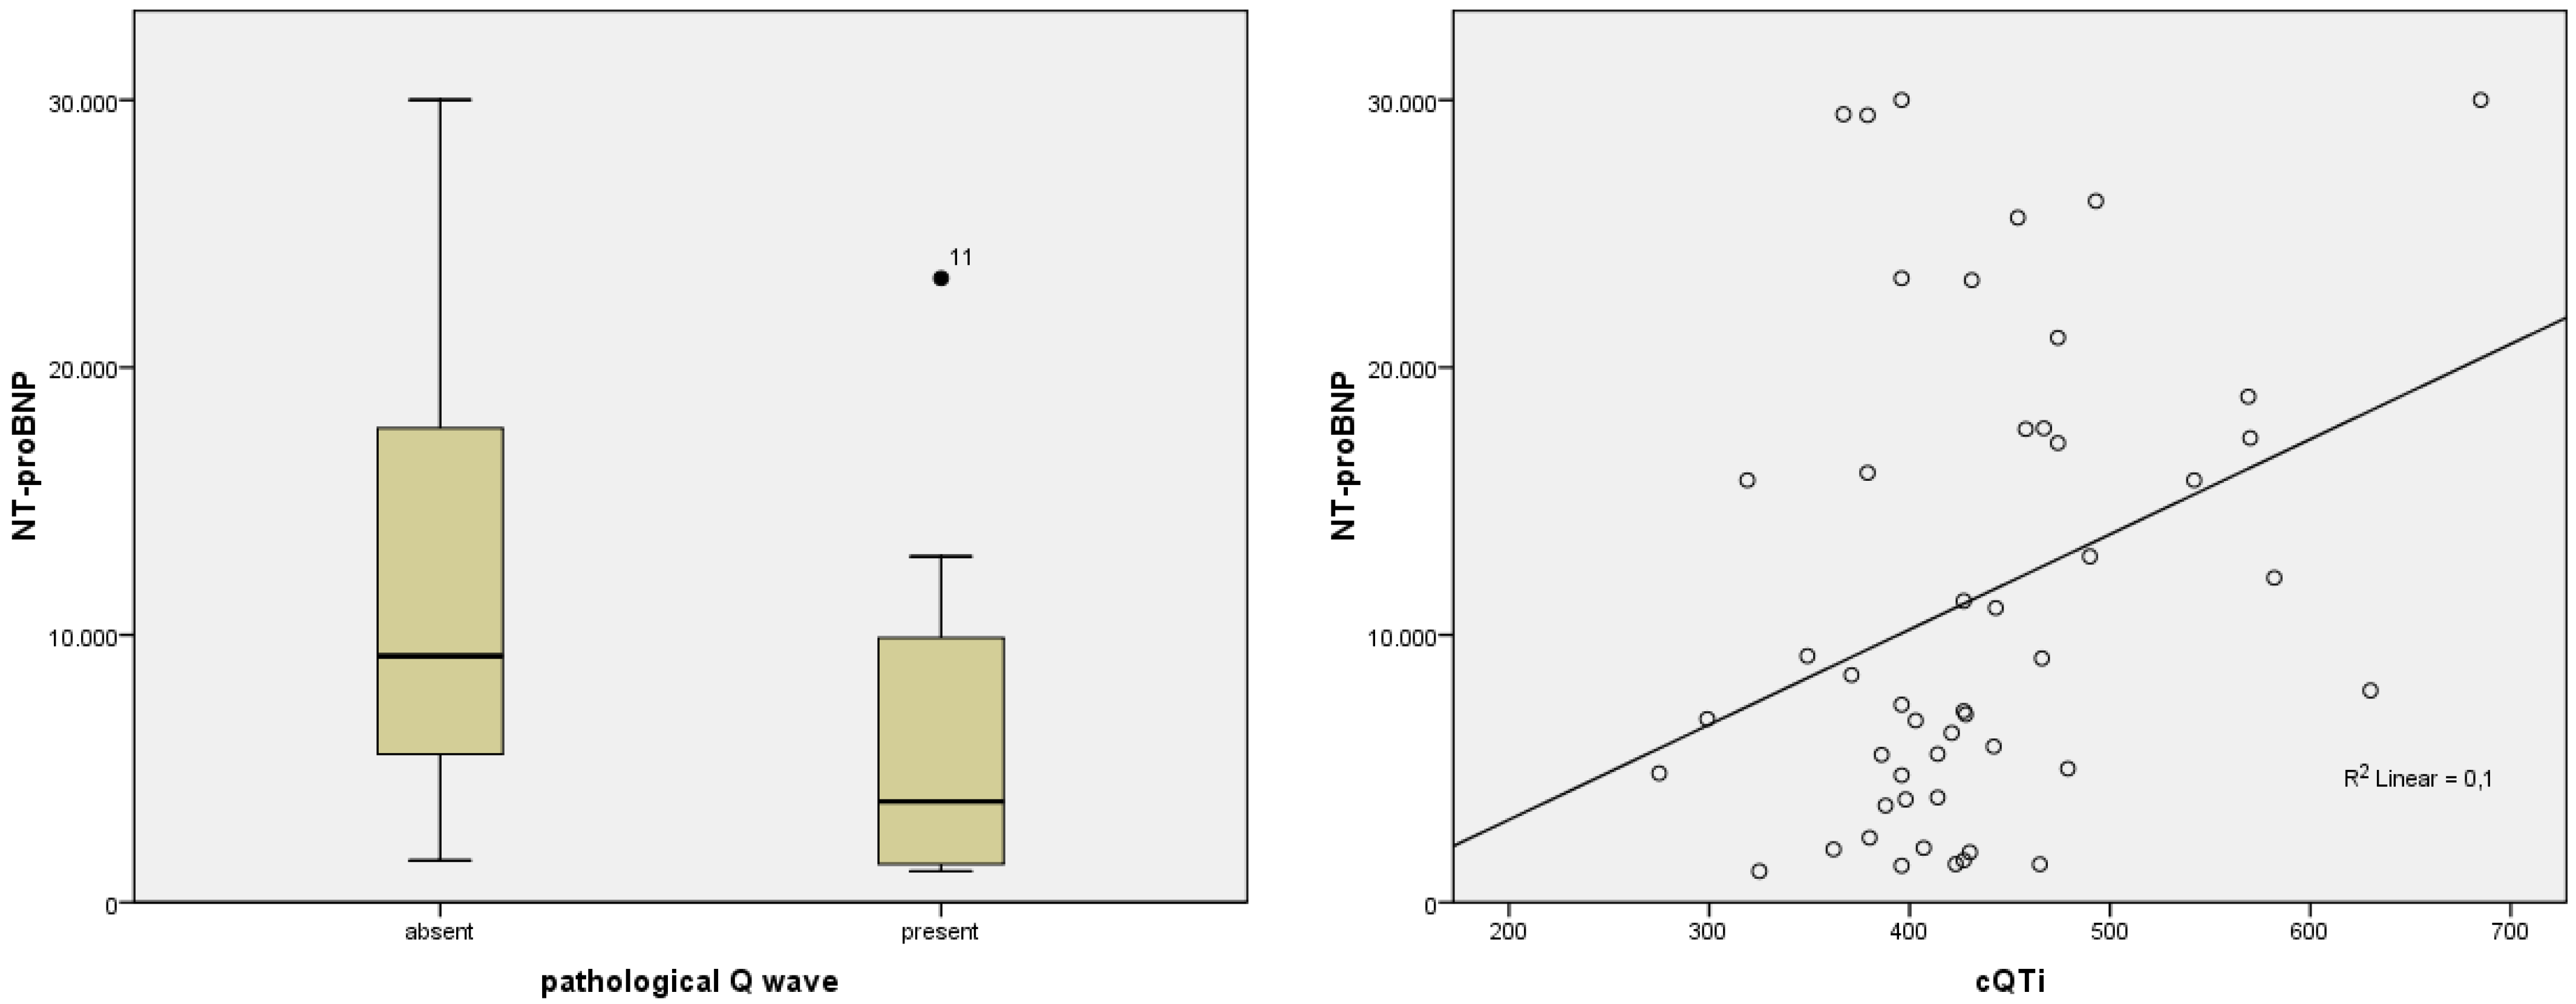
| QTi | p = 0.039; r = 0.296 | p = 0.885; r = −0.021 | p = 0.912; r = −0.016 | p = 0.010; r = 0.365 | p = 0.593; r = −0.078 |
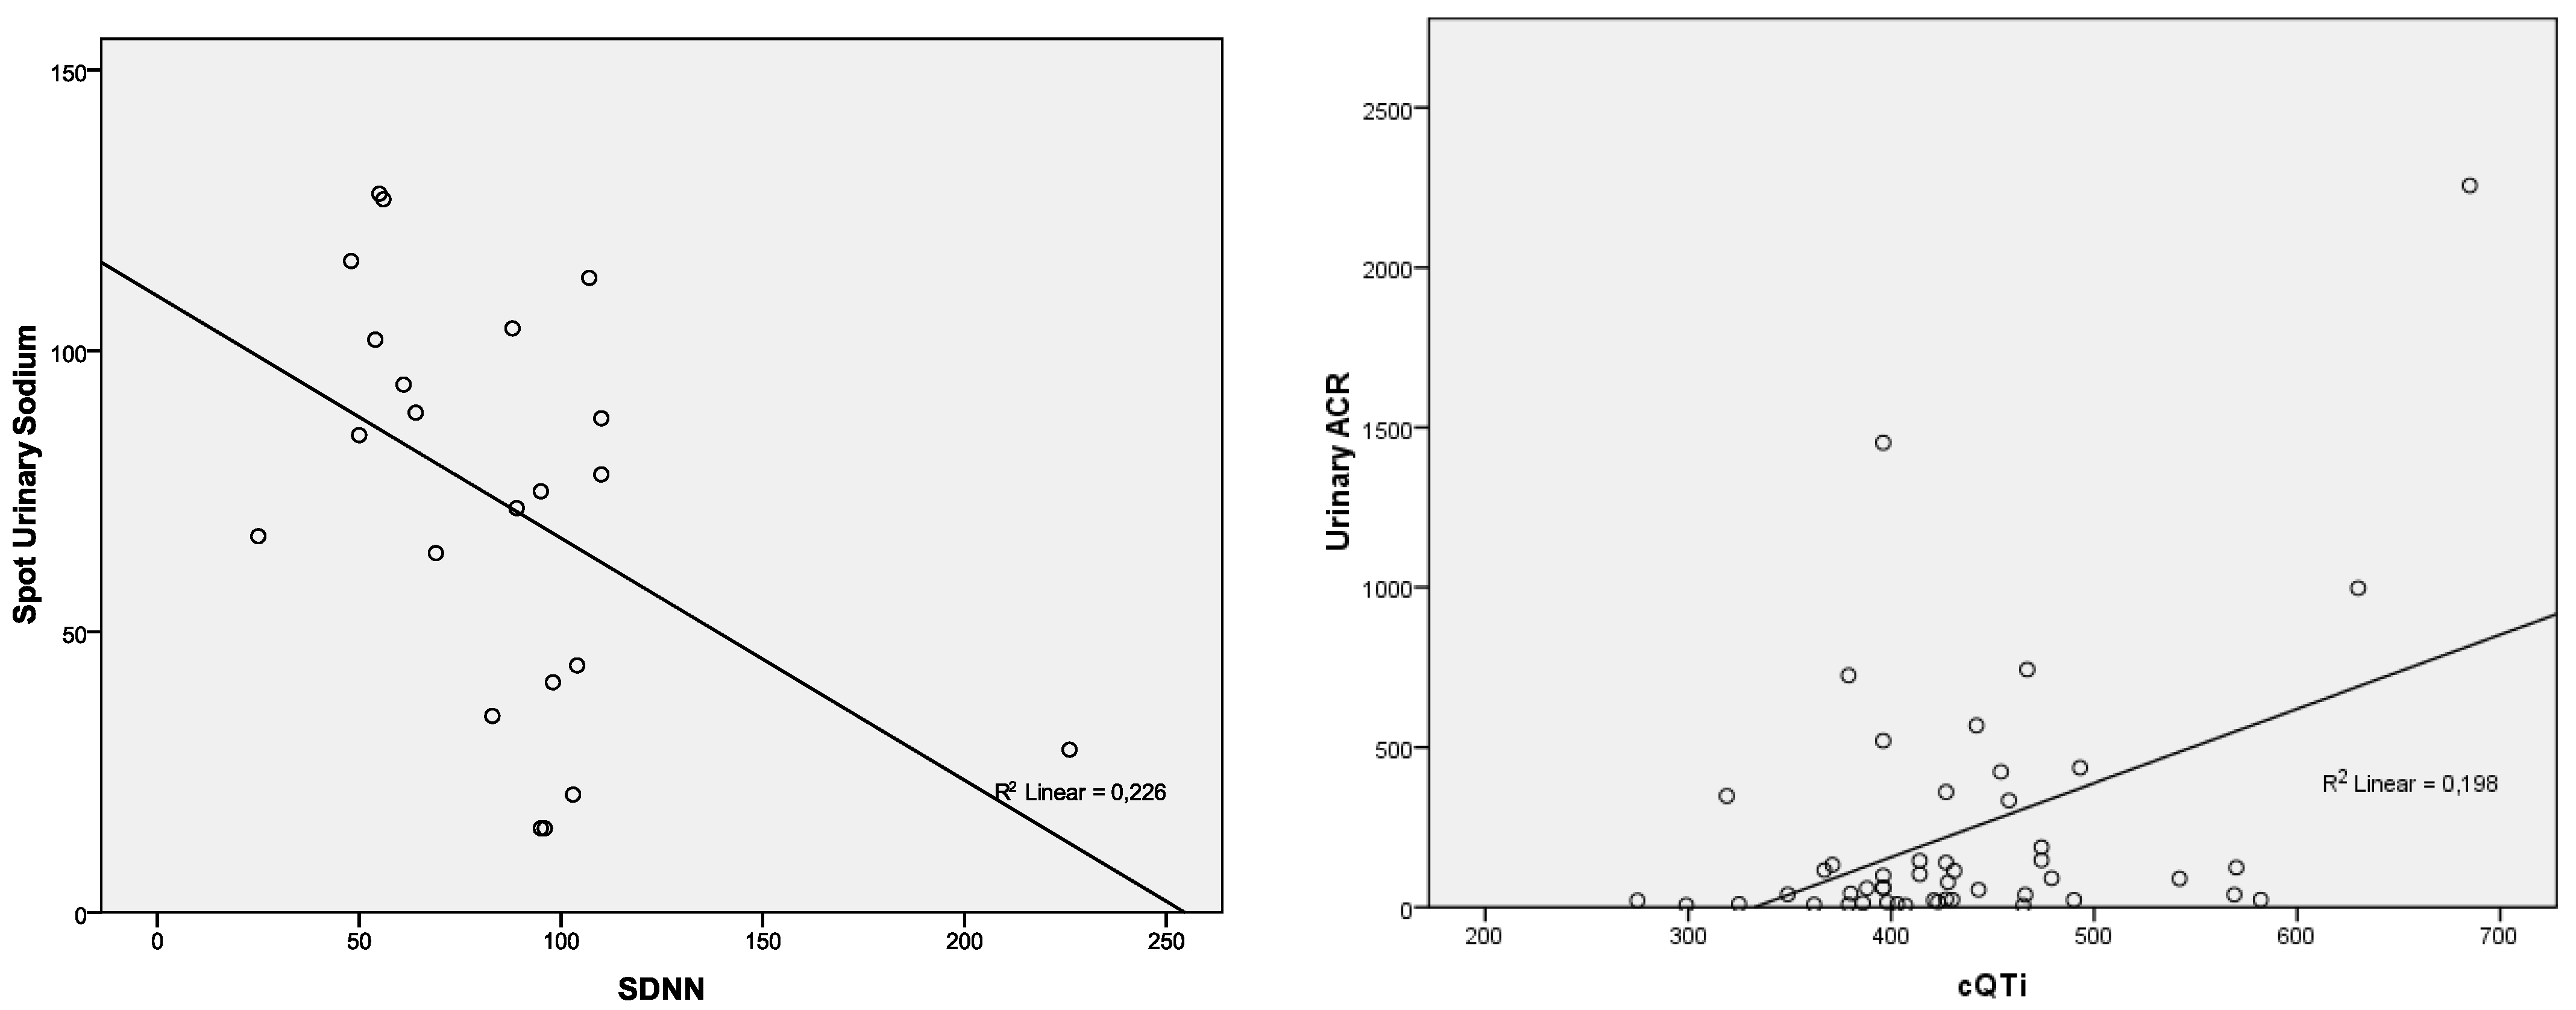
| cQTi | p = 0.027; r = 0.317 | p = 0.397; r = 0.124 | p = 0.786; r = 0.040 | p = 0.001; r = 0.445 | p = 0.782; r = −0.040 |
| Average HR—Holter | p = 0.411; r = 0.134 | p = 0.939; r = 0.013 | p = 0.553; r = 0.097 | p = 0.553; r = −0.097 | p = 0.152; r = −0.231 |
| SDNN—Holter | p = 0.579; r = 0.125 | p = 0.346; r = −0.211 | p = 0.297; r = −0.233 | p = 0.948; r = 0.015 | p = 0.025; r = −0.476 |
| SDANN—Holter | p = 0.746; r = 0.073 | p = 0.458; r = −0.167 | p = 0.346; r = −0.211 | p = 0.906; r = −0.027 | p = 0.075; r = −0.388; |
| RMDDS—Holter | p = 0.417; r = 0.182 | p = 0.373; r = −0.200 | p = 0.325; r = −0.220 | p = 0.890; r = 0.031 | p = 0.056; r = −0.414; |
| HRVTi—Holter | p = 0.960; r = 0.011 | p = 0.453; r = −0.169 | p = 0.304; r = −0.230 | p = 0.773; r = 0.065 | p = 0.095; r = −0.365 |
| PVCs (%)—Holter | p = 0.165; r = 0.224 | p = 0.722; r = −0.058 | p = 0.449; r = −0.123 | p = 0.353; r = 0.151 | p = 0.713; r = −0.060 |
| Pattern | NT-proBNP | hs-cTnI | CK-MB | Urinary ACR | Spot UNa |
|---|---|---|---|---|---|
| Pathological Q wave | p = 0.029; F = 5.057 | p = 0.236; F = 1.440 | p = 0.958; F = 0.003 | p = 0.562; F = 341 | p = 0.434; F = 0.624 |
| Prominent U wave | p = 0.140; F = 2.251 | p = 0.815; F = 0.055 | p = 0.713; F = 0.137 | p = 0.968; F = 0.002 | p = 0.759; F = 0.095 |
| Negative T wave | p = 0.672; F = 0.182 | p = 0.265; F = 1.275 | p = 0.867; F = 0.028 | p = 0.359; F = 0.859 | p = 0.723; F = 0.127 |
| PRWP | p = 0.512; F = 0.437 | p = 0.860; F = 0.031 | p = 0.564; F = 0.337 | p = 0.072; F = 3.384; | p = 0.916; F = 0.011 |
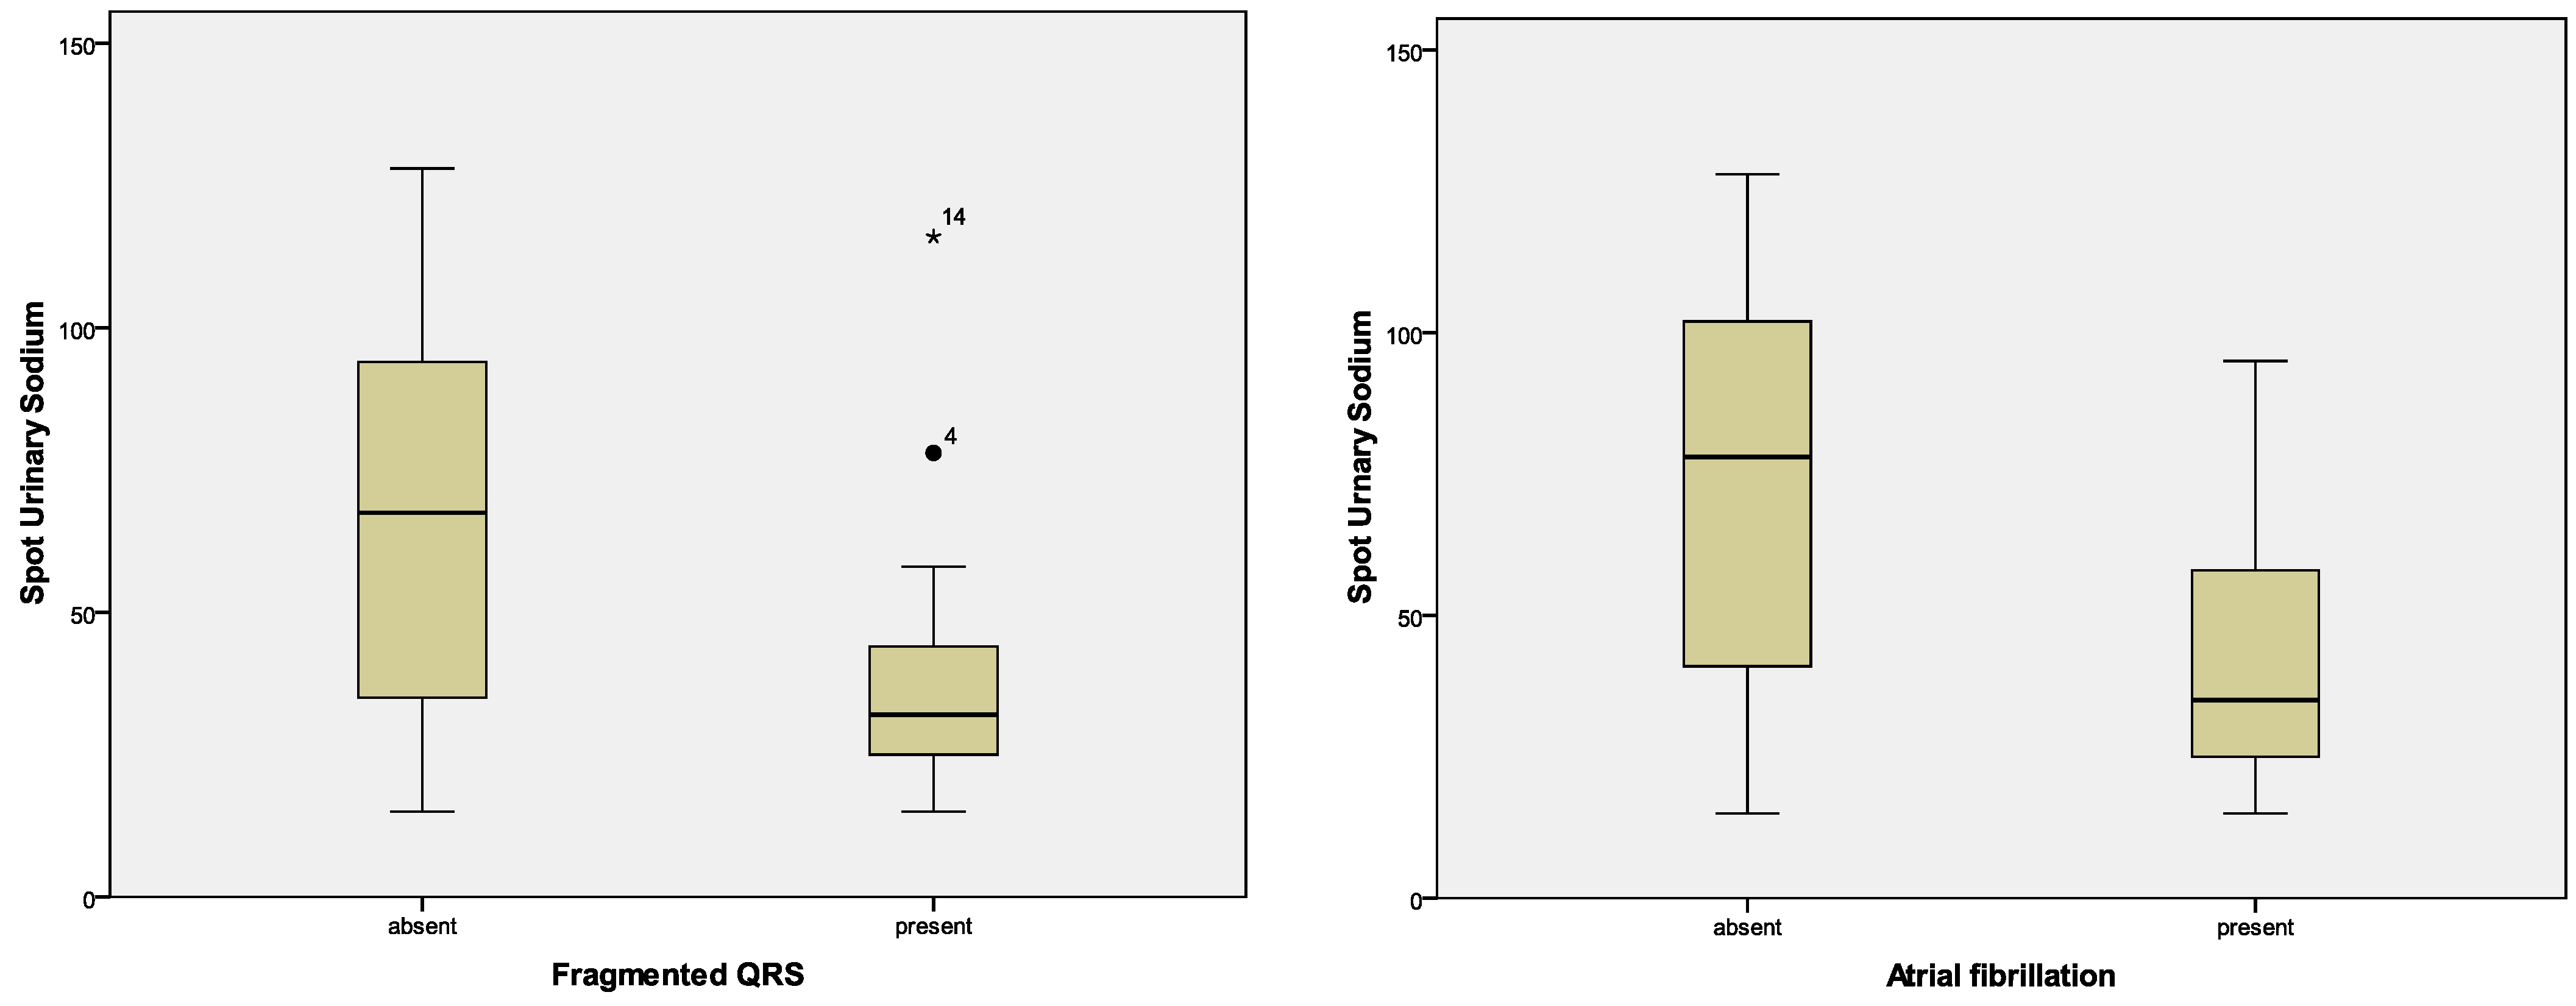
| fQRS | p = 0.272; F = 1.236 | p = 0.797; F = 0.067 | p = 0.555; F = 0.353 | p = 0.472; F = 0.527; | p = 0.020; F = 5.814 |
| ST-segment modification | p = 0.215; F = 1.582 | p = 0.038; F = 4.550 | p = 0.018; F = 6.021 | p = 0.720; F = 0.130 | p = 0.221; F = 1.536 |
| LBBB | p = 0.378; F = 0.792 | p = 0.796; F = 0.068 | p = 0.808; F = 0.060 | p = 0.202; F = 1.671 | p = 0.684; F = 0.168 |
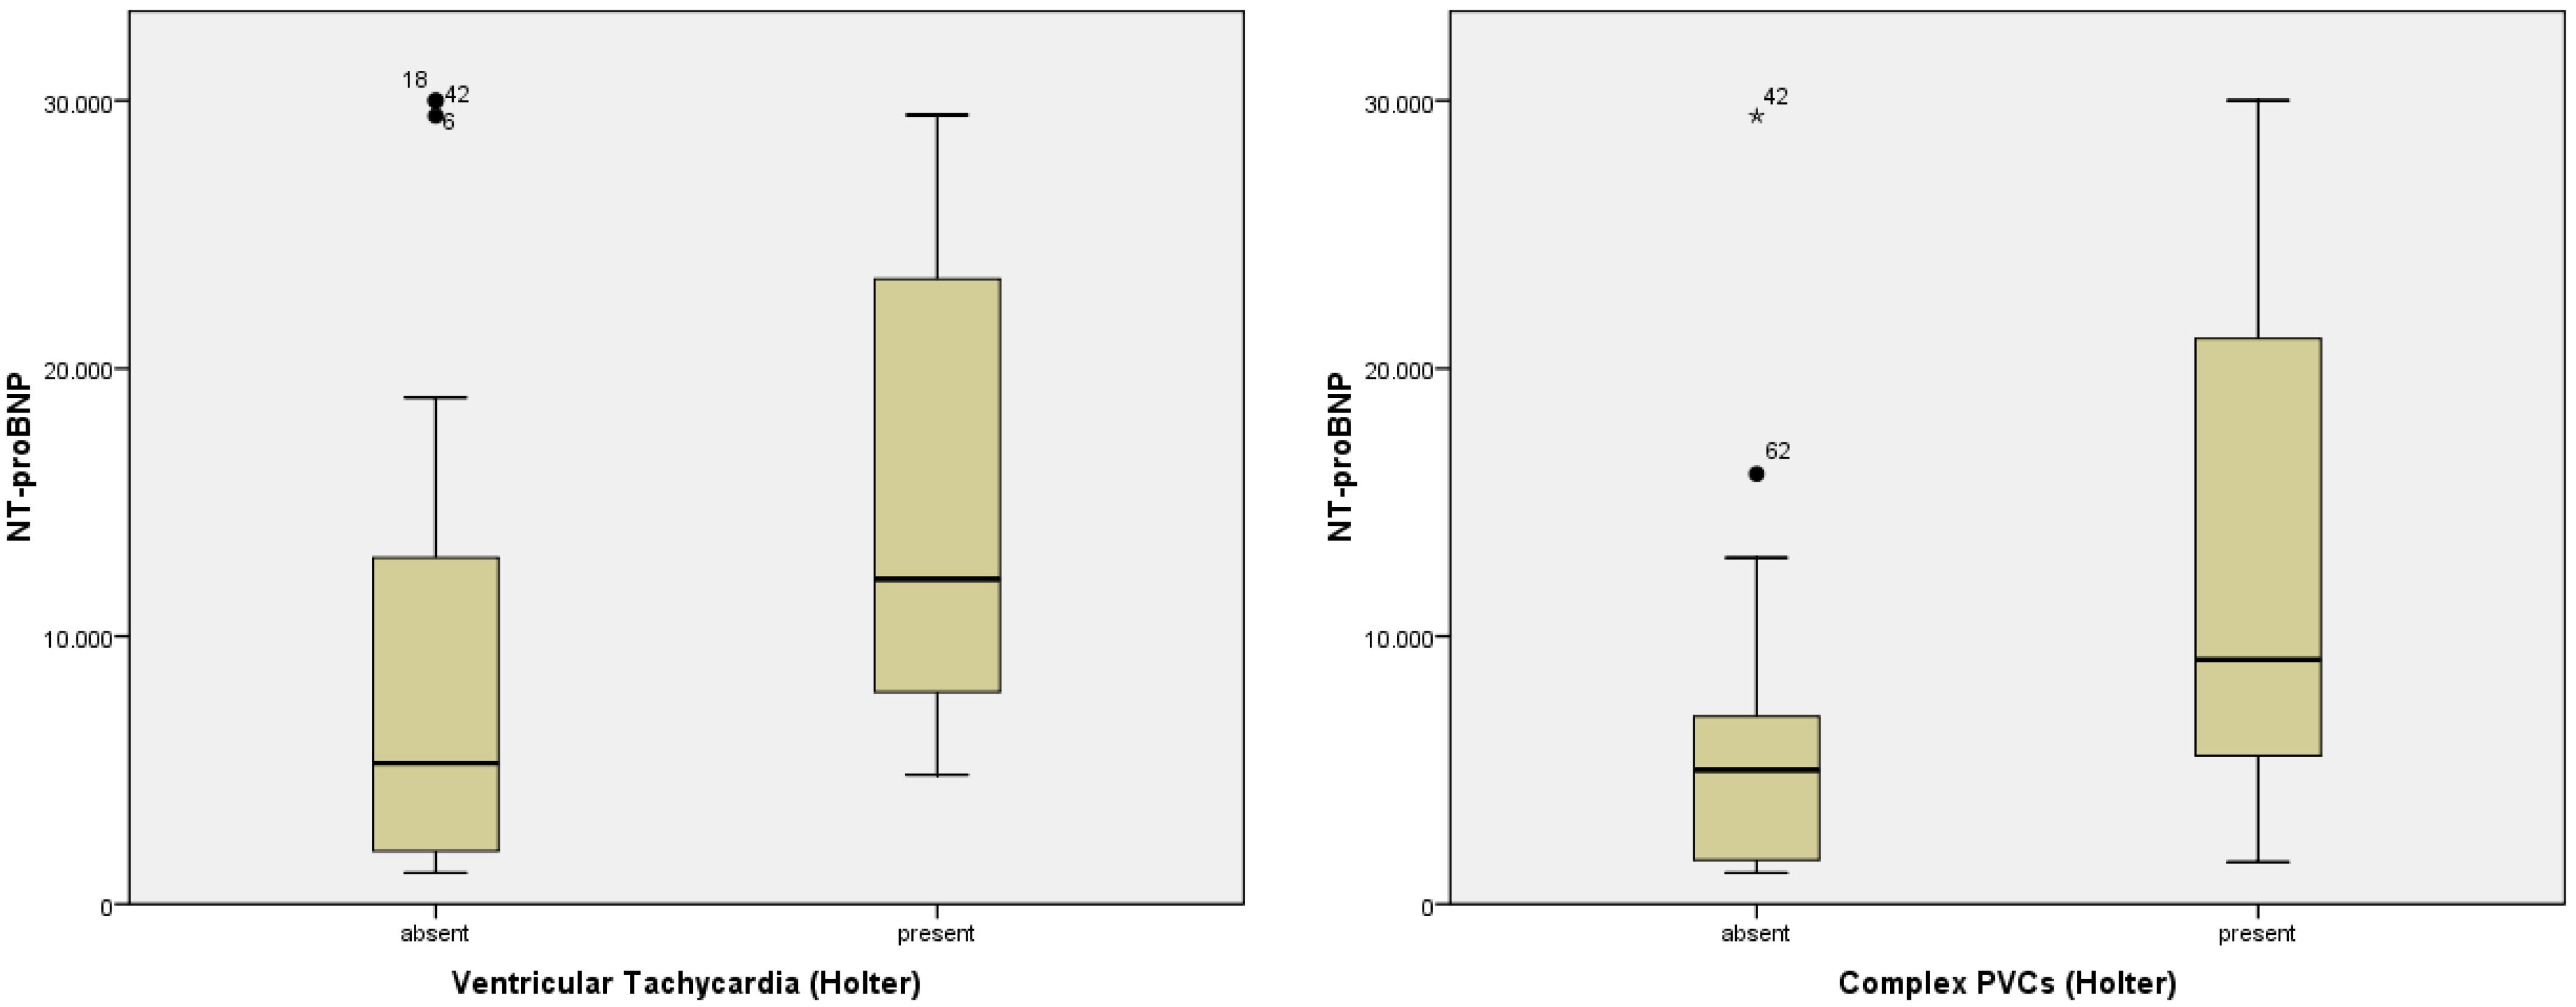
| Complex PVCs—Holter | p = 0.034; F = 4.857 | p = 0.031; F = 4.987 | p = 0.110; F = 2.678 | p = 0.890; F = 0.019 | p = 0.085; F = 3.121 |
| Atrial fibrillation—Holter | p = 0.797; F = 0.067 | p = 0.969; F = 0.002 | p = 0.421; F = 0.663 | p = 0.727; F = 0.124 | p = 0.005; F = 8.968 |
| Ventricular Tachycardia—Holter | p = 0.048; F = 4.167 | p = 0.298; F = 1.115 | p = 0.474; F = 0.524 | p = 0.684; F = 0.168 | p = 0.236; F = 1.451 |
Publisher’s Note: MDPI stays neutral with regard to jurisdictional claims in published maps and institutional affiliations. |
© 2022 by the authors. Licensee MDPI, Basel, Switzerland. This article is an open access article distributed under the terms and conditions of the Creative Commons Attribution (CC BY) license (https://creativecommons.org/licenses/by/4.0/).
Share and Cite
Chetran, A.; Costache, A.D.; Ciongradi, C.I.; Duca, S.T.; Mitu, O.; Sorodoc, V.; Cianga, C.M.; Tuchilus, C.; Mitu, I.; Mitea, R.D.; et al. ECG and Biomarker Profile in Patients with Acute Heart Failure: A Pilot Study. Diagnostics 2022, 12, 3037. https://doi.org/10.3390/diagnostics12123037
Chetran A, Costache AD, Ciongradi CI, Duca ST, Mitu O, Sorodoc V, Cianga CM, Tuchilus C, Mitu I, Mitea RD, et al. ECG and Biomarker Profile in Patients with Acute Heart Failure: A Pilot Study. Diagnostics. 2022; 12(12):3037. https://doi.org/10.3390/diagnostics12123037
Chicago/Turabian StyleChetran, Adriana, Alexandru Dan Costache, Carmen Iulia Ciongradi, Stefania Teodora Duca, Ovidiu Mitu, Victorita Sorodoc, Corina Maria Cianga, Cristina Tuchilus, Ivona Mitu, Raluca Daria Mitea, and et al. 2022. "ECG and Biomarker Profile in Patients with Acute Heart Failure: A Pilot Study" Diagnostics 12, no. 12: 3037. https://doi.org/10.3390/diagnostics12123037
APA StyleChetran, A., Costache, A. D., Ciongradi, C. I., Duca, S. T., Mitu, O., Sorodoc, V., Cianga, C. M., Tuchilus, C., Mitu, I., Mitea, R. D., Badescu, M. C., Afrasanie, I., Huzum, B., Moisa, S. M., Prepeliuc, C. S., Roca, M., & Costache, I. I. (2022). ECG and Biomarker Profile in Patients with Acute Heart Failure: A Pilot Study. Diagnostics, 12(12), 3037. https://doi.org/10.3390/diagnostics12123037