
The Utility of Arterial Spin Labeling MRI in Medial Temporal Lobe as a Vascular Biomarker in Alzheimer’s Disease Spectrum: A Systematic Review and Meta-Analysis
 , and
, and
Abstract
:1. Introduction
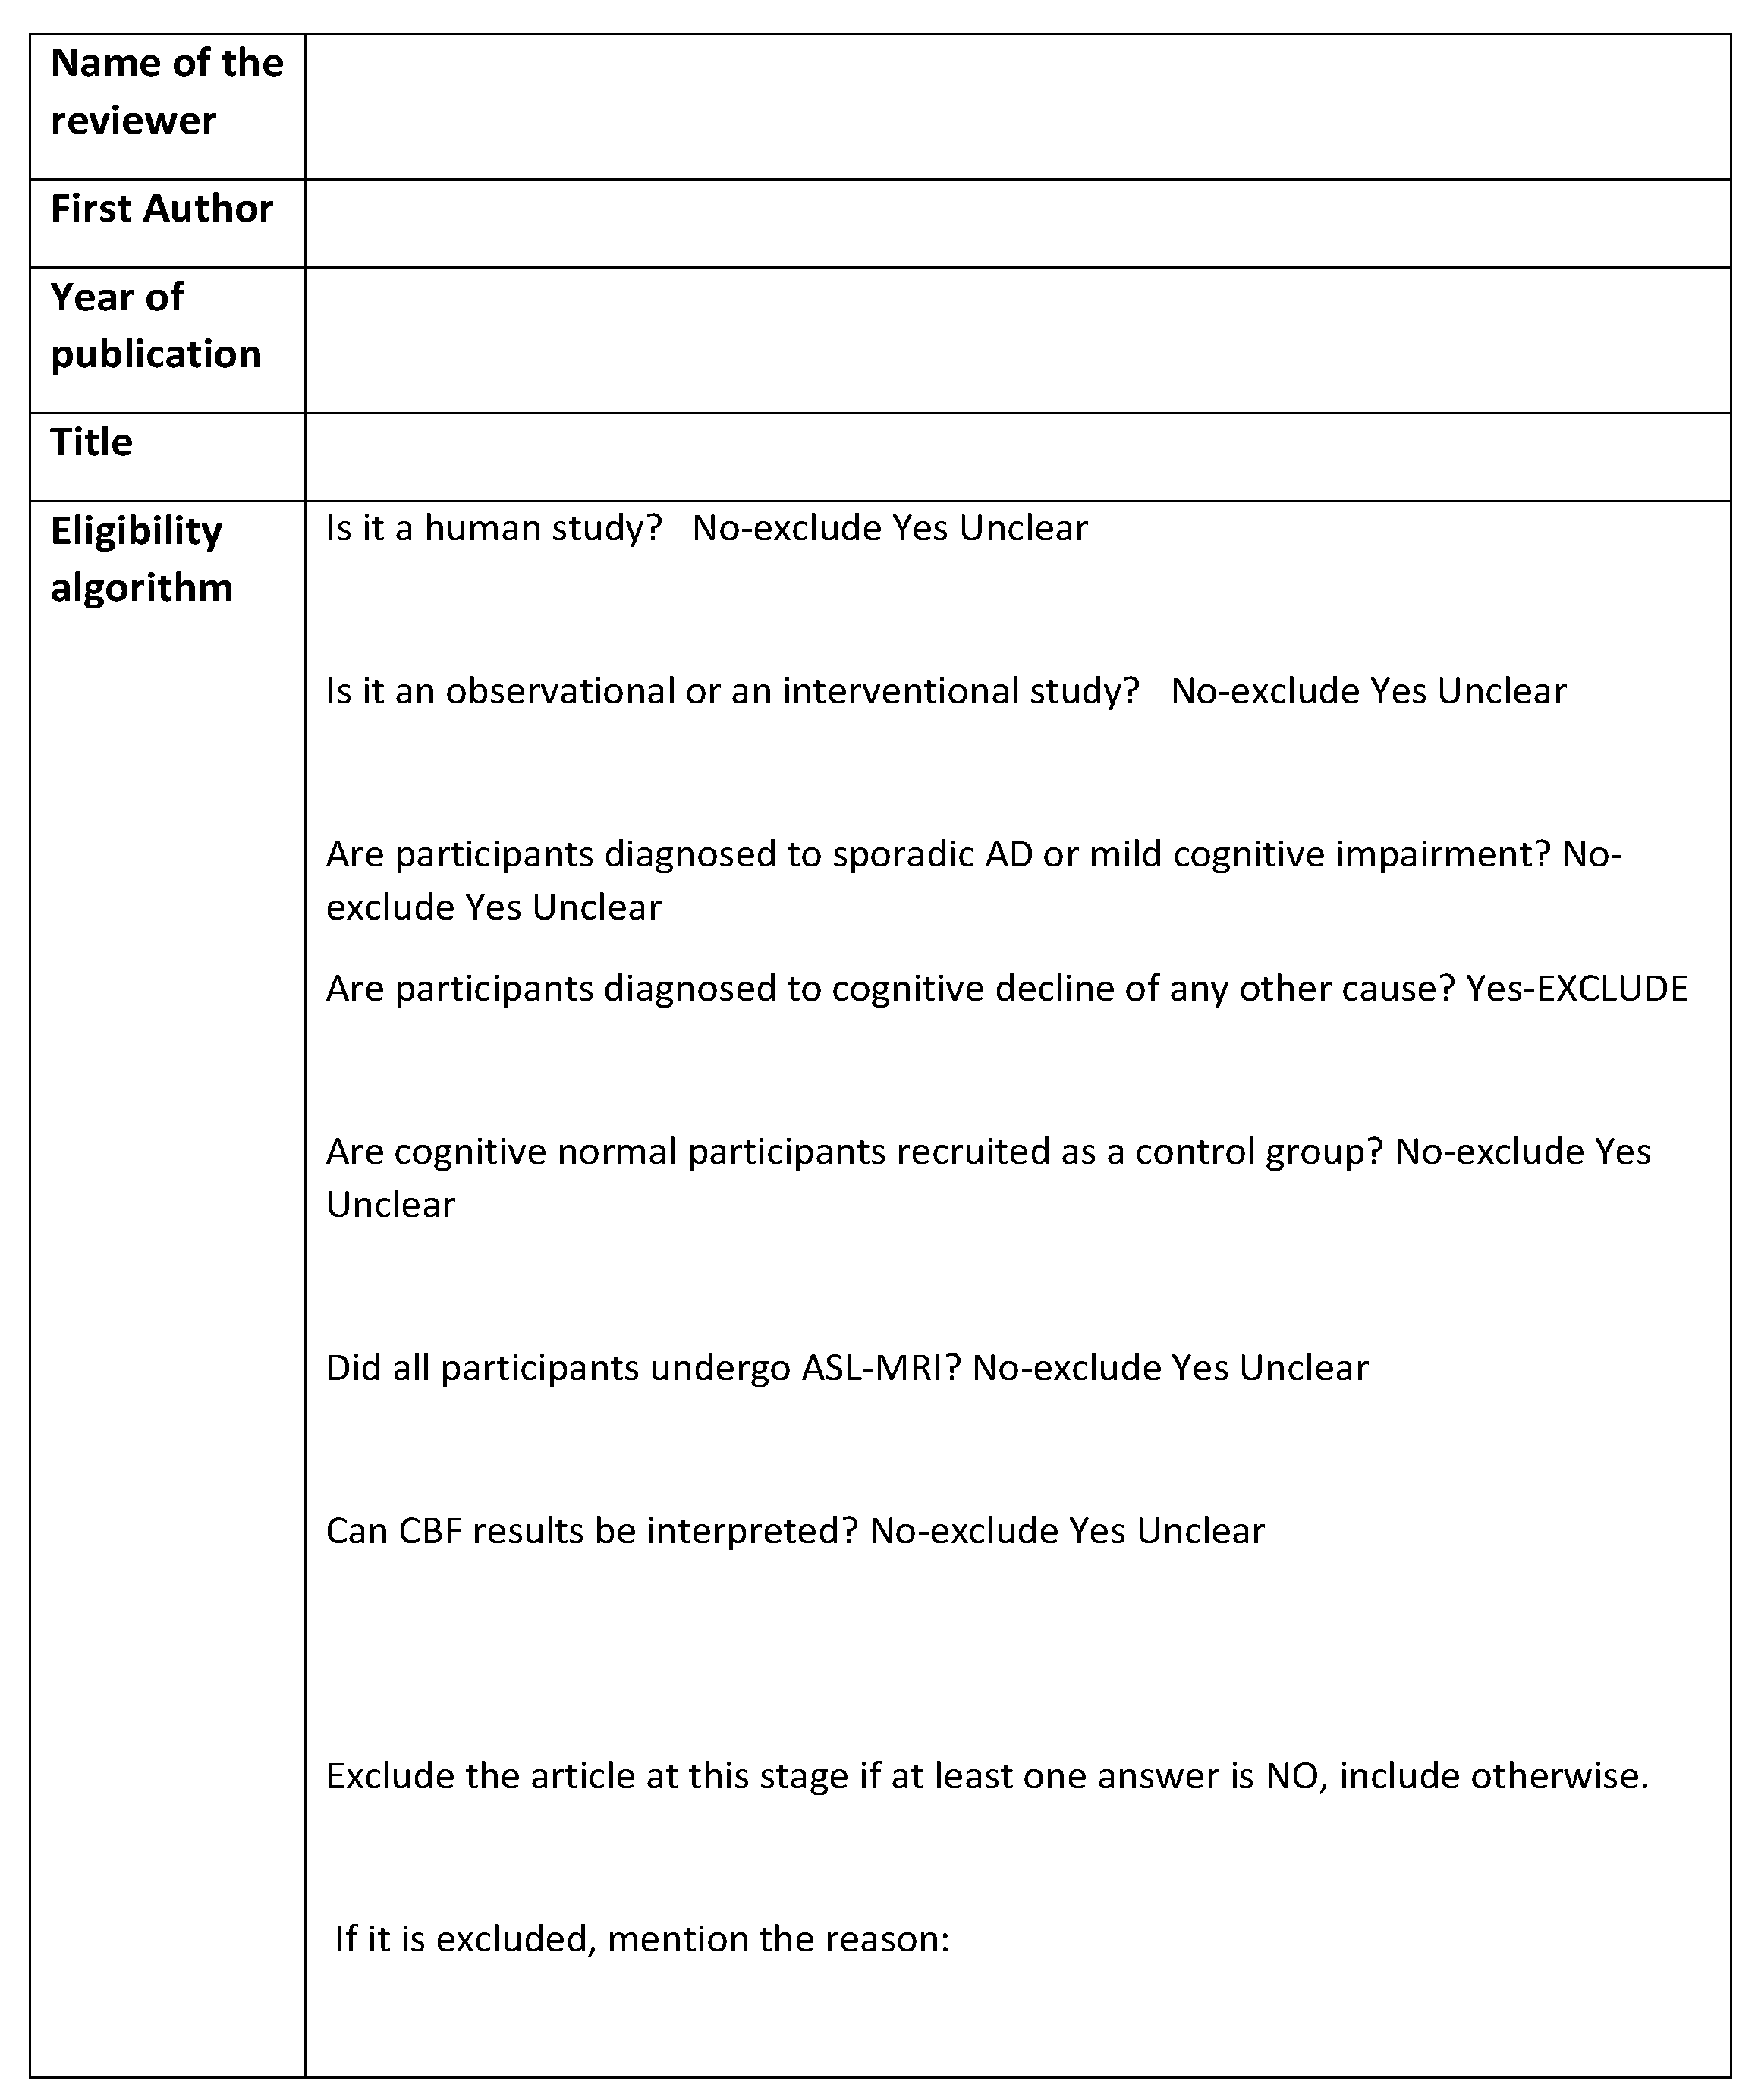
2. Materials and Methods
- Observational studies (cohort, case-control, or cross-sectional) or baseline results of interventional studies
- Human studies written in English
- Studies that recruited cognitively normal adults as control group
- Patients diagnosed at any stage of sporadic Alzheimer’s disease and/or participants with mild cognitive impairment, validated with at least one cognitive test
- Participants who underwent arterial spin labeling magnetic resonance imaging in the resting state (rsASL-MRI).
3. Results
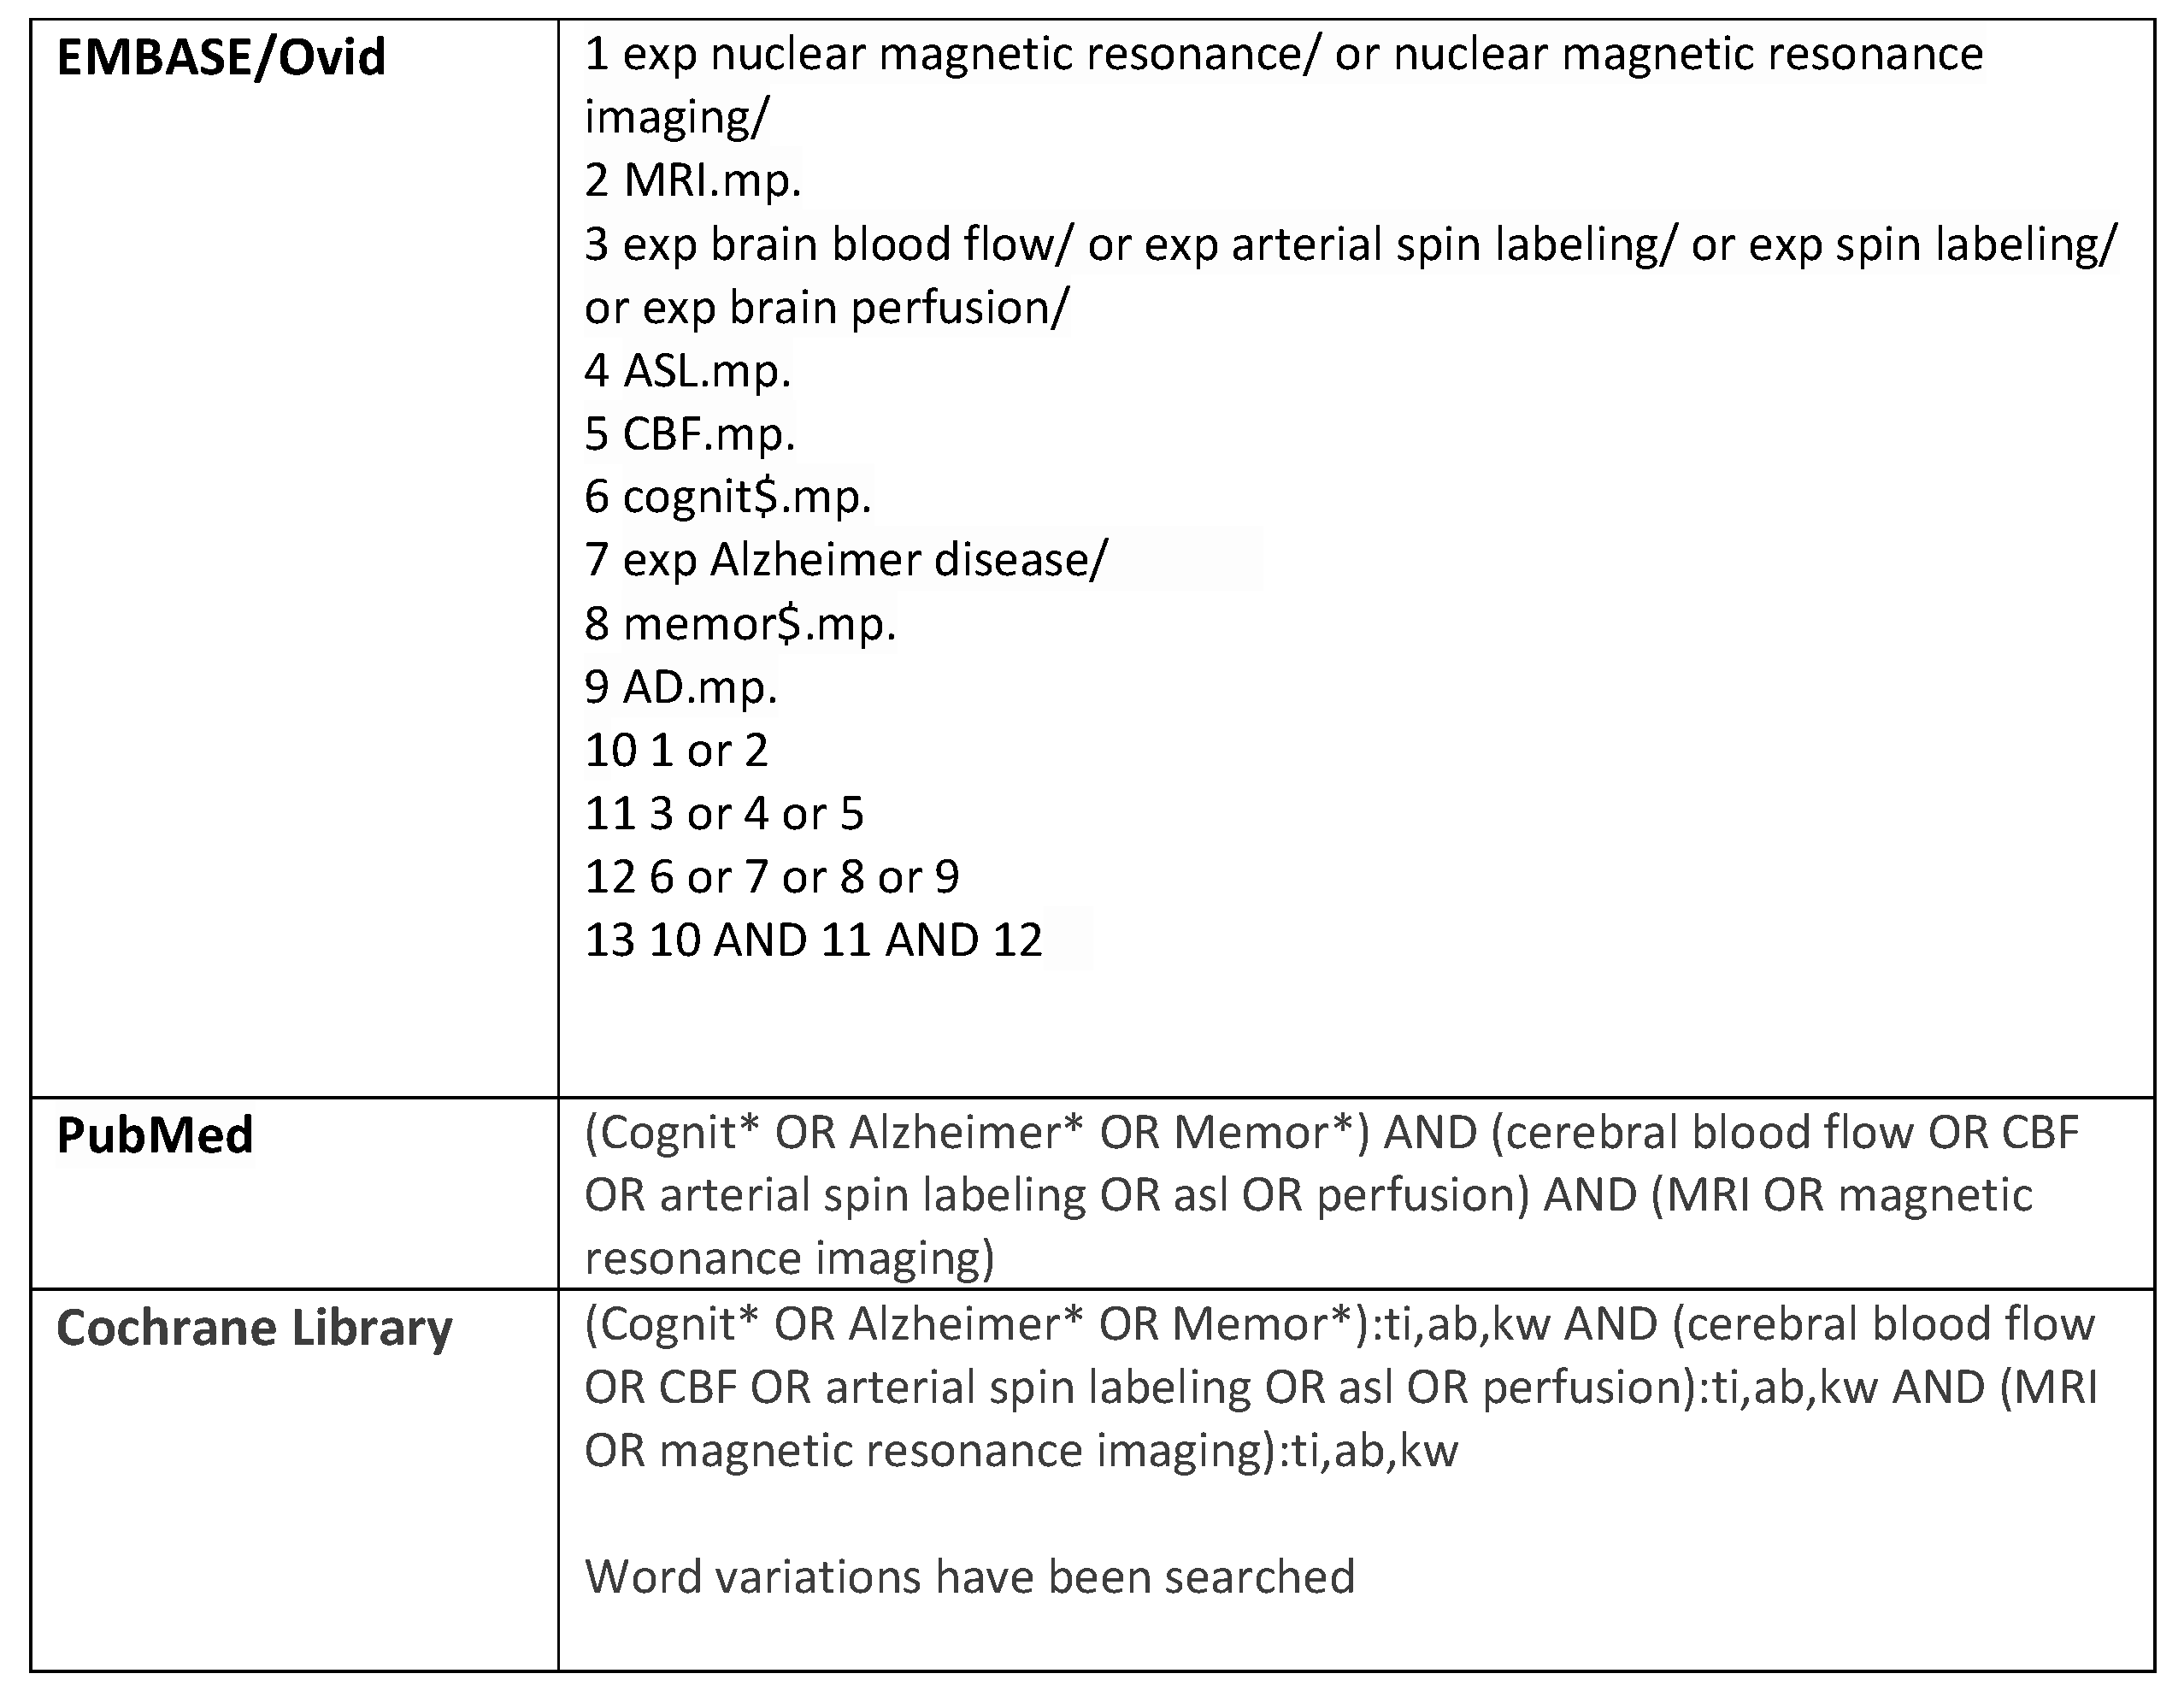
3.1. Search Results
3.2. Included Studies
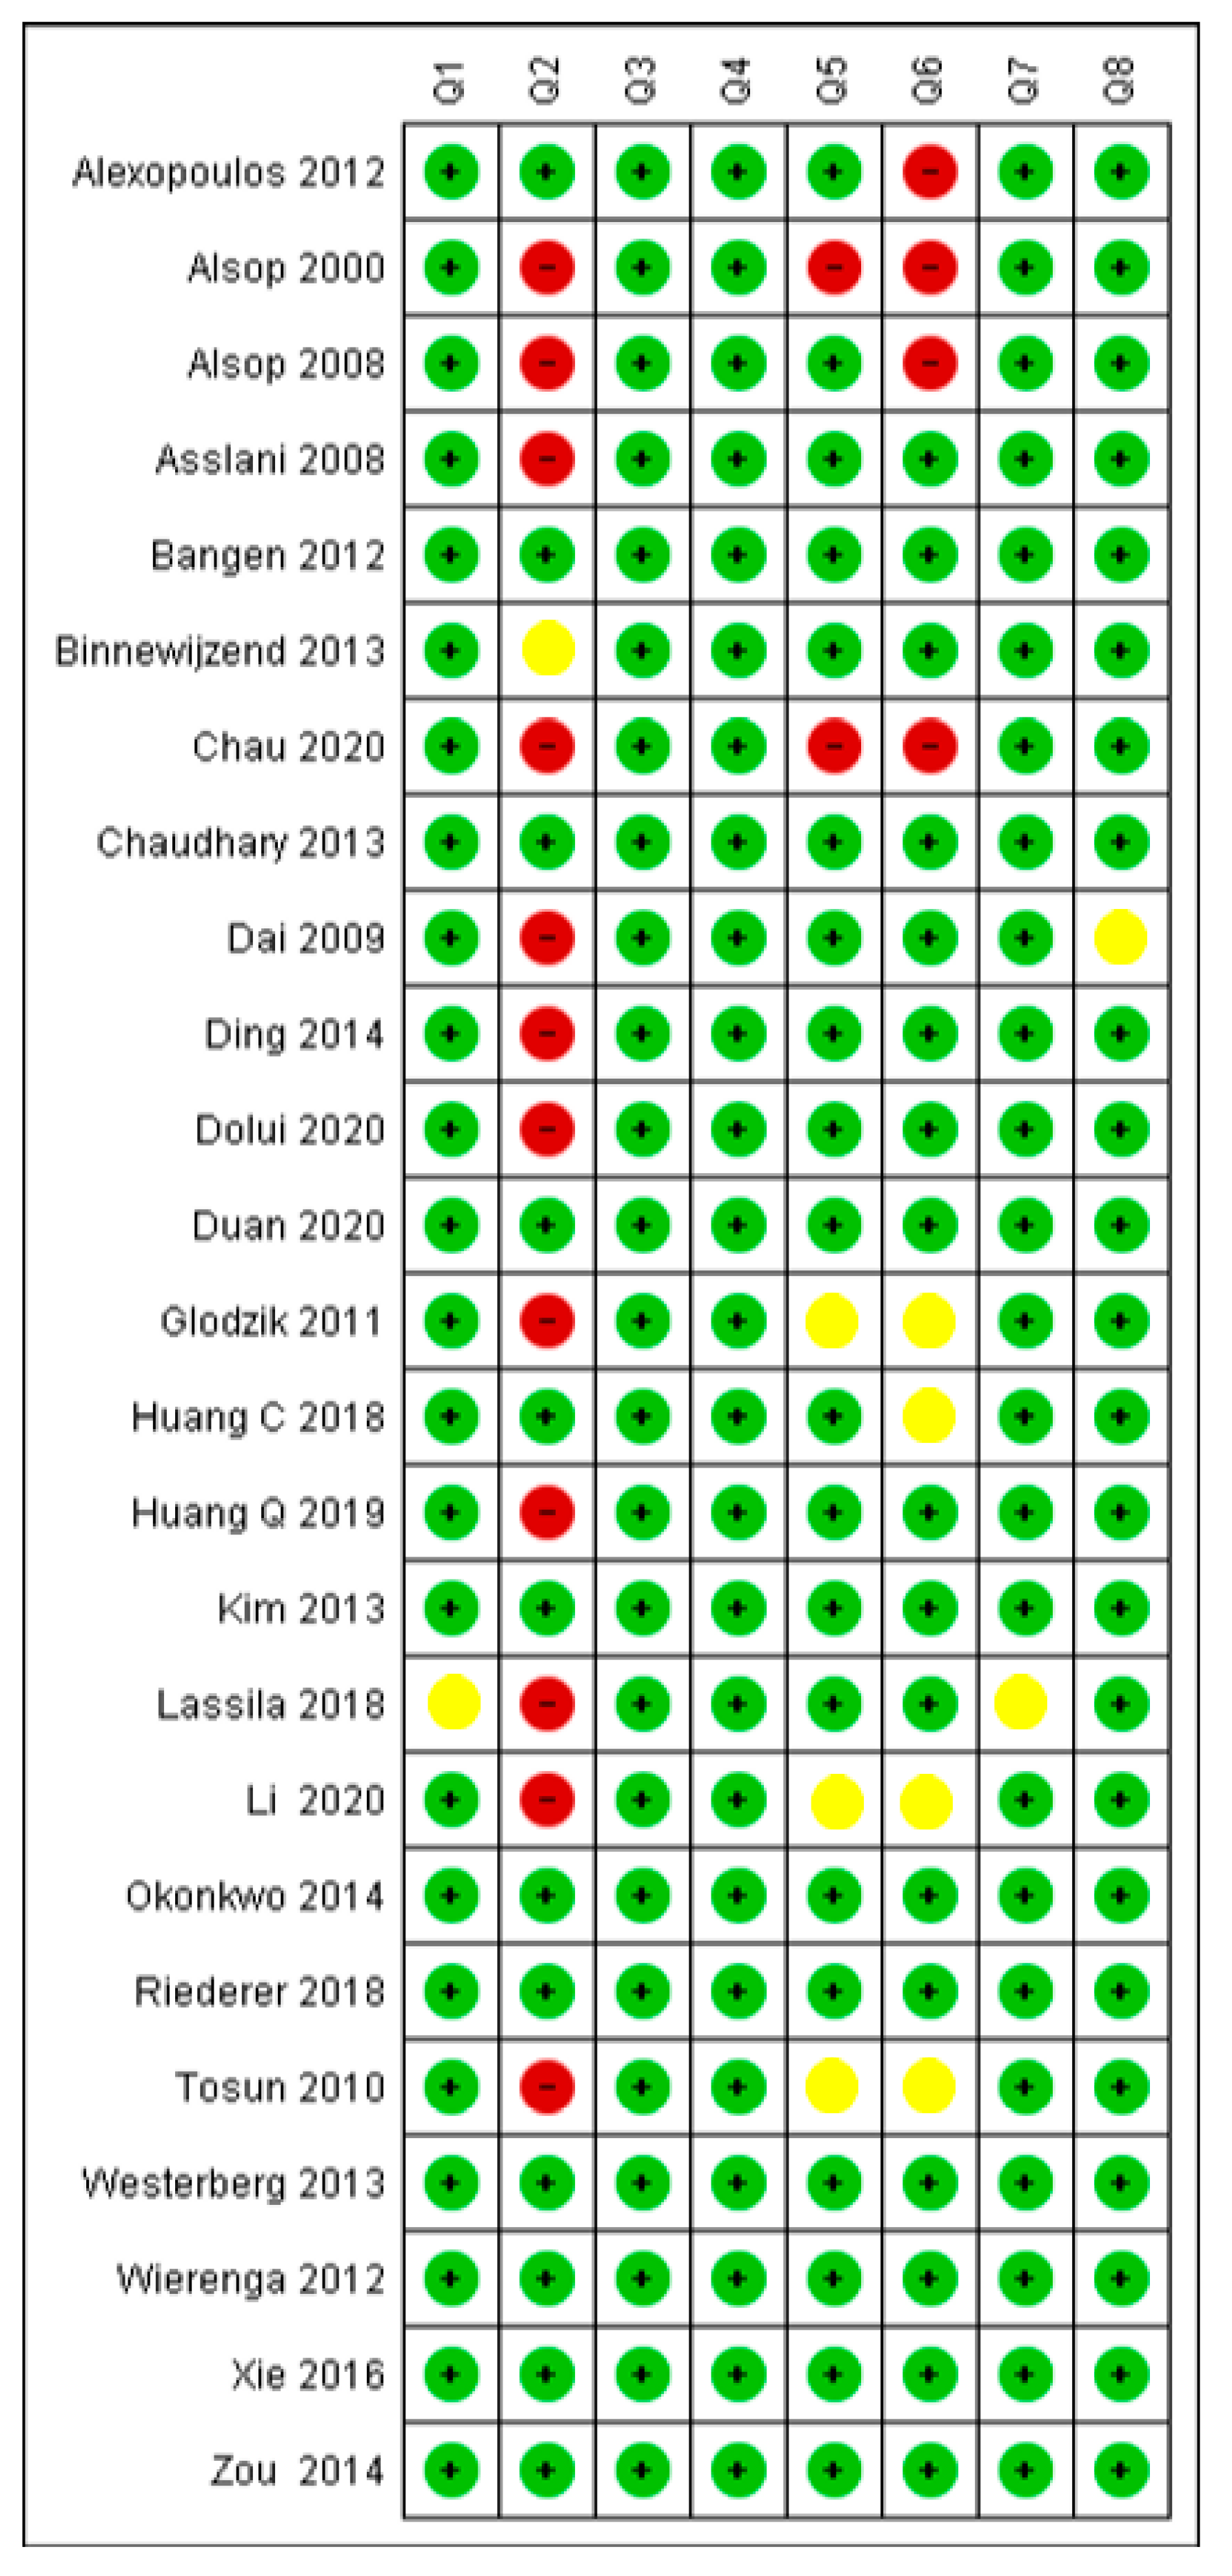
3.3. Critical Appraisal
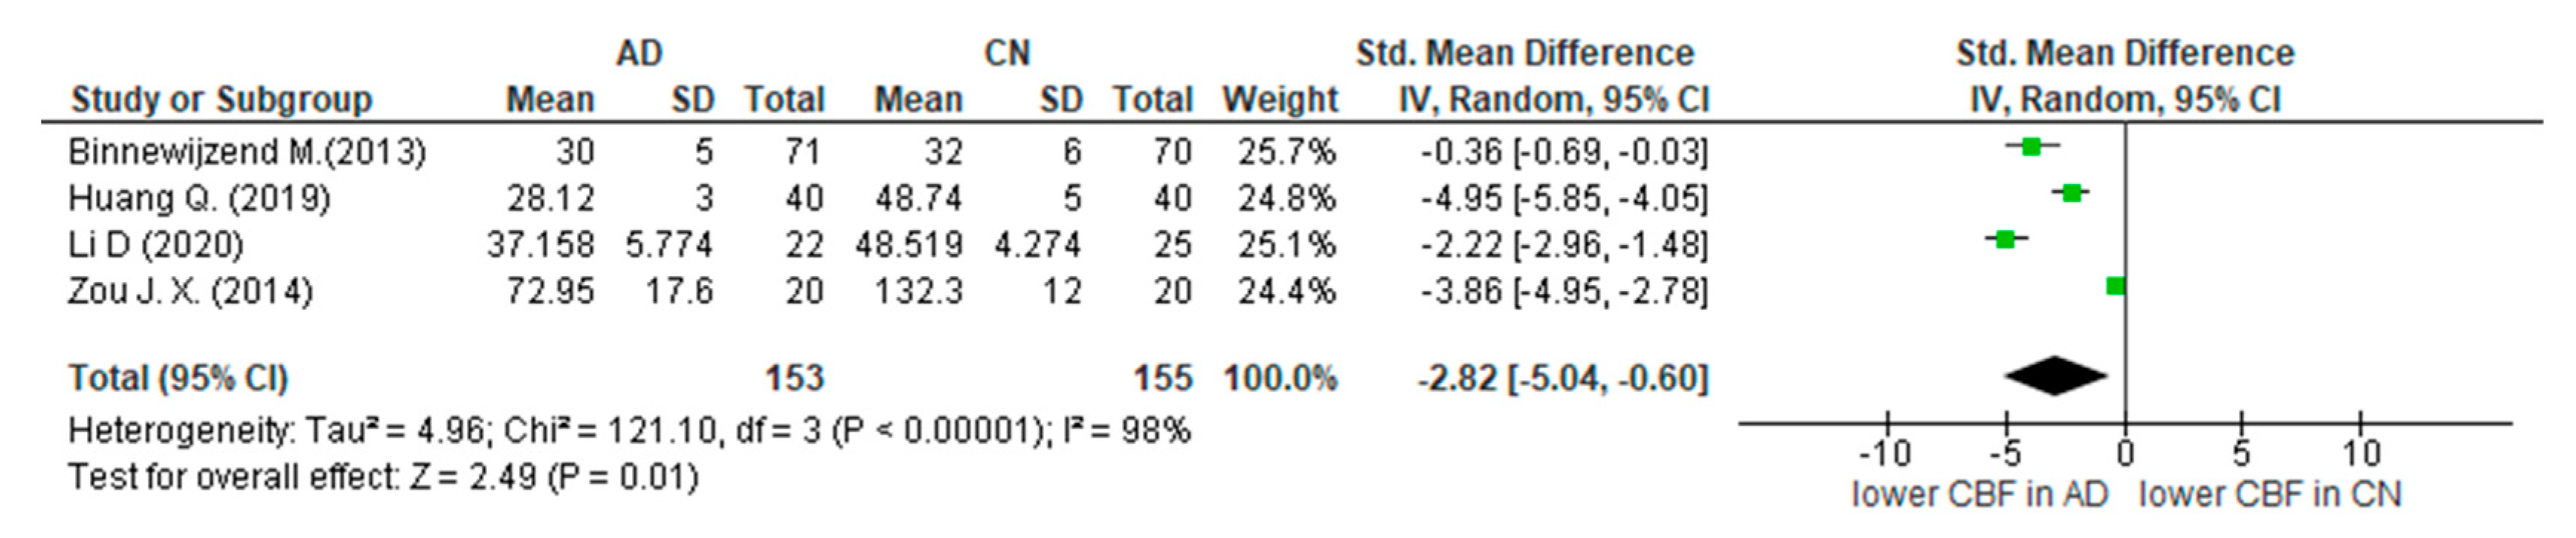
3.4. Summary of Main Findings and Meta-Analysis
4. Discussion
4.1. Alzheimer’s Disease and ASL
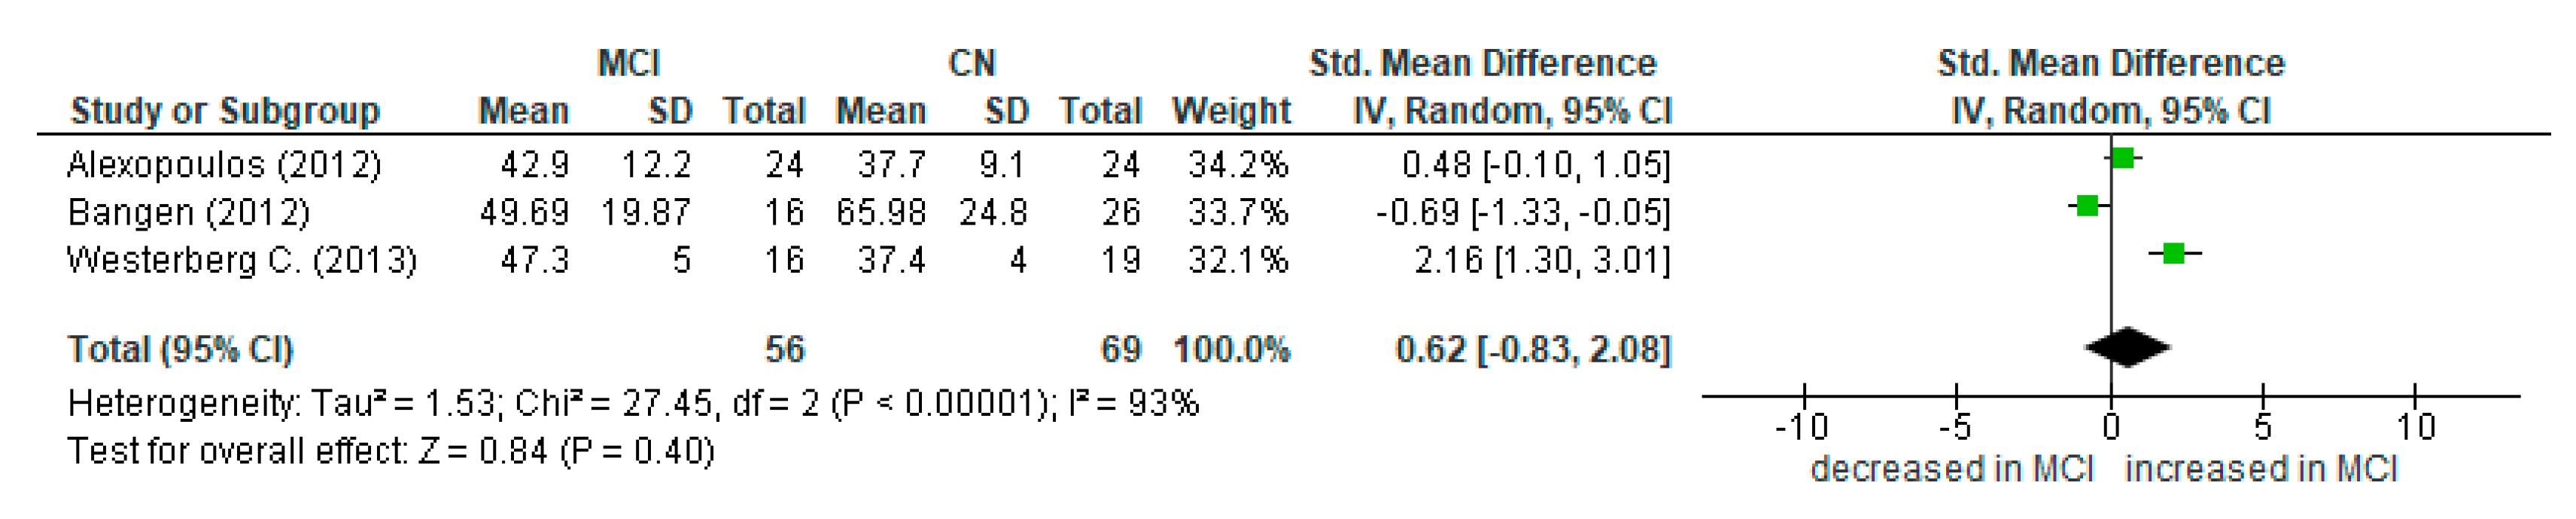
4.2. Mild Cognitive Impairment and ASL
4.3. Limitations
4.4. Recommendations for Future Studies
4.5. Role in Clinical Practice
5. Conclusions
Author Contributions
Funding
Informed Consent Statement
Data Availability Statement
Conflicts of Interest
Appendix A
Appendix B
Appendix C

| Differences in CBF of MTL in people with cognitive decline compared with cognitively normal adults | |
| Patient population | People with cognitive decline |
| Alzheimer’s disease patients | included studies (n = 16) |
| AD criteria |
|
| Mild cognitive impairment | included studies (n = 12) |
| MCI criteria |
|
| Imaging test | Arterial spin labelling (perfusion MRI) |
| MRI strength |
|
| ASL sequence |
|
| Readout |
|
| Comparator | Cognitively normal adults |
| Outcome | Cerebral blood flow in MTL |
| Alzheimer’s disease patients (CBF analysis) |
|
| Mild cognitive impairment (CBF analysis) |
|
| Included studies | Observational studies (cross-sectional n = 25, cohort n = 1) |
| Quality concerns | Patients’ characteristics were not always adequately described and confounding factors were moderately reported. Concerns regarding reproducibility of the investigated method were generally low. |
| Limitations | Lack of standard methodology in ASL-MRI process. Variety of regions of interest (ROIs) among studies |
| Conclusions | There is need for conducting longitudinal studies with a standardised methodological protocol of ASL-MRI with larger population samples. |
References
- Elahi, F.M.; Miller, B.L. A clinicopathological approach to the diagnosis of dementia. Nat. Rev. Neurol. 2017, 13, 457–476. [Google Scholar] [CrossRef] [PubMed] [Green Version]
- World Health Organization. Dementia. Available online: https://www.who.int/news-room/fact-sheets/detail/dementia (accessed on 21 December 2020).
- Wittenberg, R.; Hu, B.; Barraza-Araiza, L.; Rehill, A. Projections of Older People Living with Dementia and Costs of Dementia Care in the United Kingdom, 2019–2040; CPEC Working Paper 5; LSE Press: London, UK, 2019; Available online: www.lse.ac.uk/cpec/assets/documents/Working-paper-5-Wittenberg-et-al-dementia.pdf (accessed on 25 November 2019).
- McKhann, G.M.; Knopman, D.S.; Chertkow, H.; Hyman, B.T.; Jack, C.R., Jr.; Kawas, C.H.; Klunk, W.E.; Koroshetz, W.J.; Manly, J.J.; Mayeux, R.; et al. The diagnosis of dementia due to Alzheimer’s disease: Recommendations from the National Institute on Aging-Alzheimer’s Association workgroups on diagnostic guidelines for Alzheimer’s disease. Alzheimer’s Dement. 2011, 7, 263–269. [Google Scholar] [CrossRef] [PubMed] [Green Version]
- Vermunt, L.; Sikkes, S.A.M.; van den Hout, A.; Handels, R.; Bos, I.; van der Flier, W.M.; Kern, S.; Ousset, P.J.; Maruff, P.; Skoog, I.; et al. Duration of preclinical, prodromal, and dementia stages of Alzheimer’s disease in relation to age, sex, and APOE genotype. Alzheimer’s Dement. 2019, 15, 888–898. [Google Scholar] [CrossRef]
- Lloret, A.; Esteve, D.; Lloret, M.A.; Cervera-Ferri, A.; Lopez, B.; Nepomuceno, M.; Monllor, P. When Does Alzheimer’s Disease Really Start? The Role of Biomarkers. Int. J. Mol. Sci. 2019, 20, 5536. [Google Scholar] [CrossRef] [Green Version]
- Dubois, B.; Villain, N.; Frisoni, G.B.; Rabinovici, G.D.; Sabbagh, M.; Cappa, S.; Bejanin, A.; Bombois, S.; Epelbaum, S.; Teichmann, M.; et al. Clinical diagnosis of Alzheimer’s disease: Recommendations of the International Working Group. Lancet Neurol. 2021, 20, 484–496. [Google Scholar] [CrossRef] [PubMed]
- de la Torre, J. The Vascular Hypothesis of Alzheimer’s Disease: A Key to Preclinical Prediction of Dementia Using Neuroimaging. J. Alzheimer’s Dis. 2018, 63, 35–52. [Google Scholar] [CrossRef] [PubMed]
- Scheffer, S.; Hermkens, D.M.A.; van der Weerd, L.; de Vries, H.E.; Daemen, M.J.A.P. Vascular Hypothesis of Alzheimer Disease: Topical Review of Mouse Models. Arterioscler. Thromb. Vasc. Biol. 2021, 41, 1265–1283. [Google Scholar] [CrossRef]
- Kinney, J.W.; Bemiller, S.M.; Murtishaw, A.S.; Leisgang, A.M.; Salazar, A.M.; Lamb, B.T. Inflammation as a central mechanism in Alzheimer’s disease. Alzheimer’s Dement. Transl. Res. Clin. Interv. 2018, 4, 575–590. [Google Scholar] [CrossRef] [PubMed]
- Badji, A.; Westman, E. Cerebrovascular pathology in Alzheimer’s disease: Hopes and gaps. Psychiatry Res. Neuroimaging 2020, 306, 111184. [Google Scholar] [CrossRef] [PubMed]
- Zeng, H.M.; Han, H.B.; Zhang, Q.F.; Bai, H. Application of modern neuroimaging technology in the diagnosis and study of Alzheimer’s disease. Neural Regen. Res. 2021, 16, 73–79. [Google Scholar] [CrossRef] [PubMed]
- Ferrando, R.; Damian, A. Brain SPECT as a Biomarker of Neurodegeneration in Dementia in the Era of Molecular Imaging: Still a Valid Option? Front. Neurol. 2021, 12, 629442. [Google Scholar] [CrossRef]
- Valotassiou, V.; Malamitsi, J.; Papatriantafyllou, J.; Dardiotis, E.; Tsougos, I.; Psimadas, D.; Alexiou, S.; Hadjigeorgiou, G.; Georgoulias, P. SPECT and PET imaging in Alzheimer’s disease. Ann. Nucl. Med. 2018, 32, 583–593. [Google Scholar] [CrossRef] [PubMed]
- O’Brien, J.T.; Firbank, M.J.; Davison, C.; Barnett, N.; Bamford, C.; Donaldson, C.; Olsen, K.; Herholz, K.; Williams, D.; Lloyd, J. 18F-FDG PET and perfusion SPECT in the diagnosis of Alzheimer and Lewy body dementias. J. Nucl. Med. 2014, 55, 1959–1965. [Google Scholar] [CrossRef] [Green Version]
- Quarles, C.C.; Bell, L.C.; Stokes, A.M. Imaging vascular and hemodynamic features of the brain using dynamic susceptibility contrast and dynamic contrast enhanced MRI. Neuroimage 2019, 187, 32–55. [Google Scholar] [CrossRef]
- Bozzao, A.; Floris, R.; Baviera, M.E.; Apruzzese, A.; Simonetti, G. Diffusion and perfusion MR imaging in cases of Alzheimer’s disease: Correlations with cortical atrophy and lesion load. AJNR Am. J. Neuroradiol. 2001, 22, 1030–1036. [Google Scholar]
- Eurostat. Availability of Technical Resources in Hospitals. Available online: https://ec.europa.eu/eurostat/statisticsexplained/index.php?title=Healthcare_resource_statistics_-_technical_resources_and_medical_technology&oldid=575172#Use_of_medical_technology (accessed on 23 July 2022).
- Williams, D.S.; Detre, J.A.; Leigh, J.S.; Koretsky, A.P. Magnetic resonance imaging of perfusion using spin inversion of arterial water. Proc. Natl. Acad. Sci. USA 1992, 89, 212–216, Reprinted in Proc. Natl. Acad. Sci. USA 1992, 89, 4220. [Google Scholar] [CrossRef] [PubMed] [Green Version]
- Grade, M.; Hernandez-Tamames, J.A.; Pizzini, F.B.; Achten, E.; Golay, X.; Smits, M. A neuroradiologist’s guide to arterial spin labeling MRI in clinical practice. Neuroradiology 2015, 57, 1181–1202. [Google Scholar] [CrossRef] [PubMed] [Green Version]
- Alsop, D.C.; Detre, J.A.; Golay, X.; Günther, M.; Hendrikse, J.; Hernandez-Garcia, L.; Lu, H.; MacIntosh, B.J.; Parkes, L.M.; Smits, M.; et al. Recommended implementation of arterial spin-labeled perfusion MRI for clinical applications: A consensus of the ISMRM perfusion study group and the European consortium for ASL in dementia. Magn. Reson. Med. 2015, 73, 102–116. [Google Scholar] [CrossRef] [PubMed] [Green Version]
- Morinaga, A.; Ono, K.; Ikeda, T.; Ikeda, Y.; Shima, K.; Noguchi-Shinohara, M.; Samuraki, M.; Yanase, D.; Yoshita, M.; Iwasa, K.; et al. A comparison of the diagnostic sensitivity of MRI, CBF-SPECT, FDG-PET and cerebrospinal fluid biomarkers for detecting Alzheimer’s disease in a memory clinic. Dement. Geriatr. Cogn. Disord. 2010, 30, 285–292. [Google Scholar] [CrossRef]
- Fällmar, D.; Haller, S.; Lilja, J.; Danfors, T.; Kilander, L.; Tolboom, N.; Egger, K.; Kellner, E.; Croon, P.M.; Verfaillie, S.C.; et al. Arterial spin labeling-based Z-maps have high specificity and positive predictive value for neurodegenerative dementia compared to FDG-PET. Eur. Radiol. 2017, 27, 4237–4246. [Google Scholar] [CrossRef] [Green Version]
- Chen, Y.; Wolk, D.A.; Reddin, J.S.; Korczykowski, M.; Martinez, P.M.; Musiek, E.S.; Newberg, A.B.; Julin, P.; Arnold, S.E.; Greenberg, J.H.; et al. Voxel-level comparison of arterial spin-labeled perfusion MRI and FDG-PET in Alzheimer disease. Neurology 2011, 77, 1977–1985. [Google Scholar] [CrossRef] [PubMed]
- Verfaillie, S.C.; Adriaanse, S.M.; Binnewijzend, M.A.; Benedictus, M.R.; Ossenkoppele, R.; Wattjes, M.P.; Pijnenburg, Y.A.; van der Flier, W.M.; Lammertsma, A.A.; Kuijer, J.; et al. Cerebral perfusion and glucose metabolism in Alzheimer’s disease and frontotemporal dementia: Two sides of the same coin? Eur. Radiol. 2015, 25, 3050–3059. [Google Scholar] [CrossRef] [PubMed] [Green Version]
- Wang, Z. Characterizing early Alzheimer’s disease and disease progression using hippocampal volume and arterial spin labeling perfusion MRI. J. Alzheimers Dis. 2014, 42 (Suppl. S4), S495–S502. [Google Scholar] [CrossRef] [PubMed]
- Alsop, D.C.; Dai, W.; Grossman, M.; Detre, J.A. Arterial spin labeling blood flow MRI: Its role in the early characterization of Alzheimer’s disease. J. Alzheimers Dis. 2010, 20, 871–880. [Google Scholar] [CrossRef] [PubMed] [Green Version]
- Lombardi, G.; Crescioli, G.; Cavedo, E.; Lucenteforte, E.; Casazza, G.; Bellatorre, A.G.; Lista, C.; Costantino, G.; Frisoni, G.; Virgili, G.; et al. Structural magnetic resonance imaging for the early diagnosis of dementia due to Alzheimer’s disease in people with mild cognitive impairment. Cochrane Database Syst. Rev. 2020, 3, CD009628. [Google Scholar] [CrossRef] [PubMed]
- Caroli, A.; Testa, C.; Geroldi, C.; Nobili, F.; Guerra, U.P.; Bonetti, M.; Frisoni, G.B. Brain perfusion correlates of medial temporal lobe atrophy and white matter hyperintensities in mild cognitive impairment. J. Neurol. 2007, 254, 1000–1008. [Google Scholar] [CrossRef] [PubMed]
- Lacalle-Aurioles, M.; Mateos-Pérez, J.M.; Guzmán-De-Villoria, J.A.; Olazarán, J.; Cruz-Orduña, I.; Alemán-Gómez, Y.; Martino, M.E.; Desco, M. Cerebral blood flow is an earlier indicator of perfusion abnormalities than cerebral blood volume in Alzheimer’s disease. J. Cereb. Blood Flow Metab. 2014, 34, 654–659. [Google Scholar] [CrossRef] [Green Version]
- Page, M.J.; McKenzie, J.E.; Bossuyt, P.M.; Boutron, I.; Hoffmann, T.C.; Mulrow, C.D.; Shamseer, L.; Tetzlaff, J.M.; Akl, E.A.; Brennan, S.E.; et al. The PRISMA 2020 statement: An updated guideline for reporting systematic reviews. Syst. Rev. 2021, 10, 89. [Google Scholar] [CrossRef]
- Zeng, X.; Zhang, Y.; Kwong, J.S.; Zhang, C.; Li, S.; Sun, F.; Niu, Y.; Du, L. The methodological quality assessment tools for preclinical and clinical studies, systematic review and meta-analysis, and clinical practice guideline: A systematic review. J. Evid. Based Med. 2015, 8, 2–10. [Google Scholar] [CrossRef]
- Alexopoulos, P.; Sorg, C.; Förschler, A.; Grimmer, T.; Skokou, M.; Wohlschläger, A.; Perneczky, R.; Zimmer, C.; Kurz, A.; Preibisch, C. Perfusion abnormalities in mild cognitive impairment and mild dementia in Alzheimer’s disease measured by pulsed arterial spin labeling MRI. Eur. Arch. Psychiatry Clin. Neurosci. 2012, 262, 69–77. [Google Scholar] [CrossRef] [PubMed]
- Alsop, D.C.; Detre, J.A.; Grossman, M. Assessment of cerebral blood flow in Alzheimer’s disease by spin-labeled magnetic resonance imaging. Ann. Neurol. 2000, 47, 93–100. [Google Scholar] [CrossRef] [PubMed]
- Alsop, D.C.; Casement, M.; de Bazelaire, C.; Fong, T.; Press, D.Z. Hippocampal hyperperfusion in Alzheimer’s disease. Neuroimage 2008, 42, 1267–1274. [Google Scholar] [CrossRef] [PubMed] [Green Version]
- Asllani, I.; Habeck, C.; Scarmeas, N.; Borogovac, A.; Brown, T.R.; Stern, Y. Multivariate and univariate analysis of continuous arterial spin labeling perfusion MRI in Alzheimer’s disease. J. Cereb. Blood Flow Metab. 2008, 28, 725–736. [Google Scholar] [CrossRef] [PubMed] [Green Version]
- Bangen, K.J.; Restom, K.; Liu, T.T.; Wierenga, C.E.; Jak, A.J.; Salmon, D.P.; Bondi, M.W. Assessment of Alzheimer’s disease risk with functional magnetic resonance imaging: An arterial spin labeling study. J. Alzheimers Dis. 2012, 31 (Suppl. S3), S59–S74. [Google Scholar] [CrossRef] [PubMed]
- Binnewijzend, M.A.; Kuijer, J.P.; Benedictus, M.R.; van der Flier, W.M.; Wink, A.M.; Wattjes, M.P.; van Berckel, B.N.; Scheltens, P.; Barkhof, F. Cerebral blood flow measured with 3D pseudocontinuous arterial spin-labeling MR imaging in Alzheimer disease and mild cognitive impairment: A marker for disease severity. Radiology 2013, 267, 221–230. [Google Scholar] [CrossRef] [PubMed]
- Chau, A.C.; Cheung, E.Y.; Chan, K.H.; Chow, W.S.; Shea, Y.F.; Chiu, P.K.; Mak, H.K. Impaired cerebral blood flow in type 2 diabetes mellitus—A comparative study with subjective cognitive decline, vascular dementia and Alzheimer’s disease subjects. Neuroimage Clin. 2020, 27, 102302. [Google Scholar] [CrossRef] [PubMed]
- Chaudhary, S.; Scouten, A.; Schwindt, G.; Janik, R.; Lee, W.; Sled, J.G.; Black, S.E.; Stefanovic, B. Hemodynamic effects of cholinesterase inhibition in mild Alzheimer’s disease. J. Magn. Reason. Imaging 2013, 38, 26–35. [Google Scholar] [CrossRef] [PubMed]
- Dai, W.; Lopez, O.L.; Carmichael, O.T.; Becker, J.T.; Kuller, L.H.; Gach, H.M. Mild cognitive impairment and alzheimer disease: Patterns of altered cerebral blood flow at MR imaging. Radiology 2009, 250, 856–866. [Google Scholar] [CrossRef] [PubMed]
- Ding, B.; Ling, H.W.; Zhang, Y.; Huang, J.; Zhang, H.; Wang, T.; Yan, F.H. Pattern of cerebral hyperperfusion in Alzheimer’s disease and amnestic mild cognitive impairment using voxel-based analysis of 3D arterial spin-labeling imaging: Initial experience. Clin. Interv. Aging 2014, 9, 493–500. [Google Scholar] [CrossRef] [PubMed] [Green Version]
- Dolui, S.; Li, Z.; Nasrallah, I.M.; Detre, J.A.; Wolk, D.A. Arterial spin labeling versus 18F-FDG-PET to identify mild cognitive impairment. Neuroimage Clin. 2020, 25, 102146. [Google Scholar] [CrossRef] [PubMed]
- Duan, W.; Sehrawat, P.; Balachandrasekaran, A.; Bhumkar, A.B.; Boraste, P.B.; Becker, J.T.; Kuller, L.H.; Lopez, O.L.; Gach, H.M.; Dai, W. Cerebral Blood Flow Is Associated with Diagnostic Class and Cognitive Decline in Alzheimer’s Disease. J. Alzheimers Dis. 2020, 76, 1103–1120. [Google Scholar] [CrossRef] [PubMed]
- Glodzik, L.; Rusinek, H.; Brys, M.; Tsui, W.H.; Switalski, R.; Mosconi, L.; Mistur, R.; Pirraglia, E.; De Santi, S.; Li, Y.; et al. Framingham cardiovascular risk profile correlates with impaired hippocampal and cortical vasoreactivity to hypercapnia. J. Cereb. Blood Flow Metab. 2011, 31, 671–679. [Google Scholar] [CrossRef] [Green Version]
- Huang, C.W.; Hsu, S.W.; Chang, Y.T.; Huang, S.H.; Huang, Y.C.; Lee, C.C.; Chang, W.N.; Lui, C.C.; Chen, N.C.; Chang, C.C. Cerebral Perfusion Insufficiency and Relationships with Cognitive Deficits in Alzheimer’s Disease: A Multiparametric Neuroimaging Study. Sci. Rep. 2018, 8, 1541. [Google Scholar] [CrossRef] [Green Version]
- Huang, Q.; Cao, X.; Chai, X.; Wang, X.; Xu, L.; Xiao, C. Three-dimensional pseudocontinuous arterial spin labeling and susceptibility-weighted imaging associated with clinical progression in amnestic mild cognitive impairment and Alzheimer’s disease. Medicine 2019, 98, e15972. [Google Scholar] [CrossRef]
- Kim, S.M.; Kim, M.J.; Rhee, H.Y.; Ryu, C.W.; Kim, E.J.; Petersen, E.T.; Jahng, G.H. Regional cerebral perfusion in patients with Alzheimer’s disease and mild cognitive impairment: Effect of APOE epsilon4 allele. Neuroradiology 2013, 55, 25–34. [Google Scholar] [CrossRef]
- Lassila, T.; Di Marco, L.Y.; Mitolo, M.; Iaia, V.; Levedianos, G.; Venneri, A.; Frangi, A.F. Screening for Cognitive Impairment by Model-Assisted Cerebral Blood Flow Estimation. IEEE Trans. Biomed. Eng. 2018, 65, 1654–1661. [Google Scholar] [CrossRef] [Green Version]
- Li, D.; Liu, Y.; Zeng, X.; Xiong, Z.; Yao, Y.; Liang, D.; Qu, H.; Xiang, H.; Yang, Z.; Nie, L.; et al. Quantitative Study of the Changes in Cerebral Blood Flow and Iron Deposition During Progression of Alzheimer’s Disease. J. Alzheimers Dis. 2020, 78, 439–452. [Google Scholar] [CrossRef]
- Okonkwo, O.C.; Xu, G.; Oh, J.M.; Dowling, N.M.; Carlsson, C.M.; Gallagher, C.L.; Birdsill, A.C.; Palotti, M.; Wharton, W.; Hermann, B.P.; et al. Cerebral blood flow is diminished in asymptomatic middle-aged adults with maternal history of Alzheimer’s disease. Cereb. Cortex 2014, 24, 978–988. [Google Scholar] [CrossRef] [PubMed] [Green Version]
- Riederer, I.; Bohn, K.P.; Preibisch, C.; Wiedemann, E.; Zimmer, C.; Alexopoulos, P.; Förster, S. Alzheimer Disease and Mild Cognitive Impairment: Integrated Pulsed Arterial Spin-Labeling MRI and 18F-FDG PET. Radiology 2018, 288, 198–206. [Google Scholar] [CrossRef] [PubMed] [Green Version]
- Sanchez, D.L.; Thomas, K.R.; Edmonds, E.C.; Bondi, M.W.; Bangen, K.J. Alzheimer’s Disease Neuroimaging Initiative. Regional Hypoperfusion Predicts Decline in Everyday Functioning at Three-Year Follow-Up in Older Adults without Dementia. J. Alzheimers Dis. 2020, 77, 1291–1304. [Google Scholar] [CrossRef] [PubMed]
- Tosun, D.; Mojabi, P.; Weiner, M.W.; Schuff, N. Joint analysis of structural and perfusion MRI for cognitive assessment and classification of Alzheimer’s disease and normal aging. Neuroimage 2010, 52, 186–197. [Google Scholar] [CrossRef] [PubMed]
- Westerberg, C.; Mayes, A.; Florczak, S.M.; Chen, Y.; Creery, J.; Parrish, T.; Weintraub, S.; Mesulam, M.M.; Reber, P.J.; Paller, K.A. Distinct medial temporal contributions to different forms of recognition in amnestic mild cognitive impairment and Alzheimer’s disease. Neuropsychologia 2013, 51, 2450–2461. [Google Scholar] [CrossRef] [Green Version]
- Wierenga, C.E.; Dev, S.I.; Shin, D.D.; Clark, L.R.; Bangen, K.J.; Jak, A.J.; Rissman, R.A.; Liu, T.T.; Salmon, D.P.; Bondi, M.W. Effect of mild cognitive impairment and APOE genotype on resting cerebral blood flow and its association with cognition. J. Cereb. Blood Flow Metab. 2012, 32, 1589–1599. [Google Scholar] [CrossRef] [PubMed]
- Xie, L.; Dolui, S.; Das, S.R.; Stockbower, G.E.; Daffner, M.; Rao, H.; Yushkevich, P.A.; Detre, J.A.; Wolk, D.A. A brain stress test: Cerebral perfusion during memory encoding in mild cognitive impairment. Neuroimage Clin. 2016, 11, 388–397. [Google Scholar] [CrossRef] [PubMed] [Green Version]
- Zou, J.X.; Wang, M.J.; Lei, X.J.; Chen, X.G. 3.0 T MRI arterial spin labeling and magnetic resonance spectroscopy technology in the application of Alzheimer’s disease. Exp. Gerontol. 2014, 60, 31–36. [Google Scholar] [CrossRef]
- McKhann, G.; Drachmann, D.; Folstein, M.; Katzmann, R.; Price, D.; Stadlan, E. Clinical diagnosis of Alzheimer’s disease: Report of the NINCDS-ADRDA work group under the auspices of Department of Health and Human Services Task Force on Alzheimer’s Disease. Neurology 1984, 34, 939–944. [Google Scholar] [CrossRef] [Green Version]
- Jack, C.R., Jr.; Albert, M.S.; Knopman, D.S.; McKhann, G.M.; Sperling, R.A.; Carrillo, M.C.; Thies, B.; Phelps, C.H. Introduction to the recommendations from the National Institute on Aging-Alzheimer’s Association workgroups on diagnostic guidelines for Alzheimer’s disease. Alzheimer’s Dement. 2011, 7, 257–262. [Google Scholar] [CrossRef] [Green Version]
- Petersen, R.C. Mild cognitive impairment as a diagnostic entity. J. Int. Med. 2004, 256, 183–194. [Google Scholar] [CrossRef]
- Albert, M.S.; DeKosky, S.T.; Dickson, D.; Dubois, B.; Feldman, H.H.; Fox, N.C.; Gamst, A.; Holtzman, D.M.; Jagust, W.J.; Petersen, R.C.; et al. The diagnosis of mild cognitive impairment due to Alzheimer’s disease: Recommendations from the national institute on aging-alzheimer’s association workgroups on diagnostic guidelines for Alzheimer’s disease. Alzheimer’s Dement. 2011, 7, 270–279. [Google Scholar] [CrossRef] [Green Version]
- Jak, A.J.; Bondi, M.W.; Delano-Wood, L.; Wierenga, C.; Corey-Bloom, J.; Salmon, D.P.; Delis, D.C. Quantification of five neuropsychological approaches to defining mild cognitive impairment. Am. J. Geriatr. Psychiatry 2009, 17, 368–375. [Google Scholar] [CrossRef] [Green Version]
- Winblad, B.; Palmer, K.; Kivipelto, M.; Jelic, V.; Fratiglioni, L.; Wa hlund, L.O.; Nordberg, A.; Backman, L.; Albert, M.; Almkvist, O.; et al. Mild cognitive impairment–beyond controversies, towards a consensus: Report of the International Working Group on Mild Cognitive Impairment. J. Intern. Med. 2004, 256, 240–246. [Google Scholar] [CrossRef] [PubMed]
- Dubois, B.; Feldman, H.H.; Jacova, C.; Cummings, J.L.; Dekosky, S.T.; Barberger-Gateau, P.; Delacourte, A.; Frisoni, G.; Fox, N.C.; Galasko, D. Revising the definition of Alzheimer’s disease: A new lexicon. Lancet Neurol. 2010, 9, 1118–1127. [Google Scholar] [CrossRef] [PubMed]
- Petersen, R.C.; Lopez, O.; Armstrong, M.J.; Getchius, T.S.D.; Ganguli, M.; Gloss, D.; Gronseth, G.S.; Marson, D.; Pringsheim, T.; Day, G.S.; et al. Practice guideline update summary: Mild cognitive impairment: Report of the Guideline Development, Dissemination, and Implementation Subcommittee of the American Academy of Neurology. Neurology 2018, 90, 126–135. [Google Scholar] [CrossRef] [PubMed]
- Petersen, R.C.; Stevens, J.C.; Ganguli, M.; Tangalos, E.; Cummings, J.L.; DeKosky, S.T. Practice parameter: Early detection of dementia: Mild cognitive impairment (an evidence-based review). Report of the Quality Standards Subcommittee of the American Academy of Neurology. Neurology 2001, 56, 1133–1142. [Google Scholar] [CrossRef] [Green Version]
- Petersen, R.C.; Aisen, P.S.; Beckett, L.A.; Donohue, M.C.; Gamst, A.C.; Harvey, D.J.; Jack, C.R.; Jagust, W.J., Jr.; Shaw, L.M.; Toga, A.W.; et al. Alzheimer’s 985 Disease Neuroimaging Initiative (ADNI): Clinical characterization. Neurology 2010, 74, 201–209. [Google Scholar] [CrossRef] [Green Version]
- Musiek, E.S.; Chen, Y.; Korczykowski, M.; Saboury, B.; Martinez, P.M.; Reddin, J.S.; Alavi, A.; Kimberg, D.Y.; Wolk, D.A.; Julin, P.; et al. Direct comparison of fluorodeoxyglucose positron emission tomography and arterial spin labeling magnetic resonance imaging in Alzheimer’s disease. Alzheimers Dement. 2012, 8, 51–59. [Google Scholar] [CrossRef] [Green Version]
- Binnewijzend, M.A.; Benedictus, M.R.; Kuijer, J.; van der Flier, W.M.; Teunissen, C.E.; Prins, N.D.; Wattjes, M.P.; van Berckel, B.N.; Scheltens, P.; Barkhof, F. Cerebral perfusion in the predementia stages of Alzheimer’s disease. Eur. Radiol. 2016, 26, 506–514. [Google Scholar] [CrossRef] [Green Version]
- Sierra-Marcos, A. Regional Cerebral Blood Flow in Mild Cognitive Impairment and Alzheimer’s Disease Measured with Arterial Spin Labeling Magnetic Resonance Imaging. Int. J. Alzheimers Dis. 2017, 2017, 5479597. [Google Scholar] [CrossRef]
- Toth, P.; Tarantini, S.; Csiszar, A.; Ungvari, Z. Functional vascular contributions to cognitive impairment and dementia: Mechanisms and consequences of cerebral autoregulatory dysfunction, endothelial impairment, and neurovascular uncoupling in aging. Am. J. Physiol. Heart Circ. Physiol. 2017, 312, H1–H20. [Google Scholar] [CrossRef] [Green Version]
- Fleisher, A.S.; Podraza, K.M.; Bangen, K.J.; Taylor, C.; Sherzai, A.; Sidhar, K.; Liu, T.T.; Dale, A.M.; Buxton, R.B. Cerebral perfusion and oxygenation differences in Alzheimer’s disease risk. Neurobiol. Aging 2009, 30, 1737–1748. [Google Scholar] [CrossRef] [Green Version]
- Tai, L.M.; Thomas, R.; Marottoli, F.M.; Koster, K.P.; Kanekiyo, T.; Morris, A.W.; Bu, G. The role of APOE in cerebrovascular dysfunction. Acta Neuropathol. 2016, 131, 709–723. [Google Scholar] [CrossRef] [PubMed]
- Bracko, O.; Cruz Hernández, J.C.; Park, L.; Nishimura, N.; Schaffer, C.B. Causes and consequences of baseline cerebral blood flow reductions in Alzheimer’s disease. J. Cereb. Blood Flow Metab. 2021, 41, 1501–1516. [Google Scholar] [CrossRef] [PubMed]
- Østergaard, L.; Engedal, T.S.; Moreton, F.; Hansen, M.B.; Wardlaw, J.M.; Dalkara, T.; Markus, H.S.; Muir, K.W. Cerebral small vessel disease: Capillary pathways to stroke and cognitive decline. J. Cereb. Blood Flow Metab. 2016, 36, 302–325. [Google Scholar] [CrossRef] [PubMed] [Green Version]
- Thomas, K.R.; Osuna, J.R.; Weigand, A.J.; Edmonds, E.C.; Clark, A.L.; Holmqvist, S.; Cota, I.H.; Wierenga, C.E.; Bondi, M.W.; Bangen, K.J.; et al. Regional hyperperfusion in older adults with objectively-defined subtle cognitive decline. J. Cereb. Blood Flow Metab. 2021, 41, 1001–1012. [Google Scholar] [CrossRef]
- Faber, J.; Fonseca, L.M. How sample size influences research outcomes. Dent. Press J. Orthod. 2014, 19, 27–29. [Google Scholar] [CrossRef]


| Study ID | Participants (n) | Female (n) | Mean Age (SD) | MMSE Mean (SD) | Education (Years) | APOE4 Carriers | CVR | Diagnostic Criteria | ||||||||||||
|---|---|---|---|---|---|---|---|---|---|---|---|---|---|---|---|---|---|---|---|---|
| AD | MCI | CN | AD | MCI | CN | AD | MCI | CN | AD | MCI | CN | AD | MCI | CN | AD | MCI | CN | |||
| Alexopoulos P (2012) [33] Germany | - | 24 | 24 | - | 34% | 67% | - | 69.6 (8.2) | 69.6 (8.2) | - | NG | NG | - | NG | NG | - | NG | NG | NG | International working group 2014 [64] |
| Alsop DC (2000) USA [34] | 18 | - | 11 | 34% | - | 46% | 72.2 (6.8) | - | 68.9 (7.2) | 20.8 (7) | - | NG | - | NG | NG | - | NG | NG | NINCDS-ADRDA | |
| Alsop DC (2008) USA [35] | 22 | - | 16 | 55% | - | 57% | 75.6 (9.2) | - | 72.6 (8.9) | 22.2 (5.9) | - | 27.9 (2.6) | 15.5 (3.2) | - | 14.4 (3.8) | NG | - | NG | NG | NINCDS-ADRDA |
| Asslani (2008) USA [36] | 12 | - | 20 | 42% | - | 60% | 70.7 (8.7) | - | 72.1 (6.5) | NG | - | NG | 14.5 (3.8) | - | 15.8 (2.3) | NG | - | NG | NG | NINCDS-ADRDA |
| Bangen KJ (2012) USA [37] | - | 16 | 26 | - | 38% | 73% | - | 76.88 (7.31) | 74.79 (7.98) | - | NG | NG | - | 15.56 (2.53) | 15.86 (2.33) | - | 50% | 54% | FSRP, 10-year stroke risk | Jak AJ et al. 2009 [63] |
| Binnewijzend MAA (2013) Netherlands [38] | 71 | - | 70 | 55% | - | 39% | 65 (7) | - | 60 (9) | 20 (4.6) | - | 28 (1.7) | NG | - | NG | NG | - | NG | NG | NINCDS-ADRDA |
| Chau ACM (2020) Hong Kong [39] | 17 | - | 15 | 71% | - | 80% | 75.1 (8.2) | - | 71.8 (6.1) | NG | - | NG | NG | - | NG | NG | - | NG | DM, HTN, hyperlipidaemia | NIA-AA |
| Chaudhary S (2013) Canada [40] | 25 | - | 20 | 80% | - | 55% | 72.5 (0.9) | - | 71.8 (1.8) | 25.7 (1.6) | - | 28.4 (0.8) | 15.1 (3.4) | - | 15.7 (1.2) | NG | NINCDS-ADRDA | |||
| Dai W (2009) USA [41] | - | 26 | 41 | - | 58% | 66% | - | 83.6 (3.6) | 82.1 (3.6) | - | NG | NG | - | NG in years | NG in years | - | 23% | 12% | HTN, DM, Heart Disease | Cardiovascular Health study criteria |
| Ding B (2014) China [42] | 24 | - | 21 | 80% | - | 62% | 74.58 (6.68) | - | 69.64 (5.88) | 16 (3.9) | - | 29.4 (1) | 11.6 (4.2) | - | 12.1 (3.4) | NG | - | NG | NG | NINCDS-ADRDA |
| Dolui S (2020) USA [43] | - | 50 | 35 | - | 32% | 58% | - | 70.2 (6.9) | 73 (7) | - | 27 (6) | 30 (5) | - | 17.5 (13) | 18 (11) | NG | - | NG | NG | Petersen 2004 [61] |
| Duan (2020) USA [44] | 40 | - | 58 | 70% | - | 55% | 84.1 (3.5) | - | 83.4 (3.7) | NG | - | NG | 13.3 (2.9) | - | 14.6 (2.8) | NG | - | NG | HTN, DM, Heart Disease | Cardiovascular Health study criteria |
| Glodzik L (2011) USA [45] | 15 | - | 18 | 60% | - | 56% | 74.9 (8.1) | - | 69.9 (6.7) | 27.5 (2.4) | - | 29.2 (1) | NG | - | NG | NG | - | NG | FSRP | Petersen 2004 [61] |
| Huang CW (2018) Taiwan [46] | 50 | - | 30 | 66% | - | 60% | 73.32 (8.4) | - | 71.03 (8.05) | 16.78 (5.1) | - | 27.07 (1.9) | 5.3 (4.51) | - | 8.5 (5.22) | 54% | - | 20% | DM, HTN | Dubois 2010 [65] |
| Huang Q (2019) China [47] | 40 | 40 | 40 | 43% | 40% | 45% | 70.1 (5.7) | 68.5 (6.1) | 69.1 (5.8) | NG | NG | NG | NG in years | NG in years | NG in years | NG | NG | NG | NG | NIA-AA |
| Kim SM (2013) South Korea [48] | 25 | - | 25 | 84% | - | 64% | 70.9 (9.8) | - | 68.4 (5.6) | 15.76 (4.39) | - | 27.32 (2.8) | NG | - | NG | 56% | - | 20% | NG | NINCDS-ADRDA |
| Lassila T (2018) UK [49] | - | 9 | 15 | - | 67% | 54% | - | 74.8 (7.8) | 73.7 (5.1) | - | NG | NG | - | 9.2 (3.4) | 11.9 (2.9) | - | NG | NG | NG | NG |
| Li D (2020) China [50] | 22 | 22 | 25 | 59% | 55% | 60% | 71.5 (8.4) | 71.8 (8.2) | 69.3 (5.2) | 18.9 (3.4) | 23 (2.7) | 29.7 (1.2) | NG | NG | NG | NG | NG | NG | NG | NIA-AA Petersen 2018 [66] |
| Okonkwo OC (2014) USA [51] | 28 | 23 | 24 | 43% | 30% | 50% | 75.09 (9.81) | 73.35 (6.95) | 75.07 (6.30) | 22.04 (3.65) | 26.96 (2.01) | 29.04 (1.02) | 14.57 (3.05) | 16.83 (2.95) | 16.5 (3.32) | 68% | 56% | 38% | NG | NINCDS-ADRDA, Petersen 2001 [67] |
| Riederer I (2018) Germany [52] | 45 | - | 11 | 56% | - | 55% | 69 (9) | - | 65 (8) | 22 (4) | - | 28.5 (1.1) | 12.6 (3.8) | - | 12.4 (3) | NG | - | NG | NG | ICD-10, NINCDS-ADRDA |
| Sanchez DL (2020) USA [53] | - | 105 | 61 | - | 53% | 73% | - | 71.01 (7.1) | 71.62 (6.44) | - | ) | - | 16.69 (2.7) | 16.38 (2.45) | - | 55% | 45% | NG | ADNI criteria [68] | |
| Tosun D (2010) USA [54] | 24 | - | 38 | 38% | - | 56% | 66.29 (9.99) | - | 65.7 (8.25) | 21.76 (5.8) | - | 29.44 (0.86) | NG | - | NG | NG | - | NG | NG | NINCDS-ADRDA |
| Westerberg C (2013) USA [55] | - | 20 | 20 | - | 70% | 75% | - | 73.6 (NG) | 74.6 (NG) | - | 27.6 (NG) | 29.1 (NG) | - | NG | NG | - | NG | NG | NG | Petersen 2004 [61] |
| Wierenga CE (2012) USA [56] | - | 20 | 40 | - | 50% | 68% | - | 74.8 (11.4) | 73.5 (6.8) | - | NG | NG | - | 14.5 (2.7) | 16.3 (1.8) | - | 45% | 33%13 | NG | Jak AJ et al. 2009 [63] |
| Xie L (2016) USA [57] | 65 | 62 | - | 37% | 63% | - | 74 (6.2) | 70.5 (8.8) | - | 27.4 (1.7) | 29.2 (1) | - | 15.8 (3) | 16.6 (2.7) | - | NG | NG | NG | Petersen 2004 [61] | |
| Zou JX (2014) China [58] | 20 | - | 20 | 60% | - | 55% | 64.84 (8.82) | - | 64.94 (7.93) | 16.21 (4.01) | - | 27.35 (1.01) | 10.14 (3.24) | - | 11.05 (4.47) | NG | - | NG | NG | NINCDS-ADRDA |
| Study ID | MRI Scan Strength (Tesla) | ASL Sequence | CBF Estimation Method | Partial Volume Correction | Perfusion Change | Regions Studied | |
|---|---|---|---|---|---|---|---|
| AD | MCI | ||||||
| Alexopoulos P (2012) Germany [33] | 3.0 T | PULSAR | voxel-wise, ROIs | yes | ↑ | - | MTL and hippocampus, parahippocampal region |
| Alsop DC (2000) USA [34] | 1.5 T | 3D ASL | imaged-based, region-based | no | ↓ * | MTL | - |
| Alsop DC (2008) USA [35] | 3.0 T | 3D CASL | voxel-wise, region-based | yes | ↑ | Hippocampus, parahippocampal region | - |
| Asslani (2008) USA [36] | 1.5 T | CASL | voxel-wise, ROIs | yes | ↓ | Right parahippocampal region | - |
| Bangen KJ (2012) USA [37] | 3.0 T | 2D PASL | ROIs | yes | ↓ * | - | Bilateral and right MTL |
| Binnewijzend MAA (2013) Netherlands [38] | 3.0 T | 3D PCASL | ROIs | yes | ↓ * | Hippocampus. Results adjusted for age, sex, and WMH severity. | - |
| Chau ACM (2020) Hong Kong [39] | 3.0 T | 2D PCASL | ROIs | yes | ↓ | MTL Adjusted for age, gender, and GM volume. | - |
| Chaudhary S (2013) Canada [40] | 3.0 T | 3D PCASL | ROIs | yes | ↓ | MTL | - |
| Dai W (2009) USA [41] | 3.0 T | CASL | ROIs | yes | ↑ * | - | Right amygdala and left hippocampus. Results adjusted for age, sex and hypertension history. |
| Ding B (2014) China [42] | 3.0 T | PCASL | voxel-wise | no | ↓ * | Left limbic lobe and parahippocampal region | - |
| Dolui S (2020) USA [43] | 3.0 T | 2D PCASL | voxel-wise, ROIs | yes | ↓ | Hippocampus | |
| Duan (2020) USA [44] | 1.5 T | CASL | voxel-wise | yes | ↓ * | Left hippocampus | - |
| Glodzik L (2011) USA [45] | 3.0 T | PASL | ROIs | yes | ↔ | Right hippocampus | - |
| Huang CW (2018) Taiwan [46] | 1.5 T | PCASL | voxel-wise | yes | ↑ | MTL | - |
| Huang Q (2019) China [47] | 3.0 T | 3D PCASL | ROIs | no | ↓ * | Hippocampus | Hippocampus |
| Kim SM (2013) South Korea [48] | 3.0 T | PASL | voxel-wise | yes | ↓ | Left and right parahippocampal regions as well as left and right amygdala. Results adjusted for APOE status. | - |
| Lassila T (2018) UK [49] | 3.0 T | PCASL | z-scores | no | ↓ * | - | Left hippocampus |
| Li D (2020) China [50] | 3.0 T | 3D PCASL | ROIs | no | ↓ * | Hippocampus | Hippocampus |
| Okonkwo OC (2014) USA [51] | 3.0 T | PCASL | voxel-wise | yes | ↓ | Left parahippocampal region | Left parahippocampal region |
| Riederer I (2018) Germany [52] | 3.0 T | PASL | voxel-wise | yes | ↓ | Hippocampus, parahippocampal region, amygdala | - |
| Sanchez DL (2020) USA [53] | 3.0 T | PASL | ROIs | yes | ↓ | - | MTL decreased over 3 years |
| Tosun D (2010) USA [54] | 4.0 T | CASL | ROIs | yes | ↓ | Left and right hippoocampus | - |
| Westerberg C (2013) USA [55] | 3.0 T | 2D PASL | ROIs | yes | ↑ * | - | Parahippocampal and entorhinal regions |
| Wierenga CE (2012) USA [56] | 3.0 T | PASL | voxel-wise, ROIs | yes | ↑ * | - | Right hippocampus |
| Xie L (2016) USA [57] | 3.0 T | 2D PCASL | ROIs | yes | ↓ * | - | Left hippocampus No significance remained after correction for multiple comparisons |
| Zou JX (2014) China [58] | 3.0 T | 3D PASL | ROIs | no | ↓ * | Hippocampus, bilaterally | - |
Publisher’s Note: MDPI stays neutral with regard to jurisdictional claims in published maps and institutional affiliations. |
© 2022 by the authors. Licensee MDPI, Basel, Switzerland. This article is an open access article distributed under the terms and conditions of the Creative Commons Attribution (CC BY) license (https://creativecommons.org/licenses/by/4.0/).
Share and Cite
Kapasouri, E.M.; Ioannidis, D.C.; Cameron, D.; Vassiliou, V.S.; Hornberger, M. The Utility of Arterial Spin Labeling MRI in Medial Temporal Lobe as a Vascular Biomarker in Alzheimer’s Disease Spectrum: A Systematic Review and Meta-Analysis. Diagnostics 2022, 12, 2967. https://doi.org/10.3390/diagnostics12122967
Kapasouri EM, Ioannidis DC, Cameron D, Vassiliou VS, Hornberger M. The Utility of Arterial Spin Labeling MRI in Medial Temporal Lobe as a Vascular Biomarker in Alzheimer’s Disease Spectrum: A Systematic Review and Meta-Analysis. Diagnostics. 2022; 12(12):2967. https://doi.org/10.3390/diagnostics12122967
Chicago/Turabian StyleKapasouri, Efthymia Maria, Diomidis C. Ioannidis, Donnie Cameron, Vassilios S. Vassiliou, and Michael Hornberger. 2022. "The Utility of Arterial Spin Labeling MRI in Medial Temporal Lobe as a Vascular Biomarker in Alzheimer’s Disease Spectrum: A Systematic Review and Meta-Analysis" Diagnostics 12, no. 12: 2967. https://doi.org/10.3390/diagnostics12122967
APA StyleKapasouri, E. M., Ioannidis, D. C., Cameron, D., Vassiliou, V. S., & Hornberger, M. (2022). The Utility of Arterial Spin Labeling MRI in Medial Temporal Lobe as a Vascular Biomarker in Alzheimer’s Disease Spectrum: A Systematic Review and Meta-Analysis. Diagnostics, 12(12), 2967. https://doi.org/10.3390/diagnostics12122967