


Automated Systems for Calculating Arteriovenous Ratio in Retinographies: A Scoping Review
 , , , ,
Abstract
1. Introduction
2. Materials and Methods
2.1. Search Strategy, Data Sources, and Selection
2.2. Selection Criteria
- (1)
- Automated systems were used to partially or totally analyze photographic images of the retina.
- (2)
- Changes in the retinal vascular network and/or retinal vascular measurements were analyzed.
- (3)
- The publication was peer-reviewed.
- (4)
- The study was observational, descriptive (population, cross-sectional), analytical (case studies and controls, cohorts), experimental (clinical trials), or a validation of experiments/new image analysis methods.
2.3. Selection of Studies
2.4. Data Extraction
3. Results
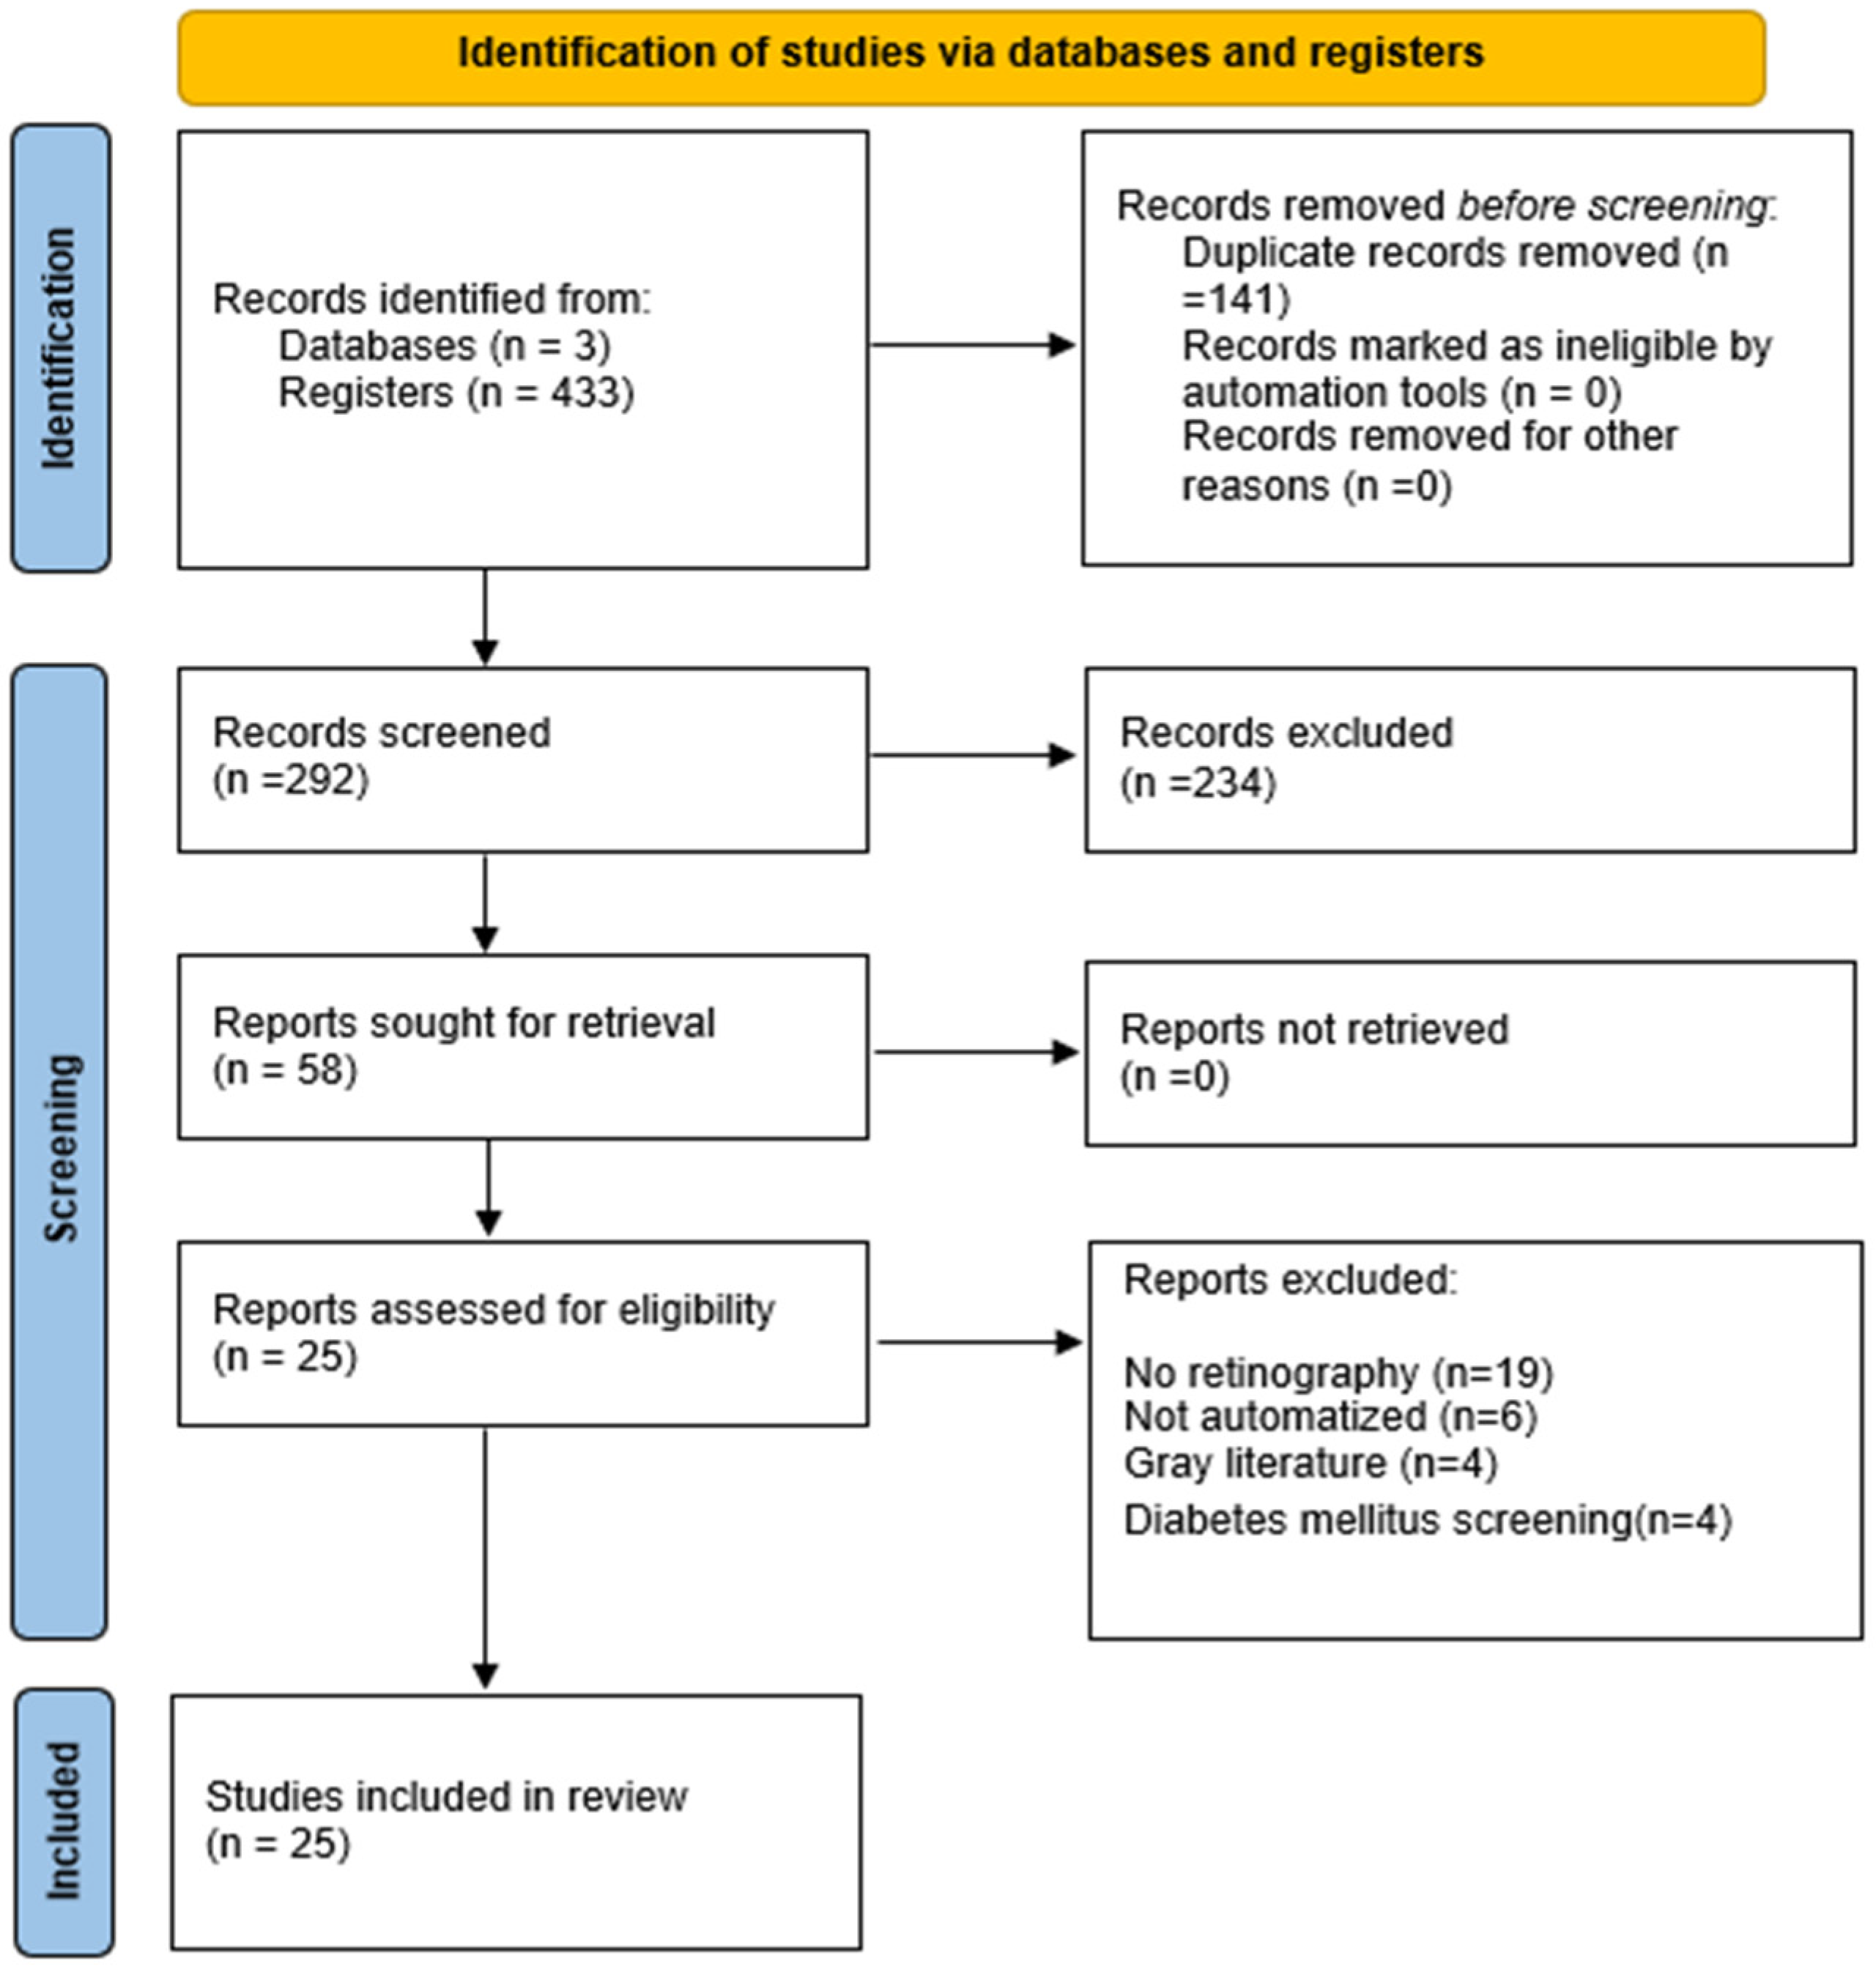
3.1. Search Process
3.2. Characteristics of the Articles
3.3. Interpretation Procedures
3.4. Summary of the Results
4. Discussion
5. Conclusions
Author Contributions
Funding
Institutional Review Board Statement
Informed Consent Statement
Data Availability Statement
Conflicts of Interest
References
- Cheung, C.Y.; Ikram, M.K.; Sabanayagam, C.; Wong, T.Y. Retinal microvasculature as a model to study the manifestations of hypertension. Hypertension 2012, 60, 1094–1103. [Google Scholar] [CrossRef] [PubMed]
- Screening Programmes by Geography—Retina International’s Diabetic Eye Disease Toolkit. Available online: http://ded.retinaint.org/screening-innovation-and-clinical-trials/screening-programs-by-geography/ (accessed on 19 May 2021).
- Nørgaard, M.F.; Grauslund, J. Automated screening for diabetic retinopathy—A systematic review. Ophthalmic. Res. 2018, 60, 9–17. [Google Scholar] [CrossRef]
- Nielsen, K.B.; Lautrup, M.L.; Andersen, J.K.H.; Savarimuthu, T.R.; Grauslund, J. Deep Learning—Based Algorithms in Screening of Diabetic Retinopathy: A Systematic Review of Diagnostic Performance. Ophthalmol. Retin. 2019, 3, 294–304. [Google Scholar] [CrossRef]
- Islam, M.M.; Yang, H.C.; Poly, T.N.; Jian, W.S.; Li, Y.C. Deep learning algorithms for detection of diabetic retinopathy in retinal fundus photographs: A systematic review and meta-analysis. Comput. Methods Programs Biomed. 2020, 191, 105320. [Google Scholar] [CrossRef] [PubMed]
- Rani, A.; Mittal, D. Measurement of Arterio-Venous Ratio for Detection of Hypertensive Retinopathy through Digital Color Fundus Images. J. Biomed. Eng. Med. Imaging 2015, 2, 35. [Google Scholar] [CrossRef]
- Cheung, C.Y.; Tay, W.T.; Mitchell, P.; Wang, J.J.; Hsu, W.; Lee, M.L.; Lau, Q.P.; Zhu, A.L.; Klein, R.; Saw, S.M.; et al. Quantitative and qualitative retinal microvascular characteristics and blood pressure. J. Hypertens. 2011, 29, 1380–1391. [Google Scholar] [CrossRef] [PubMed]
- Seidelmann, S.B.; Claggett, B.; Bravo, P.E.; Gupta, A.; Farhad, H.; Klein, B.E.; Klein, R.; Di Carli, M.; Solomon, S.D. Retinal Vessel Calibers in Predicting Long-Term Cardiovascular Outcomes: The Atherosclerosis Risk in Communities Study. Circulation 2016, 134, 1328–1338. [Google Scholar] [CrossRef]
- Poplin, R.; Varadarajan, A.V.; Blumer, K.; Liu, Y.; McConnell, M.V.; Corrado, G.S.; Peng, L.; Webster, D.R. Prediction of cardiovascular risk factors from retinal fundus photographs via deep learning. Nat. Biomed. Eng. 2018, 2, 158–164. [Google Scholar] [CrossRef]
- Ong, Y.T.; Hilal, S.; Cheung, C.Y.; Xu, X.; Chen, C.; Venketasubramanian, N.; Wong, T.Y.; Ikram, M.K. Retinal Vascular Fractals and Cognitive Impairment. Dement. Geriatr. Cogn. Dis. Extra 2014, 4, 305–313. [Google Scholar] [CrossRef]
- Yip, W.; Ong, P.G.; Teo, B.W.; Cheung, C.Y.-L.; Tai, E.S.; Cheng, C.-Y.; Lamoureux, E.; Wong, T.Y.; Sabanayagam, C. Retinal vascular imaging markers and incident chronic kidney disease: A prospective cohort study. Sci. Rep. 2017, 7, 9374. [Google Scholar] [CrossRef]
- Taylor, A.M.; MacGillivray, T.J.; Henderson, R.D.; Ilzina, L.; Dhillon, B.; Starr, J.M.; Deary, I.J. Retinal vascular fractal dimension, childhood IQ, and cognitive ability in old age: The lothian birth cohort study 1936. PLoS ONE 2015, 10, e0121119. [Google Scholar] [CrossRef] [PubMed]
- Cheung, C.; Ikram, M.K.; Chen, C.; Wong, T.Y. Imaging retina to study dementia and stroke. Prog. Retin. Eye Res. 2017, 57, 89–107. [Google Scholar] [CrossRef] [PubMed]
- McGeechan, K.; Liew, G.; MacAskill, P.; Irwig, L.; Klein, R.; Klein, B.E.; Wang, J.J.; Mitchell, P.; Vingerling, J.R.; de Jong, P.T.; et al. Prediction of incident stroke events based on retinal vessel caliber: A systematic review and individual-participant meta-analysis. Am. J. Epidemiol. 2009, 170, 1323–1332. [Google Scholar] [CrossRef]
- Forés, R.; Manresa, J.M.; López-Lifante, V.M.; Heras, A.; Delgado, P.; Vázquez, X.; Ruiz, S.; Alzamora, M.T. Relationship between retinal microvasculature, cardiovascular risk and silent brain infarction in hypertensive patients. Diagnostics 2021, 11, 937. [Google Scholar] [CrossRef] [PubMed]
- Thom, S.; Stettler, C.; Stanton, A.; Witt, N.; Tapp, R.; Chaturvedi, N.; Allemann, S.; Mayet, J.; Sever, P.; Poulter, N.; et al. Differential effects of antihypertensive treatment on the retinal microcirculation: An anglo-scandinavian cardiac outcomes trial substudy. Hypertension 2009, 54, 405–408. [Google Scholar] [CrossRef] [PubMed]
- Reid, C.M.; Storey, E.; Wong, T.Y.; Woods, R.; Tonkin, A.; Wang, J.J.; Kam, A.; Janke, A.; Essex, R.; Abhayaratna, W.; et al. Aspirin for the prevention of cognitive decline in the elderly: Rationale and design of a neuro-vascular imaging study (ENVIS-ion). BMC Neurol. 2012, 12, 3. [Google Scholar] [CrossRef]
- Bhaduri, B.; Nolan, R.M.; Shelton, R.L.; Pilutti, L.A.; Motl, R.W.; Moss, H.E.; Pula, J.H.; Boppart, S.A. Detection of retinal blood vessel changes in multiple sclerosis with optical coherence tomography. Biomed. Opt. Express 2016, 7, 2321. [Google Scholar] [CrossRef]
- Petzold, A.; de Boer, J.F.; Schippling, S.; Vermersch, P.; Kardon, R.; Green, A.; Calabresi, P.A.; Polman, C. Optical coherence tomography in multiple sclerosis: A systematic review and meta-analysis. Lancet Neurol. 2010, 9, 921–932. [Google Scholar] [CrossRef]
- Saidha, S.; Sotirchos, E.S.; Ibrahim, M.A.; Crainiceanu, C.M.; Gelfand, J.M.; Sepah, Y.J.; Ratchford, J.N.; Oh, J.; Seigo, M.A.; Newsome, S.D.; et al. Microcystic macular oedema, Thickness of the inner nuclear layer of the retina, and disease characteristics in multiple sclerosis: A retrospective study. Lancet Neurol. 2012, 11, 963–972. [Google Scholar] [CrossRef]
- Meier, M.H.; Gillespie, N.A.; Hansell, N.K.; Hewitt, A.W.; Hickie, I.B.; Lu, Y.; MacGregor, S.; Medland, S.E.; Sun, C.; Wong, T.Y.; et al. Associations between depression and anxiety symptoms and retinal vessel caliber in adolescents and young adults. Psychosom. Med. 2014, 76, 732–738. [Google Scholar] [CrossRef]
- Yildiz, M.; Alim, S.; Batmaz, S.; Demir, S.; Songur, E.; Ortak, H.; Demirci, K. Duration of the depressive episode is correlated with ganglion cell inner plexifrom layer and nasal retinal fiber layer thicknesses: Optical coherence tomography findings in major depression. Psychiatry Res.-Neuroimaging 2016, 251, 60–66. [Google Scholar] [CrossRef] [PubMed]
- Celik, M.; Kalenderoglu, A.; Sevgi Karadag, A.; Bekir Egilmez, O.; Han-Almis, B.; Şimşek, A. Decreases in ganglion cell layer and inner plexiform layer volumes correlate better with disease severity in schizophrenia patients than retinal nerve fiber layer thickness: Findings from spectral optic coherence tomography. Eur. Psychiatry 2016, 32, 9–15. [Google Scholar] [CrossRef] [PubMed]
- Meier, M.H.; Shalev, I.; Moffitt, T.E.; Kapur, S.; Keefe, R.S.; Wong, T.Y.; Belsky, D.W.; Harrington, H.; Hogan, S.; Houts, R.; et al. Microvascular abnormality in schizophrenia as shown by retinal imaging. Am. J. Psychiatry 2013, 170, 1451–1459. [Google Scholar] [CrossRef] [PubMed]
- Wainwright, A.; Liew, G.; Burlutsky, G.; Rochtchina, E.; Zhang, Y.P.; Hsu, W.; Lee, J.M.; Wong, T.Y.; Mitchell, P.; Wang, J.J. Effect of image quality, color, and format on the measurement of retinal vascular fractal dimension. Investig. Ophthalmol. Vis. Sci. 2010, 51, 5525–5529. [Google Scholar] [CrossRef] [PubMed]
- Maderuelo-Fernandez, J.A.; Garcia-Garcia, A.; Chamoso, P.; Recio-Rodríguez, J.I.; Rodríguez-González, S.; Patino-Alonso, M.C.; Rodriguez-Sanchez, E.; Corchado-Rodríguez, J.M.; Gómez-Marcos, M.A.; Garcia-Ortiz, L. Automatic image analyser to assess retinal vessel calibre (ALTAIR). A new tool to evaluate the thickness, area and length of the vessels of the retina. Int. J. Med. Inform. 2020, 136, 104090. [Google Scholar] [CrossRef]
- Tricco, A.C.; Lillie, E.; Zarin, W.; O’Brien, K.K.; Colquhoun, H.; Levac, D.; Moher, D.; Peters, M.D.J.; Horsley, T.; Weeks, L.; et al. PRISMA extension for scoping reviews (PRISMA-ScR): Checklist and explanation. Ann. Intern. Med. 2018, 169, 467–473. [Google Scholar] [CrossRef]
- Page, M.J.; McKenzie, J.E.; Bossuyt, P.M.; Boutron, I.; Hoffmann, T.C.; Mulrow, C.D.; Shamseer, L.; Tetzlaff, J.M.; Akl, E.A.; Brennan, S.E.; et al. The PRISMA 2020 statement: An updated guideline for reporting systematic reviews. BMJ 2021, 372, 89. [Google Scholar] [CrossRef]
- Badawi, S.A.; Fraz, M.M.; Shehzad, M.; Mahmood, I.; Javed, S.; Mosalam, E.; Nileshwar, A.K. Detection and Grading of Hypertensive Retinopathy Using Vessels Tortuosity and Arteriovenous Ratio. J. Digit. Imaging 2022, 35, 281–301. [Google Scholar] [CrossRef]
- Huang, Y.; Zhou, H.; Zhang, S.; Zhong, X.; Lin, Y.; Xiong, Z.; Liu, M.; Yimamu, A.; Christopher, O.; Zhou, Z.; et al. Mid- to Late-Life Time-Averaged Cumulative Blood Pressure and Late-Life Retinal Microvasculature: The ARIC Study. J. Am. Heart Assoc. 2022, 11, e25226. [Google Scholar] [CrossRef]
- Irshad, S.; Yin, X.; Zhang, Y. A new approach for retinal vessel differentiation using binary particle swarm optimization. Comput. Methods Biomech. Biomed. Eng. Imaging Vis. 2021, 9, 510–522. [Google Scholar] [CrossRef]
- Dai, G.; He, W.; Xu, L.; Pazo, E.E.; Lin, T.; Liu, S.; Zhang, C. Exploring the effect of hypertension on retinal microvasculature using deep learning on East Asian population. PLoS ONE 2020, 15, e0230111. [Google Scholar] [CrossRef] [PubMed]
- Robertson, G.; Fleming, A.; Williams, M.C.; Trucco, E.; Quinn, N.; Hogg, R.; McKay, G.J.; Kee, F.; Young, I.; Pellegrini, E.; et al. Association between hypertension and retinal vascular features in ultra-widefield fundus imaging. Open Hear. 2020, 7, e001124. [Google Scholar] [CrossRef] [PubMed]
- Tapp, R.J.; Owen, C.G.; Barman, S.A.; Welikala, R.A.; Foster, P.J.; Whincup, P.H.; Strachan, D.P.; Rudnicka, A.R.; UK Biobank Eye and Vision Consortium. Associations of retinal microvascular diameters and tortuosity with blood pressure and arterial stiffness United Kingdom biobank. Hypertension 2019, 74, 1383–1390. [Google Scholar] [CrossRef]
- Lau, A.Y.; Mok, V.; Lee, J.; Fan, Y.; Zeng, J.; Lam, B.; Wong, A.; Kwok, C.; Lai, M.; Zee, B. Retinal image analytics detects white matter hyperintensities in healthy adults. Ann. Clin. Transl. Neurol. 2019, 6, 98–105. [Google Scholar] [CrossRef] [PubMed]
- He, Y.; Li, S.M.; Kang, M.T.; Liu, L.R.; Li, H.; Wei, S.F.; Ran, A.R.; Wang, N. Anyang Childhood Eye Study Group. Association between blood pressure and retinal arteriolar and venular diameters in Chinese early adolescent children, and whether the association has gender difference: A cross-sectional study. BMC Ophthalmol. 2018, 18, 133. [Google Scholar] [CrossRef]
- Adiarti, R.; Ekantini, R.; Agni, A.N.; Wong, T.Y.; Sasongko, M.B. Retinal Arteriolar Narrowing in Young Adults with Glaucomatous Optic Disc. J. Glaucoma 2018, 27, 699–702. [Google Scholar] [CrossRef]
- Akbar, S.; Akram, M.U.; Sharif, M.; Tariq, A.; Yasin, U. Arteriovenous ratio and papilledema based hybrid decision support system for detection and grading of hypertensive retinopathy. Comput. Methods Programs Biomed. 2018, 154, 123–141. [Google Scholar] [CrossRef]
- Iwase, A.; Sekine, A.; Suehiro, J.; Tanaka, K.; Kawasaki, Y.; Kawasaki, R.; Sinai, M.J.; Araie, M. A new method of magnification correction for accurately measuring retinal vessel calibers from fundus photographs. Investig. Ophthalmol. Vis. Sci. 2017, 58, 1858–1864. [Google Scholar] [CrossRef]
- Li, L.J.; Lamoureux, E.; Wong, T.Y.; Lek, N. Short-term poor glycemic control and retinal microvascular changes in pediatric Type 1 Diabetes patients in Singapore: A pilot study. BMC Ophthalmol. 2017, 17, 60. [Google Scholar] [CrossRef]
- Vázquez Dorrego, X.M.; Manresa Domínguez, J.M.; Heras Tebar, A.; Forés, R.; Girona Marcé, A.; Alzamora Sas, M.T.; Delgado Martínez, P.; Riba-Llena, I.; Ugarte Anduaga, J.; Beristain Iraolai, A.; et al. Semi-automatic measuring of arteriovenous relation as a possible silent brain infarction risk index in hypertensive patients. Arch. Soc. Española Oftalmol. 2016, 91, 513–519. [Google Scholar] [CrossRef]
- Cavallari, M.; Stamil, C.; Umeton, R.; Calimeri, F.; Orzi, F. Novel Method for Automated Analysis of Retinal Images: Results in Subjects with Hypertensive Retinopathy and CADASIL. BioMed Res. Int. 2015, 2015, 752957. [Google Scholar] [CrossRef] [PubMed]
- Fraz, M.M.; Welikala, R.A.; Rudnicka, A.R.; Owen, C.G.; Strachan, D.P.; Barman, S.A. QUARTZ: Quantitative analysis of retinal vessel topology and size - An automated system for quantification of retinal vessels morphology. Expert Syst. Appl. 2015, 42, 7221–7234. [Google Scholar] [CrossRef]
- Estrada, R.; Allingham, M.J.; Mettu, P.S.; Cousins, S.W.; Tomasi, C.; Farsiu, S. Retinal Artery-Vein Classification via Topology Estimation. IEEE Trans. Med. Imaging 2015, 34, 2518–2534. [Google Scholar] [CrossRef] [PubMed]
- Moradi, A.; Sepah, Y.J.; Ibrahim, M.A.; Sophie, R.; Moazez, C.; Bittencourt, M.G.; Annam, R.E.; Hanout, M.; Liu, H.; Ferraz, D.; et al. Association of retinal vessel calibre and visual outcome in eyes with diabetic macular oedema treated with ranibizumab. Eye 2014, 28, 1315–1320. [Google Scholar] [CrossRef] [PubMed]
- Franklin, S.W.; Rajan, S.E. Retinal vessel segmentation employing ANN technique by Gabor and moment invariants-based features. Appl. Soft Comput. J. 2014, 22, 94–100. [Google Scholar] [CrossRef]
- Dashtbozorg, B.; Mendonca, A.M.; Campilho, A. An automatic graph-based approach for artery/Vein classification in retinal images. IEEE Trans. Image Process. 2014, 23, 1073–1083. [Google Scholar] [CrossRef]
- Vázquez, S.G.; Barreira, N.; Penedo, M.G.; Rodríguez-Blanco, M. Reliable monitoring system for arteriovenous ratio computation. Comput. Med. Imaging Graph. 2013, 37, 337–345. [Google Scholar] [CrossRef]
- Huang, Y.; Zhang, J.; Huang, Y. An automated computational framework for retinal vascular network labeling and branching order analysis. Microvasc. Res. 2012, 84, 169–177. [Google Scholar] [CrossRef]
- Ortega, M.; Barreira, N.; Novo, J.; Penedo, M.G.; Pose-Reino, A.; Gómez-Ulla, F. Sirius: A web-based system for retinal image analysis. Int. J. Med. Inform. 2010, 79, 722–732. [Google Scholar] [CrossRef]
- Villalobos-Castaldi, F.M.; Felipe-Riverón, E.M.; Sánchez-Fernández, L.P. A fast, efficient and automated method to extract vessels from fundus images. J. Vis. 2010, 13, 263–270. [Google Scholar] [CrossRef]
- Vázquez, S.G.; Cancela, B.; Barreira, N.; Penedo, M.G.; Rodríguez-Blanco, M.; Seijo, M.P.; de Tuero, G.C.; Barceló, M.A.; Saez, M. Improving retinal artery and vein classification by means of a minimal path approach. Mach. Vis. Appl. 2013, 24, 919–930. [Google Scholar] [CrossRef]
- Akbar, S.; Akram, M.U.; Sharif, M.; Tariq, A.; Khan, S.A. Decision support system for detection of hypertensive retinopathy using arteriovenous ratio. Artif. Intell. Med. 2018, 90, 15–24. [Google Scholar] [CrossRef] [PubMed]
- Mancia, G.; Fagard, R.; Narkiewicz, K.; Redón, J.; Zanchetti, A.; Böhm, M.; Christiaens, T.; Cifkova, R.; De Backer, G.; Dominiczak, A.; et al. 2013 ESH/ESC guidelines for the management of arterial hypertension: The Task Force for the management of arterial hypertension of the European Society of Hypertension (ESH) and of the European Society of Cardiology (ESC). Eur. Heart J. 2013, 34, 2159–2219. [Google Scholar] [CrossRef] [PubMed]
- Abràmoff, M.D.; Lou, Y.; Erginay, A.; Clarida, W.; Amelon, R.; Folk, J.C.; Niemeijer, M. Improved automated detection of diabetic retinopathy on a publicly available dataset through integration of deep learning. Investig. Ophthalmol. Vis. Sci. 2016, 57, 5200–5206. [Google Scholar] [CrossRef]
- Manresa, J.M.; Forés, R.; Vázquez, X.; Alzamora, M.T.; Heras, A.; Delgado, P.; Torán-Montserrat, P. Reliability of retinography for the detection of hypertensive retinopathy in Primary Care. Aten. Primaria 2020, 52, 410–417. [Google Scholar] [CrossRef]
- Arnould, L.; Binquet, C.; Guenancia, C.; Alassane, S.; Kawasaki, R.; Daien, V.; Tzourio, C.; Kawasaki, Y.; Bourredjem, A.; Bron, A.; et al. Association between the retinal vascular network with Singapore ‘i’ Vessel Assessment (SIVA) software, cardiovascular history and risk factors in the elderly: The Montrachet study, population-based study. PLoS ONE 2018, 13, e0194694. [Google Scholar] [CrossRef]
- Schmidt-Erfurth, U.; Sadeghipour, A.; Gerendas, B.S.; Waldstein, S.M.; Bogunović, H. Artificial intelligence in retina. Prog. Retin. Eye Res. 2018, 67, 1–29. [Google Scholar] [CrossRef]


| Author, Year | Country | Aim | Sample | Photographs | Software | Automation Type | Scenario |
|---|---|---|---|---|---|---|---|
| Badawi, 2022 [29] | Pakistan and United Arab Emirates | Measure arteriovenous relationship and degree of retinal vessel tortuosity to detect and classify hypertensive retinopathy. | 504 | 504 | VAMPIRE a | Automated | RVM dataset b |
| Huang, 2022 [30] | China | Assess the association between cumulative blood pressure, averaged over 25 years, and retinal vessel calibers. | 1818 | Semi-automated | ARIC c | ||
| Irshad, 2021 [31] | Australia | Method for the differentiation and classification of retinal vessels by Binary Particle Swarm Optimization (BPSO). | 142 | BPSO | Automated | Real scenario INSPIRE-AVR VICAVR | |
| Dai, 2020 [32] | China | Report on the construction of a model to further explore the pathophysiological changes of the retinal microvasculature. | 1419 | 2012 | CNN 8 architecture | Automated | DRIVE 1 STARE 2 |
| Maderuelo-Fernandez, 2020 [26] | Spain | Assess the relevance of a retinal vessel analysis system in target organ damage and vascular risk. | 250 | 495 | ALTAIR d | Semi-automated | Real scenario |
| Robertson, 2020 [33] | UK | Evaluate whether retinal vessel measurements were associated with hypertension. | 440 | 880 | VAMPIRE a | Semi-automated | NICOLA 3 |
| Tapp, 2019 [34] | UK | Examine the association between retinal vessel morphometry and blood pressure and arterial stiffness. | 54,714 | 95,716 | QUARTZ e | Automated | United Kingdom Biobank |
| Lau, 2019 [35] | Hong Kong | Determine whether a high burden of white matter hyperintensities can be detected through images of the retina. | 180 | 180 | ARIA f | Automated | CU-RISK COHORT 4 |
| He, 2018 [36] | China | Examine the association between blood pressure measurements and changes in the retinal microvasculature. | 1501 | 1501 | IVAN g | Semi-automated | Real scenario Pediatrics |
| Adiarti, 2018 [37] | Indonesia | Assess retinal vessel diameter as a marker of glaucoma. | 54 | 108 | SIVA h | Semi-automated | Real scenario |
| Akbar, 2018 [38] | Pakistan | Assess AVR calculation as a classifier of the degree of arterial hypertension. | 100 | 198 | - | Automated | INSPIRE-AVR 5 VICAVRAVRDB 6 |
| Iwase, 2017 [39] | Japan | Compare a new method of retinal vessel measurement with the IVAN system. | 99 | 180 | - | Semi-automated | Real scenario |
| Yip, 2017 [11] | Singapore | Describe the associations between retinal vascular parameters and chronic kidney disease. | 1256 | 2512 | SIVA h | Semi-automated | Real scenario |
| Li, 2017 [40] | Singapore | Investigate the association between poor glycemic control and subsequent changes in the retinal microvasculature. | 55 | 110 | SIVA jh | Semi-automated | Real scenario Pediatrics |
| Vázquez Dorrego, 2016 [41] | Spain | Evaluate the usefulness of measuring arteriovenous ratio to detect silent brain ischemia. | 768 | 2262 | VesselMap2 | Semi-automated | Real scenario |
| Cavallari, 2015 [42] | USA, Italy | Develop a semi-automated method to assess retinal vessel morphology. | 54 | 108 | Cioran and BRetina plugins | Semi-automated | Real scenario |
| Fraz, 2015 [43] | Pakistan and UK | Present a fully automated software to analyze the retinal vasculature. | - | 16,000 | QUARTZ e | Automated | DRIVE 1 STARE 2 INSPIRE 5 CHASE-DB1 DIARETDB1 7 |
| Estrada, 2015 [44] | USA | Develop a semi-automated method to distinguish arteries from veins in fundus images. | 110 | 130 | - | Semi-automated | DRIVE 1 INSPIRE 5 WIDE |
| Moradi, 2014 [45] | USA | Identify the association between baseline retinal vascular caliber and visual outcome of patients with diabetic macular edema. | 84 | 25 | IVAN g | Semi-automated | Real scenario |
| Franklin, 2014 [46] | India | Present an automated retinal vessel segmentation technique. | 40 | 40 | ANN 9 | Automated | DRIVE 1 |
| Dashtbozorg, 2014 [47] | Portugal | Develop an automatic approach for the classification of arteries and veins of the retinal vasculature. | - | 130 | - | Semi-automated | DRIVE1 INSPIRE-AVR 5 VICAVR |
| Vázquez, 2013 [48] | Spain | Propose a methodology for classifying arteries and veins in the fundus vasculature. | - | 100 | - | Semi-automated | VICAVR-2 |
| Huang, 2012 [49] | China | Propose an automated computational framework for retinal vascular network labeling and branch order analysis. | - | 40 | - | Automated | DRIVE 1 |
| Ortega, 2010 [50] | Spain | Develop a generic framework for processing retinal images. | 96 | 173 | SIRIUS i | Semi-automated | Real scenario |
| Villalobos-Castaldi, 2010 [51] | Mexico | Present a fast, efficient, and automatic algorithm to extract vessels from retinal images. | - | 20 | - | Automated | DRIVE 1 |
| Author, Year | Measurements | Focus of the Image | Area Analyzed | S * | SP ** | DP *** | Conclusions |
|---|---|---|---|---|---|---|---|
| Badawi, 2022 [29] | AVR Tortuosity | Optic disc | 2 to 3 radii from the optic disc The entire retina | 95.5% | - | 96.8% | Hybrid tool that combines AVR and tortuosity to detect and grade the severity of hypertensive retinopathy. |
| Huang, 2022 [30] | CRAE a CRVE b AVR | Optic disc | 2 to 3 radii from the optic disc | - | - | - | High blood pressure, averaged over 25 years, and specifically DBP, was associated with narrower retinal vessel diameter. |
| Irshad, 2021 [31] | Classification of arteries and veins | Optic disc | 2 to 3 radii from the optic disc | - | - | 92.7% 94.6% 91.9% | Proposal of a method that offers improved retinal vessel classification and is robust in three different databases. |
| Dai, 2020 [32] | Subclinical morphological features | Macula | The entire retinal vasculature | 59.3% | 63.8% | 60.9% 70.5% AUC: 65.1% | Changes in retinal vessel branching pattern were the most significant response to high blood pressure compared to other retinal microvascular biomarkers such as caliber, tortuosity, fractal dimension, and branching angle. |
| Maderuelo-Fernandez, 2020 [26] | CRAE a CRV b AVR | Optic disc | Three concentric circles around the optic disc | - | - | - | A concomitant association of retinal vessel measurements with other cardiovascular parameters and cardiovascular risk is shown. |
| Robertson, 2020 [33] | Nasal-annular AVR | Annular segment that subtends 180° nasally to the optic disc | 6.5 to 8.5 radii from the optic disc | - | - | - | Semi-automated AVR measurements on ultra-widefield fundus images were associated with hypertension. |
| Tapp, 2019 [34] | Arteriolar and venular diameter and Tortuosity | Optic disc and macula | The entire retinal vasculature | - | - | - | Associations between retinal vessel morphometry, blood pressure, and arterial stiffness index. |
| Lau, 2019 [35] | CRAE a CRVE b Arteriole occlusion Hemorrhages Tortuosity | Macula | 2 to 3 radii from the optic disc | 93% | 98% | - | Automatic retinal image analysis can detect community-dwelling subjects who do not have dementia and who have a significant burden of white matter hyperintensities in their brains. |
| He, 2018 [36] | CRAE a CRVE b AVR | Optic disc and macula | - | - | - | Higher blood pressure was significantly associated with narrower retinal arterioles in a population of 12-year-olds. | |
| Adiarti, 2018 [37] | CRAE a CRVE b AVR | Optic disc and macula | 1 to 4 radii from the optic disc | - | - | - | Retinal arteriolar narrowing may represent subclinical microcirculatory changes associated with the presence of a glaucomatous optic disc even in the absence of increased intraocular pressure. |
| Akbar, 2018 [38] | CRAE a CRVE b AVR | Optic disc | The entire retinal vasculature | 98.9% | 98.6% | 98.8% | The system is reliable for clinical use in the detection and grading of hypertensive retinopathy. |
| Iwase, 2017 [39] | CRAE a CRVE b AVR | Optic disc | 2 to 3 radii from the optic disc | - | - | - | The method would be especially useful to accurately measure retinal vessel caliber in a myopic population. |
| Yip, 2017 [11] | CRAE a CRVE b Tortuosity | Optic disc | 1 to 4 radii from the optic disc | - | - | - | Retinal microvascular abnormalities may reflect early subclinical damage to the renal microvasculature that is later associated with the development of chronic kidney disease. |
| Li, 2017 [40] | CRAE a CRVE b Tortuosity | Optic disc and macula | 1 to 4 radii from the optic disc | - | - | - | Pediatric patients with Type 1 diabetes and poor glycemic control showed abnormal retinal morphology in the short term. |
| Vázquez Dorrego, 2016 [41] | AVR | Optic disc and macula | 2 and 3 radii from the optic disc | - | - | - | Alteration of the retinal vasculature is associated with an increased risk of silent brain ischemia in hypertensive patients. |
| Cavallari, 2015 [42] | AVR Tortuosity Mean Fractal Dimension | Optic disc | 3.5 radii from the optic disc | 68.8% (HR) 54.5% (CADASIL) | 87.5% (HR) 90.9% (CADASIL) | - | AVR, tortuosity index, and mean fractal dimension were altered in HR and CADASIL subjects compared to age- and sex-matched control subjects. |
| Fraz, 2015 [43] | AVR Tortuosity | Optic disc | The entire retinal vasculature | 75.5% | 98.0% | 95.3% | Provides quantifiable measurements of retinal vessel morphology. |
| Estrada, 2015 [44] | Classification of arteries and veins | Optic disc and macula | The entire retinal vasculature | 91.0% 93.0% 91.7% 91.5% | 91.0% 94.1% 91.7% 90.2% | 90.9% 93.5% 91.7% 90.9% | The software outputs a graph representing the retinal vasculature. |
| Moradi, 2014 [45] | CRAE a CRVE b | Optic disc | 2 and 3 radii from the optic disc | - | - | - | Correlation between retinal venular caliber and visual outcome in patients with diabetic macular edema treated with ranibizumab. A higher CRVE, but not CRAE, was correlated with an improvement in vision. |
| Franklin, 2014 [46] | Vessel segmentation | Macula | The entire retinal vasculature | - | - | - | This technique has proven to be an effective tool for blood vessel segmentation in retinal images. |
| Dashtbozorg, 2014 [47] | Classification of arteries and veins | Optic disc | The entire retinal vasculature | 91% 90% | 86% 84% | - | The software outputs a graph representing the retinal vasculature. Each segment of the retina is then classified as an artery or vein. |
| Vázquez, 2013 [48] | Classification of arteries and veins | Optic disc | Various circumferences around the optic disc | - | - | 87.7% | The best results were achieved with four separate circumferences with a value of 0.5 radii. |
| Huang, 2012 [49] | Skeleton of the retinal vascular tree | Optic disc | The entire retinal vasculature | - | - | - | A useful tool to extract morphological characteristics in pathological studies related to the retina. |
| Ortega, 2010 [50] | AVR | Optic disc | Various circumferences around the optic disc | - | - | 99.2% | Sirius implements a web-based solution to analyze, manage, and understand retinal images. |
| Villalobos-Castaldi, 2010 [51] | Vessel segmentation | Optic disc | The entire retinal vasculature | 96.5% | 94.8% | 97.6% | Tool to obtain an automatic threshold value to segment vessels. |
Publisher’s Note: MDPI stays neutral with regard to jurisdictional claims in published maps and institutional affiliations. |
© 2022 by the authors. Licensee MDPI, Basel, Switzerland. This article is an open access article distributed under the terms and conditions of the Creative Commons Attribution (CC BY) license (https://creativecommons.org/licenses/by/4.0/).
Share and Cite
García-Sierra, R.; López-Lifante, V.M.; Isusquiza Garcia, E.; Heras, A.; Besada, I.; Verde Lopez, D.; Alzamora, M.T.; Forés, R.; Montero-Alia, P.; Ugarte Anduaga, J.; et al. Automated Systems for Calculating Arteriovenous Ratio in Retinographies: A Scoping Review. Diagnostics 2022, 12, 2865. https://doi.org/10.3390/diagnostics12112865
García-Sierra R, López-Lifante VM, Isusquiza Garcia E, Heras A, Besada I, Verde Lopez D, Alzamora MT, Forés R, Montero-Alia P, Ugarte Anduaga J, et al. Automated Systems for Calculating Arteriovenous Ratio in Retinographies: A Scoping Review. Diagnostics. 2022; 12(11):2865. https://doi.org/10.3390/diagnostics12112865
Chicago/Turabian StyleGarcía-Sierra, Rosa, Victor M. López-Lifante, Erik Isusquiza Garcia, Antonio Heras, Idoia Besada, David Verde Lopez, Maria Teresa Alzamora, Rosa Forés, Pilar Montero-Alia, Jurgi Ugarte Anduaga, and et al. 2022. "Automated Systems for Calculating Arteriovenous Ratio in Retinographies: A Scoping Review" Diagnostics 12, no. 11: 2865. https://doi.org/10.3390/diagnostics12112865
APA StyleGarcía-Sierra, R., López-Lifante, V. M., Isusquiza Garcia, E., Heras, A., Besada, I., Verde Lopez, D., Alzamora, M. T., Forés, R., Montero-Alia, P., Ugarte Anduaga, J., & Torán-Monserrat, P. (2022). Automated Systems for Calculating Arteriovenous Ratio in Retinographies: A Scoping Review. Diagnostics, 12(11), 2865. https://doi.org/10.3390/diagnostics12112865