
Value of Dual-Energy CT Perfusion Analysis in Patients with Acute Pancreatitis: Correlation and Discriminative Diagnostic Accuracy with Varying Disease Severity
 , ,
, ,
Abstract
1. Introduction
2. Materials and Methods
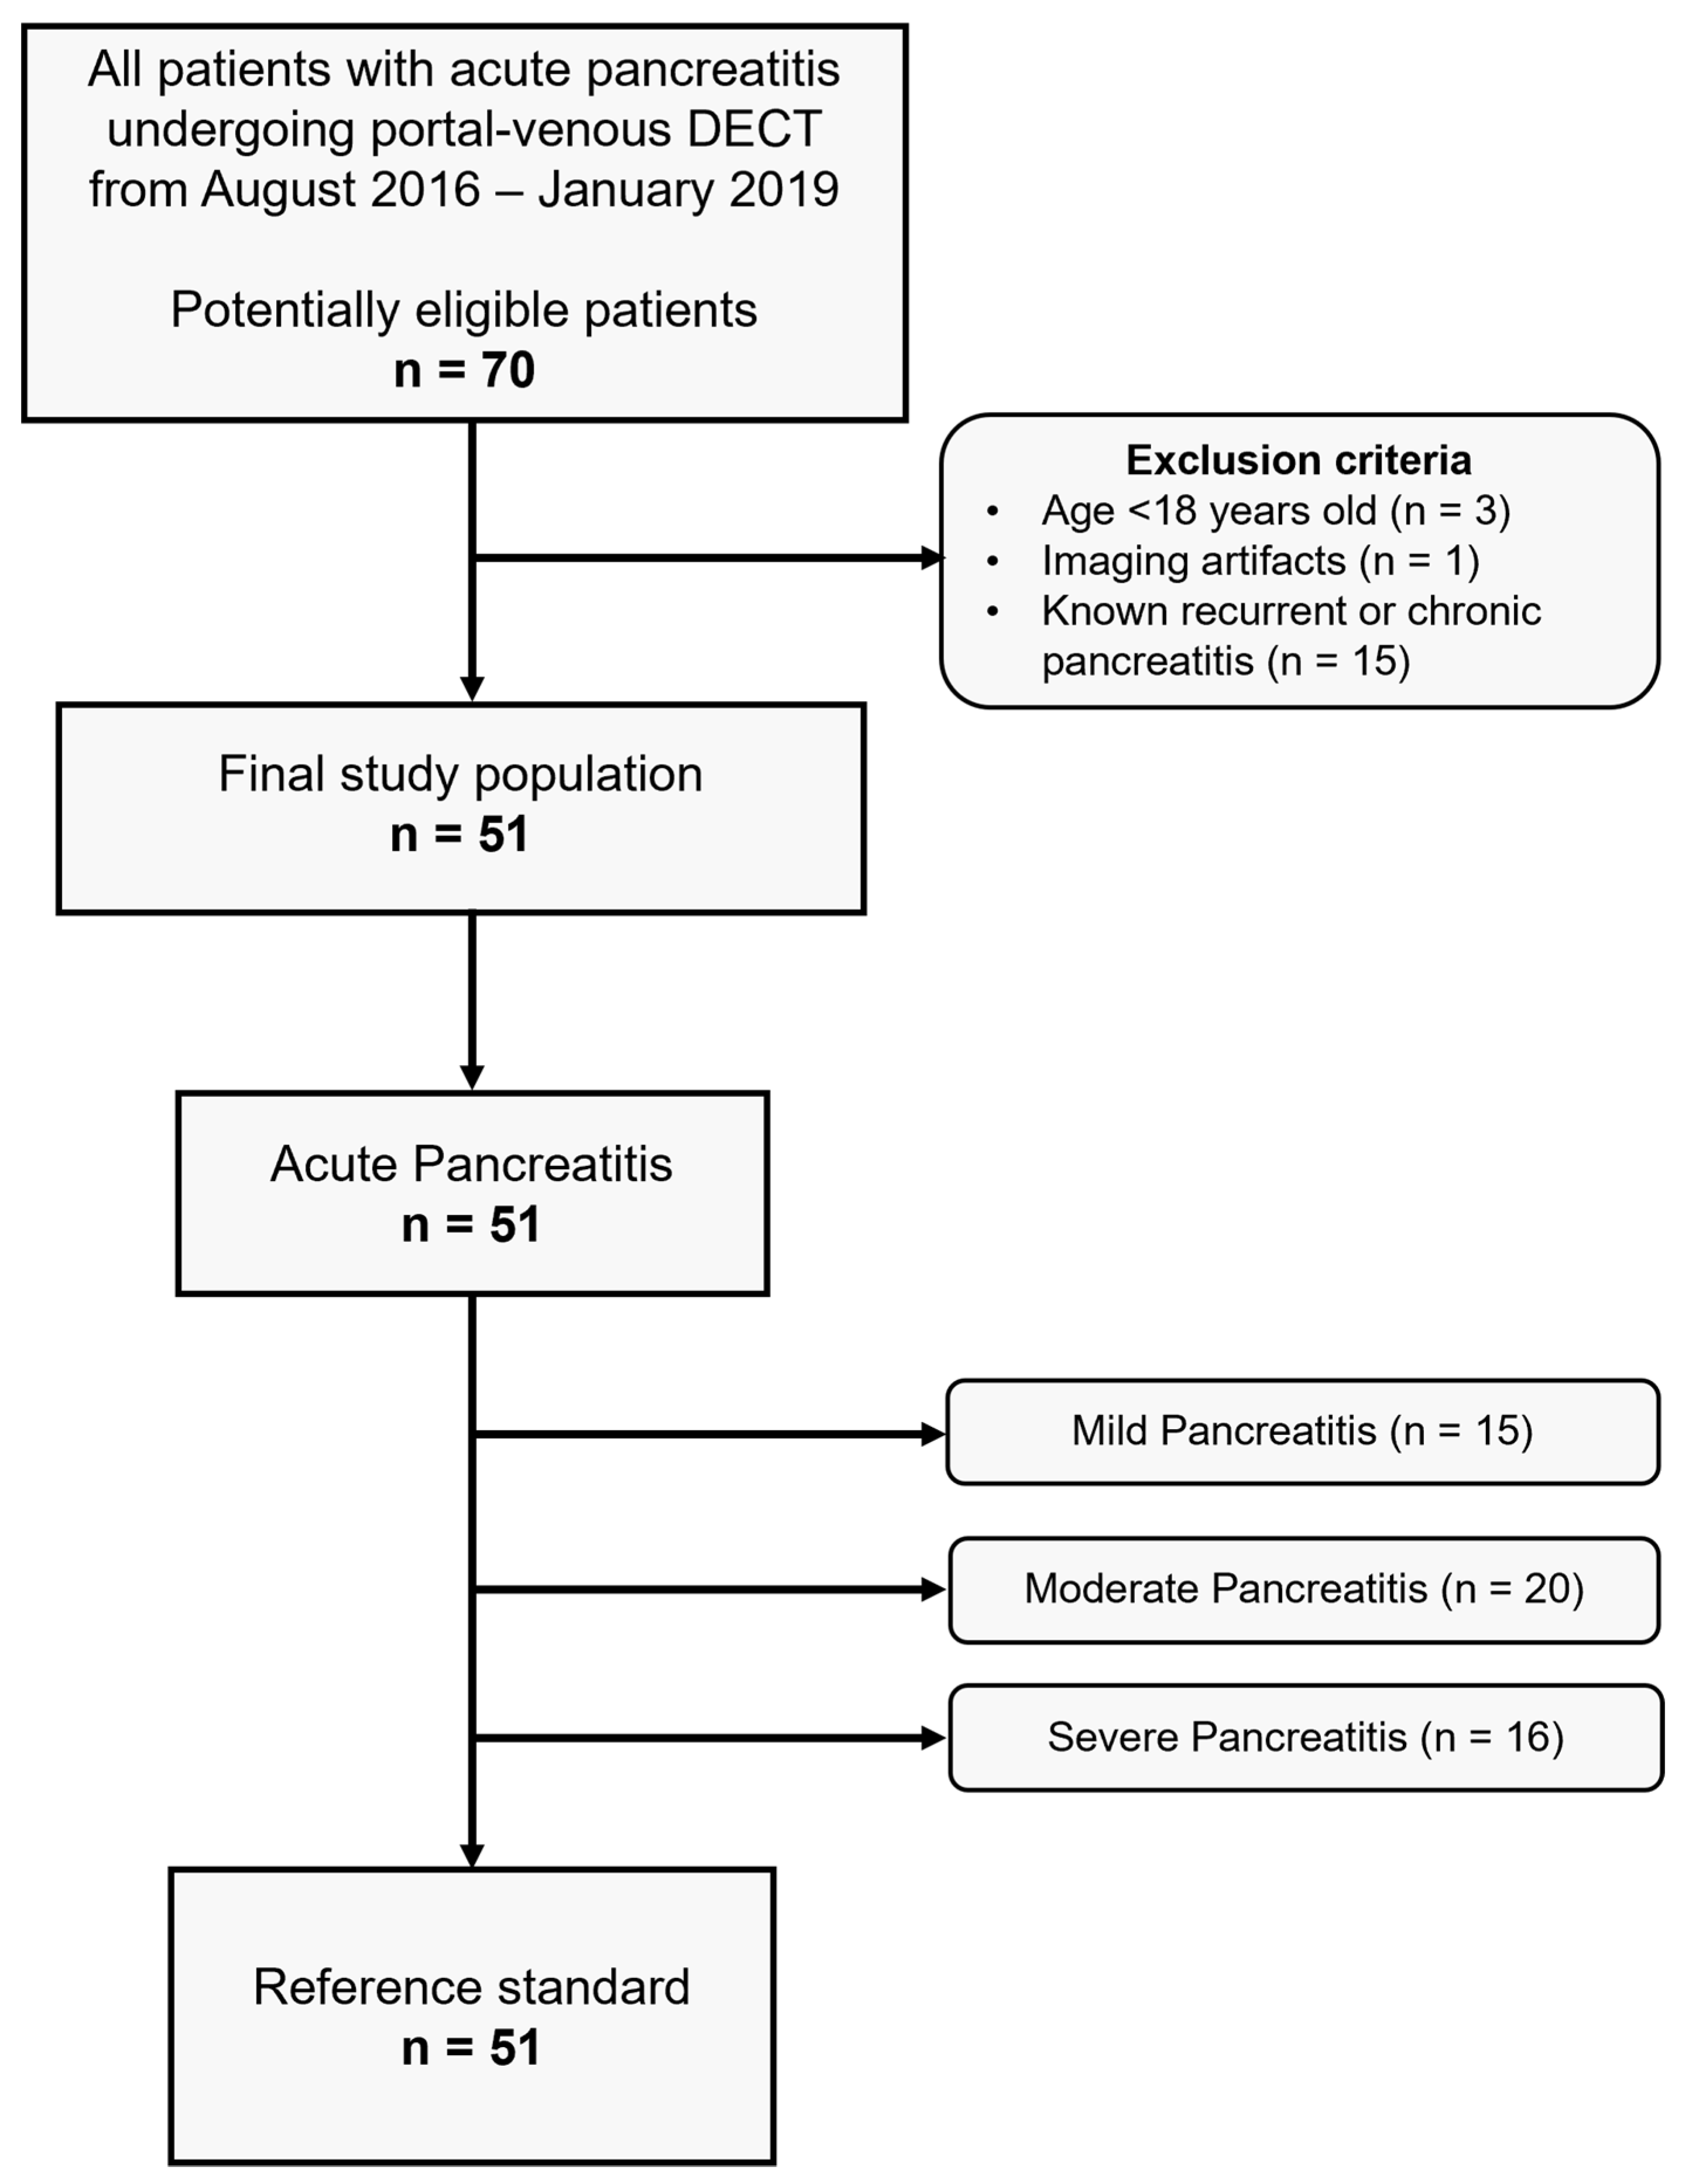
2.1. Study Population
2.2. CT Acquisition Protocol and Image Reconstruction
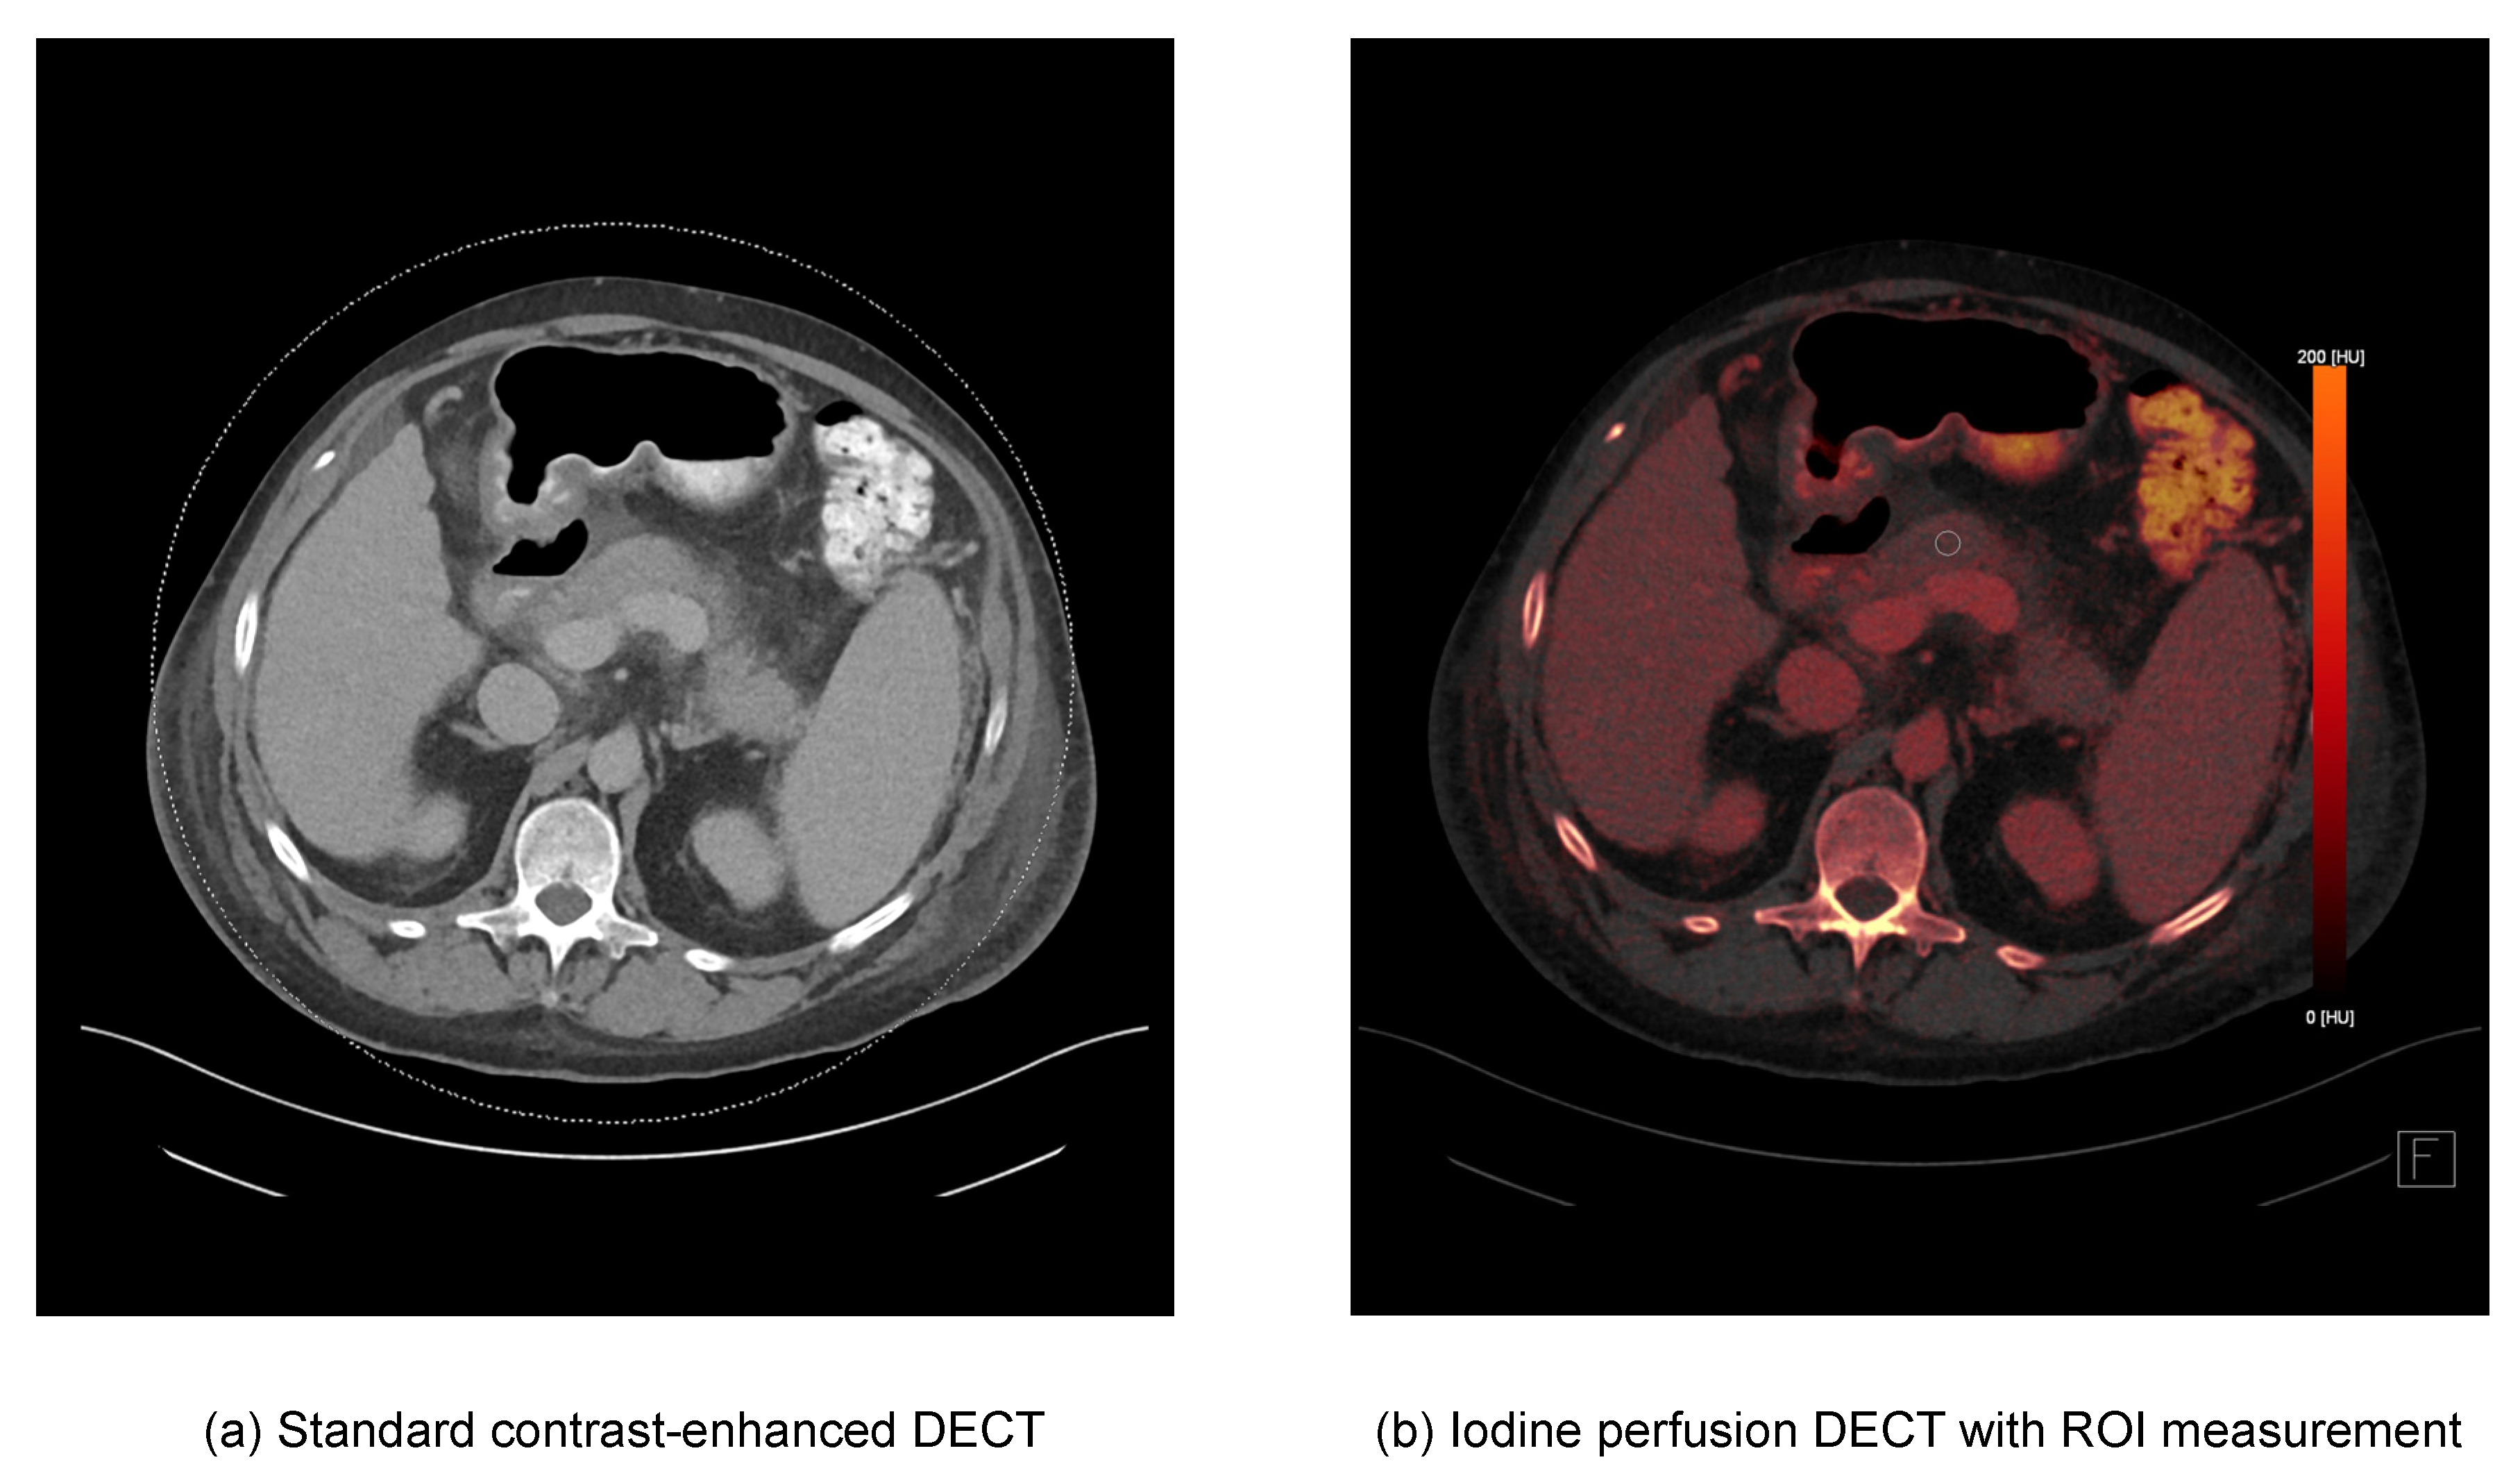
2.3. DECT Image Postprocessing and Image Analysis
2.4. Statistical Analysis
3. Results
4. Discussion
Author Contributions
Funding
Institutional Review Board Statement
Informed Consent Statement
Data Availability Statement
Conflicts of Interest
Abbreviations
| AUC | Area under the curve |
| CT | Computed tomography |
| CTDI | Computed tomography dose index |
| CTSI | Computed tomography severity index |
| DECT | Dual-energy computed tomography |
| DLP | Dose-length product |
| HU | Hounsfield Units |
| ICC | Intraclass correlation coefficient |
| ROC | Receiver operating characteristic |
| ROI | Region of interest |
| STARD | Standards for Reporting Diagnostic Accuracy Studies |
References
- Geokas, M.C.; Baltaxe, H.A.; Banks, P.A.; Silva, J.; Frey, C.F. Acute pancreatitis. Ann. Intern. Med. 1985, 103, 86–100. [Google Scholar] [CrossRef] [PubMed]
- Wu, B.U.; Johannes, R.S.; Sun, X.; Tabak, Y.; Conwell, D.L.; Banks, P.A. The early prediction of mortality in acute pancreatitis: A large population-based study. Gut 2008, 57, 1698–1703. [Google Scholar] [CrossRef] [PubMed]
- Greenberg, J.A.; Hsu, J.; Bawazeer, M.; Marshall, J.; Friedrich, J.O.; Nathens, A.; Coburn, N.; May, G.R.; Pearsall, E.; McLeod, R.S. Clinical practice guideline: Management of acute pancreatitis. Can. J. Surg. 2016, 59, 128–140. [Google Scholar] [CrossRef] [PubMed]
- Scaglione, M.; Casciani, E.; Pinto, A.; Andreoli, C.; de Vargas, M.; Gualdi, G.F. Imaging assessment of acute pancreatitis: A review. Semin. Ultrasound CT MRI 2008, 29, 322–340. [Google Scholar] [CrossRef]
- Türkvatan, A.; Erden, A.; Türkoğlu, M.A.; Seçil, M.; Yener, Ö. Imaging of acute pancreatitis and its complications. Part 1: Acute pancreatitis. Diagn. Interv. Imaging 2015, 96, 151–160. [Google Scholar] [CrossRef]
- Ong, Y.; Shelat, V.G. Ranson score to stratify severity in Acute Pancreatitis remains valid—Old is gold. Expert. Rev. Gastroenterol. Hepatol. 2021, 15, 865–877. [Google Scholar] [CrossRef]
- Bollen, T.L.; Singh, V.K.; Maurer, R.; Repas, K.; van Es, H.W.; Banks, P.A.; Mortele, K.J. Comparative evaluation of the modified CT severity index and CT severity index in assessing severity of acute pancreatitis. Am. J. Roentgenol. 2011, 197, 386–392. [Google Scholar] [CrossRef]
- Mortele, K.J.; Wiesner, W.; Intriere, L.; Shankar, S.; Zou, K.H.; Kalantari, B.N.; Perez, A.; vanSonnenberg, E.; Ros, P.R.; Banks, P.A.; et al. A modified CT severity index for evaluating acute pancreatitis: Improved correlation with patient outcome. Am. J. Roentgenol. 2004, 183, 1261–1265. [Google Scholar] [CrossRef]
- Johnson, T.R.C.; Krauss, B.; Sedlmair, M.; Grasruck, M.; Bruder, H.; Morhard, D.; Fink, C.; Weckbach, S.; Lenhard, M.; Schmidt, B.; et al. Material differentiation by dual energy CT: Initial experience. Eur. Radiol. 2007, 17, 1510–1517. [Google Scholar] [CrossRef]
- Patino, M.; Prochowski, A.; Agrawal, M.D.; Simeone, F.J.; Gupta, R.; Hahn, P.F.; v Sahani, D. Material Separation Using Dual-Energy CT: Current and Emerging Applications. Radiographics 2016, 36, 1087–1105. [Google Scholar] [CrossRef] [PubMed]
- Xu, J.J.; Taudorf, M.; Ulriksen, P.S.; Achiam, M.P.; Resch, T.A.; Nielsen, M.B.; Lönn, L.B.; Hansen, K.L. Gastrointestinal Applications of Iodine Quantification Using Dual-Energy CT: A Systematic Review. Diagnostics 2020, 10, 814. [Google Scholar] [CrossRef] [PubMed]
- Utrera Pérez, E.; de la Fuente, G.T.; Martínez Rodríguez, C.; Villanueva Campos, A.; Jurado Basildo, C.; García Pouton, N. Quantification of iodine concentration by dual-energy CT in patients with acute pancreatitis. Radiologia 2020, 62, 360–364. [Google Scholar] [CrossRef] [PubMed]
- Martin, S.S.; Trapp, F.; Wichmann, J.L.; Albrecht, M.H.; Lenga, L.; Durden, J.; Booz, C.; Vogl, T.J.; D’Angelo, T. Dual-energy CT in early acute pancreatitis: Improved detection using iodine quantification. Eur. Radiol. 2019, 29, 2226–2232. [Google Scholar] [CrossRef] [PubMed]
- Hu, X.; Wei, W.; Zhang, L. The value of a dual-energy spectral CT quantitative analysis technique in acute pancreatitis. Clin. Radiol. 2021, 76, 551.e11–551.e15. [Google Scholar] [CrossRef]
- Banks, P.A.; Bollen, T.L.; Dervenis, C.; Gooszen, H.G.; Johnson, C.D.; Sarr, M.G.; Tsiotos, G.G.; Vege, S.S. Acute Pancreatitis Classification Working Group, Classification of acute pancreatitis—2012: Revision of the Atlanta classification and definitions by international consensus. Gut 2013, 62, 102–111. [Google Scholar] [CrossRef]
- Crockett, S.D.; Wani, S.; Gardner, T.B.; Falck-Ytter, Y.; Barkun, A.N. American Gastroenterological Association Institute Clinical Guidelines Committee, American Gastroenterological Association Institute Guideline on Initial Management of Acute Pancreatitis. Gastroenterology 2018, 154, 1096–1101. [Google Scholar] [CrossRef]
- Balthazar, E.J. Acute pancreatitis: Assessment of severity with clinical and CT evaluation. Radiology 2002, 223, 603–613. [Google Scholar] [CrossRef]
- Koo, T.K.; Li, M.Y. A Guideline of Selecting and Reporting Intraclass Correlation Coefficients for Reliability Research. J. Chiropr. Med. 2016, 15, 155–163. [Google Scholar] [CrossRef]
- Chan, Y.H. Biostatistics 104: Correlational analysis. Singap. Med. J. 2003, 44, 614–619. Available online: http://www.ncbi.nlm.nih.gov/pubmed/14770254 (accessed on 22 August 2022).
- Karçaaltıncaba, M.; Aktaş, A. Dual-energy CT revisited with multidetector CT: Review of principles and clinical applications. Diagn. Interv. Radiol. 2011, 17, 181–194. [Google Scholar] [CrossRef]
- Kocher, M.R.; Kovacs, M.D.; Stewart, W.; Flemming, B.P.; Hinen, S.; Hardie, A.D. Added value of iodine-specific imaging and virtual non-contrast imaging for gastrointestinal assessment using dual-energy computed tomography. J. Clin. Imaging Sci. 2021, 11, 68. [Google Scholar] [CrossRef] [PubMed]
- George, E.; Wortman, J.R.; Fulwadhva, U.P.; Uyeda, J.W.; Sodickson, A.D. Dual energy CT applications in pancreatic pathologies. Br. J. Radiol. 2017, 90, 20170411. [Google Scholar] [CrossRef] [PubMed]
- Frellesen, C.; Fessler, F.; Hardie, A.D.; Wichmann, J.L.; de Cecco, C.N.; Schoepf, U.J.; Kerl, J.M.; Schulz, B.; Hammerstingl, R.; Vogl, T.J.; et al. Dual-energy CT of the pancreas: Improved carcinoma-to-pancreas contrast with a noise-optimized monoenergetic reconstruction algorithm. Eur. J. Radiol. 2015, 84, 2052–2058. [Google Scholar] [CrossRef] [PubMed]
- Mathy, R.M.; Fritz, F.; Mayer, P.; Klauss, M.; Grenacher, L.; Stiller, W.; Kauczor, H.-U.; Skornitzke, S. Iodine concentration and tissue attenuation in dual-energy contrast-enhanced CT as a potential quantitative parameter in early detection of local pancreatic carcinoma recurrence after surgical resection. Eur. J. Radiol. 2021, 143, 109944. [Google Scholar] [CrossRef] [PubMed]
- Ascenti, G.; Mileto, A.; Krauss, B.; Gaeta, M.; Blandino, A.; Scribano, E.; Settineri, N.; Mazziotti, S. Distinguishing enhancing from nonenhancing renal masses with dual-source dual-energy CT: Iodine quantification versus standard enhancement measurements. Eur. Radiol. 2013, 23, 2288–2295. [Google Scholar] [CrossRef]
- Eibl, G.; Hotz, H.G.; Faulhaber, J.; Kirchengast, M.; Buhr, H.J.; Foitzik, T. Effect of endothelin and endothelin receptor blockade on capillary permeability in experimental pancreatitis. Gut 2000, 46, 390–394. [Google Scholar] [CrossRef]
- Bollen, T.L.; Singh, V.K.; Maurer, R.; Repas, K.; van Es, H.W.; Banks, P.A.; Mortele, K.J. A comparative evaluation of radiologic and clinical scoring systems in the early prediction of severity in acute pancreatitis. Am. J. Gastroenterol. 2012, 107, 612–619. [Google Scholar] [CrossRef]
- Spanier, B.W.M.; Nio, Y.; van der Hulst, R.W.M.; Tuynman, H.A.R.E.; Dijkgraaf, M.G.W.; Bruno, M.J. Practice and yield of early CT scan in acute pancreatitis: A Dutch Observational Multicenter Study. Pancreatology 2010, 10, 222–228. [Google Scholar] [CrossRef]
- Pelgrim, G.J.; van Hamersvelt, R.W.; Willemink, M.J.; Schmidt, B.T.; Flohr, T.; Schilham, A.; Milles, J.; Oudkerk, M.; Leiner, T.; Vliegenthart, R. Accuracy of iodine quantification using dual energy CT in latest generation dual source and dual layer CT. Eur. Radiol. 2017, 27, 3904–3912. [Google Scholar] [CrossRef]
- Kim, H.; Goo, J.M.; Kang, C.K.; Chae, K.J.; Park, C.M. Comparison of Iodine Density Measurement Among Dual-Energy Computed Tomography Scanners from 3 Vendors. Investig. Radiol. 2018, 53, 321–327. [Google Scholar] [CrossRef]


| Parameters | Value |
|---|---|
| Number of patients (n) | 51 |
| Male / Female (n) | 39/12 |
| Age at date of CT scan (median years, range) | 54.0 (19.4–92.6) |
| Mean CTDI (mGy) | 10.2 ± 4.3 (3.5–26.1) |
| Mean DLP (mGy × cm) | 561.7 ± 278.2 (210.5–1687.5) |
| Lipase (U/L) | 2217.3 ± 3614.6 (7–14137) |
| Mean Modified CTSI | 5.2 ± 3.0 |
| Modified CTSI (n) | |
| Mild | 15 |
| Moderate | 20 |
| Severe | 16 |
| Parameters | Mild Acute Pancreatitis | Moderate Acute Pancreatitis | Severe Acute Pancreatitis | p-Value |
|---|---|---|---|---|
| Attenuation (HU) | 89.97 ± 12.93 | 76.00 ± 13.80 | 63.31 ± 17.66 | <0.001 |
| Iodine density (mg/mL) | 2.28 ± 0.51 | 1.84 ± 0.43 | 1.39 ± 0.35 | <0.001 |
| Normalized iodine uptake | 0.52 ± 0.13 | 0.44 ± 0.14 | 0.35 ± 0.11 | 0.002 |
| Fat fraction (%) | 11.24 ± 7.20 | 13.88 ± 6.82 | 15.95 ± 8.37 | 0.221 |
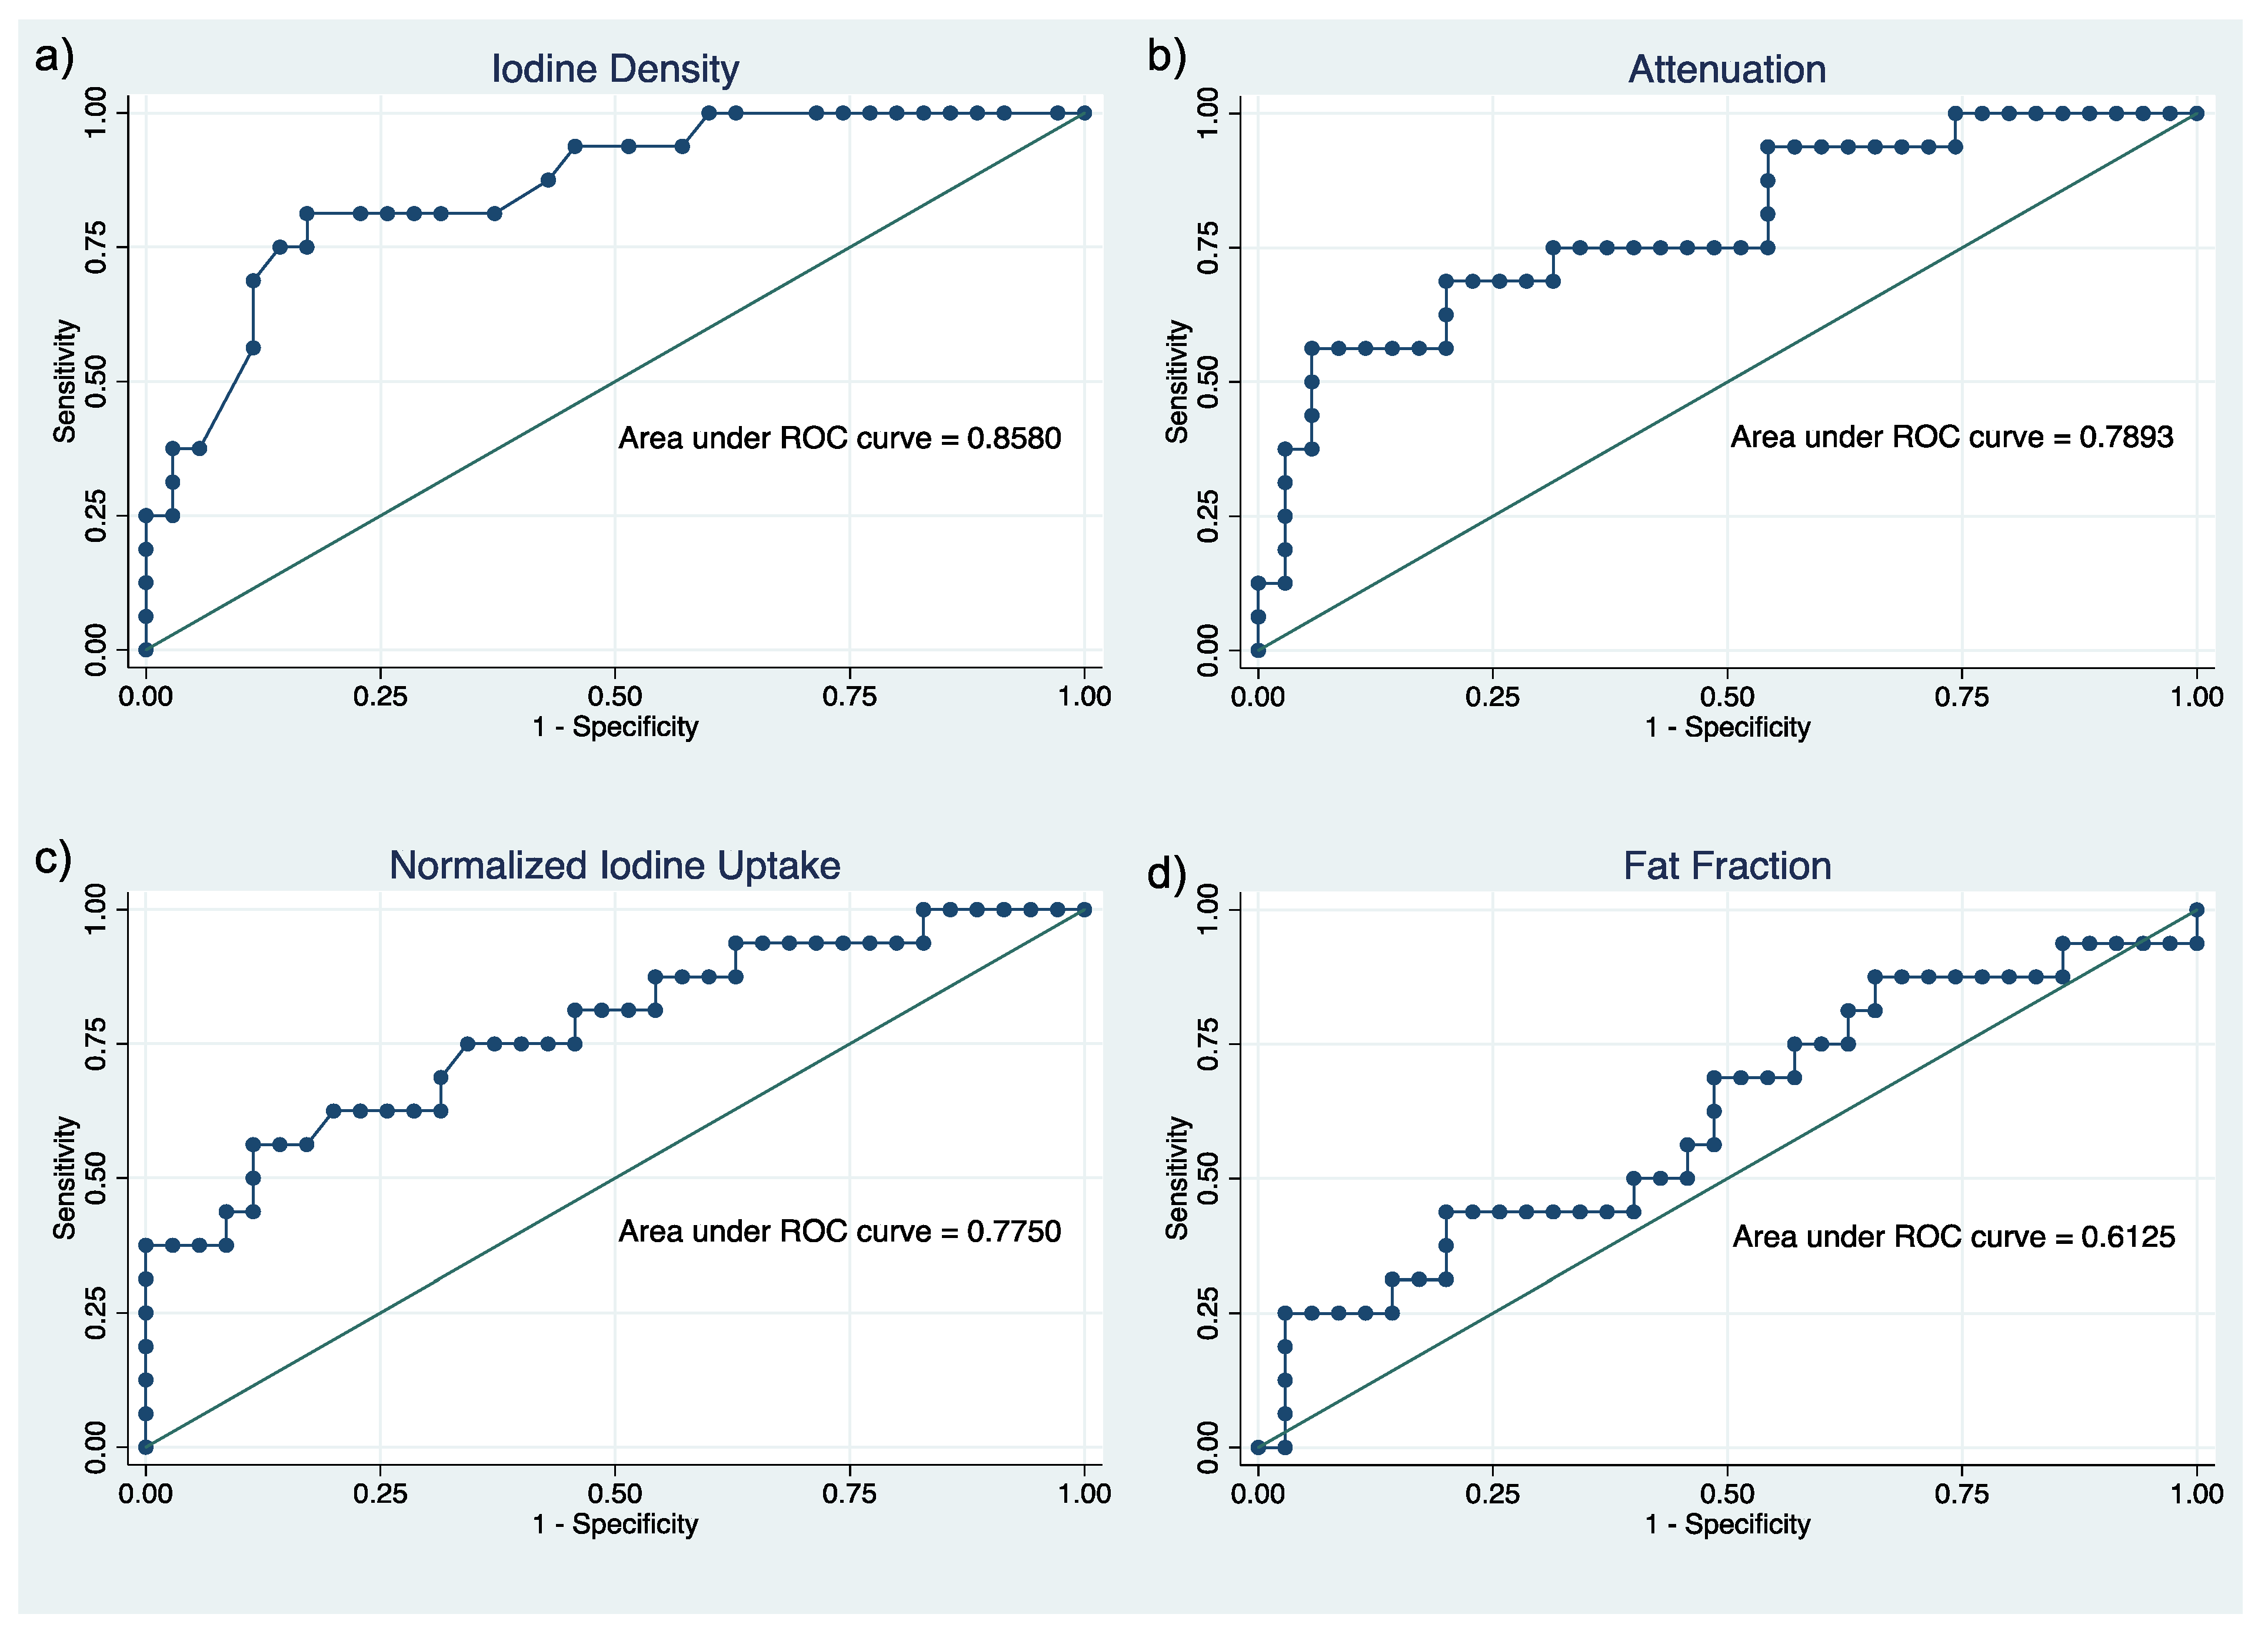
| Parameters | Pearson Correlation | AUC (95% CI) | ICC (95% CI) |
|---|---|---|---|
| Iodine density | −0.6483; p < 0.001 | 0.86 (0.75–0.97) | 0.91 (0.86–0.95) |
| Attenuation | −0.5856; p < 0.001 | 0.79 (0.65–0.93) | 0.90 (0.84–0.94) |
| Normalized iodine uptake | −0.5009; p < 0.001 | 0.78 (0.63–0.92) | 0.93 (0.89–0.96) |
| Fat fraction | +0.2416; p = 0.0876 | 0.61 (0.44–0.79) | 0.81 (0.69–0.88) |
Publisher’s Note: MDPI stays neutral with regard to jurisdictional claims in published maps and institutional affiliations. |
© 2022 by the authors. Licensee MDPI, Basel, Switzerland. This article is an open access article distributed under the terms and conditions of the Creative Commons Attribution (CC BY) license (https://creativecommons.org/licenses/by/4.0/).
Share and Cite
Mahmoudi, S.; Martin, S.; Koch, V.; Gruenewald, L.D.; Bernatz, S.; D’Angelo, T.; Vogl, T.J.; Booz, C.; Yel, I. Value of Dual-Energy CT Perfusion Analysis in Patients with Acute Pancreatitis: Correlation and Discriminative Diagnostic Accuracy with Varying Disease Severity. Diagnostics 2022, 12, 2601. https://doi.org/10.3390/diagnostics12112601
Mahmoudi S, Martin S, Koch V, Gruenewald LD, Bernatz S, D’Angelo T, Vogl TJ, Booz C, Yel I. Value of Dual-Energy CT Perfusion Analysis in Patients with Acute Pancreatitis: Correlation and Discriminative Diagnostic Accuracy with Varying Disease Severity. Diagnostics. 2022; 12(11):2601. https://doi.org/10.3390/diagnostics12112601
Chicago/Turabian StyleMahmoudi, Scherwin, Simon Martin, Vitali Koch, Leon David Gruenewald, Simon Bernatz, Tommaso D’Angelo, Thomas J. Vogl, Christian Booz, and Ibrahim Yel. 2022. "Value of Dual-Energy CT Perfusion Analysis in Patients with Acute Pancreatitis: Correlation and Discriminative Diagnostic Accuracy with Varying Disease Severity" Diagnostics 12, no. 11: 2601. https://doi.org/10.3390/diagnostics12112601
APA StyleMahmoudi, S., Martin, S., Koch, V., Gruenewald, L. D., Bernatz, S., D’Angelo, T., Vogl, T. J., Booz, C., & Yel, I. (2022). Value of Dual-Energy CT Perfusion Analysis in Patients with Acute Pancreatitis: Correlation and Discriminative Diagnostic Accuracy with Varying Disease Severity. Diagnostics, 12(11), 2601. https://doi.org/10.3390/diagnostics12112601