


An Intelligent Tongue Diagnosis System via Deep Learning on the Android Platform


Abstract
:1. Introduction
2. System
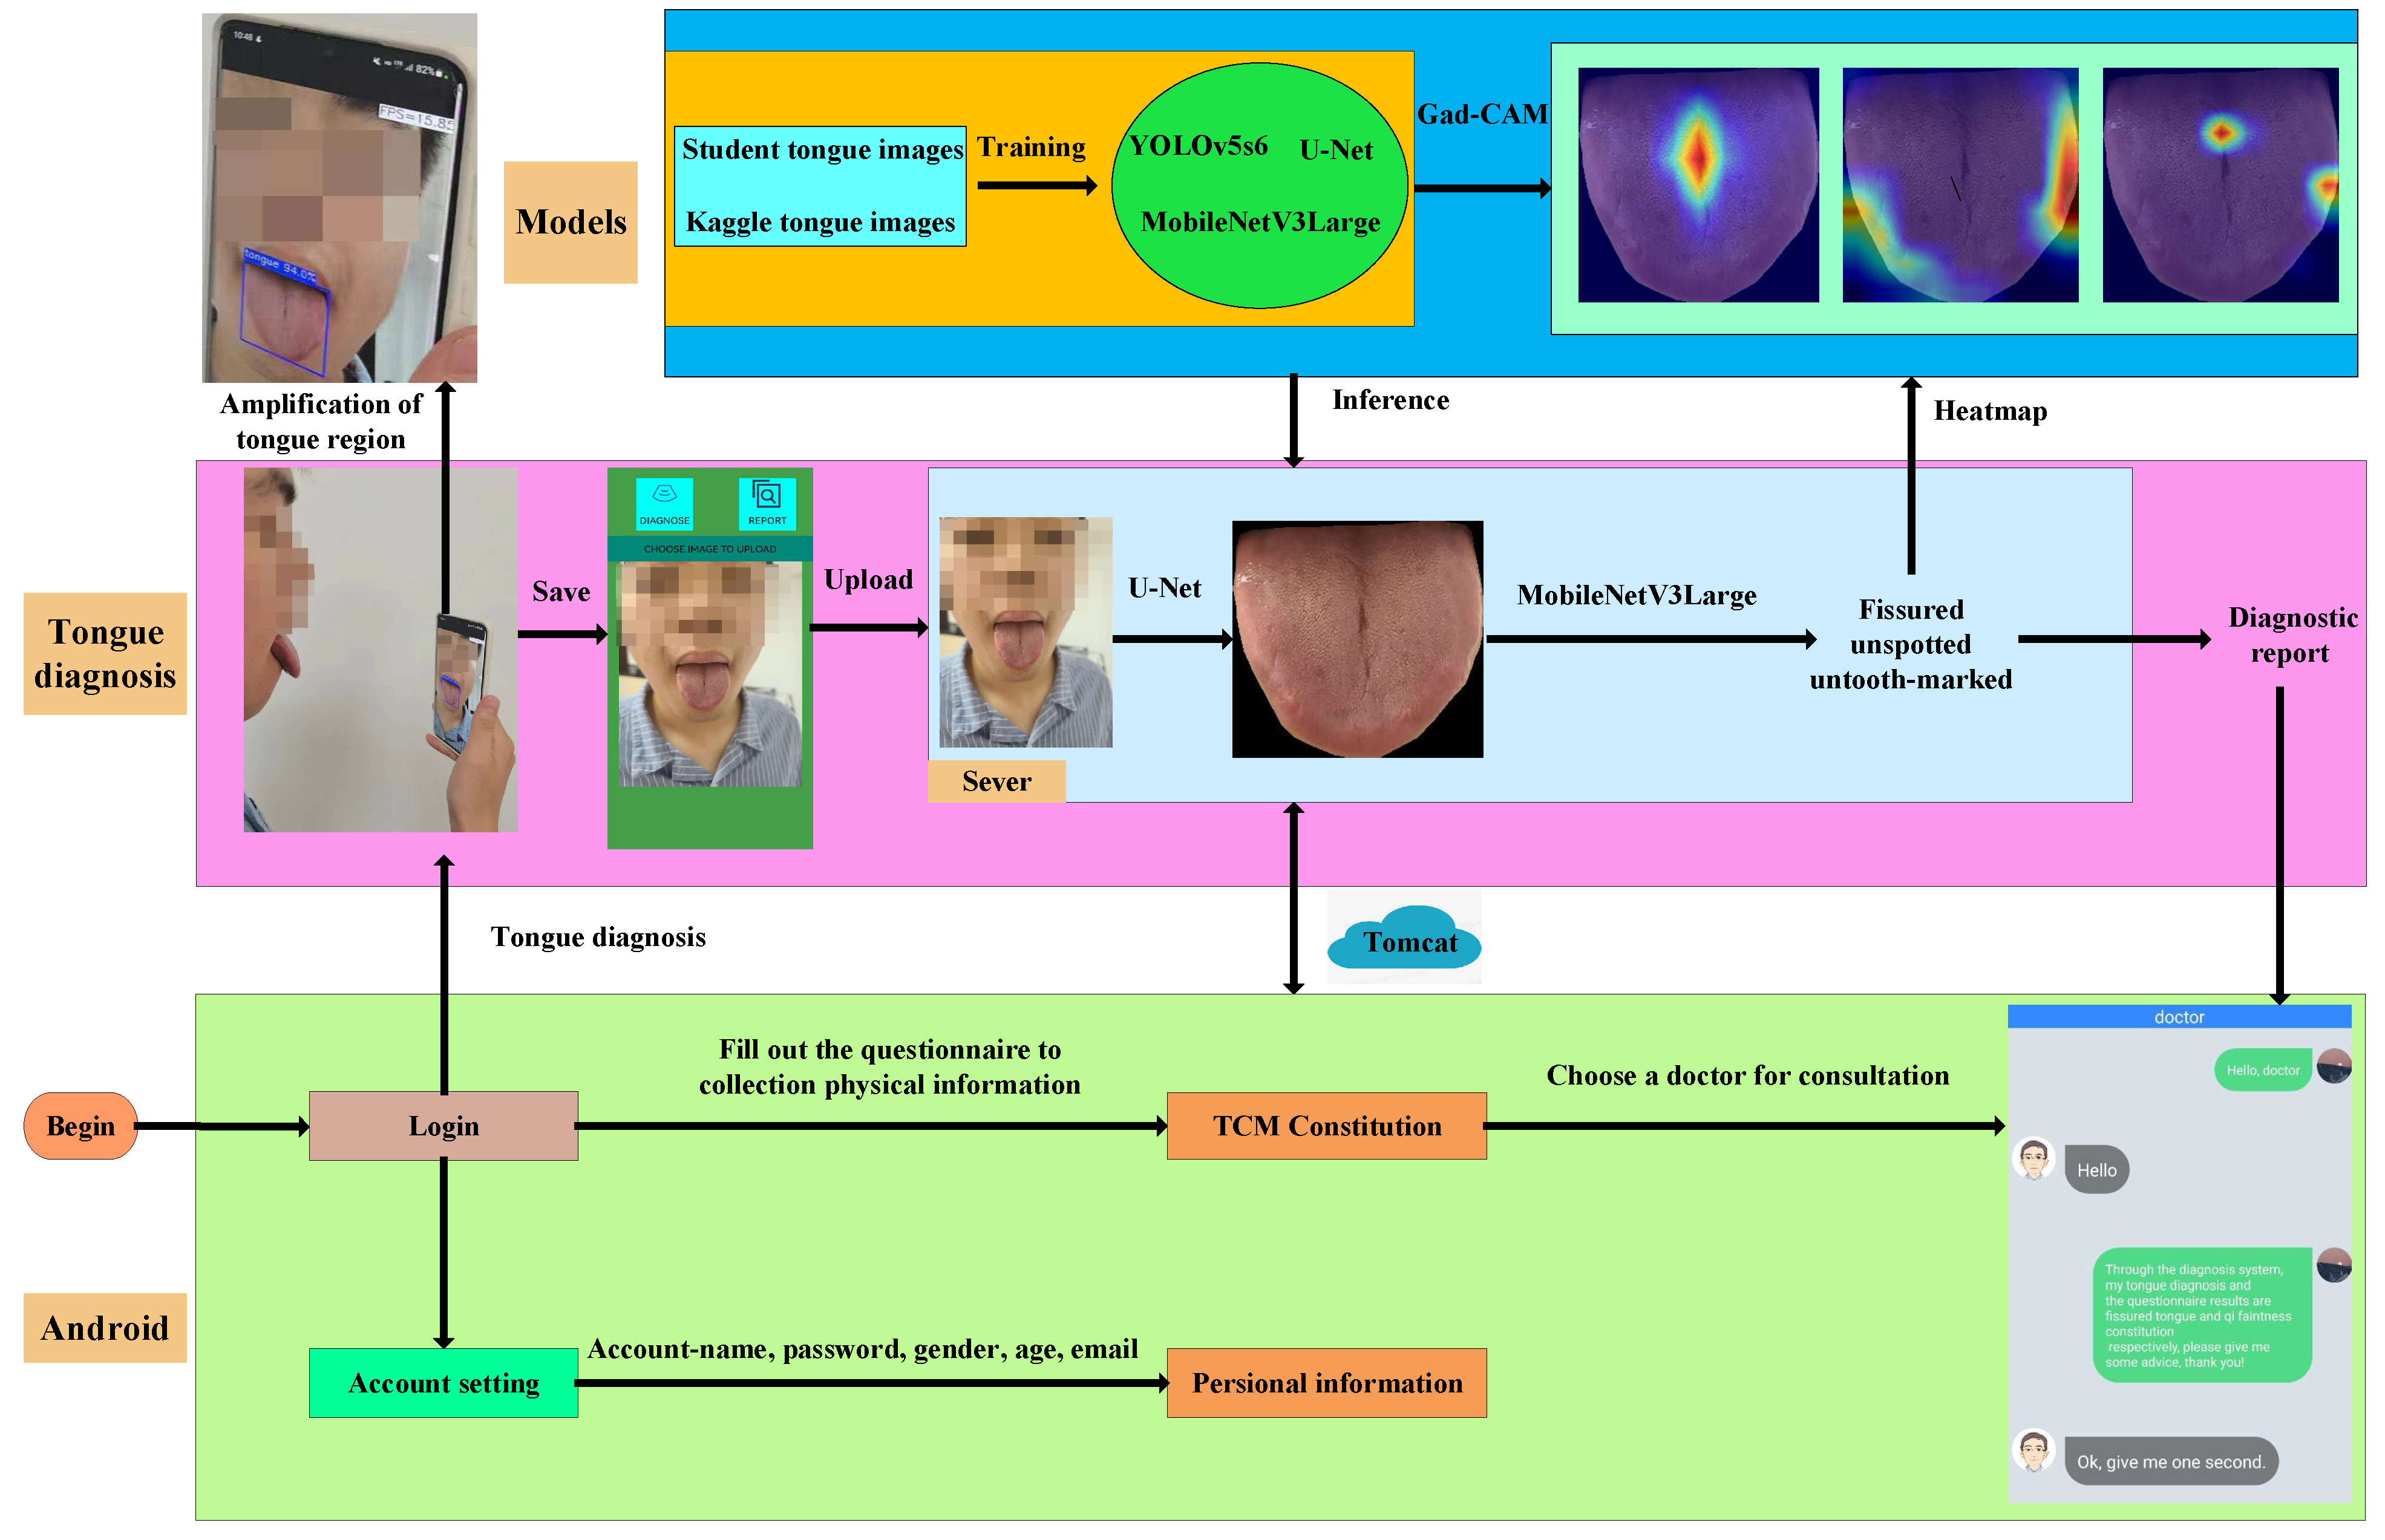
2.1. Architecture
2.2. Basic Modules
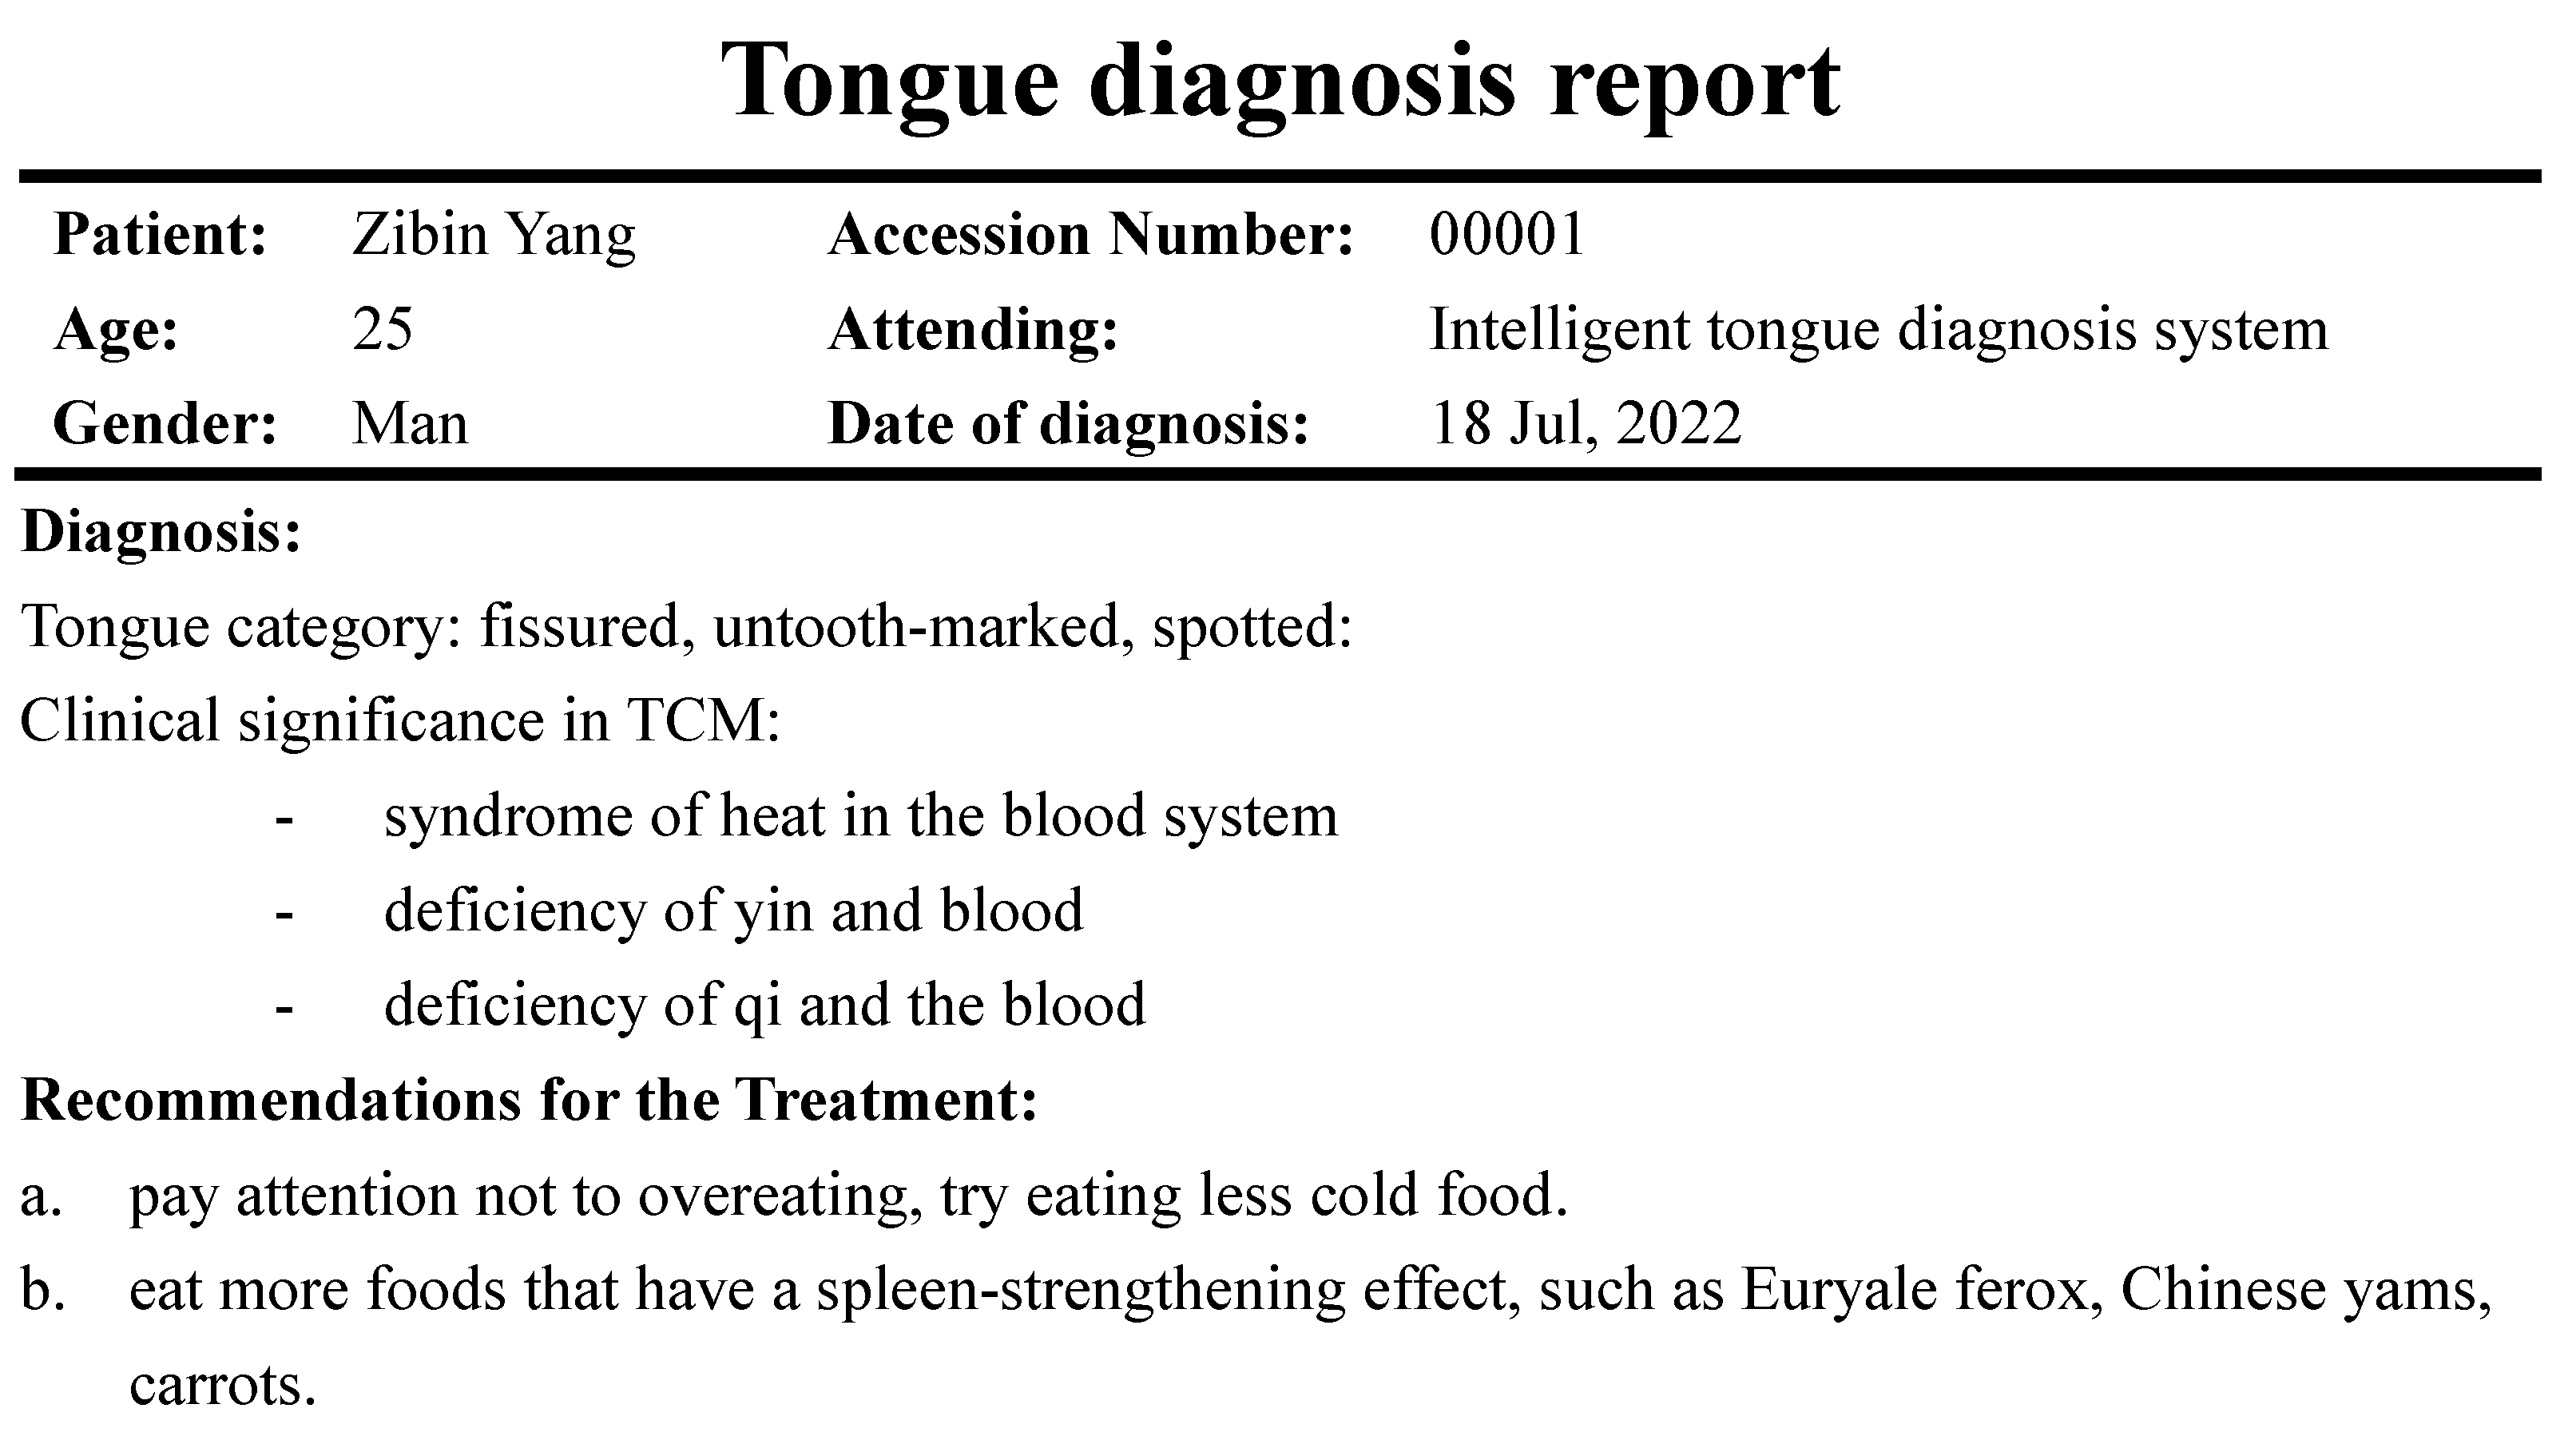
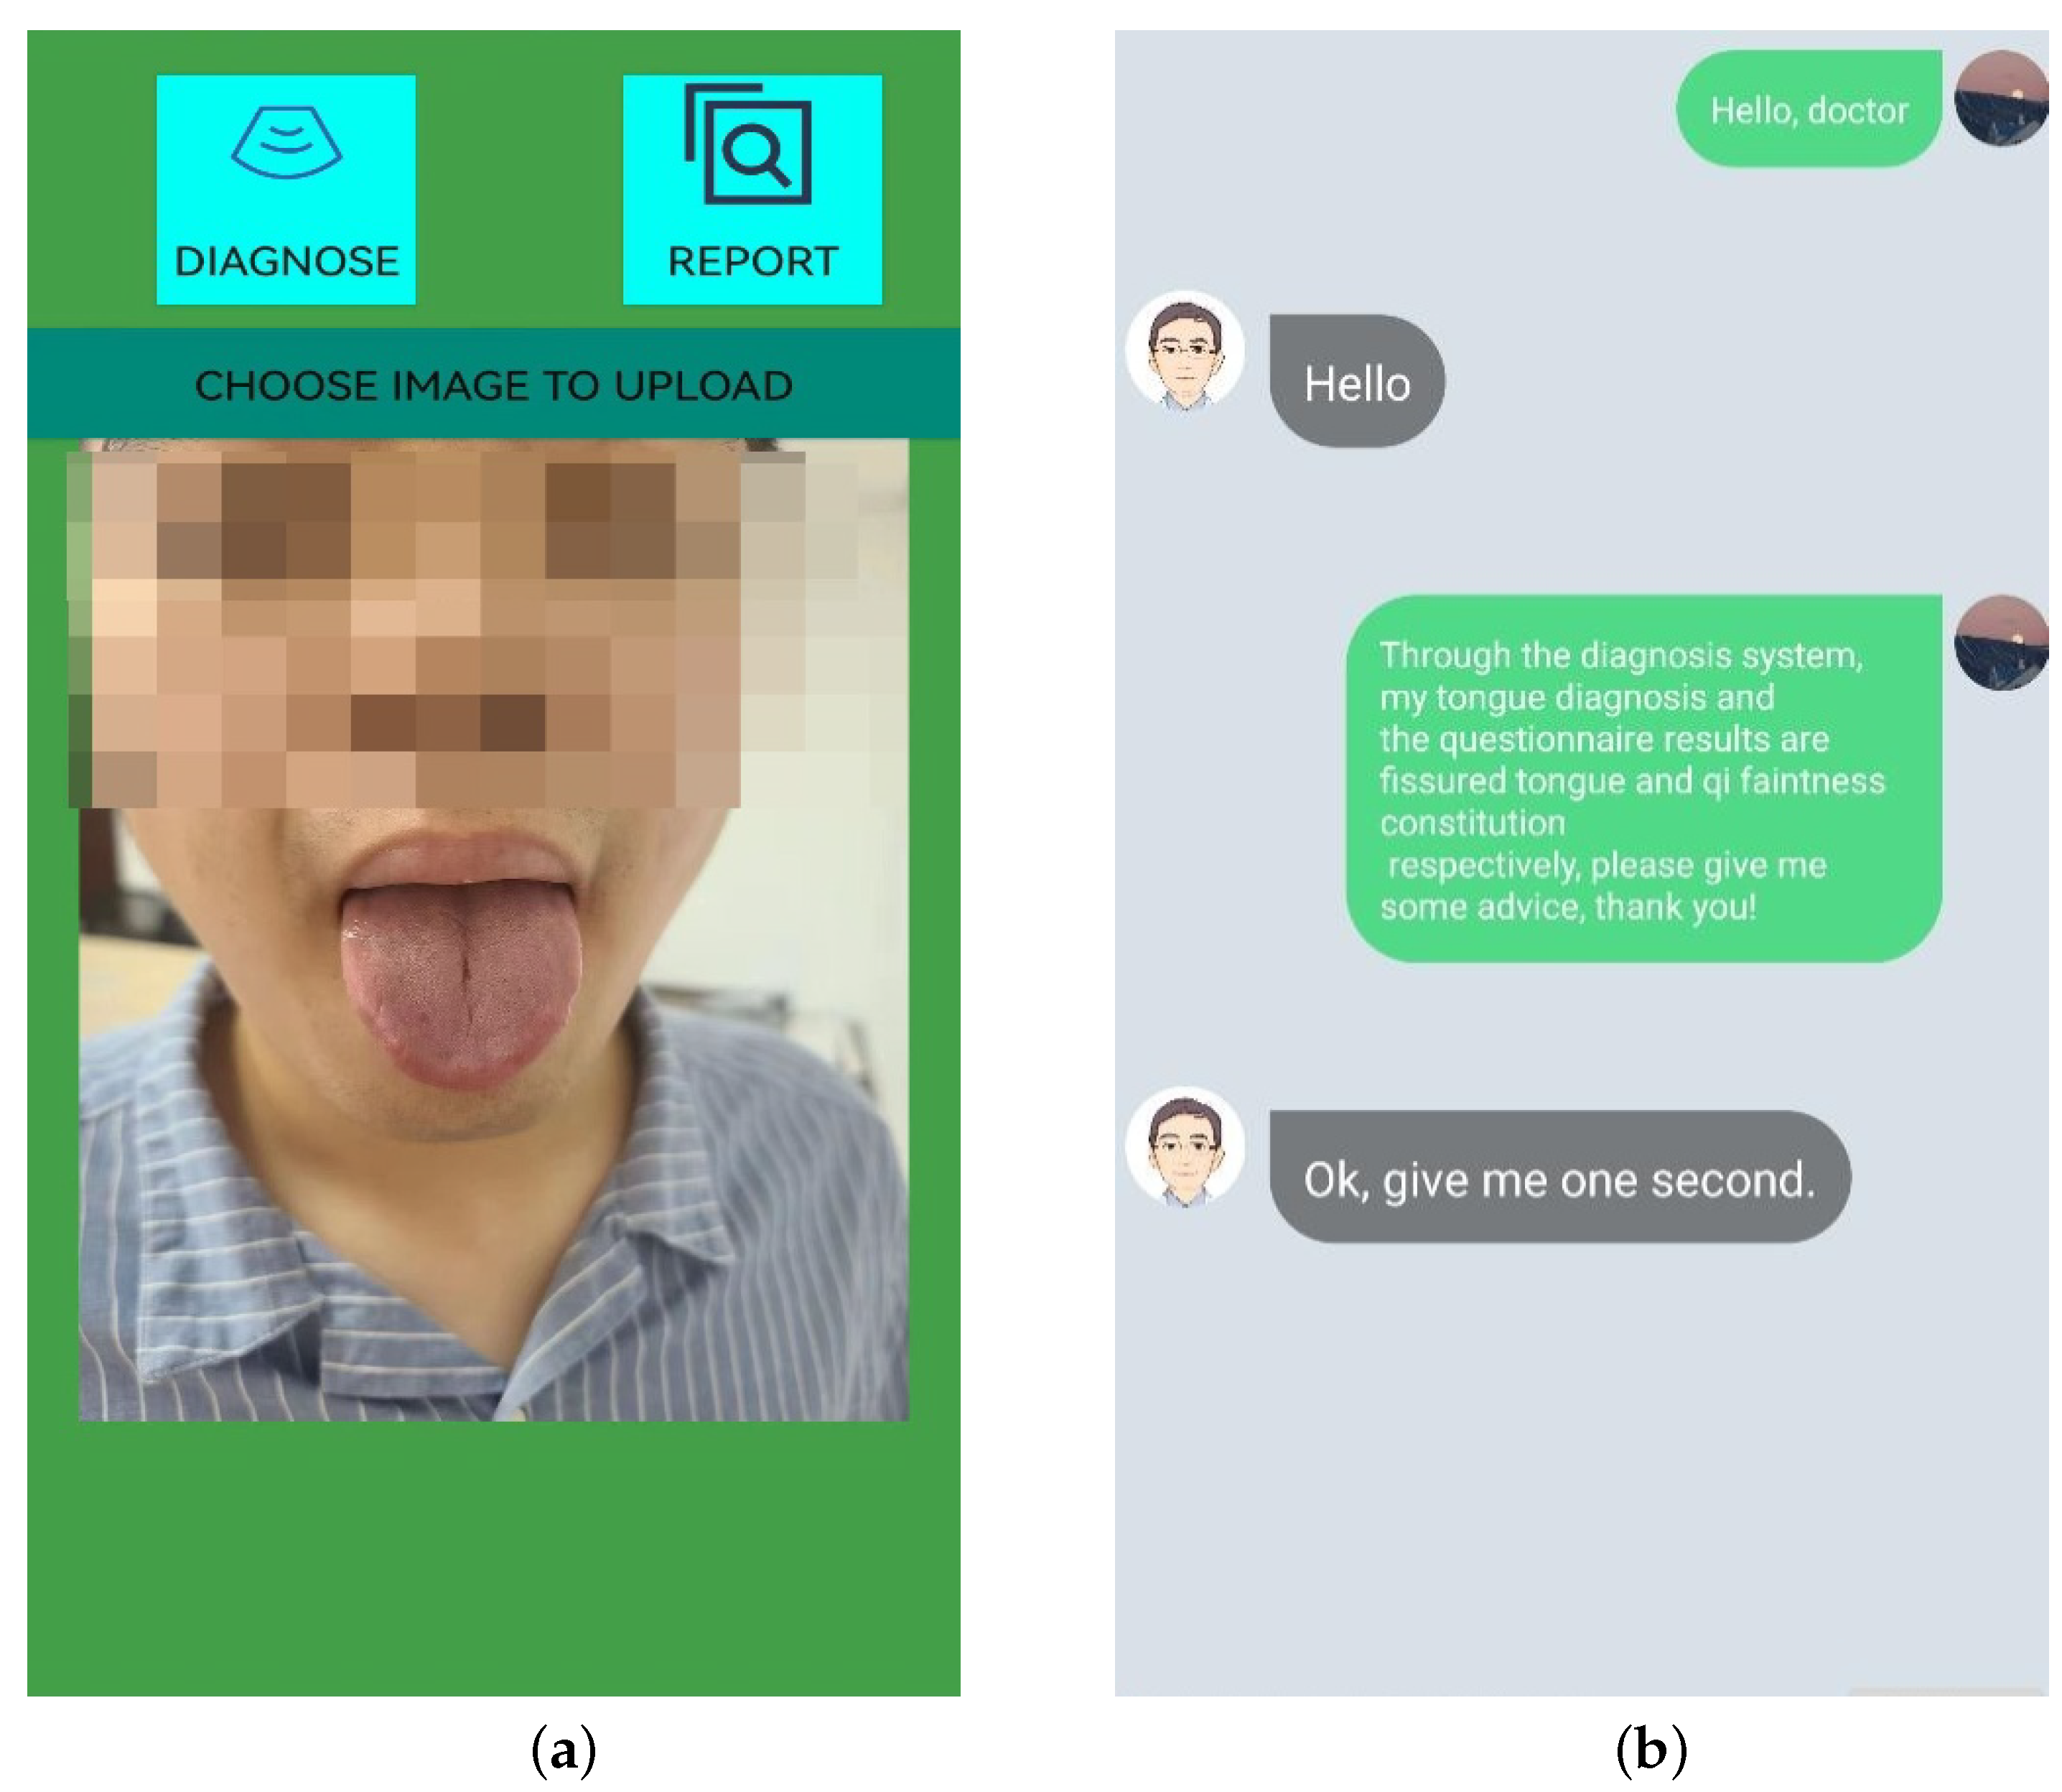
2.3. Diagnosis Process
2.4. More Physical Information and “Asking Doctors”
3. Tongue Processing Framework
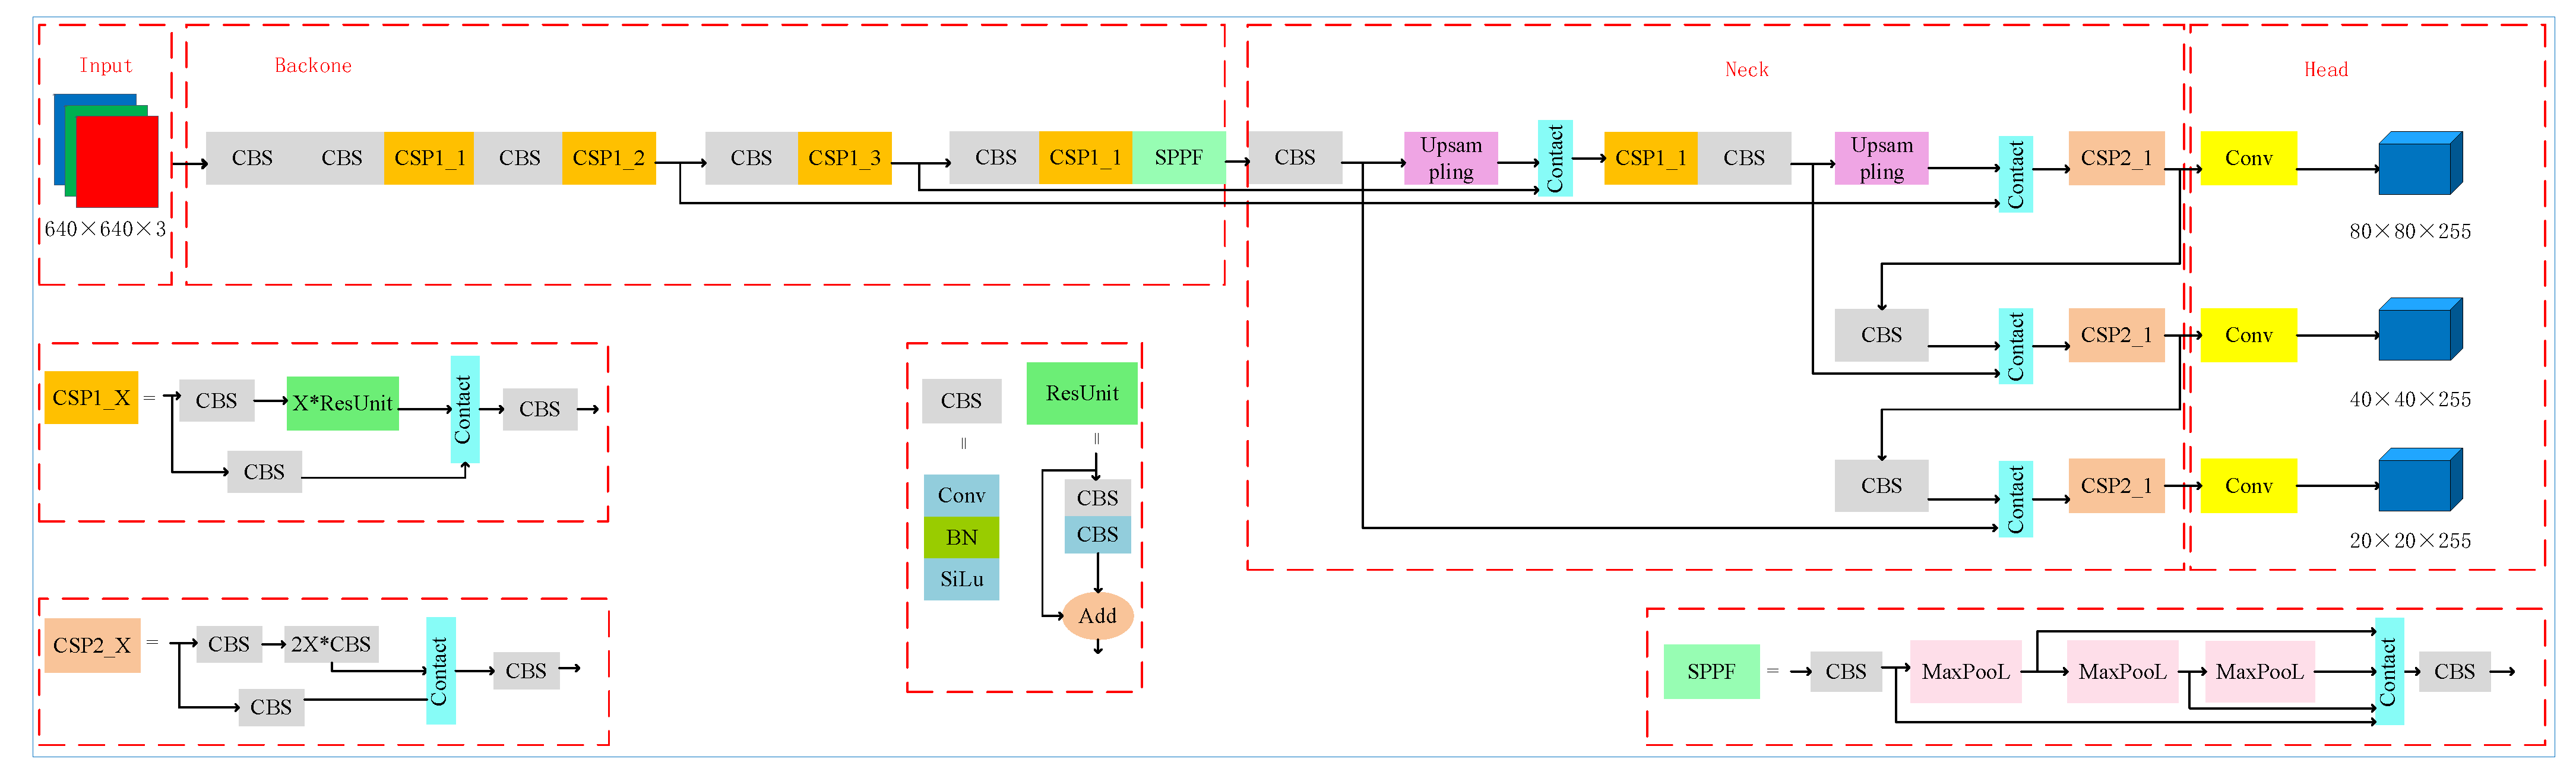
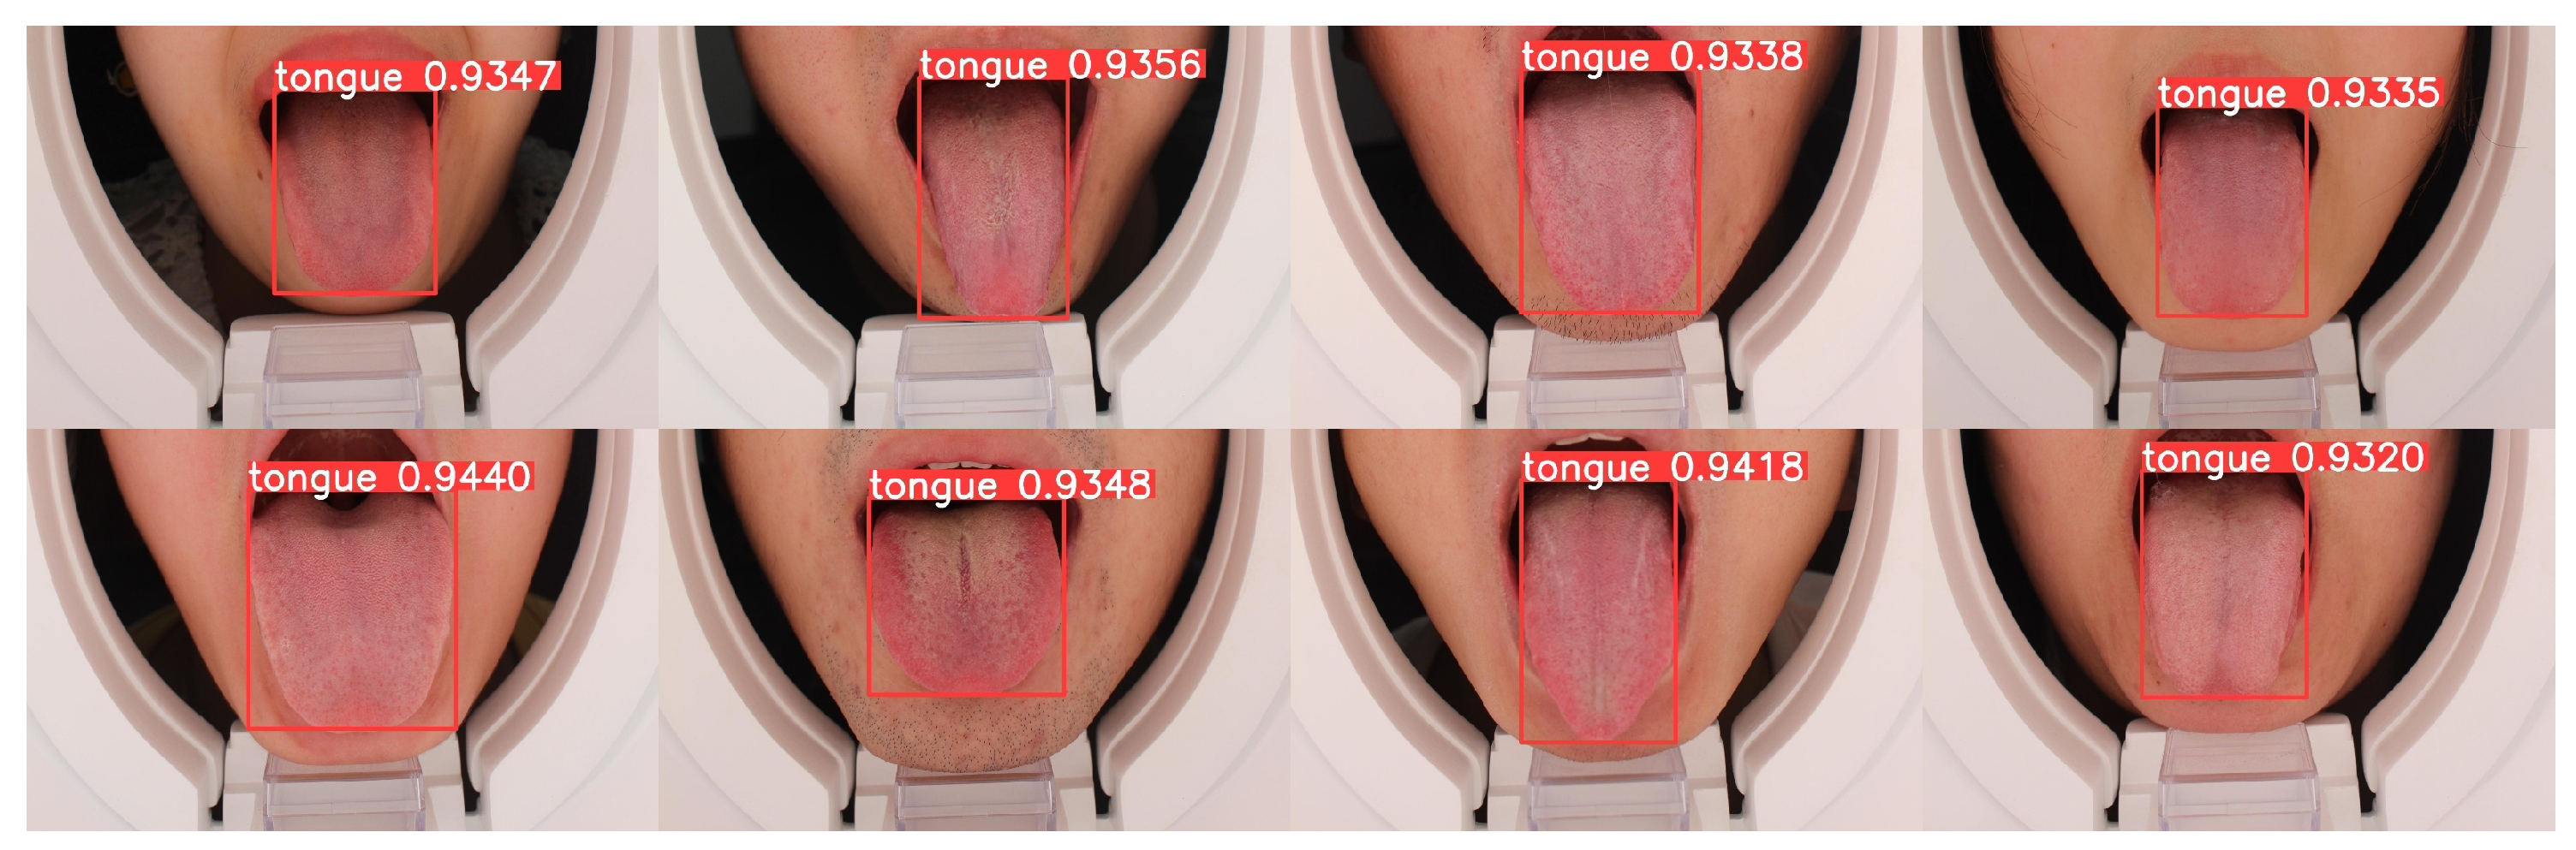
3.1. Tongue Detection
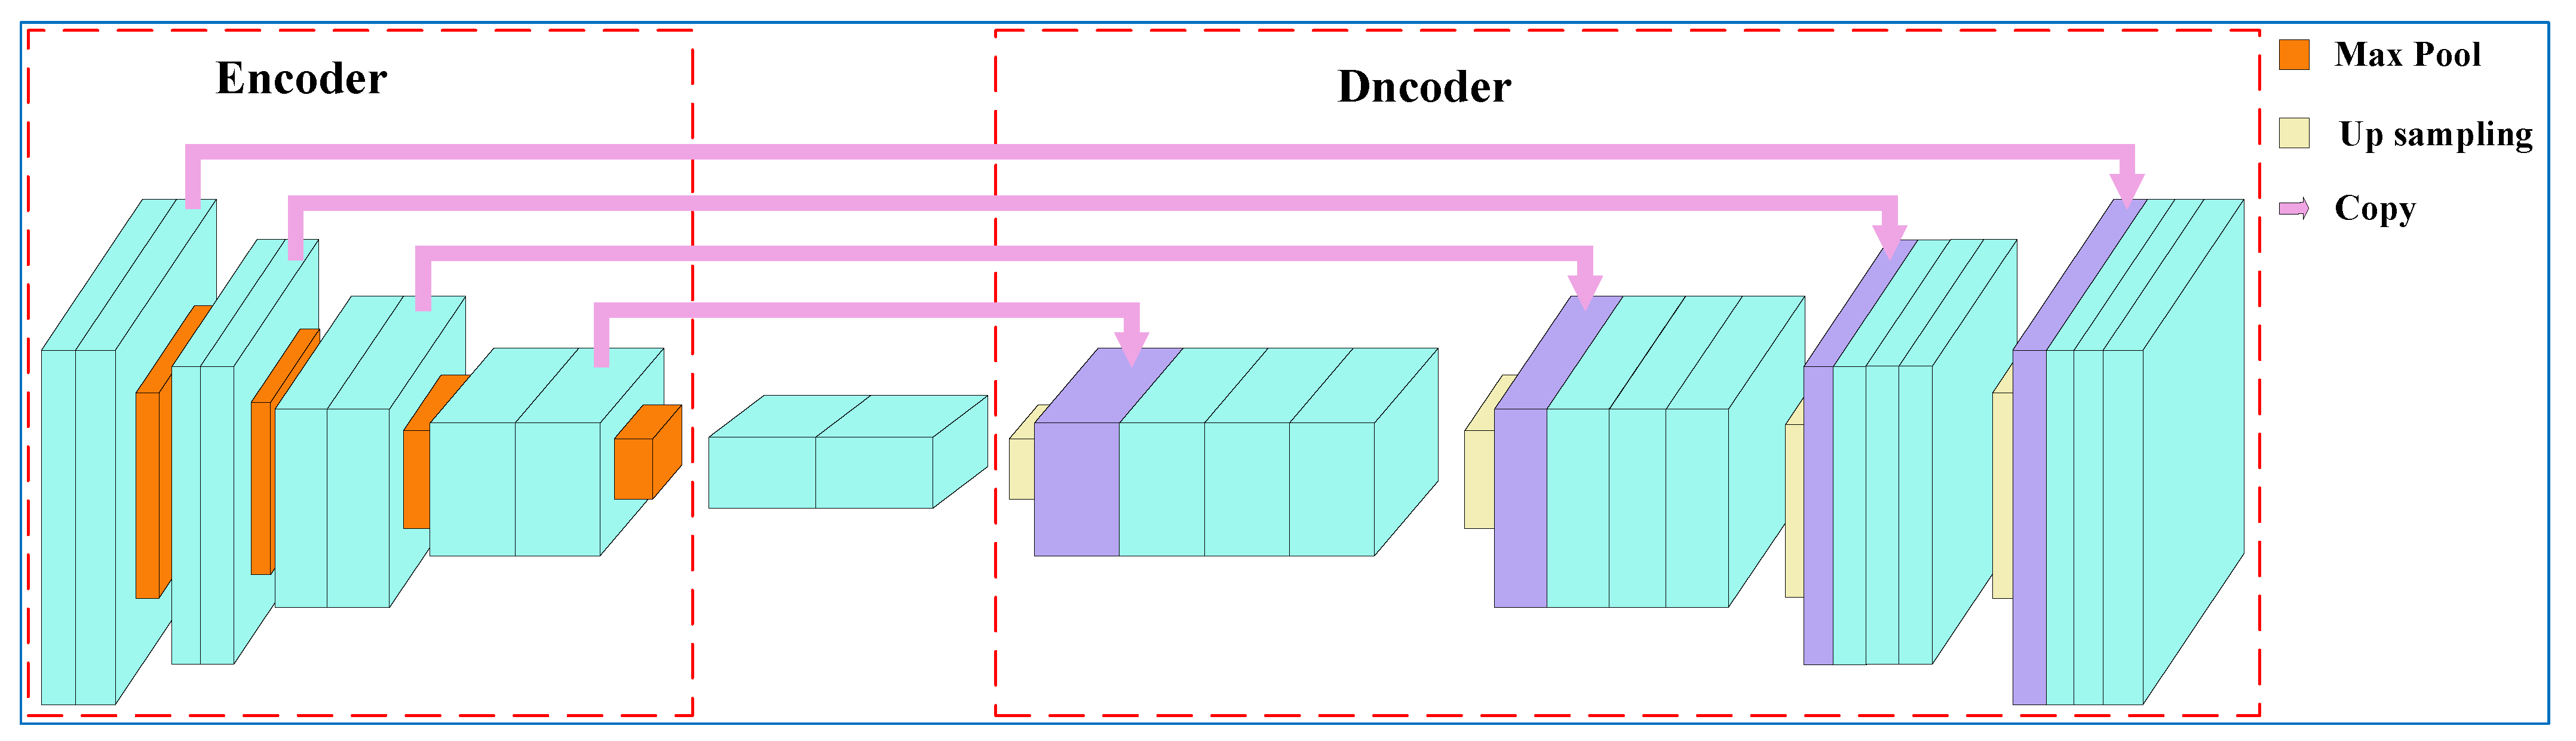
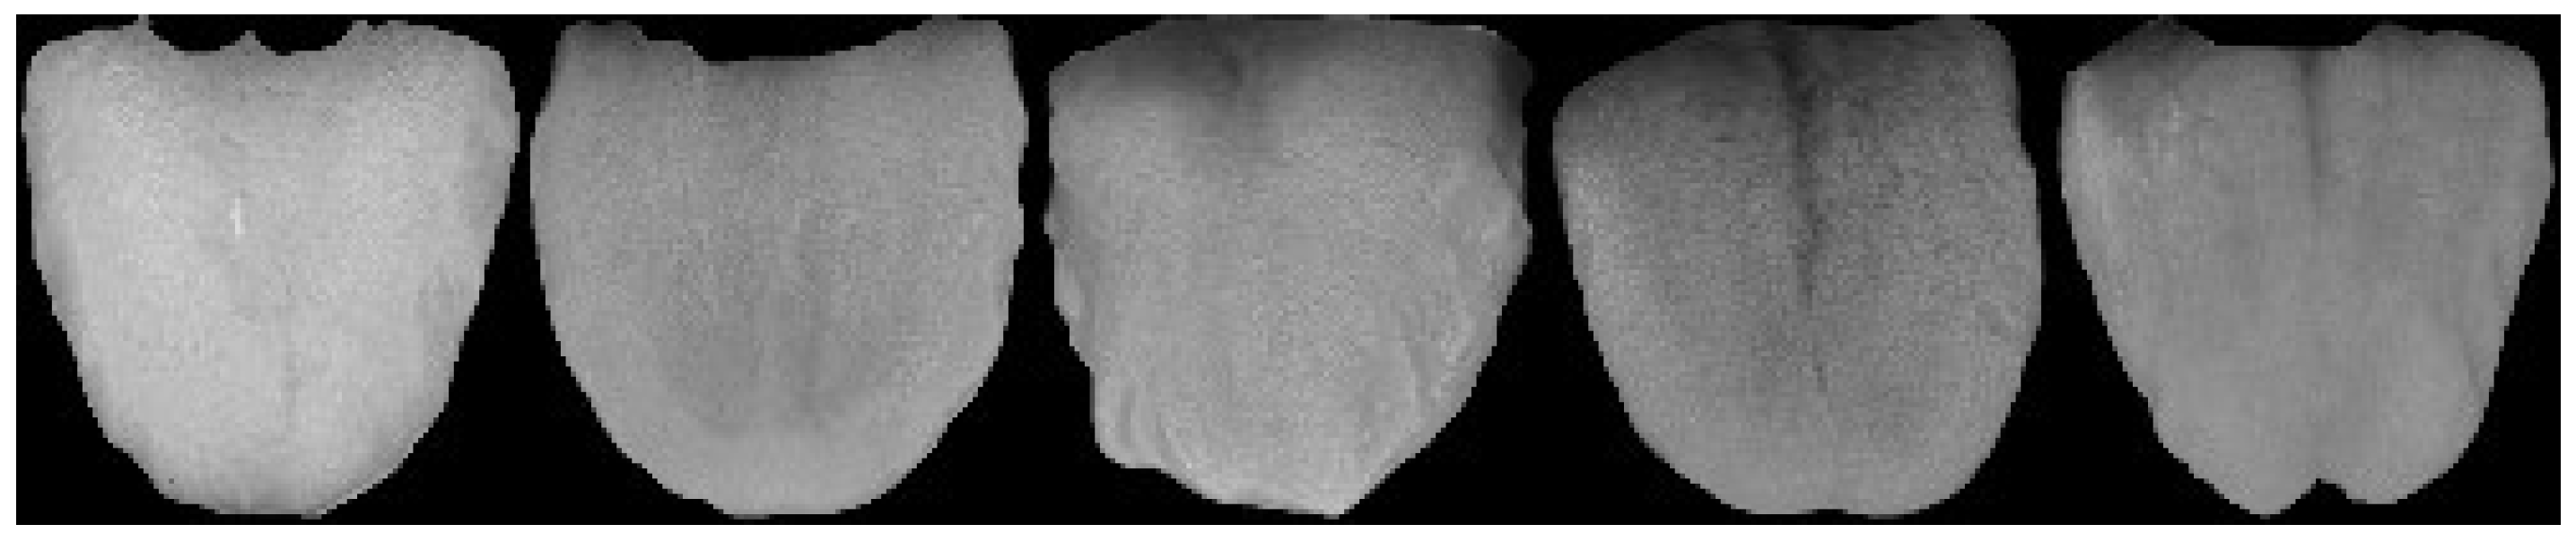
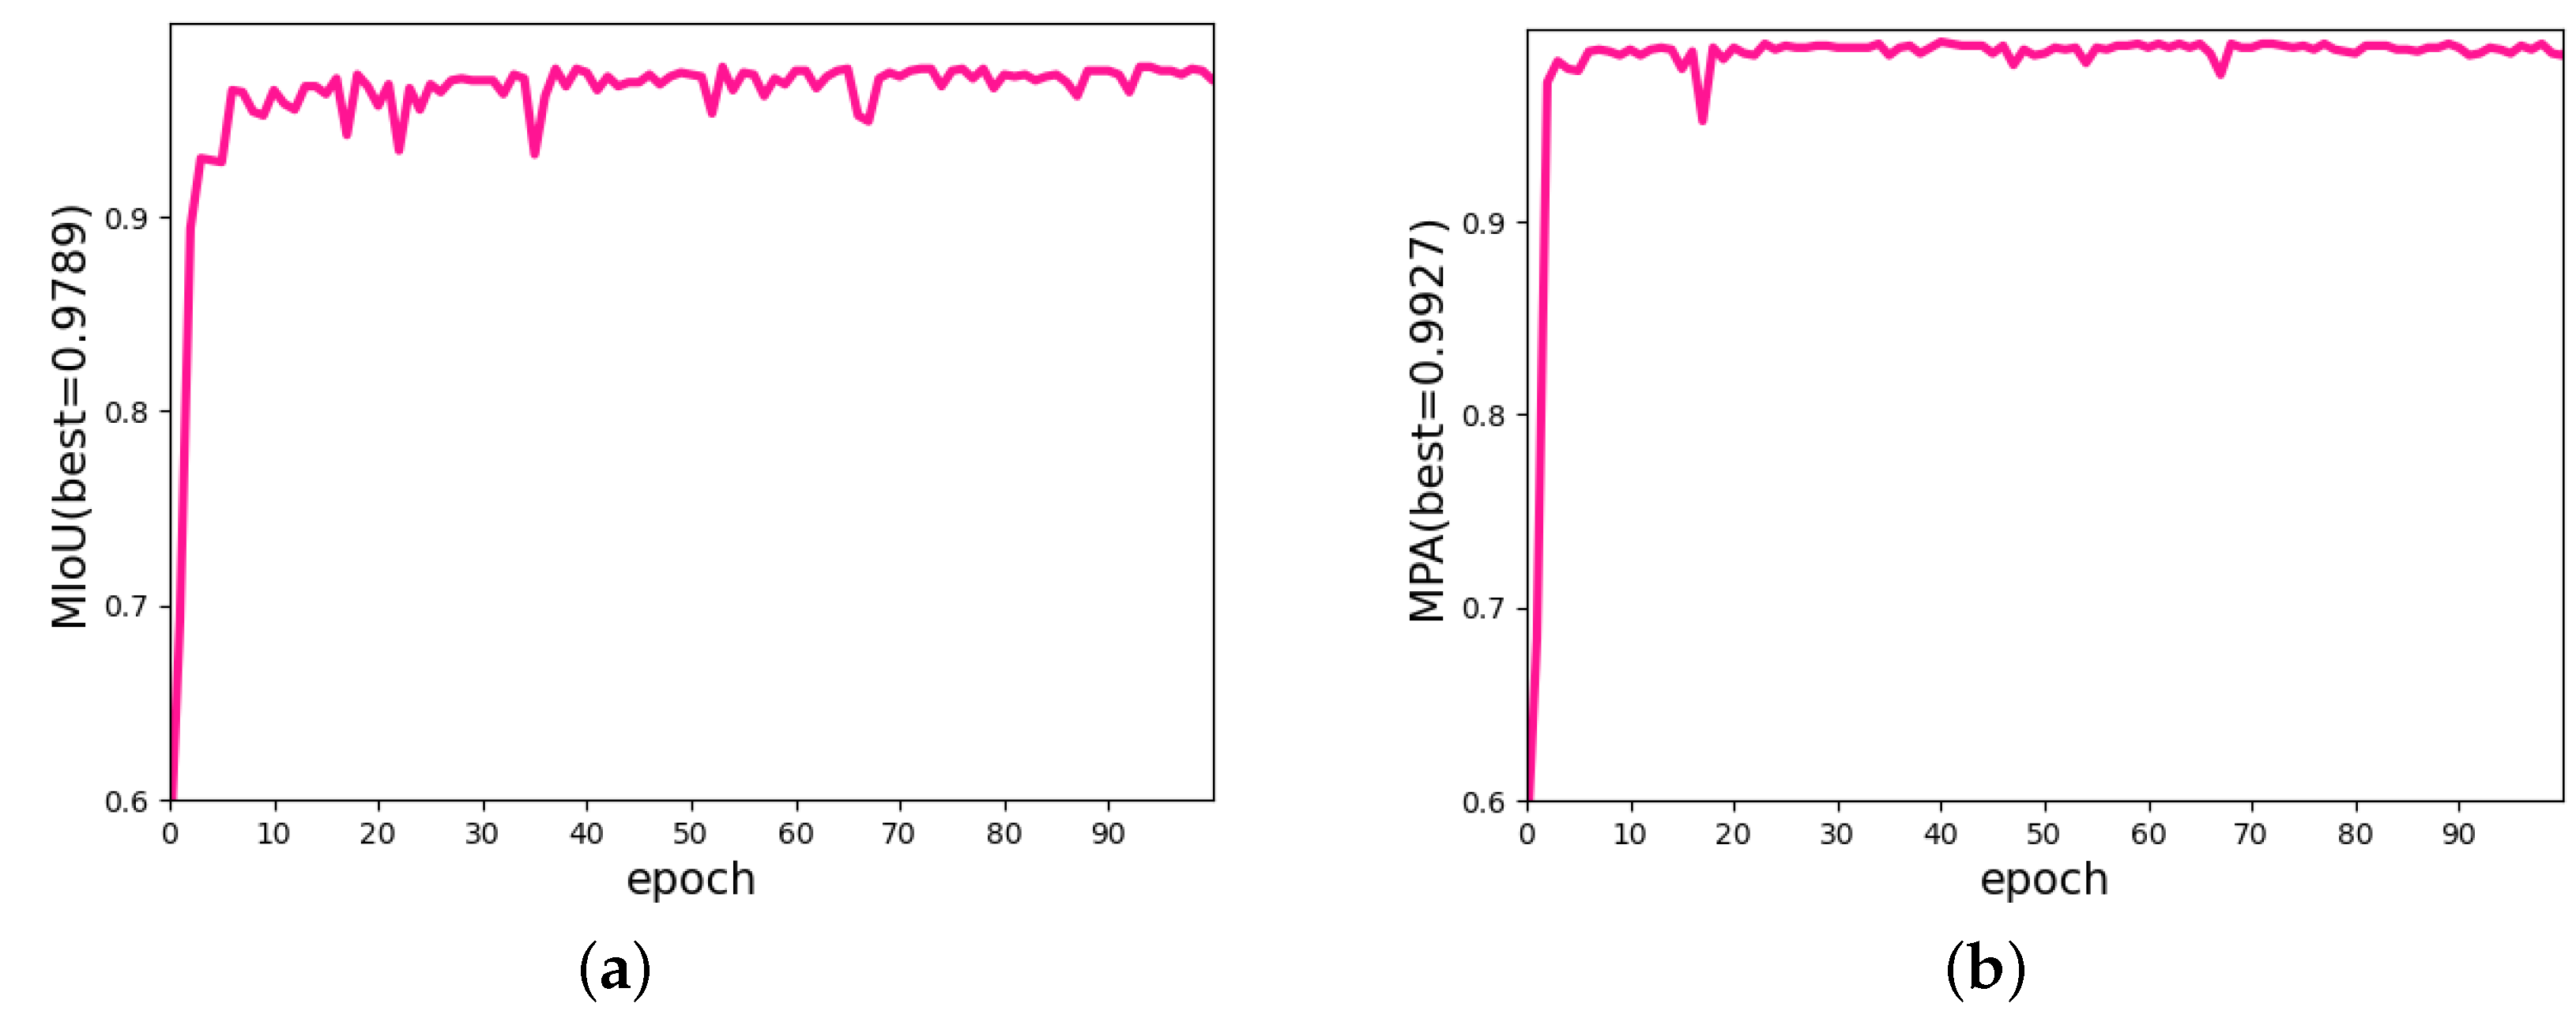
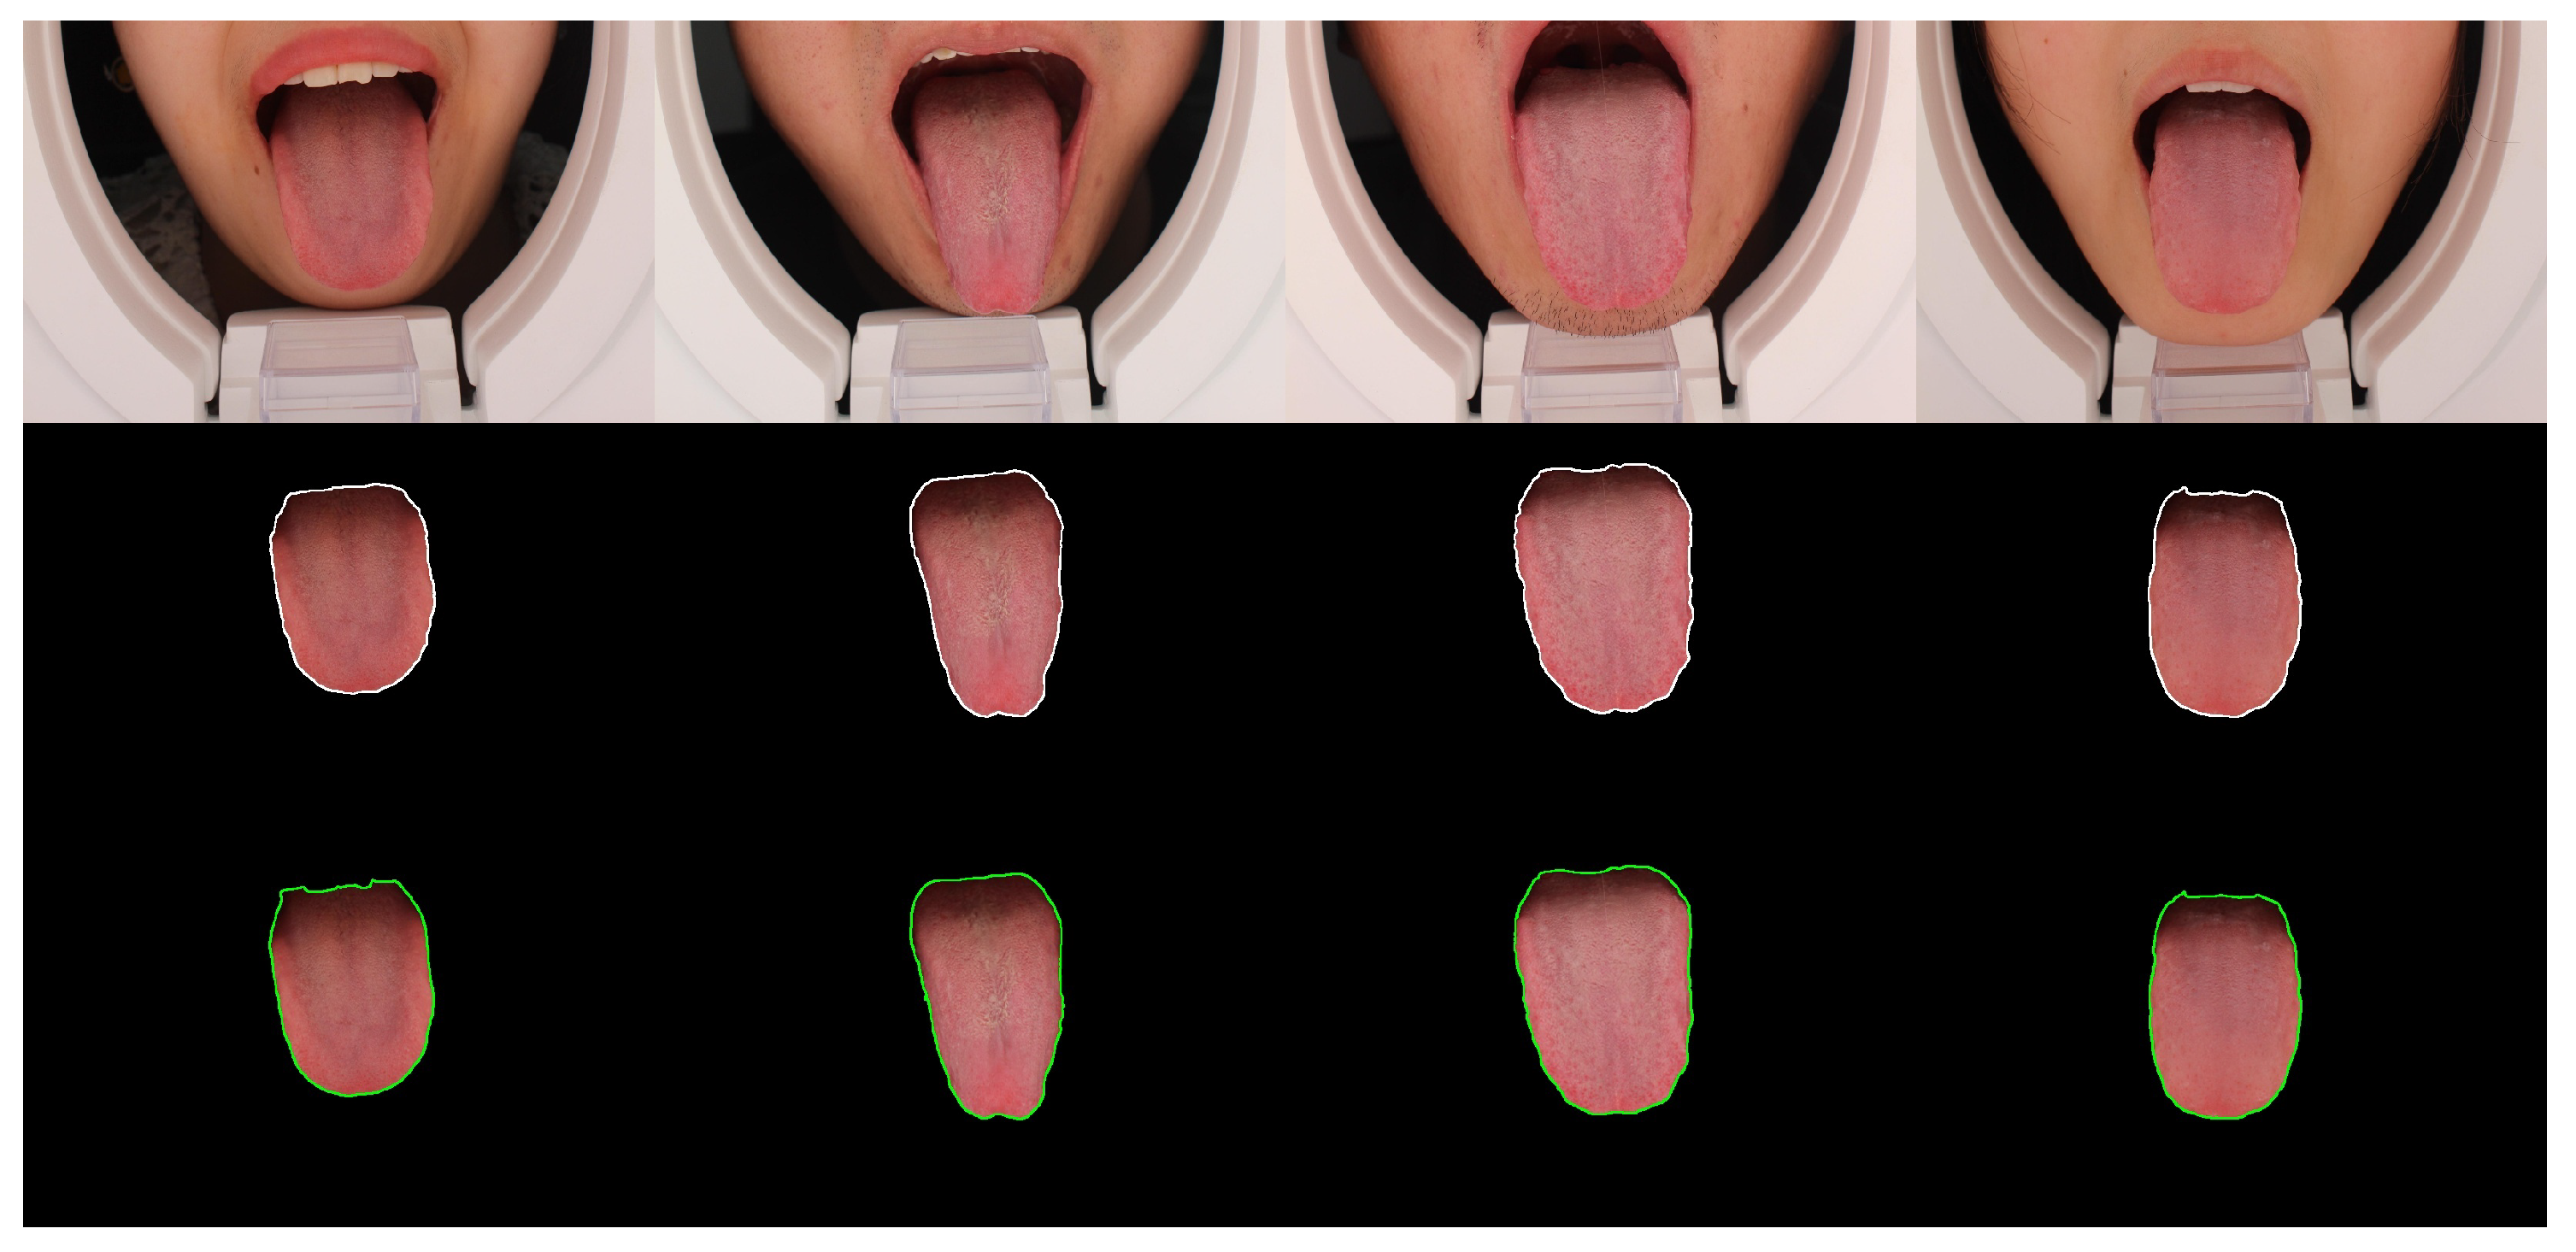
3.2. Tongue Region Segmentation
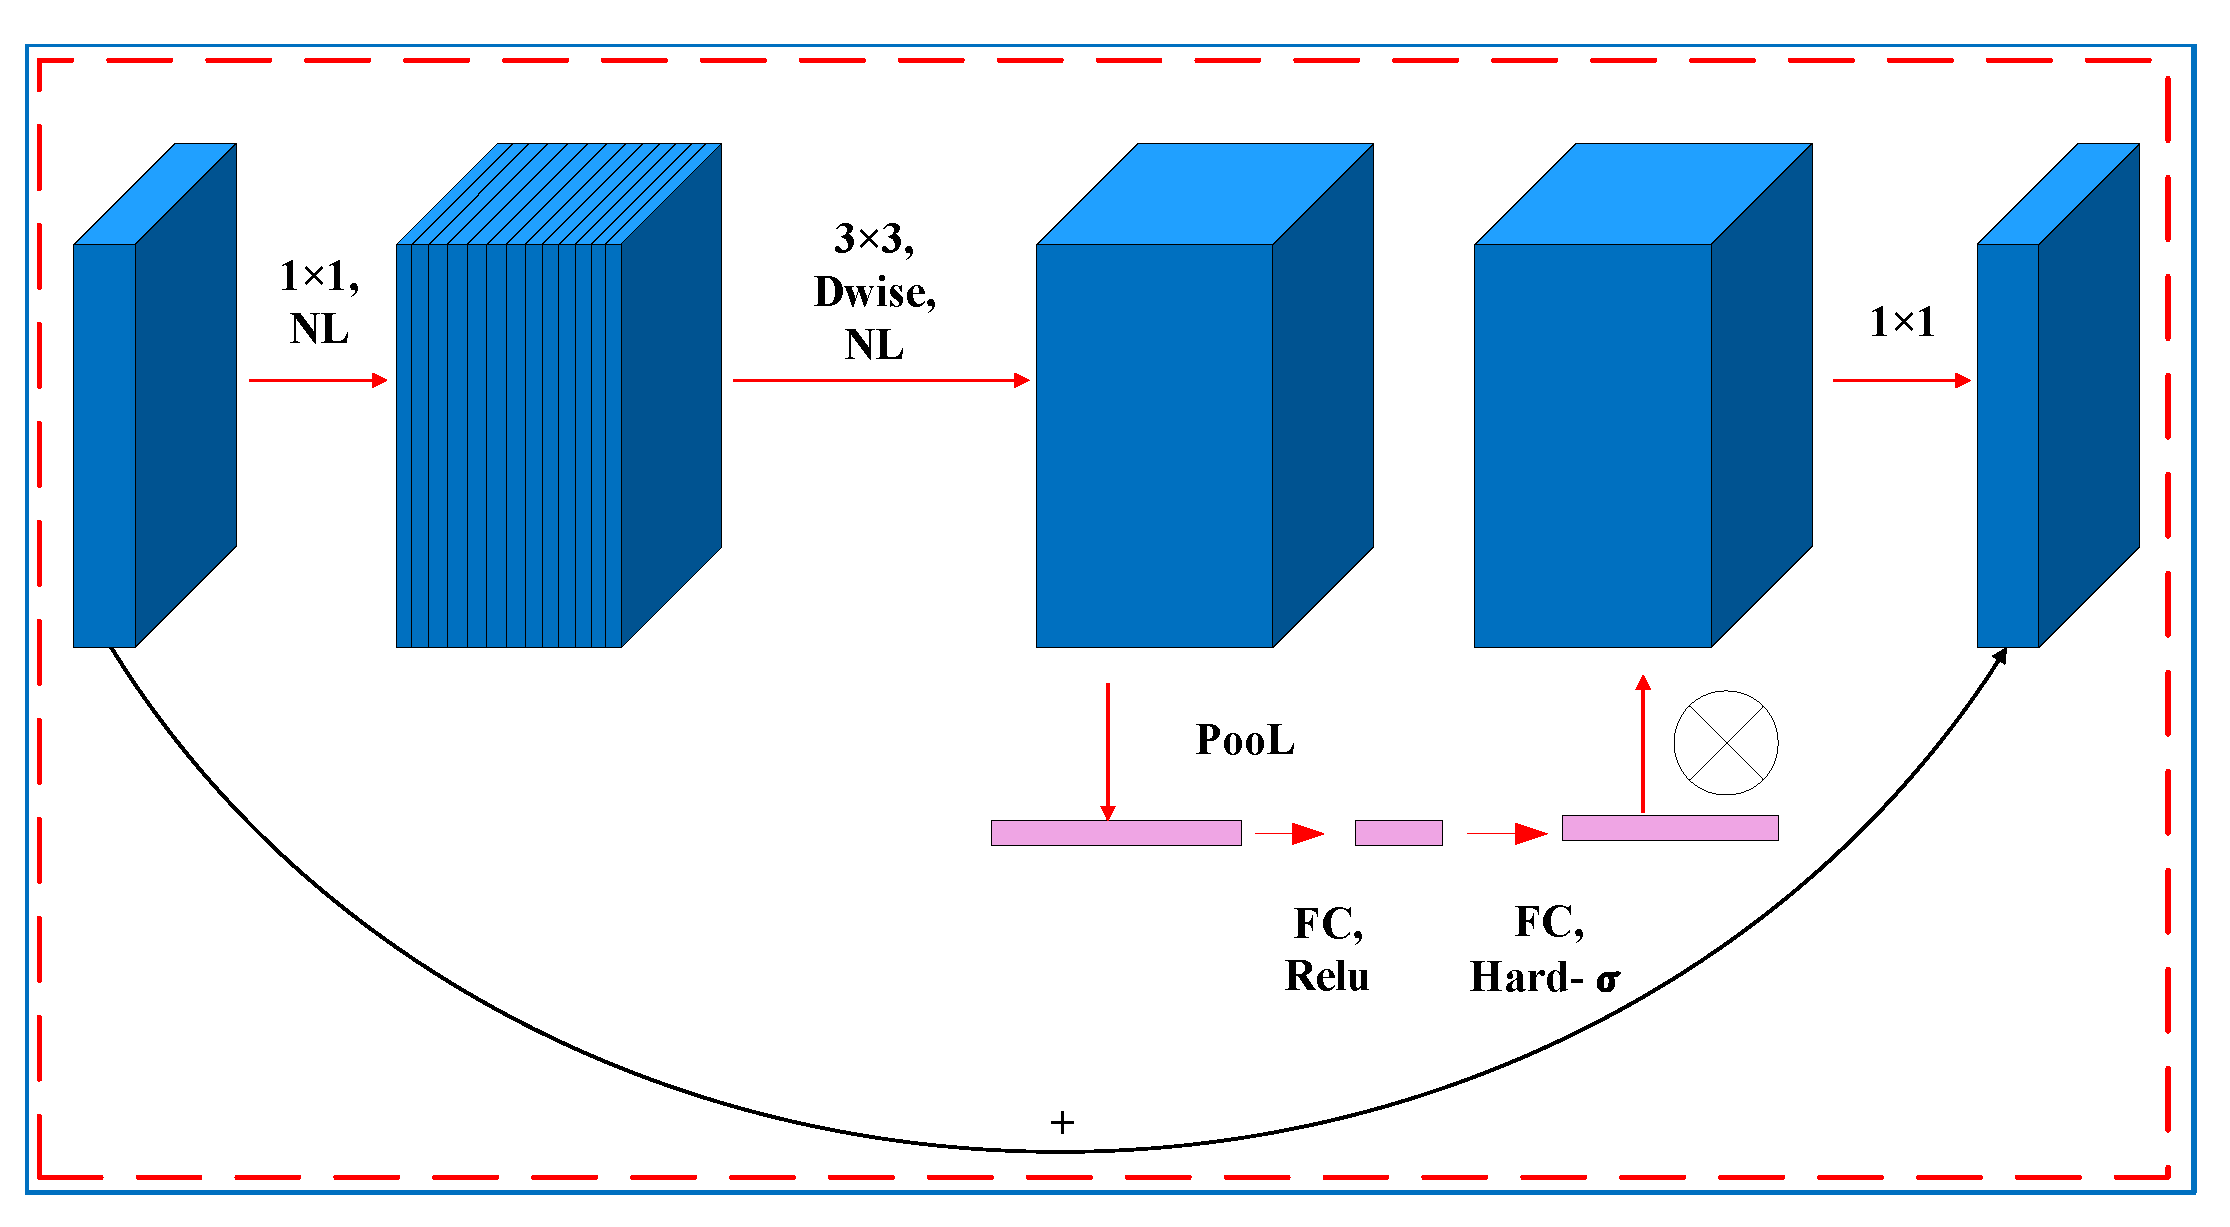
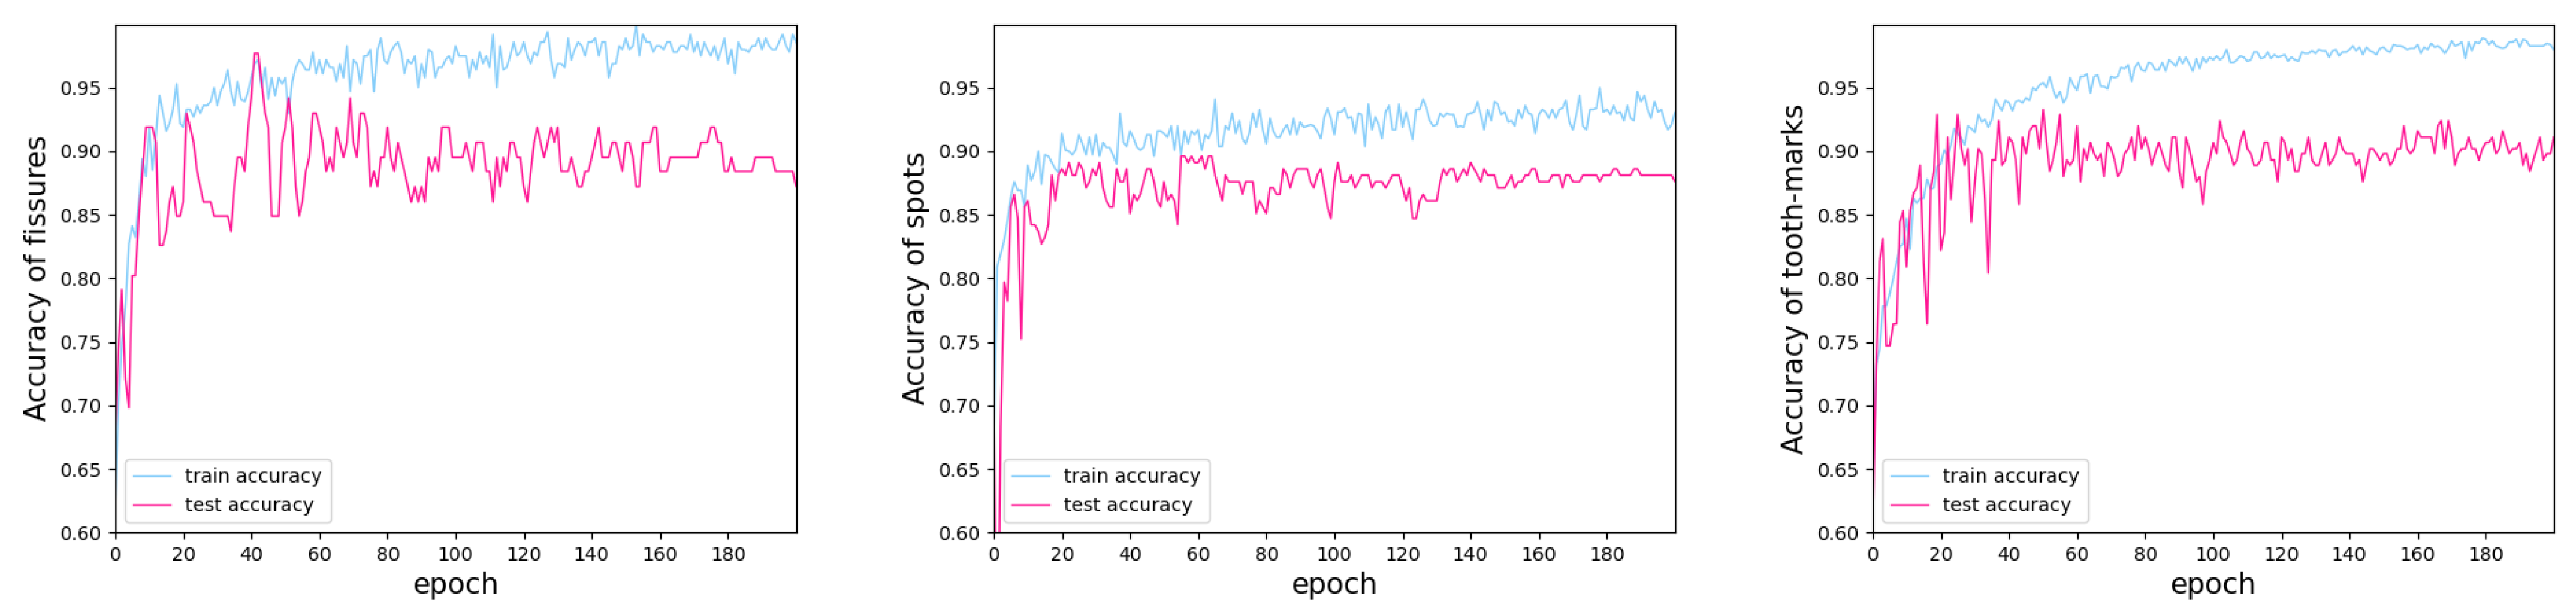
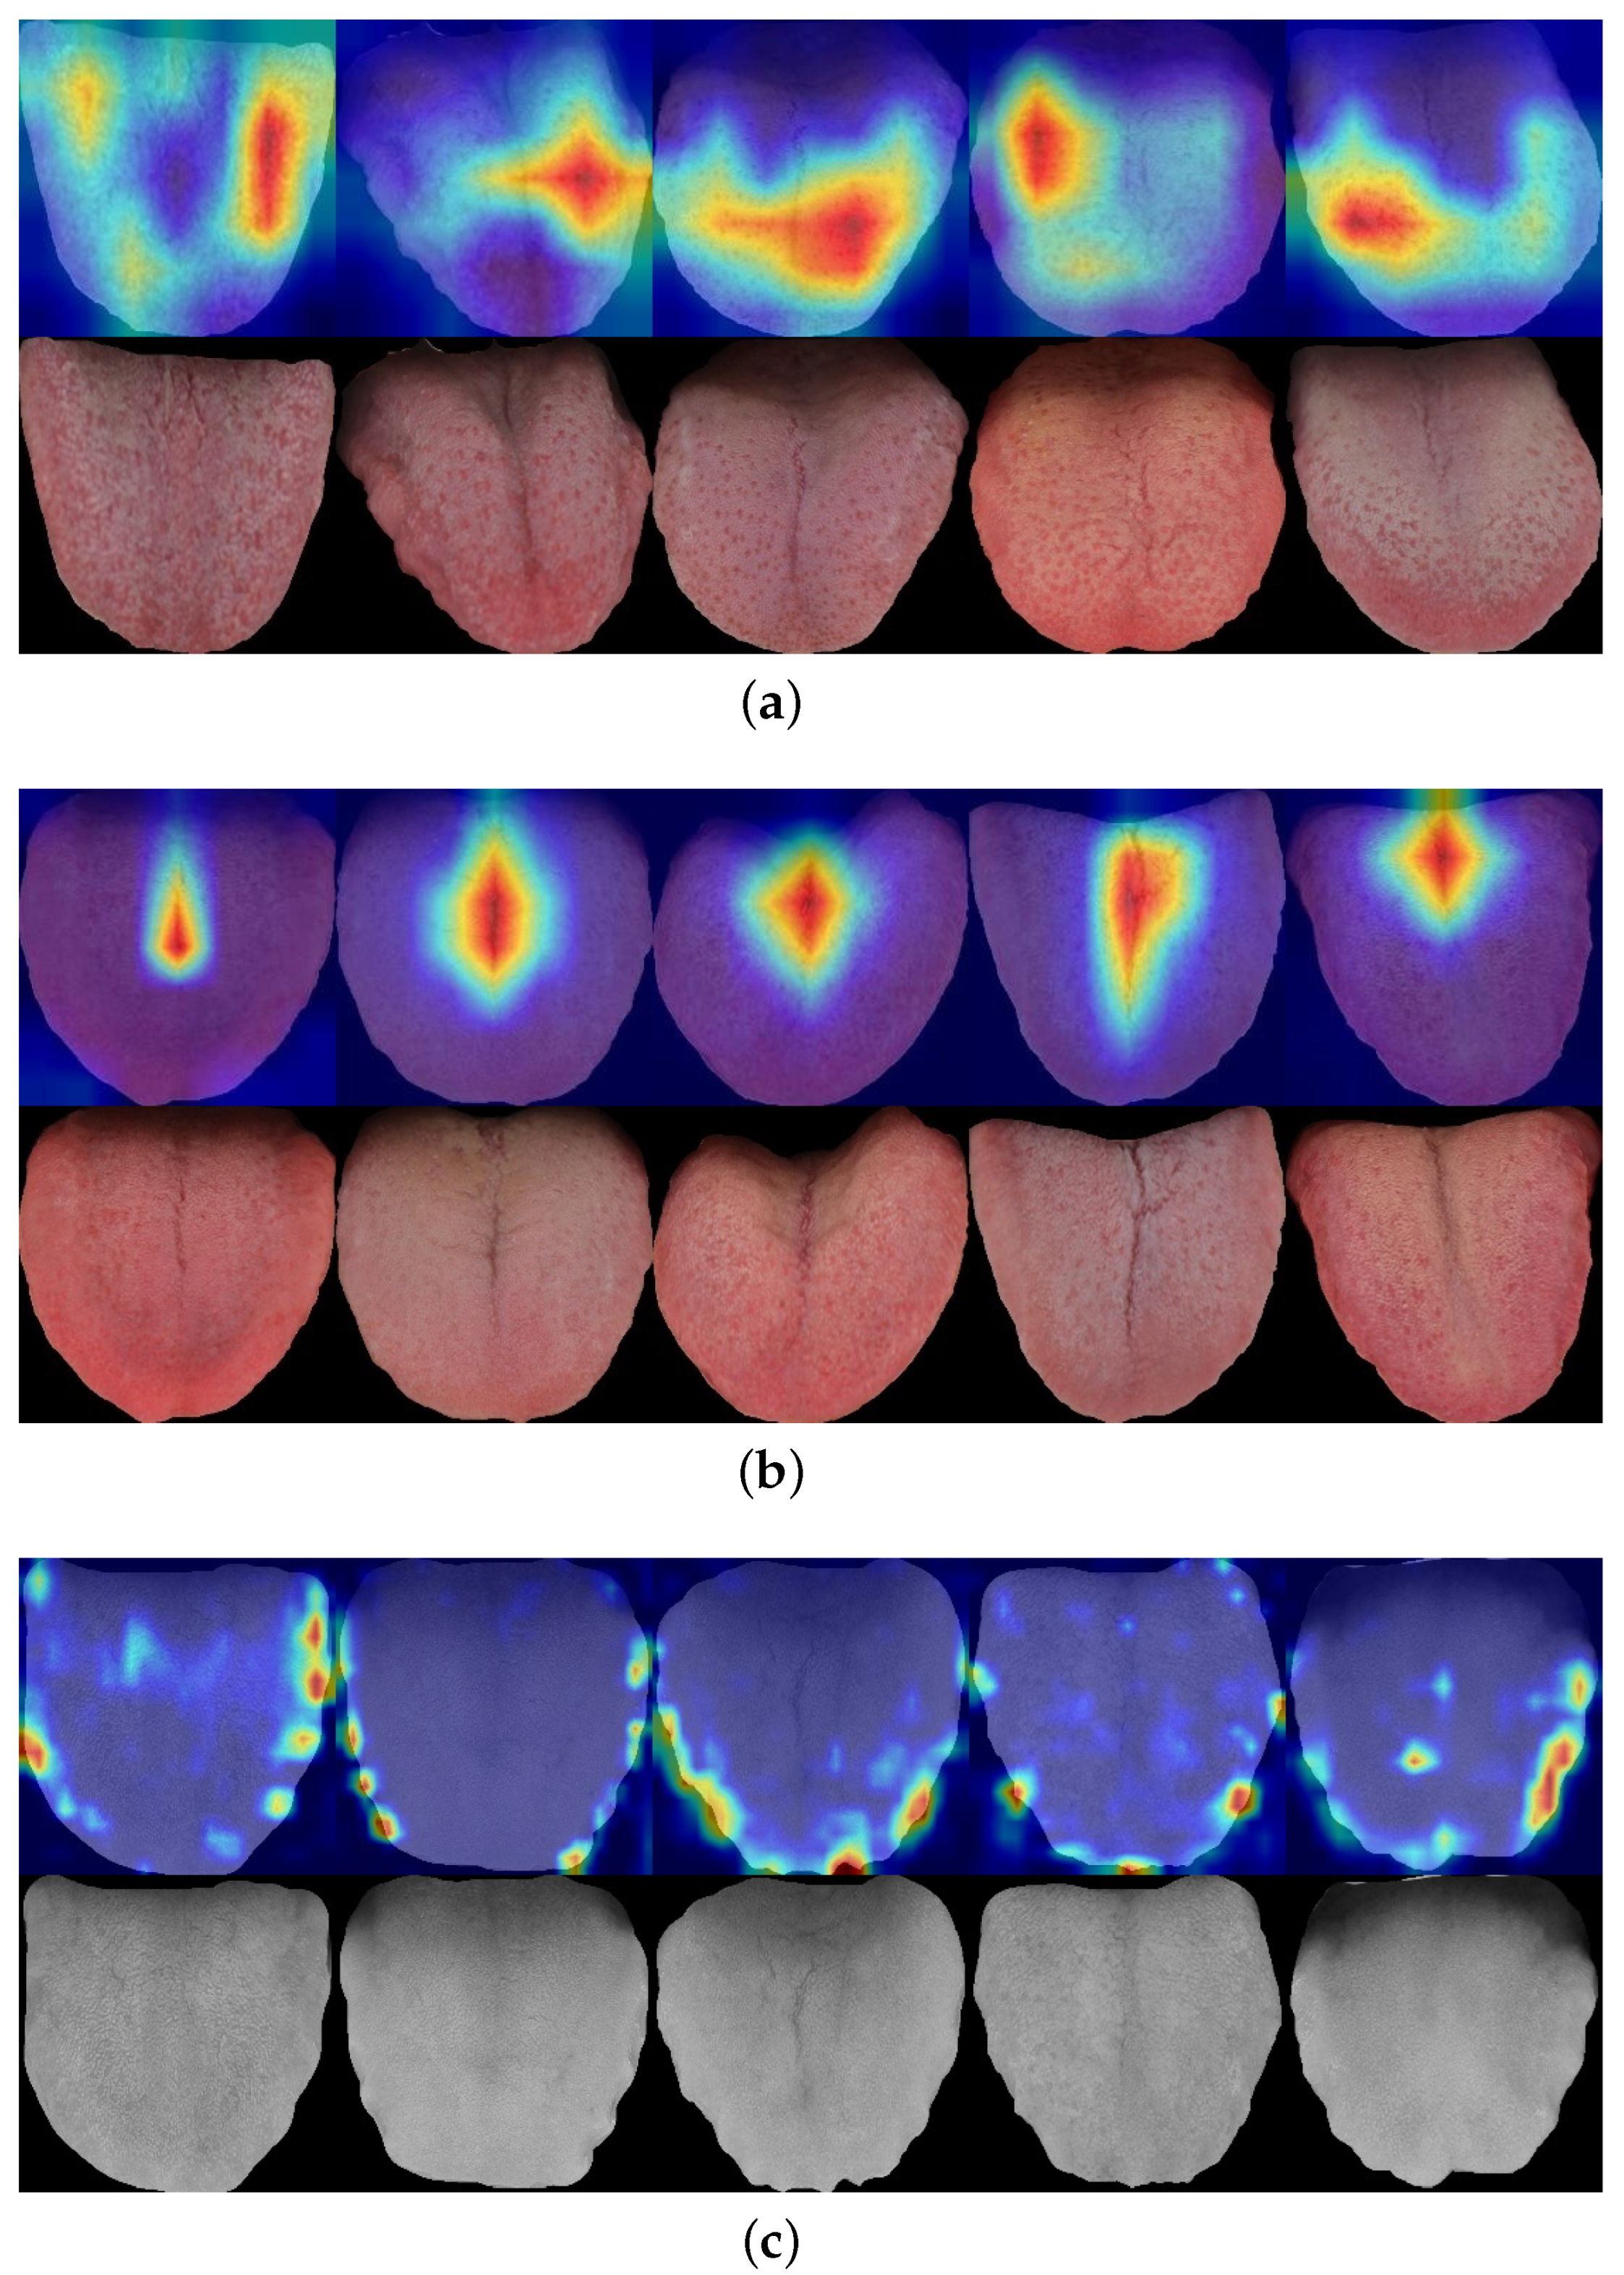
3.3. Tongue Feature Classification
3.4. Evaluation Metrics
- TP: true positive, where the actual value is positive and the predicted value is also positive;
- FP: False positive, where the actual value is negative and prediction is also negative;
- FN: false negative, where the actual value is negative but the prediction is positive;
- TN: true negative, where the actual value is positive but the prediction is negative.
- Precision: This metric indicates the performance with respect to the false positives (i.e., how many the model identified);
- Recall: This metric indicates a classifier’s performance with respect to the false negatives (i.e., how many the model missed);
- IoU: The IoU (Equation (4)) is a standard for defining the detection accuracy of the target objects. The IoU evaluates the performance of the model by calculating the overlap ratio between the predicted bounding box and the true bounding box. is the area of intersection of the predicted bounding box and the true bounding box. is the area of the union of the two bounding boxes. The IoU threshold is a judgment criterion. If the IoU of the object is bigger than the threshold, then the object is thought of as a TP; otherwise, it is an FP.
- mAP@0.5: The parameter of 0.5 means that the threshold of the IoU is set to 0.5. Accordingly, the corresponding APs of all pictures of each category are computed and averaged.
- mAP@0.5:0.95: The parameters of 0.5:0.95 mean that the threshold of the IoU is increased from 0.5 to 0.95 with an increment of 0.05, and then each mAP is calculated by Equation (6). Finally, mAP@0.5:0.95 is the average of all mAPs:
- MPA: the average classification accuracy for each pixel category;
- MIoU: the mean value of the intersection over union, which is a very straightforward metric that is extremely effective for semantic segmentation:
- Accuracy: a good measure when the target variable classes in the data are nearly balanced;
- Specificity: a measure that tells us the proportion of negative values that were predicted by the model as TN, which is the exact opposite of the recall;
- F1-Score: an efficient measure that combines precision and recall into a single metric and can give a larger weight to categories of lower numbers so it can be more objective for unbalanced datasets:
4. Model Training
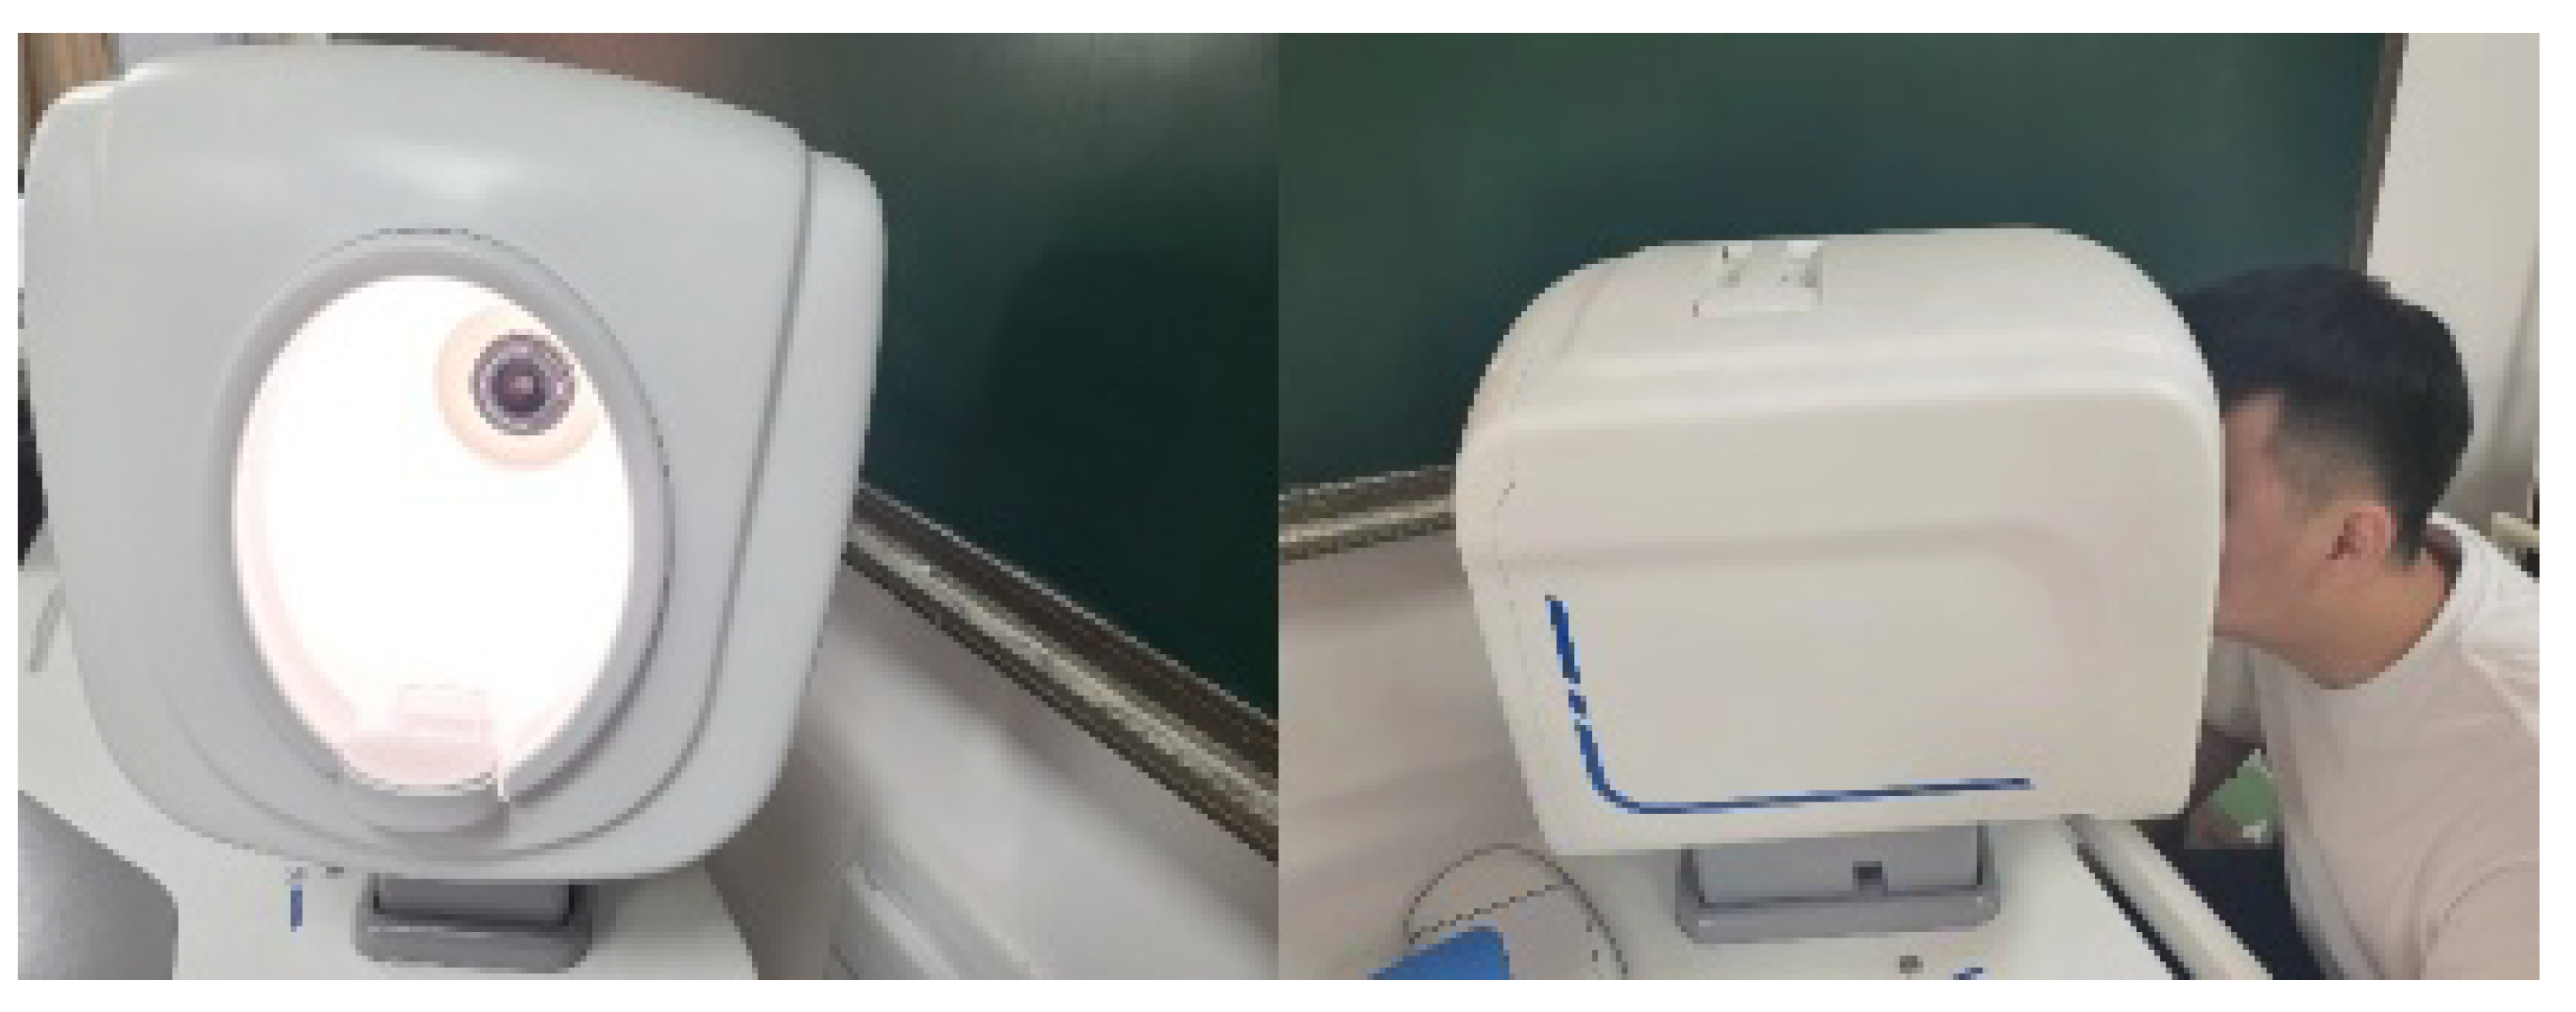
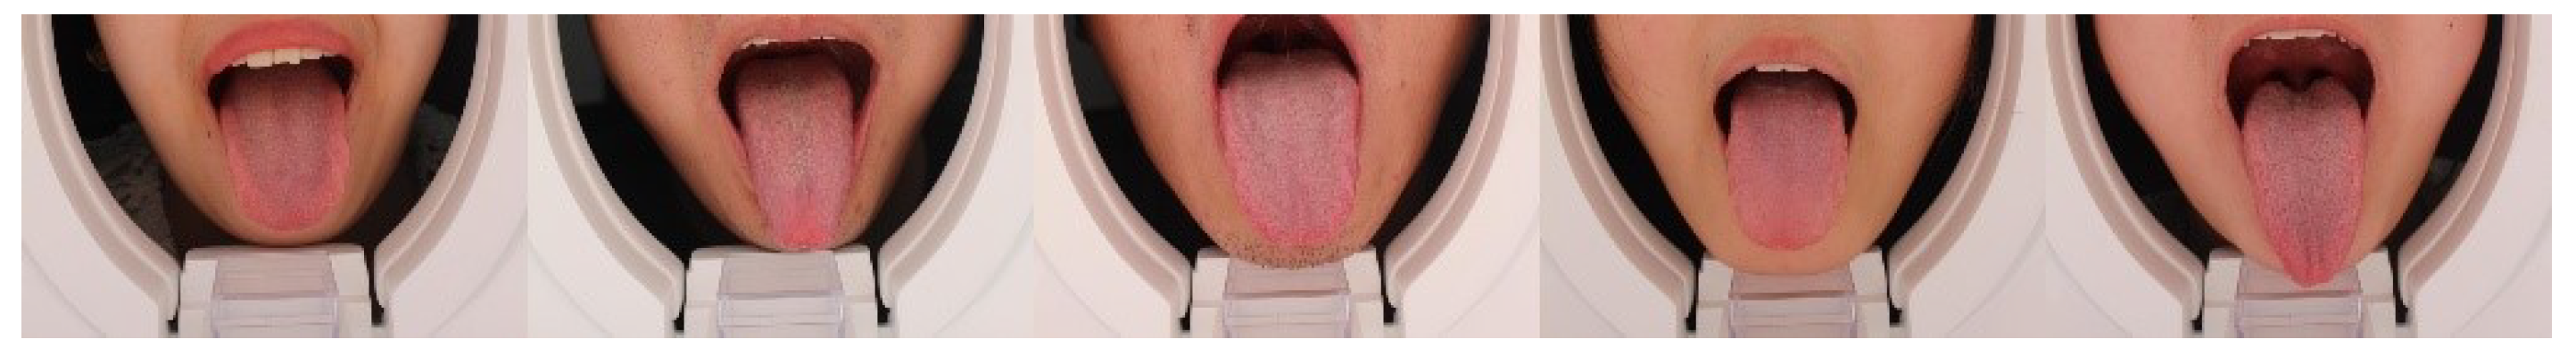
4.1. Data Acquisition
4.2. Data Preparation
4.3. Experiments and Training Set-up
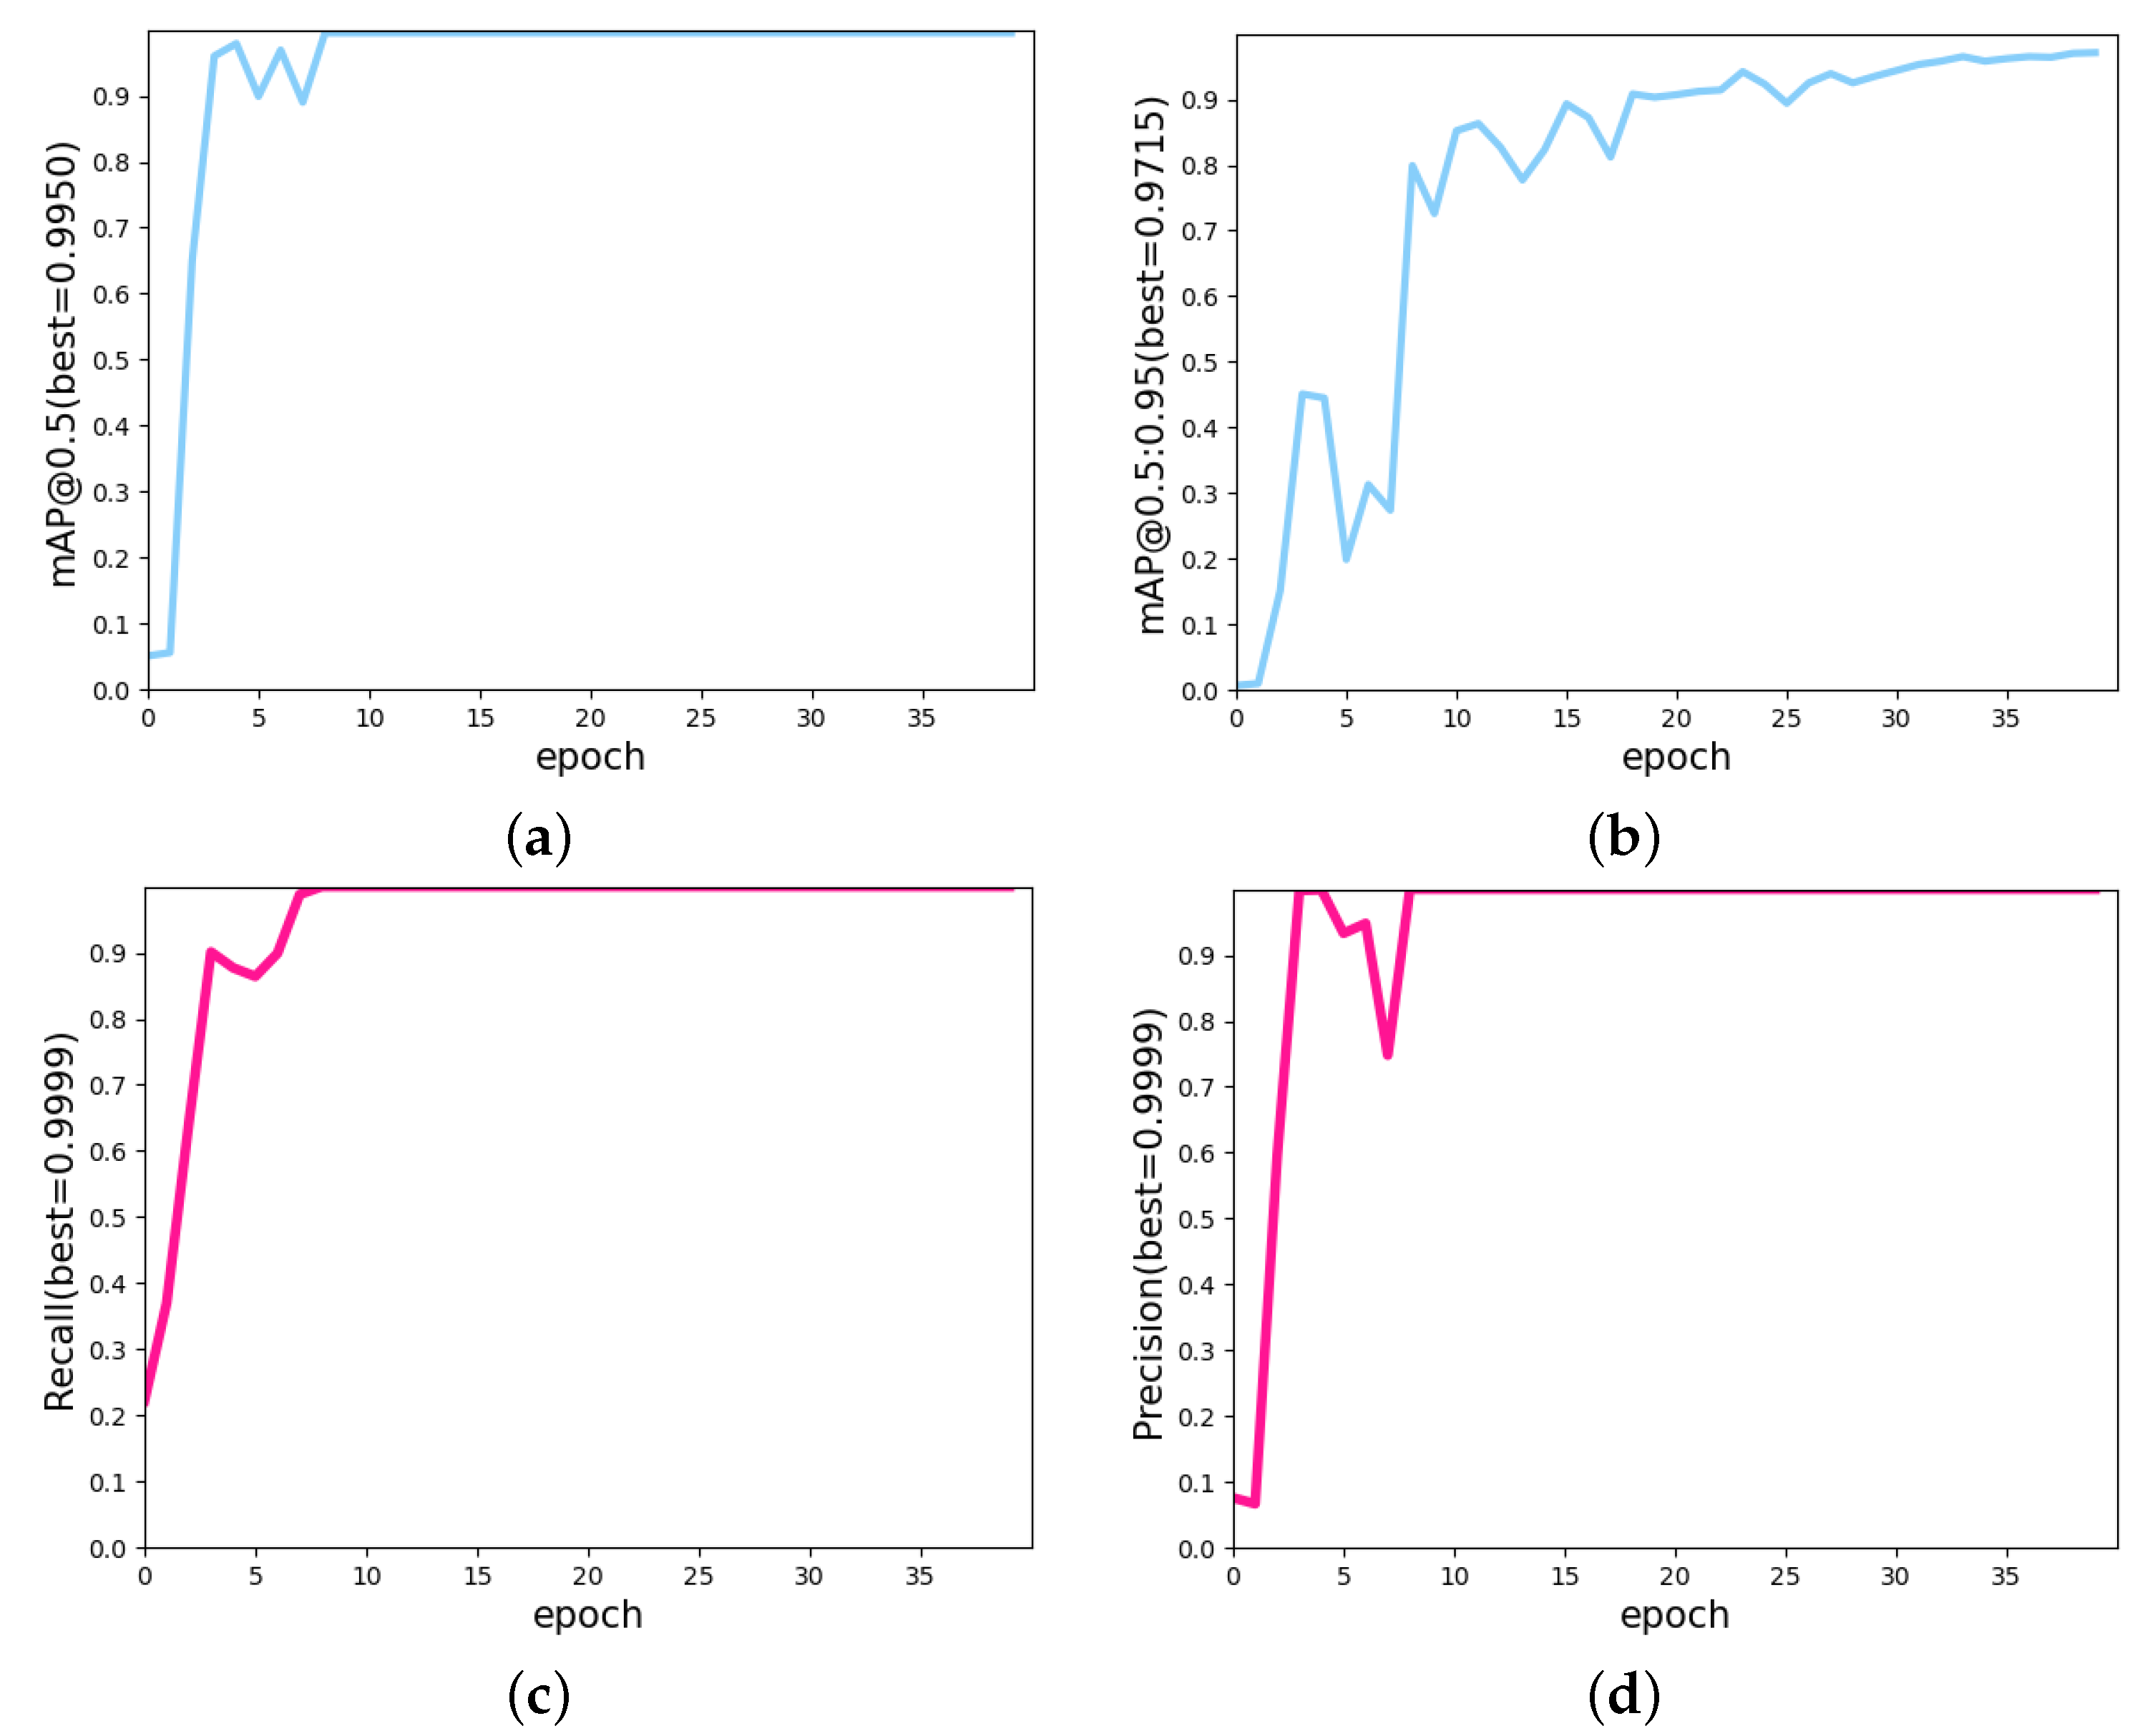
4.4. Results
4.5. Model Evaluation
5. Discussion
6. Conclusions and Future Works
Author Contributions
Funding
Institutional Review Board Statement
Informed Consent Statement
Data Availability Statement
Acknowledgments
Conflicts of Interest
References
- Cyranoski, D. Why Chinese medicine is heading for clinics around the world. Nature 2018, 561, 448–450. [Google Scholar] [CrossRef] [PubMed] [Green Version]
- Ozgursoy, O.B.; Ozgursoy, S.K.; Tulunay, O.; Kemal, O.; Akyol, A.; Dursun, G. Melkersson-Rosenthal syndrome revisited as a misdiagnosed disease. Am. J. Otolaryngol. 2009, 30, 33–37. [Google Scholar] [CrossRef] [PubMed]
- Avraham, K.B.; Schickler, M.; Sapoznikov, D.; Yarom, R.; Groner, Y. Down’s syndrome: Abnormal neuromuscular junction in tongue of transgenic mice with elevated levels of human Cu/Zn-superoxide dismutase. Cell 1988, 54, 823–829. [Google Scholar] [CrossRef]
- Farman, A.G. Atrophic lesions of the tongue: A prevalence study among 175 diabetic patients. J. Oral Pathol. Med. 1976, 5, 255–264. [Google Scholar] [CrossRef] [PubMed]
- Wang, X.; Zhang, D. A high quality color imaging system for computerized tongue image analysis. Expert Syst. Appl. 2013, 40, 5854–5866. [Google Scholar] [CrossRef]
- LeCun, Y.; Bengio, Y.; Hinton, G. Deep learning. Nature 2015, 521, 436–444. [Google Scholar] [CrossRef]
- Guo, Y.; Liu, Y.; Oerlemans, A.; Lao, S.; Wu, S.; Lew, M.S. Deep learning for visual understanding: A review. Neurocomputing 2016, 187, 27–48. [Google Scholar] [CrossRef]
- Razzak, M.I.; Naz, S.; Zaib, A. Deep learning for medical image processing: Overview, challenges and the future. In Classification in BioApps; 2018; pp. 323–350. [Google Scholar] [CrossRef] [Green Version]
- Zhou, J.; Zhang, Q.; Zhang, B. An automatic multi-view disease detection system via collective deep region-based feature representation. Future Gener. Comput. Syst. 2021, 115, 59–75. [Google Scholar] [CrossRef]
- Jiang, T.; Guo, X.J.; Tu, L.P.; Lu, Z.; Cui, J.; Ma, X.X.; Hu, X.J.; Yao, X.H.; Cui, L.T.; Li, Y.Z.; et al. Application of computer tongue image analysis technology in the diagnosis of NAFLD. Comput. Biol. Med. 2021, 135, 104622. [Google Scholar] [CrossRef]
- Gholami, E.; Tabbakh, S.R.K.; Kheirabadi, M. Proposing method to Increase the detection accuracy of stomach cancer based on colour and lint features of tongue using CNN and SVM. arXiv 2020, arXiv:2011.09962. [Google Scholar]
- Tang, Q.; Yang, T.; Yoshimura, Y.; Namiki, T.; Nakaguchi, T. Learning-based tongue detection for automatic tongue color diagnosis system. Artif. Life Robot. 2020, 25, 363–369. [Google Scholar] [CrossRef]
- Zhou, C.; Fan, H.; Li, Z. Tonguenet: Accurate localization and segmentation for tongue images using deep neural networks. IEEE Access 2019, 7, 148779–148789. [Google Scholar] [CrossRef]
- Zhou, J.; Zhang, Q.; Zhang, B.; Chen, X. TongueNet: A precise and fast tongue segmentation system using U-Net with a morphological processing layer. Appl. Sci. 2019, 9, 3128. [Google Scholar] [CrossRef] [Green Version]
- Hou, J.; Su, H.Y.; Yan, B.; Zheng, H.; Sun, Z.L.; Cai, X.C. Classification of tongue color based on CNN. In Proceedings of the 2017 IEEE 2nd International Conference on Big Data Analysis (ICBDA), Kuching, Malaysia, 16–17 November 2017; IEEE: Piscataway, NJ, USA, 2017; pp. 725–729. [Google Scholar] [CrossRef]
- Li, X.; Zhang, Y.; Cui, Q.; Yi, X.; Zhang, Y. Tooth-Marked Tongue Recognition Using Multiple Instance Learning and CNN Features. IEEE Trans. Cybern. 2019, 49, 380–387. [Google Scholar] [CrossRef] [PubMed]
- Vukotic, A.; Goodwill, J. Introduction to Apache Tomcat 7. In Apache Tomcat 7; Springer: New York, NY, USA, 2011; pp. 1–15. [Google Scholar] [CrossRef]
- Ronneberger, O.; Fischer, P.; Brox, T. U-net: Convolutional networks for biomedical image segmentation. In Proceedings of the International Conference on Medical Image Computing and Computer-Assisted Intervention, Munich, Germany, 5–9 October 2015; Springer: New York, NY, USA, 2015; pp. 234–241. [Google Scholar] [CrossRef] [Green Version]
- Howard, A.; Sandler, M.; Chu, G.; Chen, L.C.; Chen, B.; Tan, M.; Wang, W.; Zhu, Y.; Pang, R.; Vasudevan, V.; et al. Searching for mobilenetv3. In Proceedings of the IEEE/CVF International Conference on Computer Vision, Seoul, Korea, 27 October–2 November 2019; pp. 1314–1324. [Google Scholar] [CrossRef]
- Redmon, J.; Divvala, S.; Girshick, R.; Farhadi, A. You Only Look Once: Unified, Real-Time Object Detection. In Proceedings of the 2016 IEEE Conference on Computer Vision and Pattern Recognition (CVPR), Las Vegas, NV, USA, 27–30 June 2016; pp. 779–788. [Google Scholar] [CrossRef] [Green Version]
- Redmon, J.; Farhadi, A. YOLO9000: Better, Faster, Stronger. In Proceedings of the 2017 IEEE Conference on Computer Vision and Pattern Recognition (CVPR), Honolulu, HI, USA, 21–26 July 2017; pp. 6517–6525. [Google Scholar] [CrossRef]
- Redmon, J.; Farhadi, A. Yolov3: An incremental improvement. arXiv 2018, arXiv:1804.02767. [Google Scholar]
- Bochkovskiy, A.; Wang, C.Y.; Liao, H.Y.M. Yolov4: Optimal speed and accuracy of object detection. arXiv 2020, arXiv:2004.10934. [Google Scholar]
- Liu, W.; Anguelov, D.; Erhan, D.; Szegedy, C.; Reed, S.; Fu, C.Y.; Berg, A.C. Ssd: Single shot multibox detector. In Proceedings of the European Conference on Computer Vision, Amsterdam, The Netherlands, 11–14 October 2016; Springer: New York, NY, USA, 2016; pp. 21–37. [Google Scholar] [CrossRef] [Green Version]
- Fu, C.Y.; Liu, W.; Ranga, A.; Tyagi, A.; Berg, A.C. Dssd: Deconvolutional single shot detector. arXiv 2017, arXiv:1701.06659. [Google Scholar]
- Liu, S.; Huang, D.; Wang, Y. Receptive field block net for accurate and fast object detection. In Proceedings of the European Conference on Computer Vision (ECCV), Munich, Germany, 8–14 September 2018; pp. 385–400. [Google Scholar] [CrossRef] [Green Version]
- Zhang, S.; Wen, L.; Bian, X.; Lei, Z.; Li, S.Z. Single-shot refinement neural network for object detection. In Proceedings of the IEEE Conference on Computer Vision and Pattern Recognition, Salt Lake City, UT, USA, 18–23 June 2018; pp. 4203–4212. [Google Scholar] [CrossRef]
- Girshick, R.; Donahue, J.; Darrell, T.; Malik, J. Rich feature hierarchies for accurate object detection and semantic segmentation. In Proceedings of the IEEE Conference on Computer Vision and Pattern Recognition, Columbus, OH, USA, 23–28 June 2014; pp. 580–587. [Google Scholar] [CrossRef] [Green Version]
- Girshick, R. Fast R-CNN. In Proceedings of the 2015 IEEE International Conference on Computer Vision (ICCV), Santiago, Chile, 7–13 December 2015; pp. 1440–1448. [Google Scholar] [CrossRef]
- Ren, S.; He, K.; Girshick, R.; Sun, J. Faster R-CNN: Towards Real-Time Object Detection with Region Proposal Networks. IEEE Trans. Pattern Anal. Mach. Intell. 2017, 39, 1137–1149. [Google Scholar] [CrossRef] [Green Version]
- He, K.; Gkioxari, G.; Dollár, P.; Girshick, R. Mask R-CNN. In Proceedings of the 2017 IEEE International Conference on Computer Vision (ICCV), Venice, Italy, 22–29 October 2017; pp. 2980–2988. [Google Scholar] [CrossRef]
- He, K.; Zhang, X.; Ren, S.; Sun, J. Spatial Pyramid Pooling in Deep Convolutional Networks for Visual Recognition. IEEE Trans. Pattern Anal. Mach. Intell. 2015, 37, 1904–1916. [Google Scholar] [CrossRef] [Green Version]
- Lin, T.Y.; Dollár, P.; Girshick, R.; He, K.; Hariharan, B.; Belongie, S. Feature Pyramid Networks for Object Detection. In Proceedings of the 2017 IEEE Conference on Computer Vision and Pattern Recognition (CVPR), Honolulu, HI, USA, 21–26 July 2017; pp. 936–944. [Google Scholar] [CrossRef] [Green Version]
- Liu, S.; Qi, L.; Qin, H.; Shi, J.; Jia, J. Path Aggregation Network for Instance Segmentation. In Proceedings of the 2018 IEEE/CVF Conference on Computer Vision and Pattern Recognition, Salt Lake City, UT, USA, 18–23 June 2018; pp. 8759–8768. [Google Scholar] [CrossRef]
- Long, J.; Shelhamer, E.; Darrell, T. Fully convolutional networks for semantic segmentation. In Proceedings of the 2015 IEEE Conference on Computer Vision and Pattern Recognition (CVPR), Boston, MA, USA, 7–12 June 2015; pp. 3431–3440. [Google Scholar] [CrossRef] [Green Version]
- Chen, L.C.; Barron, J.T.; Papandreou, G.; Murphy, K.; Yuille, A.L. Semantic Image Segmentation with Task-Specific Edge Detection Using CNNs and a Discriminatively Trained Domain Transform. In Proceedings of the 2016 IEEE Conference on Computer Vision and Pattern Recognition (CVPR), Las Vegas, NV, USA, 27–30 June 2016; pp. 4545–4554. [Google Scholar] [CrossRef] [Green Version]
- Chen, L.C.; Papandreou, G.; Kokkinos, I.; Murphy, K.; Yuille, A.L. DeepLab: Semantic Image Segmentation with Deep Convolutional Nets, Atrous Convolution, and Fully Connected CRFs. IEEE Trans. Pattern Anal. Mach. Intell. 2018, 40, 834–848. [Google Scholar] [CrossRef] [Green Version]
- Chen, L.C.; Papandreou, G.; Schroff, F.; Adam, H. Rethinking atrous convolution for semantic image segmentation. arXiv 2017, arXiv:1706.05587. [Google Scholar]
- Chen, L.C.; Zhu, Y.; Papandreou, G.; Schroff, F.; Adam, H. Encoder-decoder with atrous separable convolution for semantic image segmentation. In Proceedings of the European Conference on Computer Vision (ECCV), Munich, Germany, 8–14 September 2018; pp. 833–851. [Google Scholar] [CrossRef] [Green Version]
- Wang, Y.P.; Jheng, Y.C.; Sung, K.Y.; Lin, H.E.; Hsin, I.F.; Chen, P.H.; Chu, Y.C.; Lu, D.; Wang, Y.J.; Hou, M.C.; et al. Use of U-Net Convolutional Neural Networks for Automated Segmentation of Fecal Material for Objective Evaluation of Bowel Preparation Quality in Colonoscopy. Diagnostics 2022, 12, 613. [Google Scholar] [CrossRef] [PubMed]
- Simonyan, K.; Zisserman, A. Very deep convolutional networks for large-scale image recognition. arXiv 2014, arXiv:1409.1556. [Google Scholar]
- He, K.; Zhang, X.; Ren, S.; Sun, J. Deep Residual Learning for Image Recognition. In Proceedings of the 2016 IEEE Conference on Computer Vision and Pattern Recognition (CVPR), Las Vegas, NV, USA, 27–30 June 2016; pp. 770–778. [Google Scholar] [CrossRef] [Green Version]
- He, K.; Zhang, X.; Ren, S.; Sun, J. Identity mappings in deep residual networks. In Proceedings of the European Conference on Computer Vision, Amsterdam, The Netherlands, 11–14 October 2016; Springer: New York, NY, USA, 2016; pp. 630–645. [Google Scholar] [CrossRef] [Green Version]
- Zagoruyko, S.; Komodakis, N. Wide residual networks. arXiv 2016, arXiv:1605.07146. [Google Scholar]
- Xie, S.; Girshick, R.; Dollár, P.; Tu, Z.; He, K. Aggregated Residual Transformations for Deep Neural Networks. In Proceedings of the 2017 IEEE Conference on Computer Vision and Pattern Recognition (CVPR), Honolulu, HI, USA, 21–26 July 2017; pp. 5987–5995. [Google Scholar] [CrossRef] [Green Version]
- Howard, A.G.; Zhu, M.; Chen, B.; Kalenichenko, D.; Wang, W.; Weyand, T.; Andreetto, M.; Adam, H. Mobilenets: Efficient convolutional neural networks for mobile vision applications. arXiv 2017, arXiv:1704.04861. [Google Scholar]
- Sandler, M.; Howard, A.; Zhu, M.; Zhmoginov, A.; Chen, L.C. MobileNetV2: Inverted Residuals and Linear Bottlenecks. In Proceedings of the 2018 IEEE/CVF Conference on Computer Vision and Pattern Recognition, Salt Lake City, UT, USA, 18–23 June 2018; pp. 4510–4520. [Google Scholar] [CrossRef] [Green Version]
- Powers, D.M. Evaluation: From precision, recall and F-measure to ROC, informedness, markedness and correlation. arXiv 2020, arXiv:2010.16061. [Google Scholar]
- Russell, B.C.; Torralba, A.; Murphy, K.P.; Freeman, W.T. LabelMe: A database and web-based tool for image annotation. Int. J. Comput. Vis. 2008, 77, 157–173. [Google Scholar] [CrossRef]
- Tzutalin, D. LabelImg. GitHub Repos. 2015, 6. [Google Scholar]
- Li, Q.; Guo, H.; Luo, L.; Wang, X. Automatic Mapping of Karez in Turpan Basin Based on Google Earth Images and the YOLOv5 Model. Remote Sens. 2022, 14, 3318. [Google Scholar] [CrossRef]
- Dong, X.; Yan, S.; Duan, C. A lightweight vehicles detection network model based on YOLOv5. Eng. Appl. Artif. Intell. 2022, 113, 104914. [Google Scholar] [CrossRef]
- Murphy, K.P. Machine Learning: A Probabilistic Perspective; MIT Press: Cambridge, MA, USA, 2012. [Google Scholar]
- Zheng, Z.; Wang, P.; Liu, W.; Li, J.; Ye, R.; Ren, D. Distance-IoU loss: Faster and better learning for bounding box regression. In Proceedings of the AAAI Conference on Artificial Intelligence, New York, NY, USA, 7–12 February 2020; Volume 34, pp. 12993–13000. [Google Scholar] [CrossRef]
- Selvaraju, R.R.; Cogswell, M.; Das, A.; Vedantam, R.; Parikh, D.; Batra, D. Grad-CAM: Visual Explanations from Deep Networks via Gradient-Based Localization. In Proceedings of the 2017 IEEE International Conference on Computer Vision (ICCV), Venice, Italy, 22–29 October 2017; pp. 618–626. [Google Scholar] [CrossRef] [Green Version]
- Bacanin, N.; Stoean, R.; Zivkovic, M.; Petrovic, A.; Rashid, T.A.; Bezdan, T. Performance of a Novel Chaotic Firefly Algorithm with Enhanced Exploration for Tackling Global Optimization Problems: Application for Dropout Regularization. Mathematics 2021, 9, 2705. [Google Scholar] [CrossRef]
- Malakar, S.; Ghosh, M.; Bhowmik, S.; Sarkar, R.; Nasipuri, M. A GA based hierarchical feature selection approach for handwritten word recognition. Neural Comput. Appl. 2020, 32, 2533–2552. [Google Scholar] [CrossRef]


| Input | Operator | Exp Size | #out | SE | NL | s |
|---|---|---|---|---|---|---|
| conv2d | - | 16 | - | HS | 2 | |
| bneck, | 16 | 16 | - | RE | 1 | |
| bneck, | 64 | 24 | - | RE | 2 | |
| bneck, | 72 | 24 | - | RE | 1 | |
| bneck, | 72 | 40 | 1 | RE | 2 | |
| bneck, | 120 | 40 | 1 | RE | 1 | |
| bneck, | 120 | 40 | 1 | RE | 1 | |
| bneck, | 240 | 80 | - | RE | 2 | |
| bneck, | 200 | 80 | - | RE | 1 | |
| bneck, | 200 | 80 | - | RE | 1 | |
| bneck, | 184 | 80 | - | RE | 1 | |
| bneck, | 184 | 112 | 1 | RE | 1 | |
| bneck, | 480 | 112 | 1 | RE | 1 | |
| bneck, | 672 | 160 | 1 | RE | 2 | |
| bneck, | 672 | 160 | 1 | RE | 1 | |
| bneck, | 960 | 160 | 1 | RE | 1 | |
| conv2d, | 960 | 960 | - | HS | 1 | |
| avg pool, | - | - | - | - | 1 | |
| conv2d, | - | 1280 | - | HS | 1 | |
| conv2d, | - | k | - | - | 1 |
| Tongue | Feature | ||||
|---|---|---|---|---|---|
| Fur | Thin and thick | Moist and dry | Curdy and greasy | Peeled | True and false |
| Body | Puffy and thin | Old and tender | Tooth-marked | Fissured | Spotted |
| Task | Number | Train | Test |
|---|---|---|---|
| Tongue image detection | 462 | 370 | 92 |
| Tongue body segment | 462 | 370 | 92 |
| Fissured/not fissured | 170/292 | 236/234 | 34/58 |
| Tooth-marked/not marked | 546/704 | 437/564 | 109/140 |
| Spotted/not spotted | 210/252 | 168/202 | 42/34 |
| Task | Model | Epoch | Batch Size |
|---|---|---|---|
| Tongue detection | YOLOv5s6 | 40 | 16 |
| Tongue region segment | U-Net | 100 | 16 |
| Fissured or not fissured | MobileNetV3 | 200 | 64 |
| Tooth-marked or not marked | MobileNetV3 | 200 | 64 |
| Spotted or not spotted | MobileNetV3 | 200 | 64 |
| Feature | Tooth-Marked | Spotted | Fissured |
|---|---|---|---|
| Accuracy | 93.33% | 89.60% | 97.67% |
| F1-score | 92.61% | 82.93% | 96.55% |
| Recall | 92.16% | 78.46% | 96.55% |
| Precision | 93.07% | 87.93% | 96.55% |
| Specificity | 94.31% | 94.89% | 98.25% |
Publisher’s Note: MDPI stays neutral with regard to jurisdictional claims in published maps and institutional affiliations. |
© 2022 by the authors. Licensee MDPI, Basel, Switzerland. This article is an open access article distributed under the terms and conditions of the Creative Commons Attribution (CC BY) license (https://creativecommons.org/licenses/by/4.0/).
Share and Cite
Yang, Z.; Zhao, Y.; Yu, J.; Mao, X.; Xu, H.; Huang, L. An Intelligent Tongue Diagnosis System via Deep Learning on the Android Platform. Diagnostics 2022, 12, 2451. https://doi.org/10.3390/diagnostics12102451
Yang Z, Zhao Y, Yu J, Mao X, Xu H, Huang L. An Intelligent Tongue Diagnosis System via Deep Learning on the Android Platform. Diagnostics. 2022; 12(10):2451. https://doi.org/10.3390/diagnostics12102451
Chicago/Turabian StyleYang, Zibin, Yuping Zhao, Jiarui Yu, Xiaobo Mao, Huaxing Xu, and Luqi Huang. 2022. "An Intelligent Tongue Diagnosis System via Deep Learning on the Android Platform" Diagnostics 12, no. 10: 2451. https://doi.org/10.3390/diagnostics12102451
APA StyleYang, Z., Zhao, Y., Yu, J., Mao, X., Xu, H., & Huang, L. (2022). An Intelligent Tongue Diagnosis System via Deep Learning on the Android Platform. Diagnostics, 12(10), 2451. https://doi.org/10.3390/diagnostics12102451