
Obstructive Sleep Apnea and Auditory Dysfunction—Does Snoring Sound Play a Role?


Abstract
1. Introduction
2. Materials and Methods
2.1. Study Design
2.2. Setting
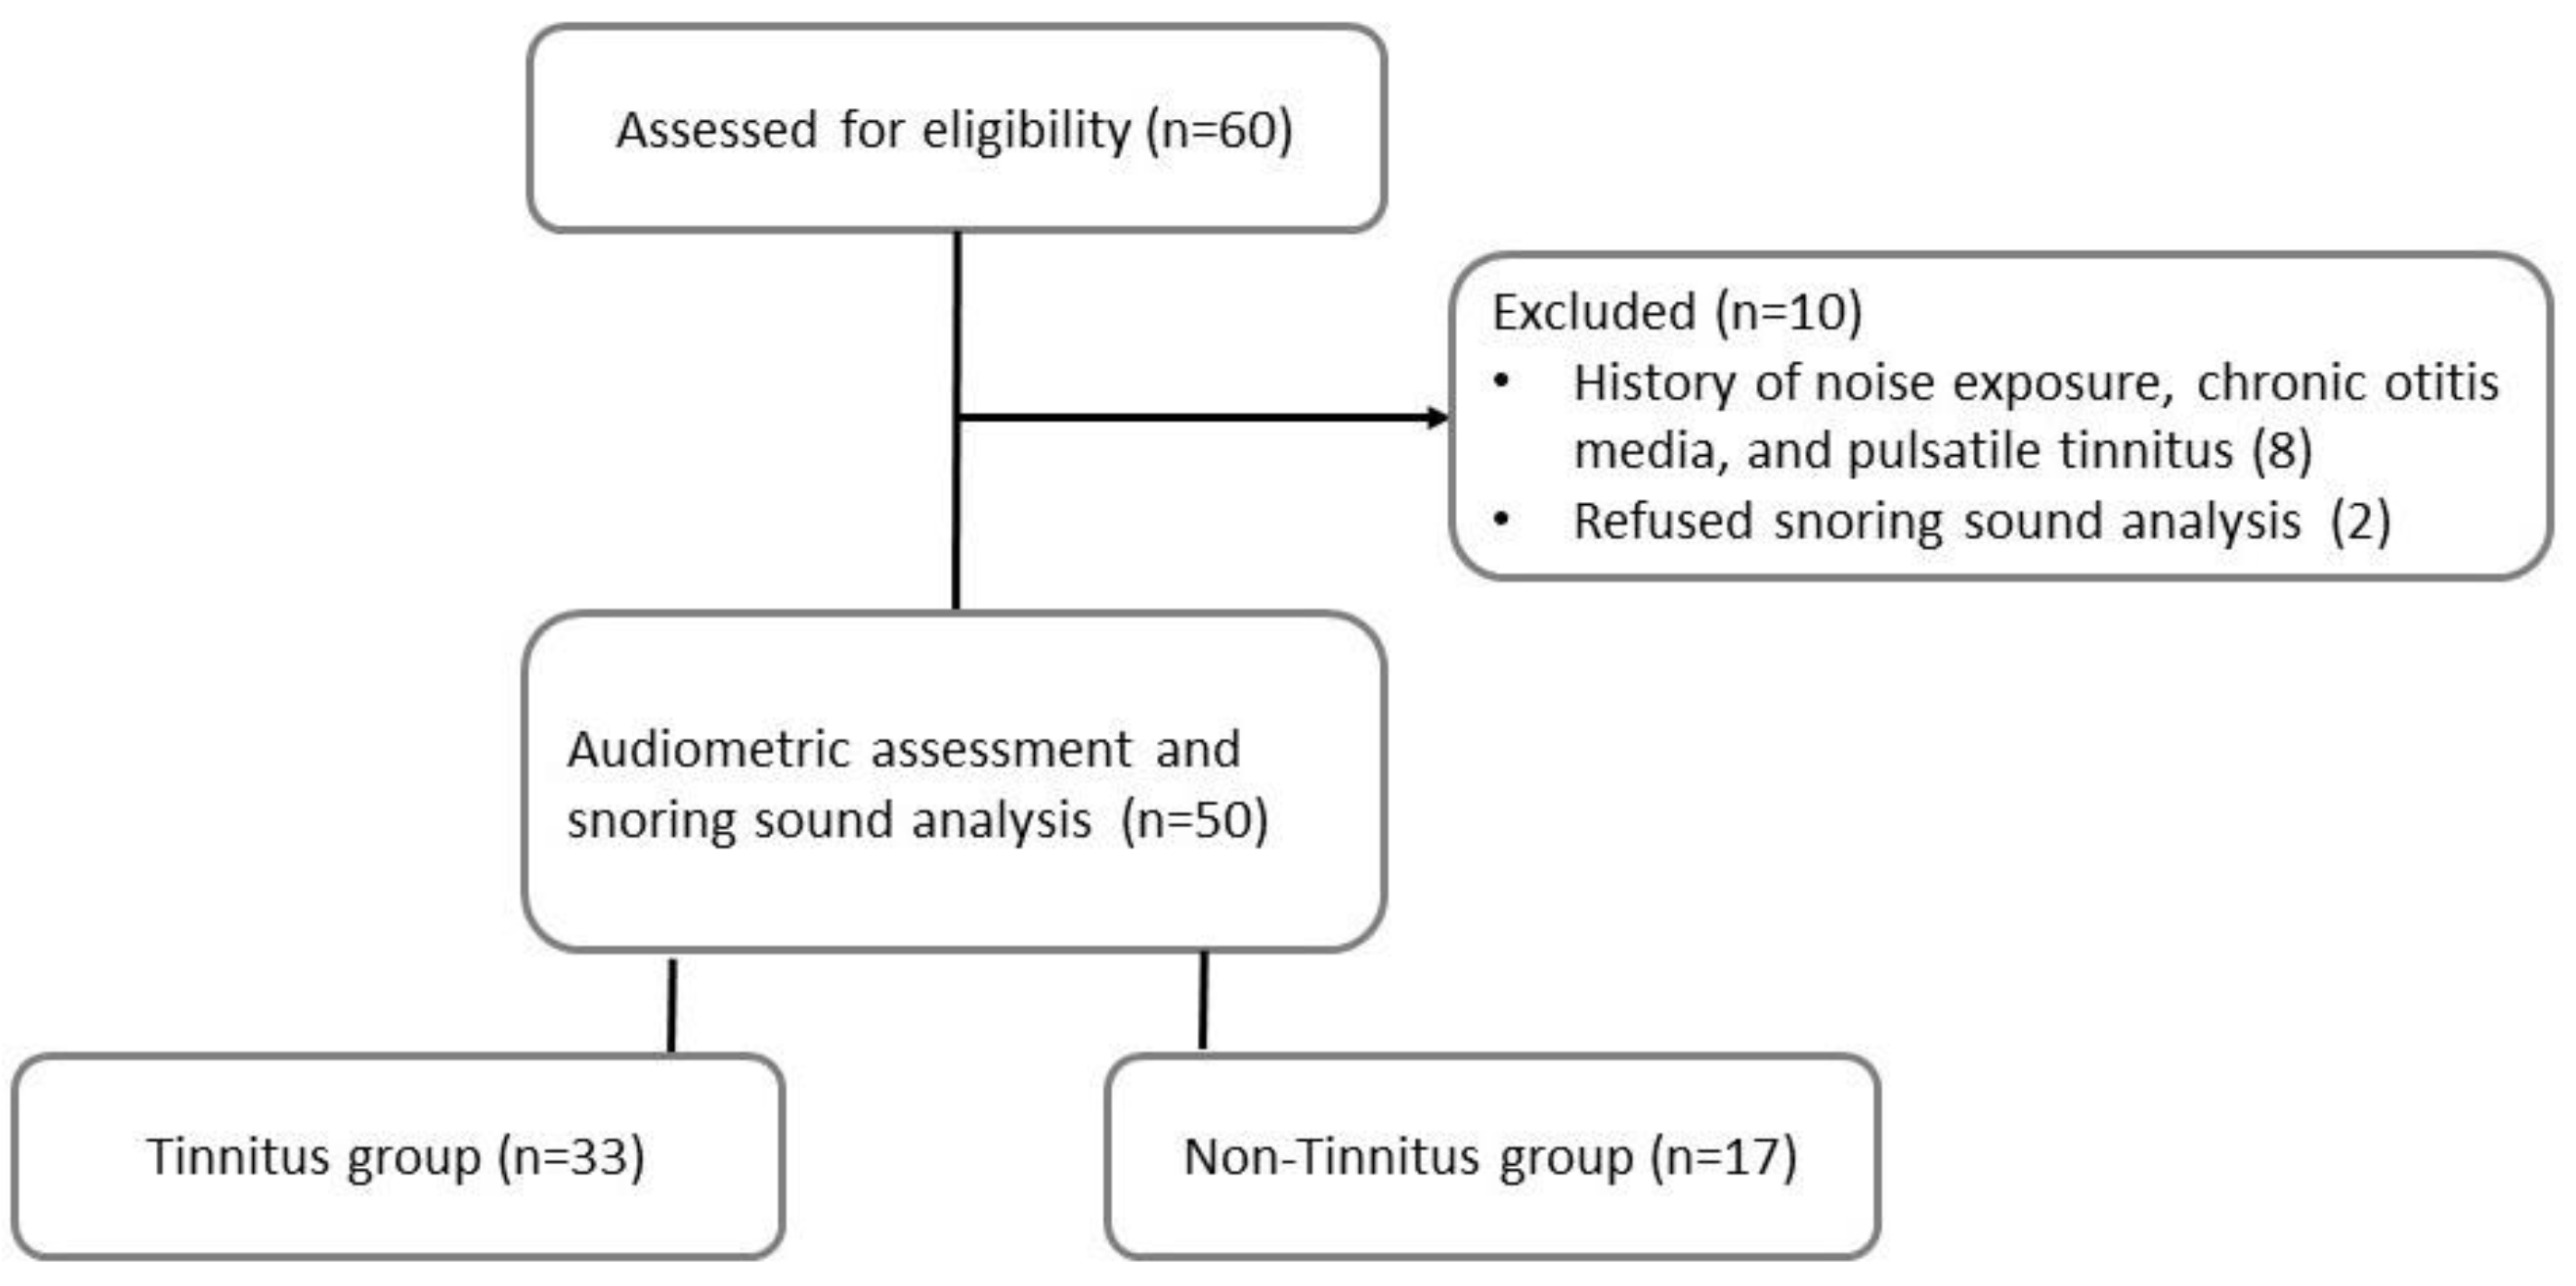
2.3. Participants
2.4. Polysomnography
2.5. Audiometric Assessment
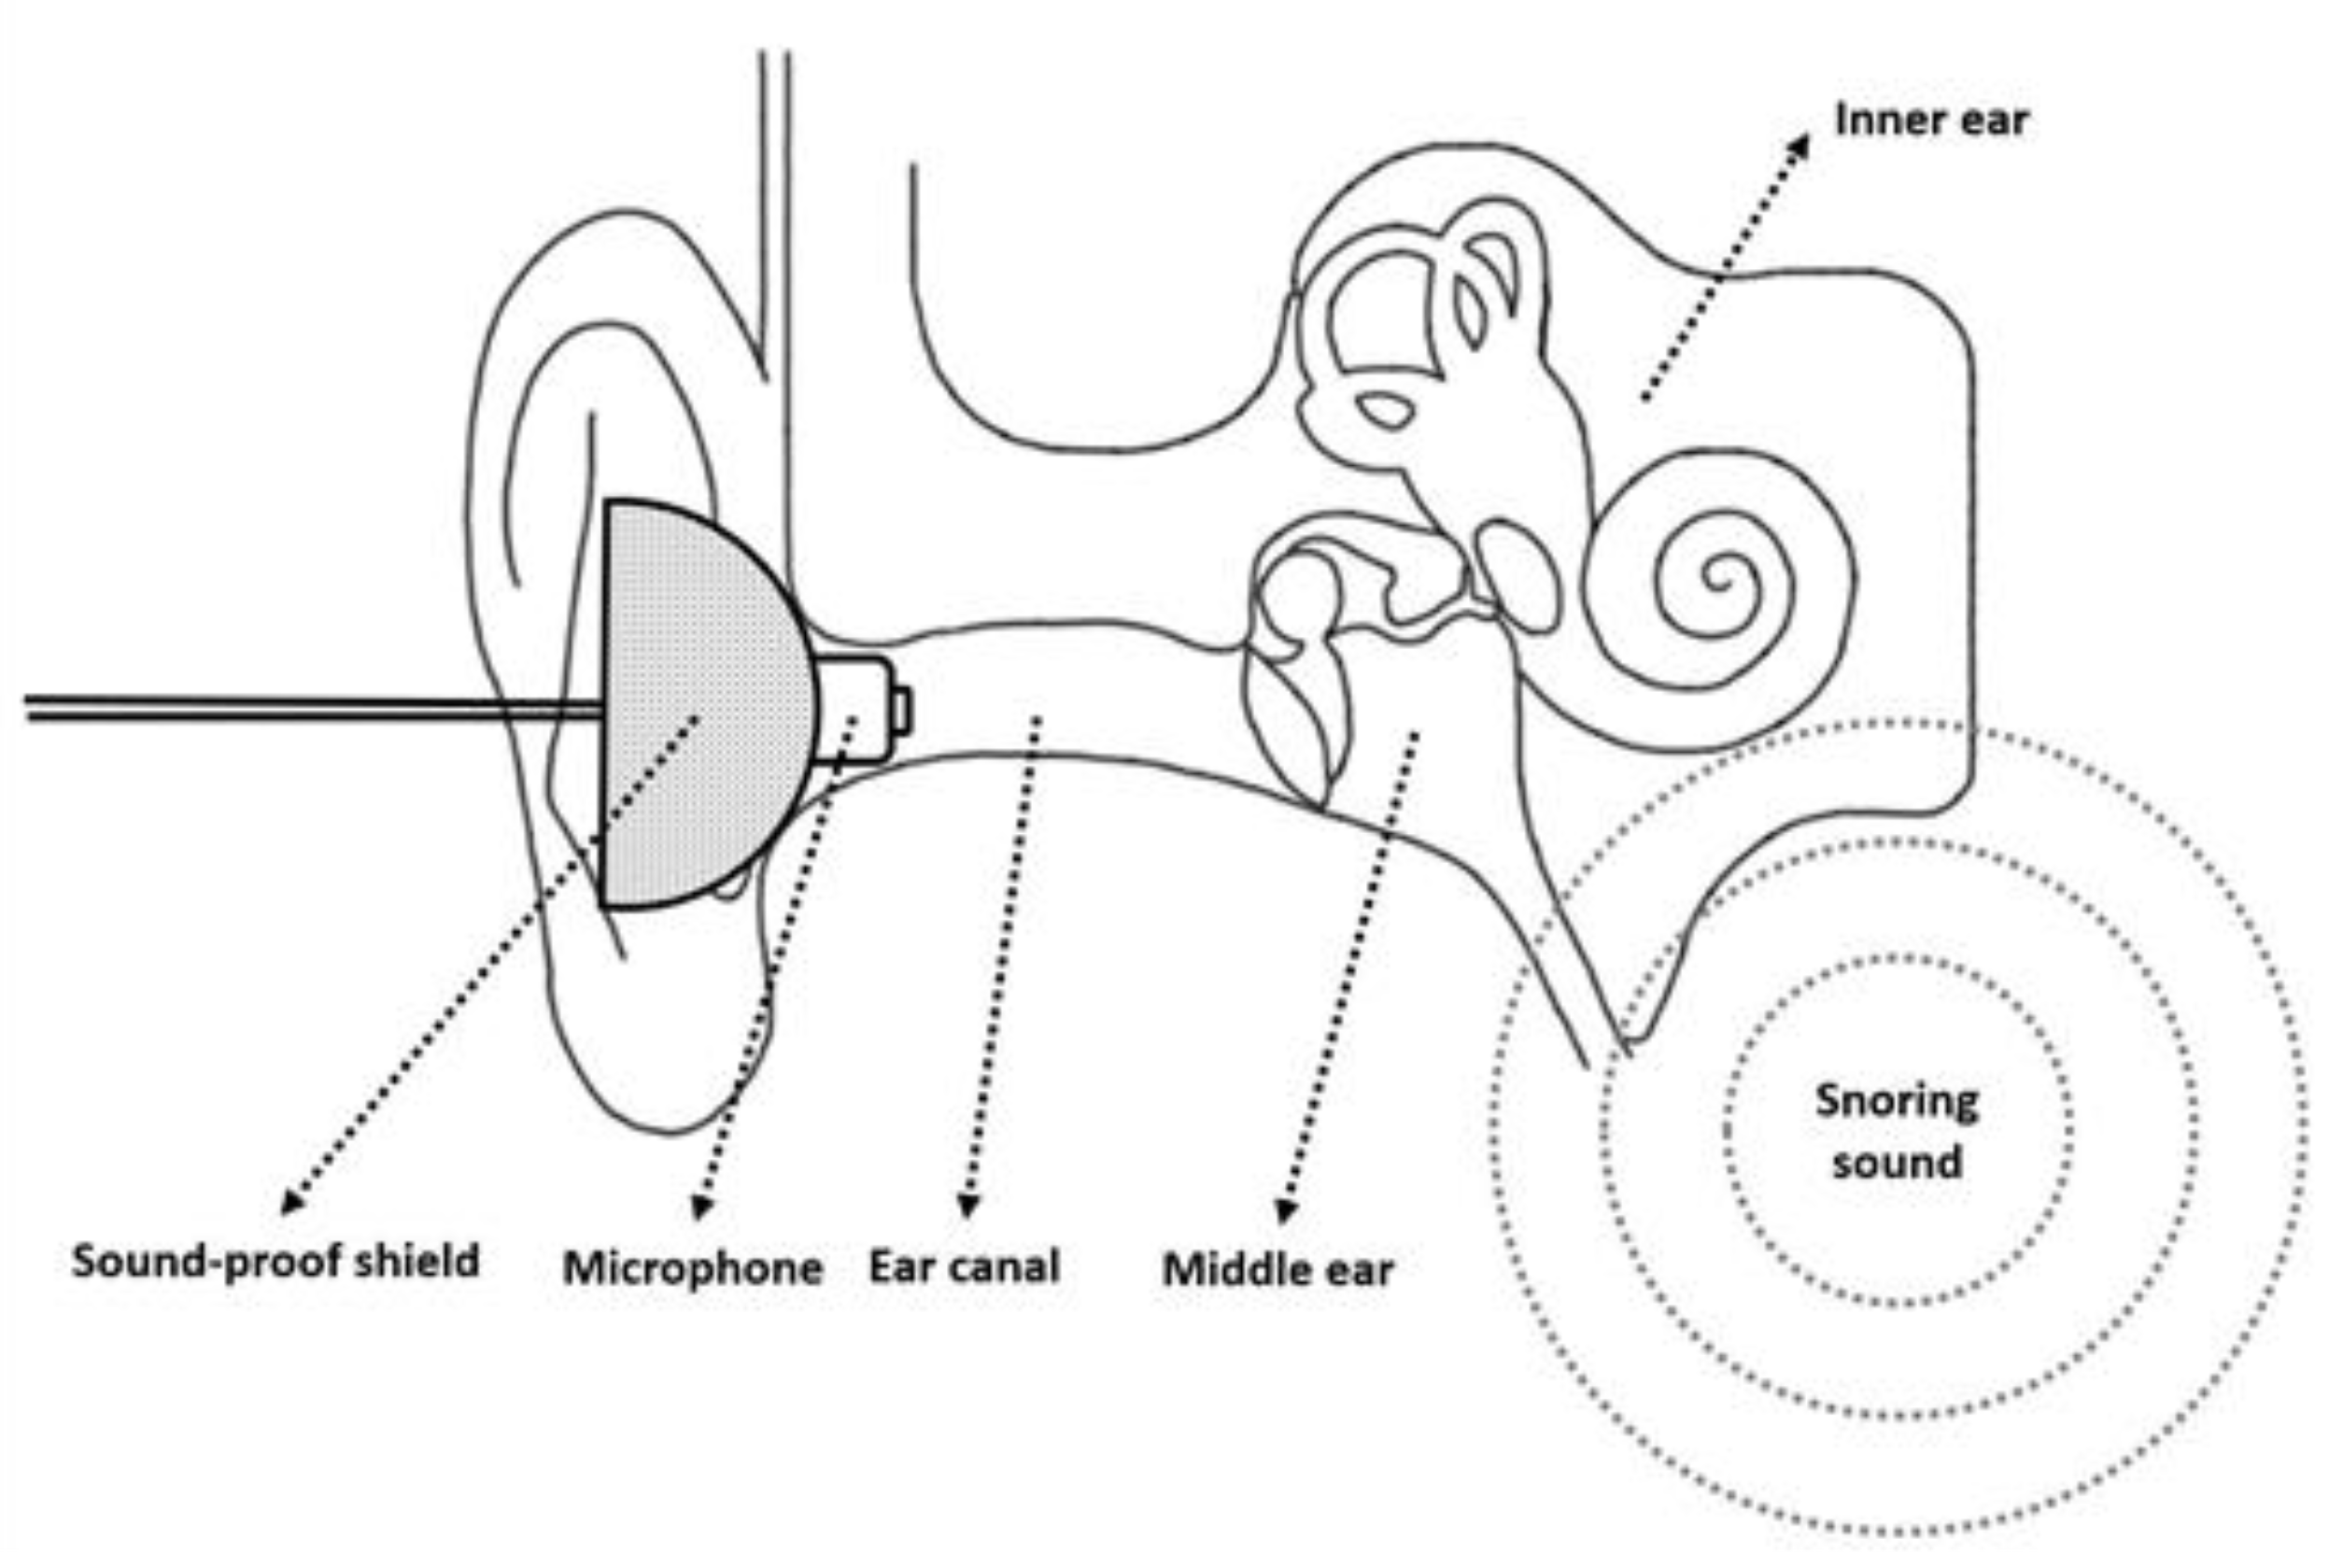
2.6. Detection and Analysis of Snoring Sounds
2.7. Statistical Analysis
3. Results
3.1. Study Population
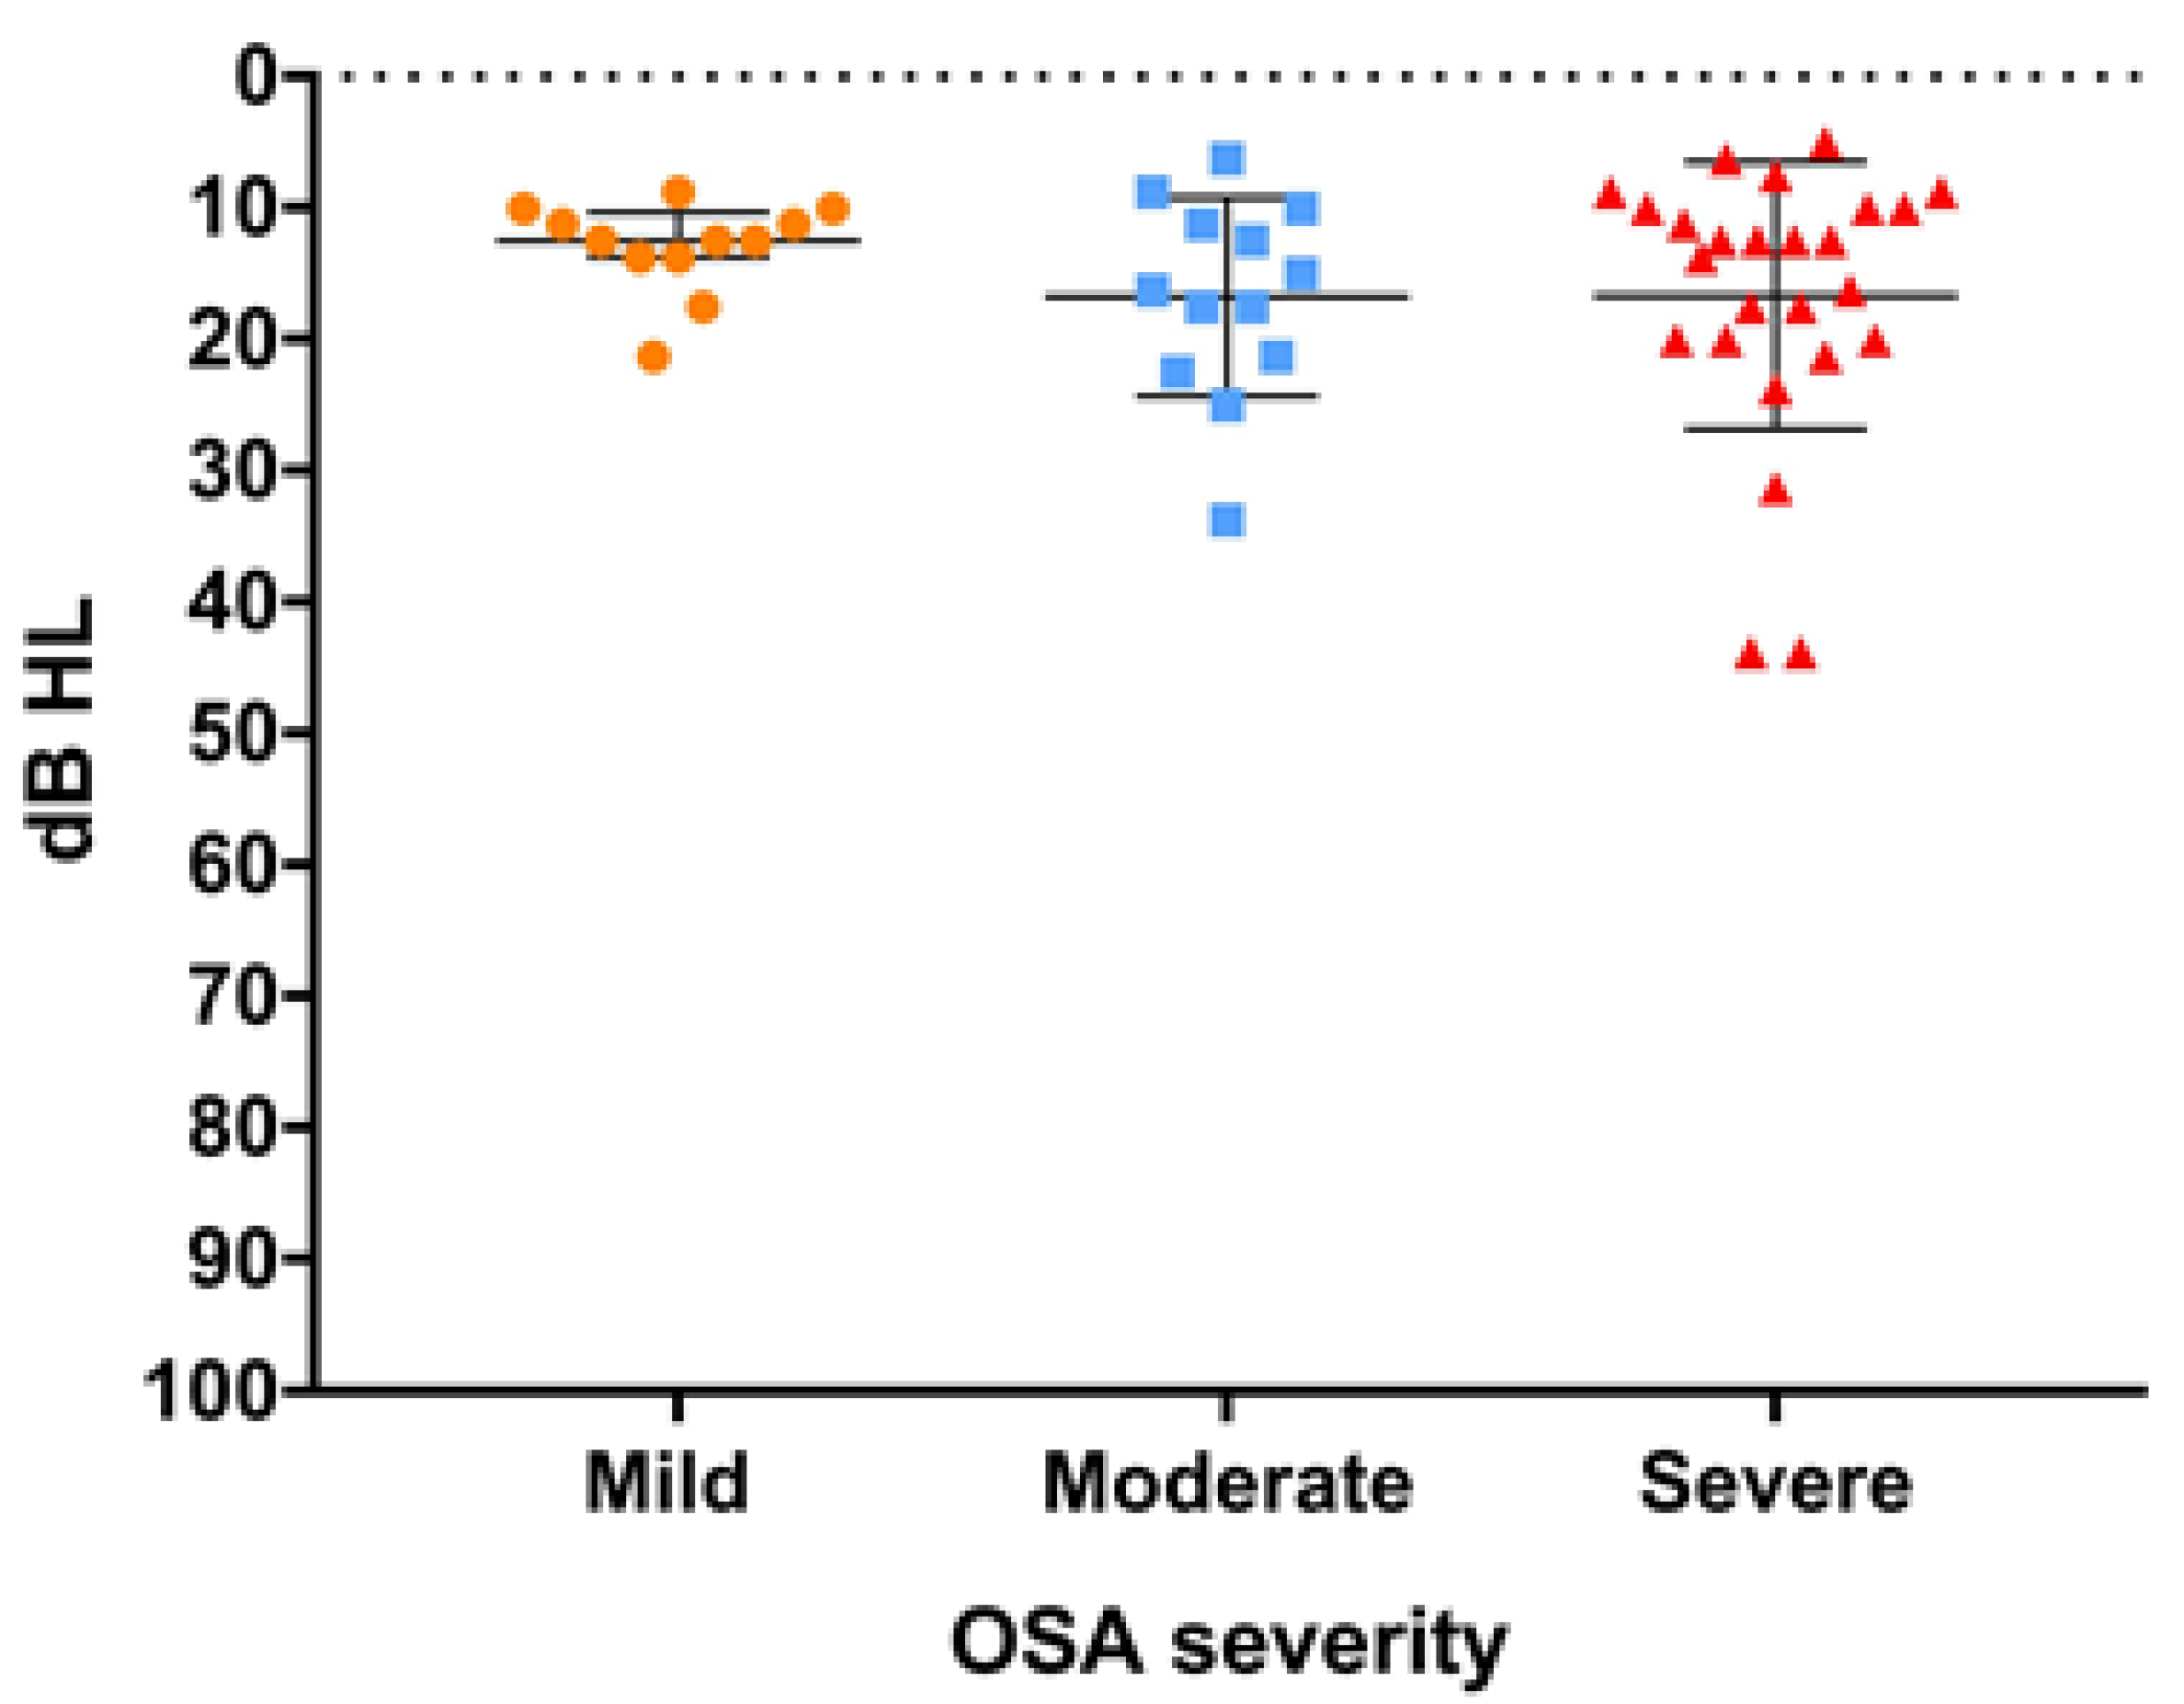
3.2. Hearing Thresholds
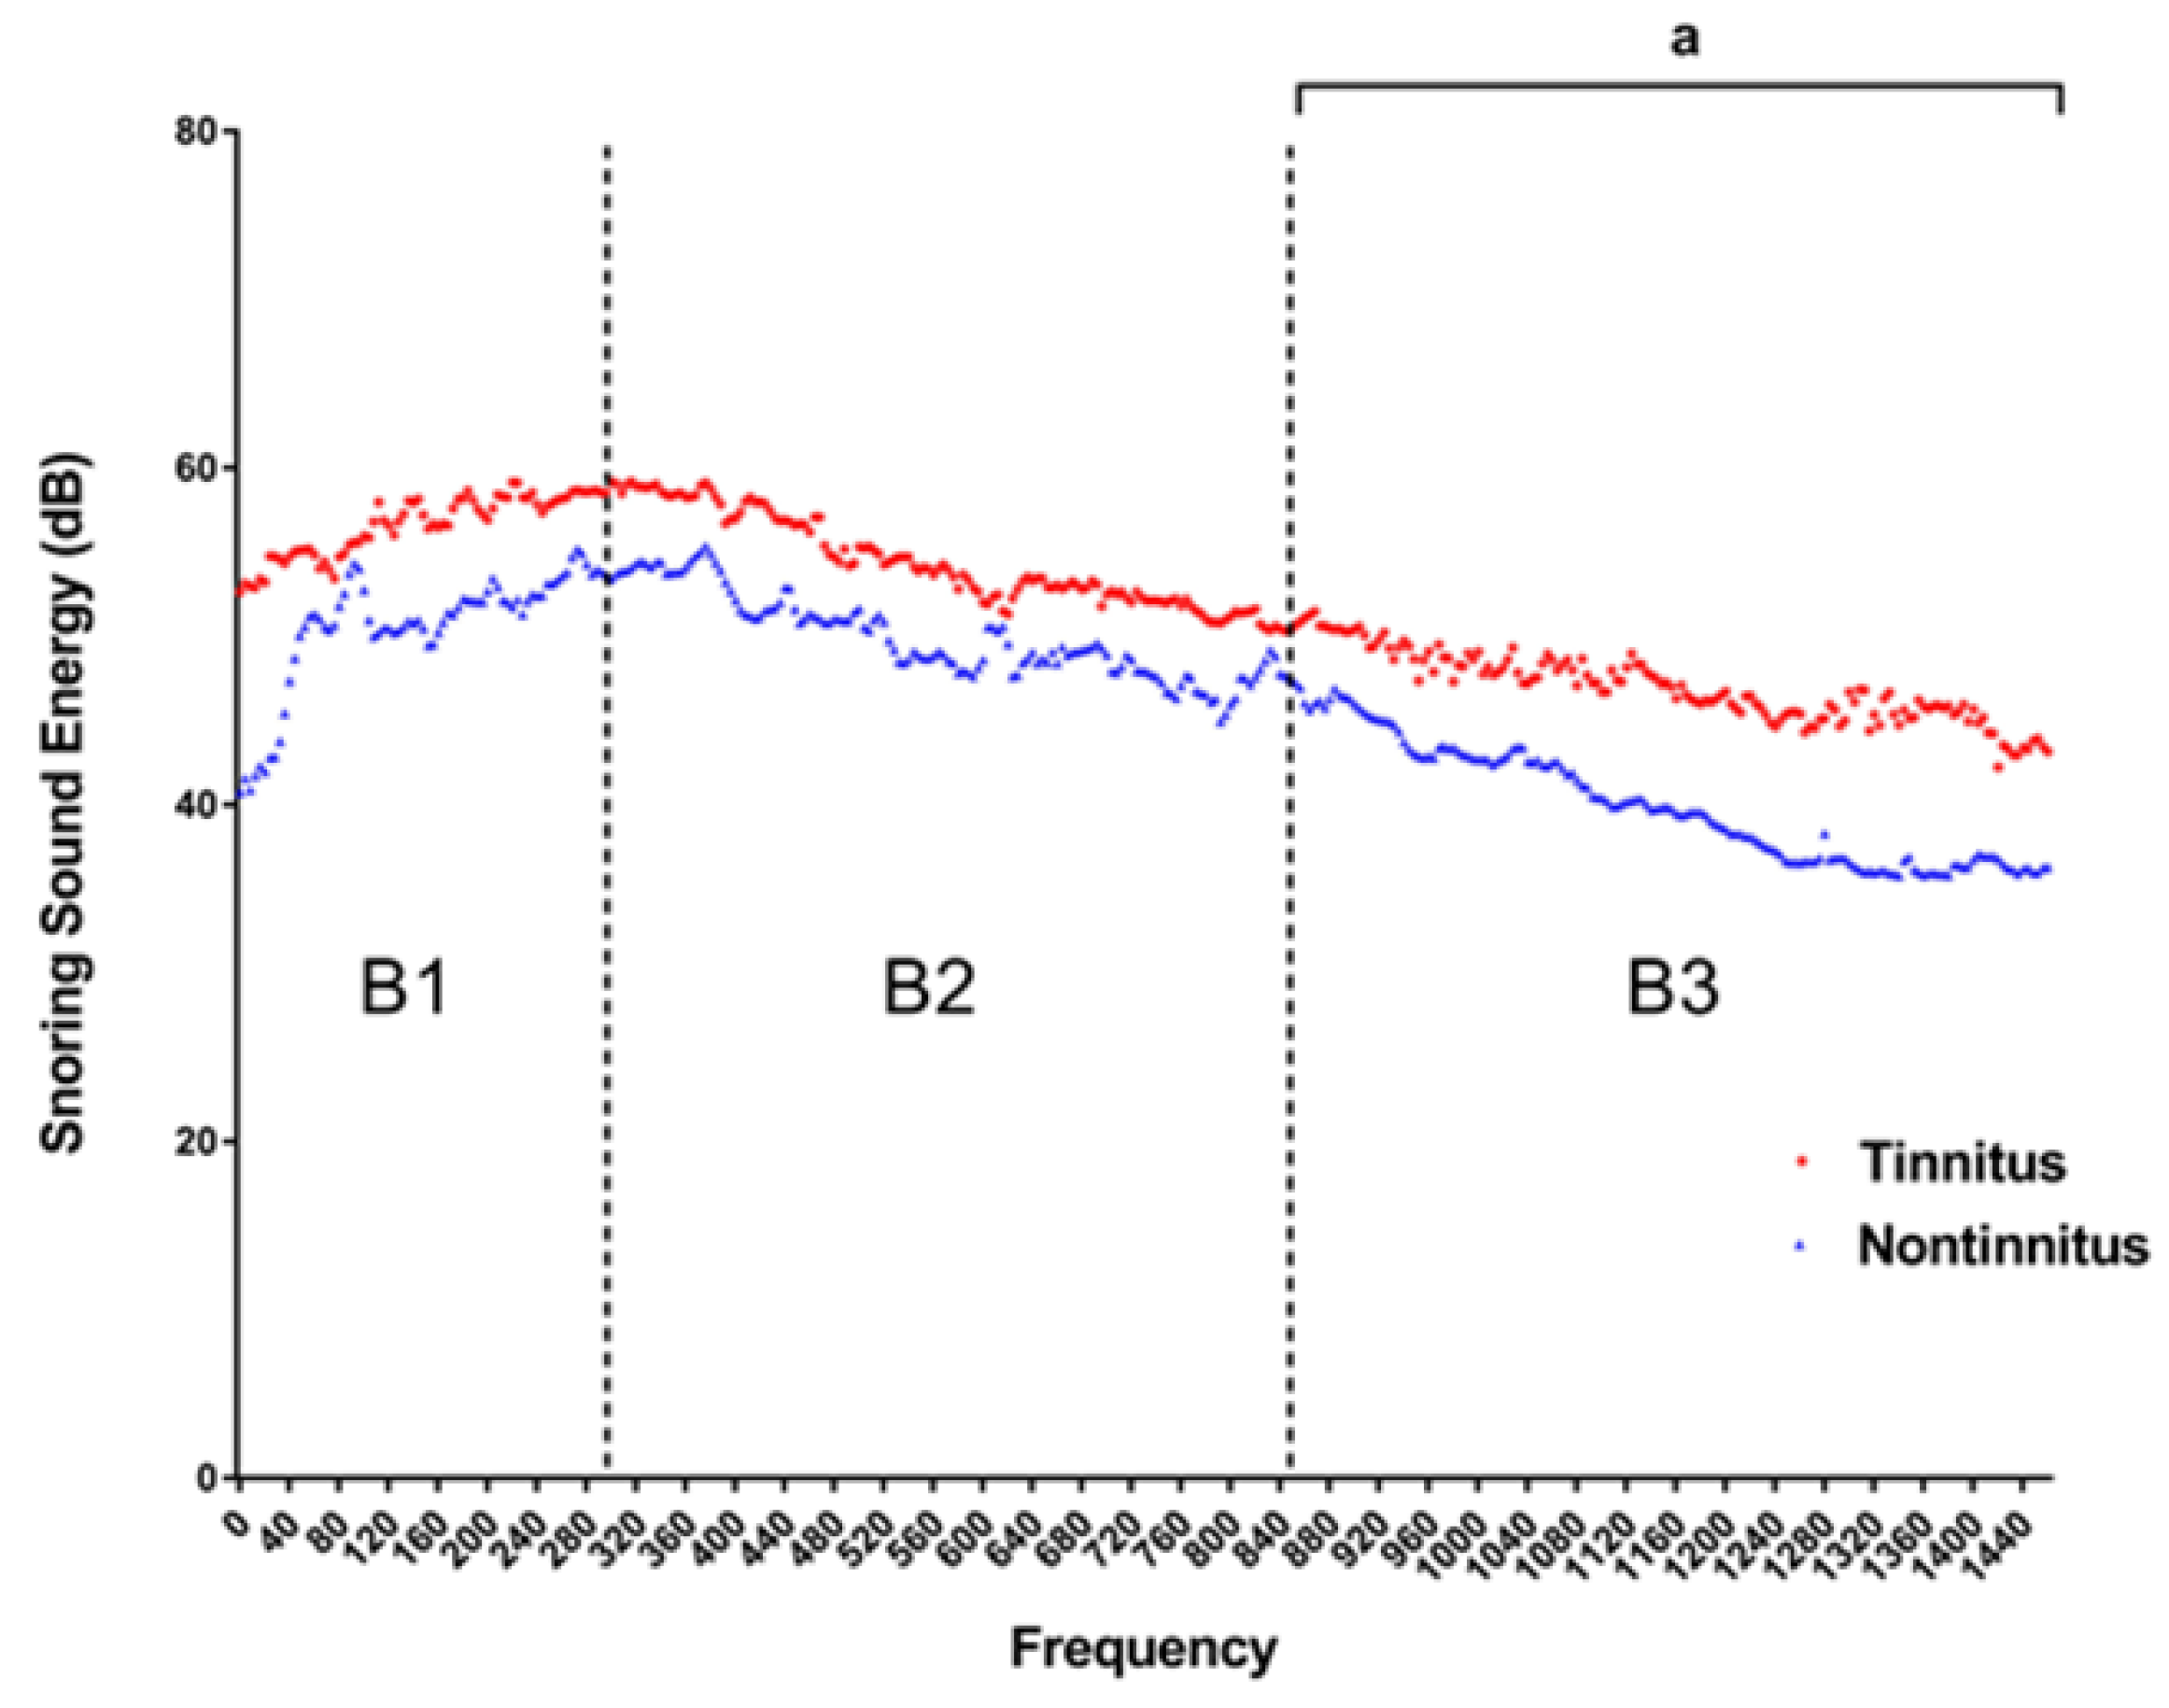
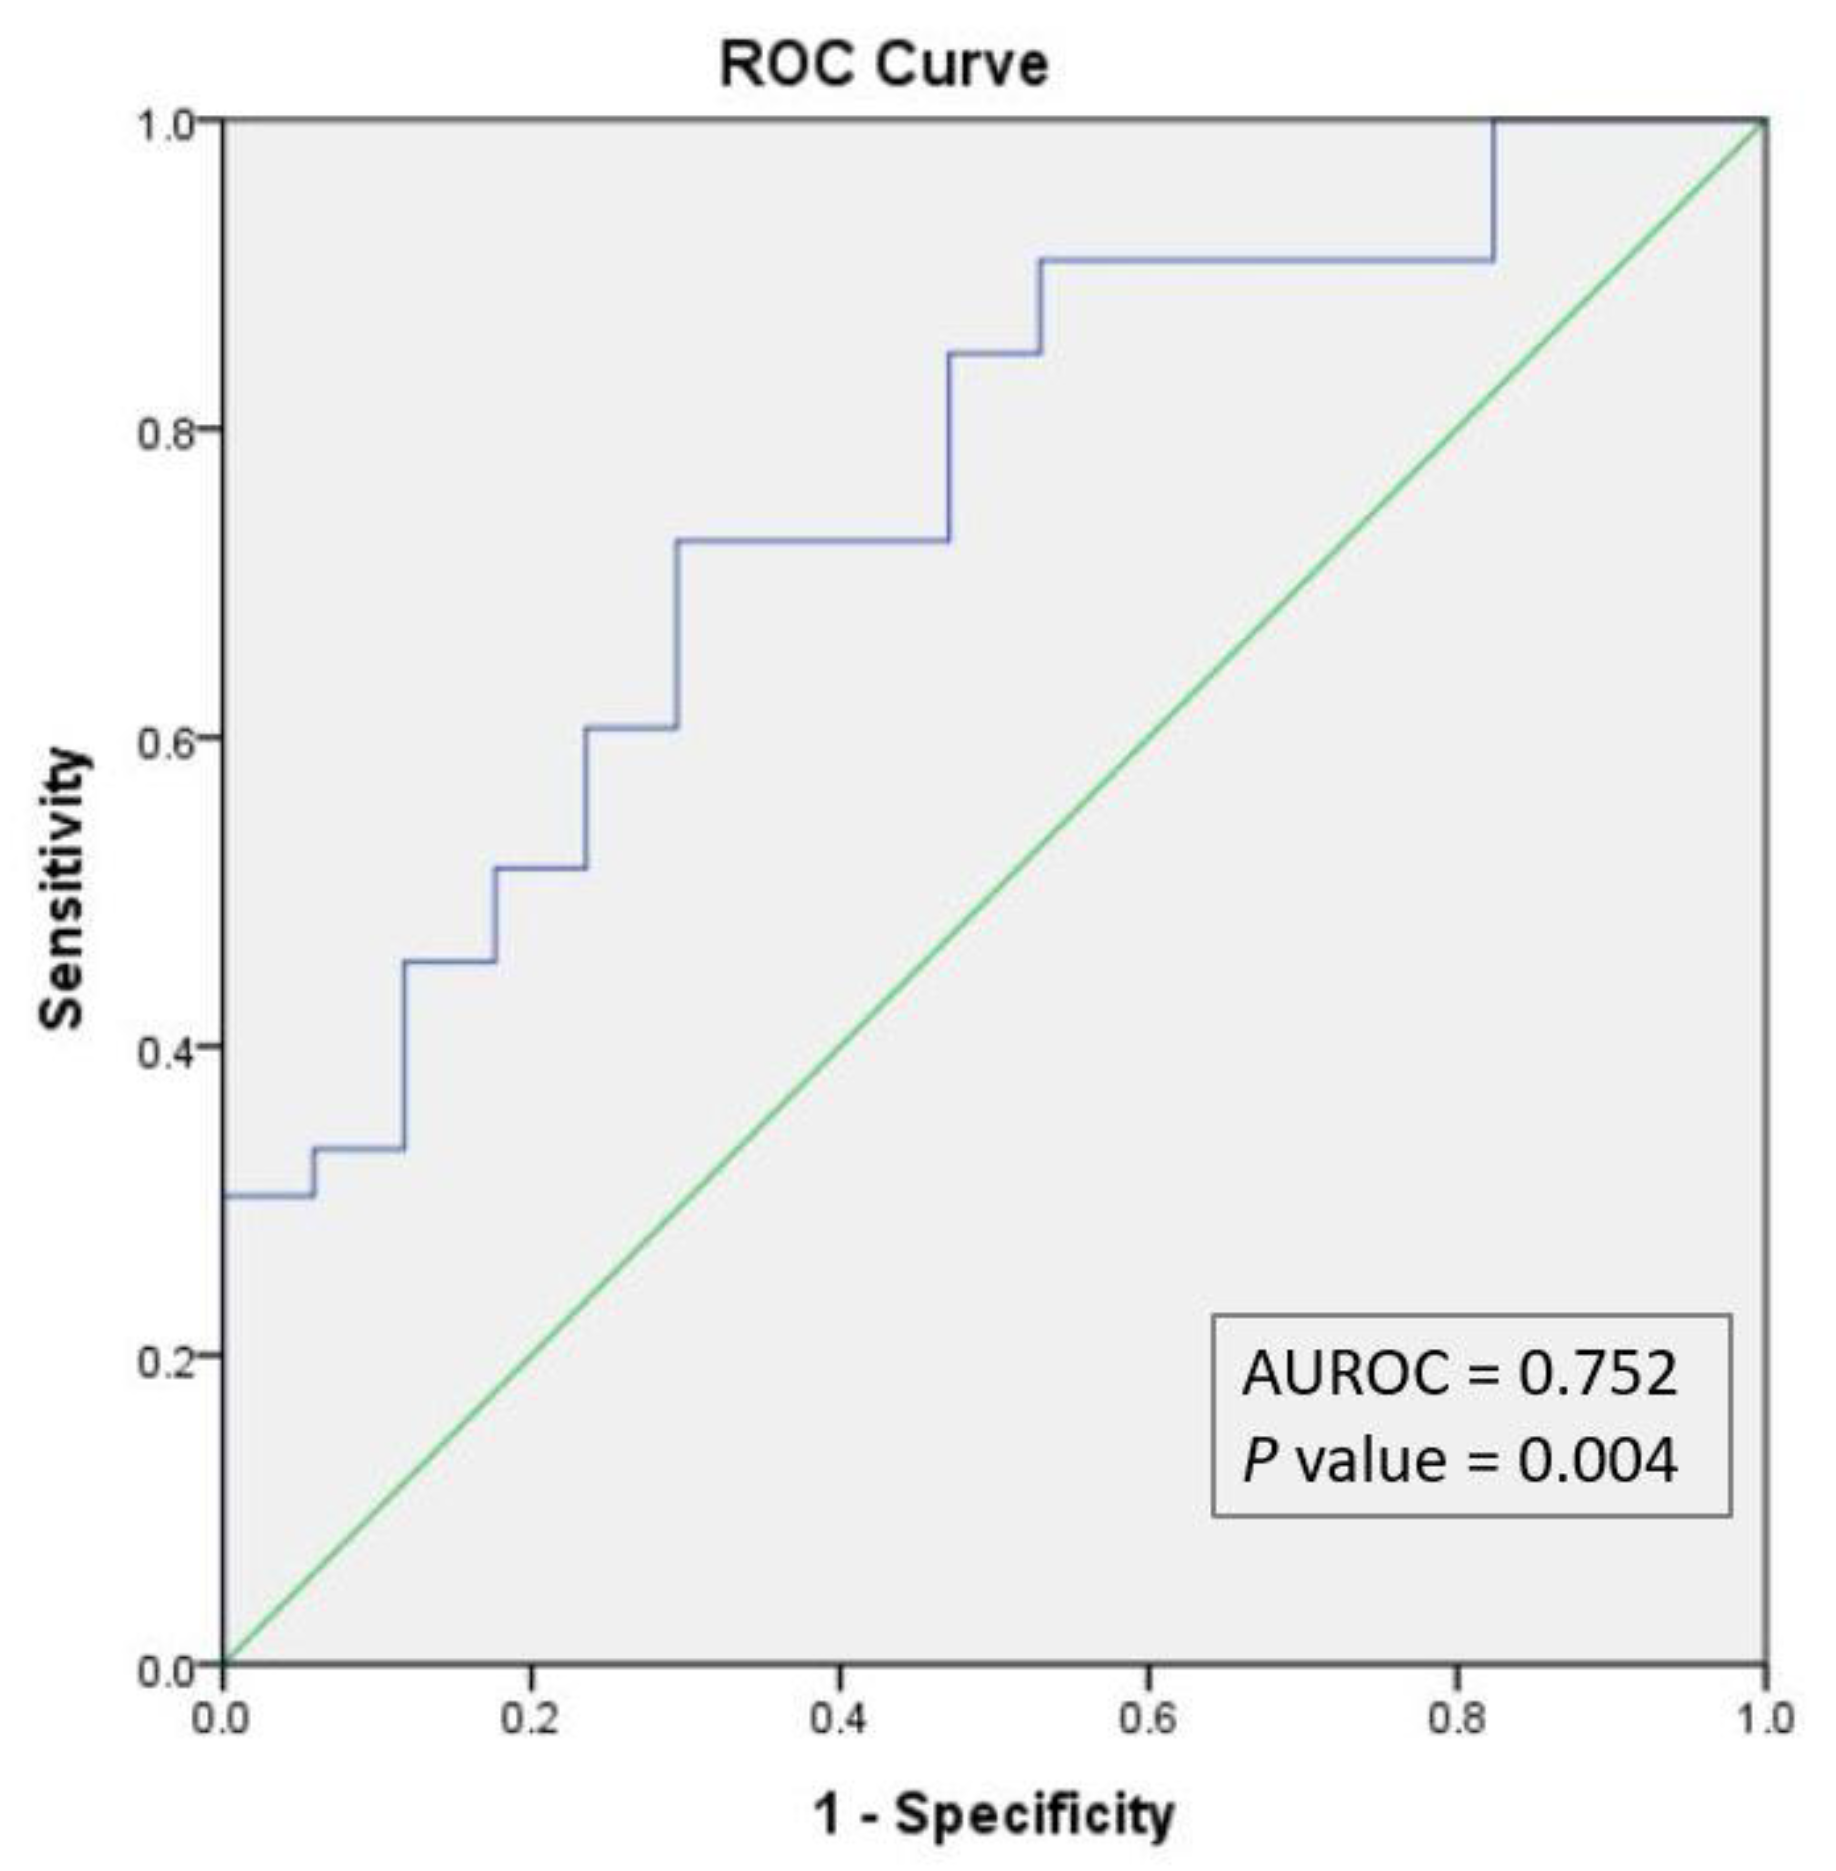
3.3. Tinnitus and Snoring Sound Energy
4. Discussion
5. Conclusions
Author Contributions
Funding
Institutional Review Board Statement
Informed Consent Statement
Data Availability Statement
Acknowledgments
Conflicts of Interest
References
- Martines, F.; Ballacchino, A.; Sireci, F.; Mucia, M.; La Mattina, E.; Rizzo, S.; Salvago, P. Audiologic profile of OSAS and simple snoring patients: The effect of chronic nocturnal intermittent hypoxia on auditory function. Eur. Arch. Otorhinolaryngol. 2016, 273, 1419–1424. [Google Scholar] [CrossRef] [PubMed]
- Deniz, M.; Çiftçi, Z.; Ersözlü, T.; Gültekin, E.; Alp, R. The evaluation of auditory system in obstructive sleep apnea syndrome (OSAS) patients. Am. J. Otolaryngol. 2016, 37, 299–303. [Google Scholar] [CrossRef] [PubMed]
- Hwang, J.H.; Chen, J.C.; Hsu, C.J.; Liu, T.C. Association of obstructive sleep apnea and auditory dysfunctions in older subjects. Otolaryngol. Head Neck Surg. 2011, 144, 114–119. [Google Scholar] [CrossRef]
- Koo, M.; Hwang, J.H. Risk of tinnitus in patients with sleep apnea: A nationwide, population-based, case-control study. Laryngoscope 2017, 127, 2171–2175. [Google Scholar] [CrossRef] [PubMed]
- Kayabasi, S.; Iriz, A.; Cayonu, M.; Cengiz, B.; Acar, A.; Boynuegri, S.; Mujdeci, B.; Eryilmaz, A. Vestibular functions were found to be impaired in patients with moderate-to-severe obstructive sleep apnea. Laryngoscope 2015, 125, 1244–1248. [Google Scholar] [CrossRef]
- Chen, C.K.; Shen, S.C.; Lee, L.A.; Sun, M.H.; Chen, N.H.; Chuang, L.P.; Li, H.Y. Idiopathic Sudden Sensorineural Hearing Loss in Patients with Obstructive Sleep Apnea. Nat. Sci. Sleep 2021, 13, 1877–1885. [Google Scholar] [CrossRef] [PubMed]
- Bernáth, I.; McNamara, P.; Szternák, N.; Szakács, Z.; Köves, P.; Terray-Horváth, A.; Vida, Z. Hyperviscosity as a possible cause of positive acoustic evoked potential findings in patients with sleep apnea: A dual electrophysiological and hemorheological study. Sleep Med. 2009, 10, 361–367. [Google Scholar] [CrossRef]
- Seo, Y.J.; Ju, H.M.; Lee, S.H.; Kwak, S.H.; Kang, M.J.; Yoon, J.H.; Kim, C.H.; Cho, H.J. Damage of Inner Ear Sensory Hair Cells via Mitochondrial Loss in a Murine Model of Sleep Apnea with Chronic Intermittent Hypoxia. Sleep 2017, 40, 1–7. [Google Scholar] [CrossRef]
- Chopra, A.; Jung, M.; Kaplan, R.C.; Appel, D.W.; Dinces, E.A.; Dhar, S.; Zee, P.C.; Gonzalez, F.; Lee, D.J.; Ramos, A.R.; et al. Sleep Apnea Is Associated with Hearing Impairment: The Hispanic Community Health Study/Study of Latinos. J. Clin. Sleep Med. 2016, 12, 719–726. [Google Scholar] [CrossRef]
- Lee, G.S.; Lee, L.A.; Wang, C.Y.; Chen, N.H.; Fang, T.J.; Huang, C.G.; Cheng, W.N.; Li, H.Y. The Frequency and Energy of Snoring Sounds Are Associated with Common Carotid Artery Intima-Media Thickness in Obstructive Sleep Apnea Patients. Sci. Rep. 2016, 6, 30559. [Google Scholar] [CrossRef]
- Witmans, M.B.; Keens, T.G.; Davidson Ward, S.L.; Marcus, C.L. Obstructive hypopneas in children and adolescents: Normal values. Am. J. Respir. Crit. Care Med. 2003, 168, 1540. [Google Scholar] [CrossRef] [PubMed]
- Lee, L.A.; Yu, J.F.; Lo, Y.L.; Chen, Y.S.; Wang, D.L.; Cho, C.M.; Ni, Y.L.; Chen, N.H.; Fang, T.J.; Huang, C.G.; et al. Energy types of snoring sounds in patients with obstructive sleep apnea syndrome: A preliminary observation. PLoS ONE 2012, 7, e53481. [Google Scholar] [CrossRef] [PubMed]
- Lu, C.T.; Li, H.Y.; Lee, G.S.; Huang, Y.S.; Huang, C.G.; Chen, N.H.; Lee, L.A. Snoring sound energy as a potential biomarker for disease severity and surgical response in childhood obstructive sleep apnoea: A pilot study. Clin. Otolaryngol. 2019, 44, 47–52. [Google Scholar] [CrossRef] [PubMed]
- Chuang, H.H.; Liu, C.H.; Wang, C.Y.; Lo, Y.L.; Lee, G.S.; Chao, Y.P.; Li, H.Y.; Kuo, T.B.; Yang, C.C.; Shyu, L.Y.; et al. Snoring Sound Characteristics are Associated with Common Carotid Artery Profiles in Patients with Obstructive Sleep Apnea. Nat. Sci. Sleep 2021, 13, 1243–1255. [Google Scholar] [CrossRef] [PubMed]
- Casale, M.; Vesperini, E.; Potena, M.; Pappacena, M.; Bressi, F.; Baptista, P.J.; Salvinelli, F. Is obstructive sleep apnea syndrome a risk factor for auditory pathway? Sleep Breath. Schlaf Atmung 2012, 16, 413–417. [Google Scholar] [CrossRef]
- Matsumura, E.; Matas, C.G.; Sanches, S.G.; Magliaro, F.C.; Pedreño, R.M.; Genta, P.R.; Lorenzi-Filho, G.; Carvallo, R.M. Severe obstructive sleep apnea is associated with cochlear function impairment. Sleep Breath. Schlaf Atmung 2018, 22, 71–77. [Google Scholar] [CrossRef]
- Henry, J.A.; Dennis, K.C.; Schechter, M.A. General review of tinnitus: Prevalence, mechanisms, effects, and management. J. Speech Lang. Hear. Res. 2005, 48, 1204–1235. [Google Scholar] [CrossRef]
- Tunkel, D.E.; Bauer, C.A.; Sun, G.H.; Rosenfeld, R.M.; Chandrasekhar, S.S.; Cunningham, E.R., Jr.; Archer, S.M.; Blakley, B.W.; Carter, J.M.; Granieri, E.C.; et al. Clinical practice guideline: Tinnitus. Otolaryngol. Head Neck Surg. 2014, 151 (Suppl. S2), S1–S40. [Google Scholar] [CrossRef]
- McCormack, A.; Edmondson-Jones, M.; Somerset, S.; Hall, D. A systematic review of the reporting of tinnitus prevalence and severity. Hear. Res. 2016, 337, 70–79. [Google Scholar] [CrossRef]
- Langguth, B.; Kreuzer, P.M.; Kleinjung, T.; De Ridder, D. Tinnitus: Causes and clinical management. Lancet Neurol. 2013, 12, 920–930. [Google Scholar] [CrossRef]
- Rauschecker, J.P.; May, E.S.; Maudoux, A.; Ploner, M. Frontostriatal Gating of Tinnitus and Chronic Pain. Trends Cogn. Sci. 2015, 19, 567–578. [Google Scholar] [CrossRef] [PubMed]
- Lee, S.J.; Kang, H.W.; Lee, L.H. The relationship between the Epworth Sleepiness Scale and polysomnographic parameters in obstructive sleep apnea patients. Eur. Arch. Otorhinolaryngol. 2012, 269, 1143–1147. [Google Scholar] [CrossRef] [PubMed]
- Cho, J.G.; Witting, P.K.; Verma, M.; Wu, B.J.; Shanu, A.; Kairaitis, K.; Amis, T.C.; Wheatley, J.R. Tissue vibration induces carotid artery endothelial dysfunction: A mechanism linking snoring and carotid atherosclerosis? Sleep 2011, 34, 751–757. [Google Scholar] [CrossRef] [PubMed]
- Sutinen, P.; Zou, J.; Hunter, L.L.; Toppila, E.; Pyykkö, I. Vibration-induced hearing loss: Mechanical and physiological aspects. Otol. Neurotol. 2007, 28, 171–177. [Google Scholar] [CrossRef] [PubMed]
- Ekin, S.; Turan, M.; Arısoy, A.; Gunbatar, H.; Sunnetcioglu, A.; Asker, S.; Yıldız, H. Is There a Relationship between Obstructive Sleep Apnea (OSA) and Hearing Loss? Med. Sci. Monit. Int. Med. J. Exp. Clin. Res. 2016, 22, 3124–3128. [Google Scholar] [CrossRef] [PubMed]
- Rahangdale, S.; Campana, L.; Malhotra, A. Not so good vibrations. Commentary on Lee et al. Heavy snoring as a cause of carotid artery atherosclerosis. SLEEP 2008;31(9):1207–1213. Sleep 2008, 31, 1204–1205. [Google Scholar]


| Variables | Tinnitus (n = 33) | Non-Tinnitus (n = 17) | p Value |
|---|---|---|---|
| Demographic data | |||
| Age (years) | 41 (37–48) | 41 (38–46) | 0.84 |
| BMI (kg/m2) | 26.4 (23.8–29.7) | 26.3 (24.0–29.5) | 0.97 |
| Tinnitus data | |||
| THI (0–100) | 6 (2–19) | - | - |
| Pitch mapping (n, %) | 25 (25/33, 75.8%) | - | - |
| 8000 Hz (n, %) | 13 (13/25, 52.0%) | - | - |
| 125–6000 Hz (n, %) | 12 (12/25, 48.0%) | - | - |
| Polysomnography data | |||
| AHI (events/h) | 31.9 (12.3–49.0) | 24.9 (18.9–50.5) | 0.81 |
| Mean SpO2 (%) | 93.0 (91.0–94.0) | 94.0 (92.0–95.0) | 0.37 |
| Lowest SpO2 (%) | 76.0 (65.0–79.0) | 73.0 (71.5–82.0) | 0.98 |
| ESS (0–24) | 11.0 (8.5–15) | 8.0 (6.0–11.0) | 0.01 a |
| Tinnitus (n = 33) | Non-Tinnitus (n = 17) | p Value | |
|---|---|---|---|
| OSA severity | 0.23 | ||
| Mild, n (%) | 9 (27.3%) | 3 (17.6%) | |
| Moderate, n (%) | 6 (18.2%) | 7 (41.2%) | |
| Severe, n (%) | 18 (54.5%) | 7 (41.2%) |
| Tinnitus (n = 33) | Non-Tinnitus (n = 17) | p Value | |
|---|---|---|---|
| SEE of B1 domain (dB) | 55.7 (50.6–62.6) | 53.0 (48.5–63.8) | 0.43 |
| SEE of B2 domain (dB) | 54.4 (49.9–59.2) | 51.5 (46.3–59.6) | 0.36 |
| SEE of B3 domain (dB) | 46.8 (43.2–54.5) | 42.1 (36.2–47.8) | 0.04 a |
| Variables | Univariate Analysis | Multivariate Analysis | ||
|---|---|---|---|---|
| OR (95% CI) | p Value | OR (95% CI) | p Value | |
| AHI | 1.00 (0.97–1.03) | 0.86 | - | - |
| Mean SpO2 | 0.85 (0.63–1.13) | 0.25 | - | - |
| Lowest SpO2 | 0.05 (0.00–56.48) | 0.40 | - | - |
| Epworth sleepiness scale | 1.25 (1.04–1.50) | 0.02 a | 1.22 (1.01–1.46) | 0.04 a |
| SEE of B3 domain | 1.09 (1.00–1.18) | 0.045 a | 1.07 (0.99–1.16) | 0.11 |
Publisher’s Note: MDPI stays neutral with regard to jurisdictional claims in published maps and institutional affiliations. |
© 2022 by the authors. Licensee MDPI, Basel, Switzerland. This article is an open access article distributed under the terms and conditions of the Creative Commons Attribution (CC BY) license (https://creativecommons.org/licenses/by/4.0/).
Share and Cite
Lu, C.-T.; Lee, L.-A.; Lee, G.-S.; Li, H.-Y. Obstructive Sleep Apnea and Auditory Dysfunction—Does Snoring Sound Play a Role? Diagnostics 2022, 12, 2374. https://doi.org/10.3390/diagnostics12102374
Lu C-T, Lee L-A, Lee G-S, Li H-Y. Obstructive Sleep Apnea and Auditory Dysfunction—Does Snoring Sound Play a Role? Diagnostics. 2022; 12(10):2374. https://doi.org/10.3390/diagnostics12102374
Chicago/Turabian StyleLu, Chun-Ting, Li-Ang Lee, Guo-She Lee, and Hsueh-Yu Li. 2022. "Obstructive Sleep Apnea and Auditory Dysfunction—Does Snoring Sound Play a Role?" Diagnostics 12, no. 10: 2374. https://doi.org/10.3390/diagnostics12102374
APA StyleLu, C.-T., Lee, L.-A., Lee, G.-S., & Li, H.-Y. (2022). Obstructive Sleep Apnea and Auditory Dysfunction—Does Snoring Sound Play a Role? Diagnostics, 12(10), 2374. https://doi.org/10.3390/diagnostics12102374