
Simultaneously Monitoring Whole Corneal Injury with Corneal Optical Density and Thickness in Patients Undergoing Cataract Surgery

 , ,
, , 
Abstract
:1. Introduction
2. Materials and Methods
2.1. Study Design
2.2. Surgical Procedure
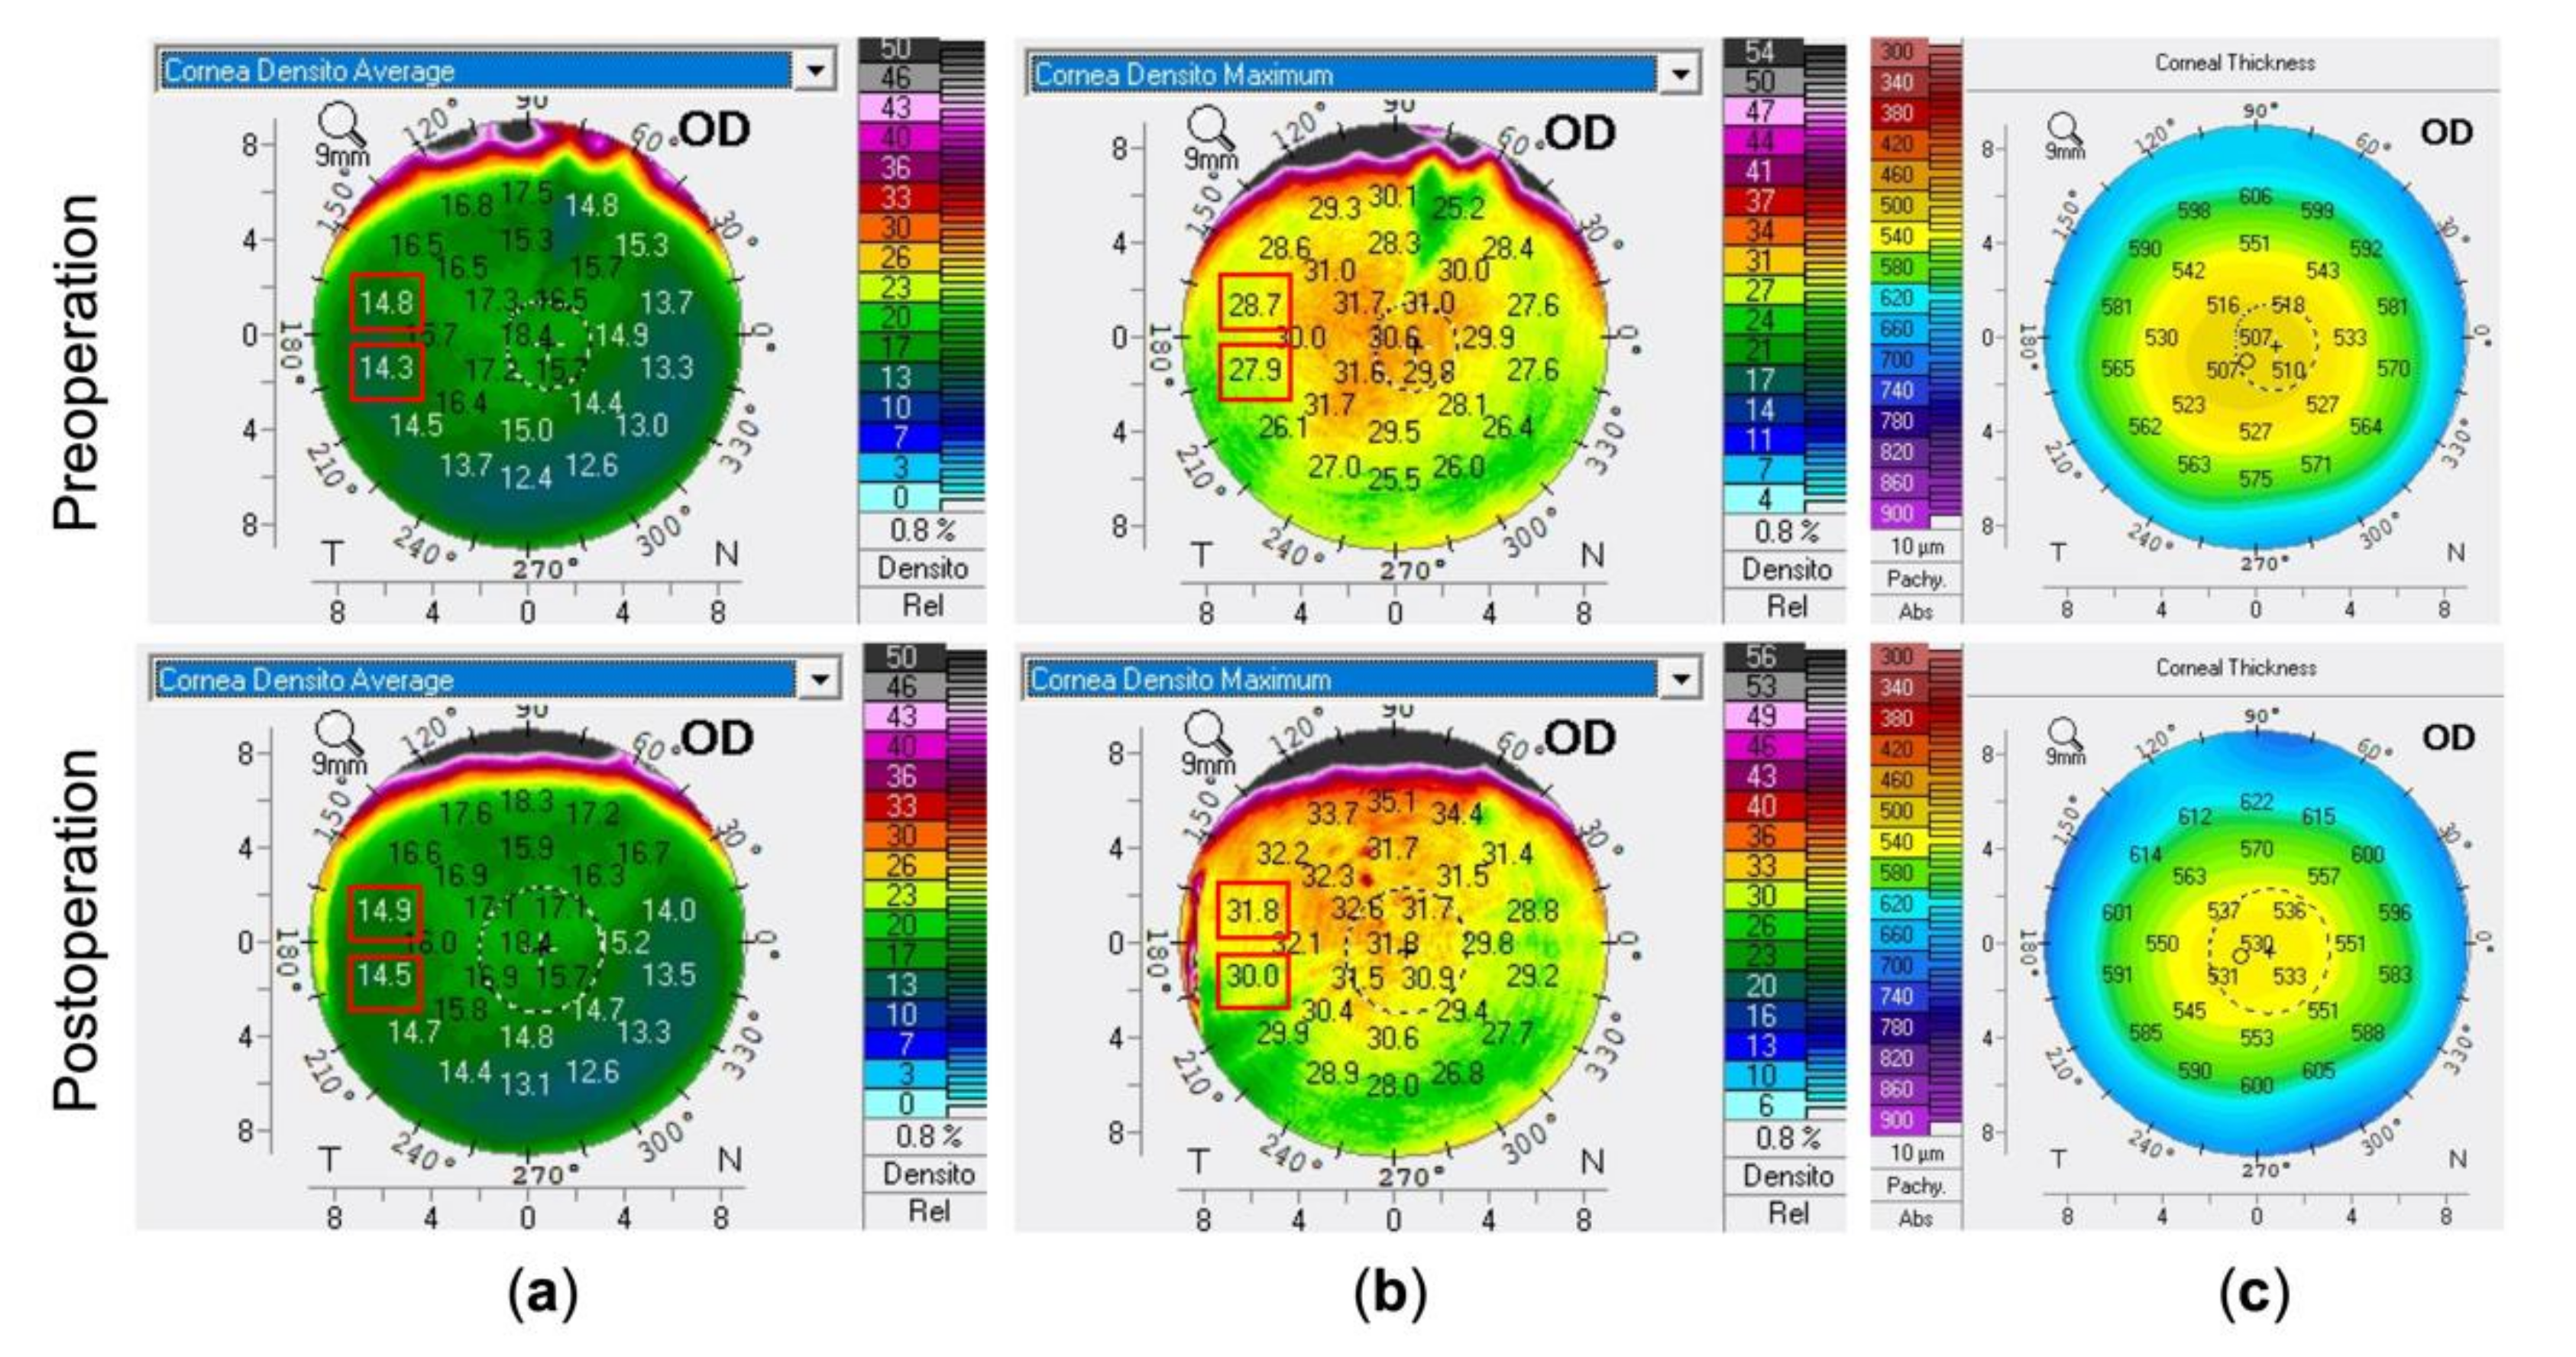
2.3. Pre- and Post-Operative Assessment
2.4. Sample Size Determination
2.5. Statistical Analysis
3. Results
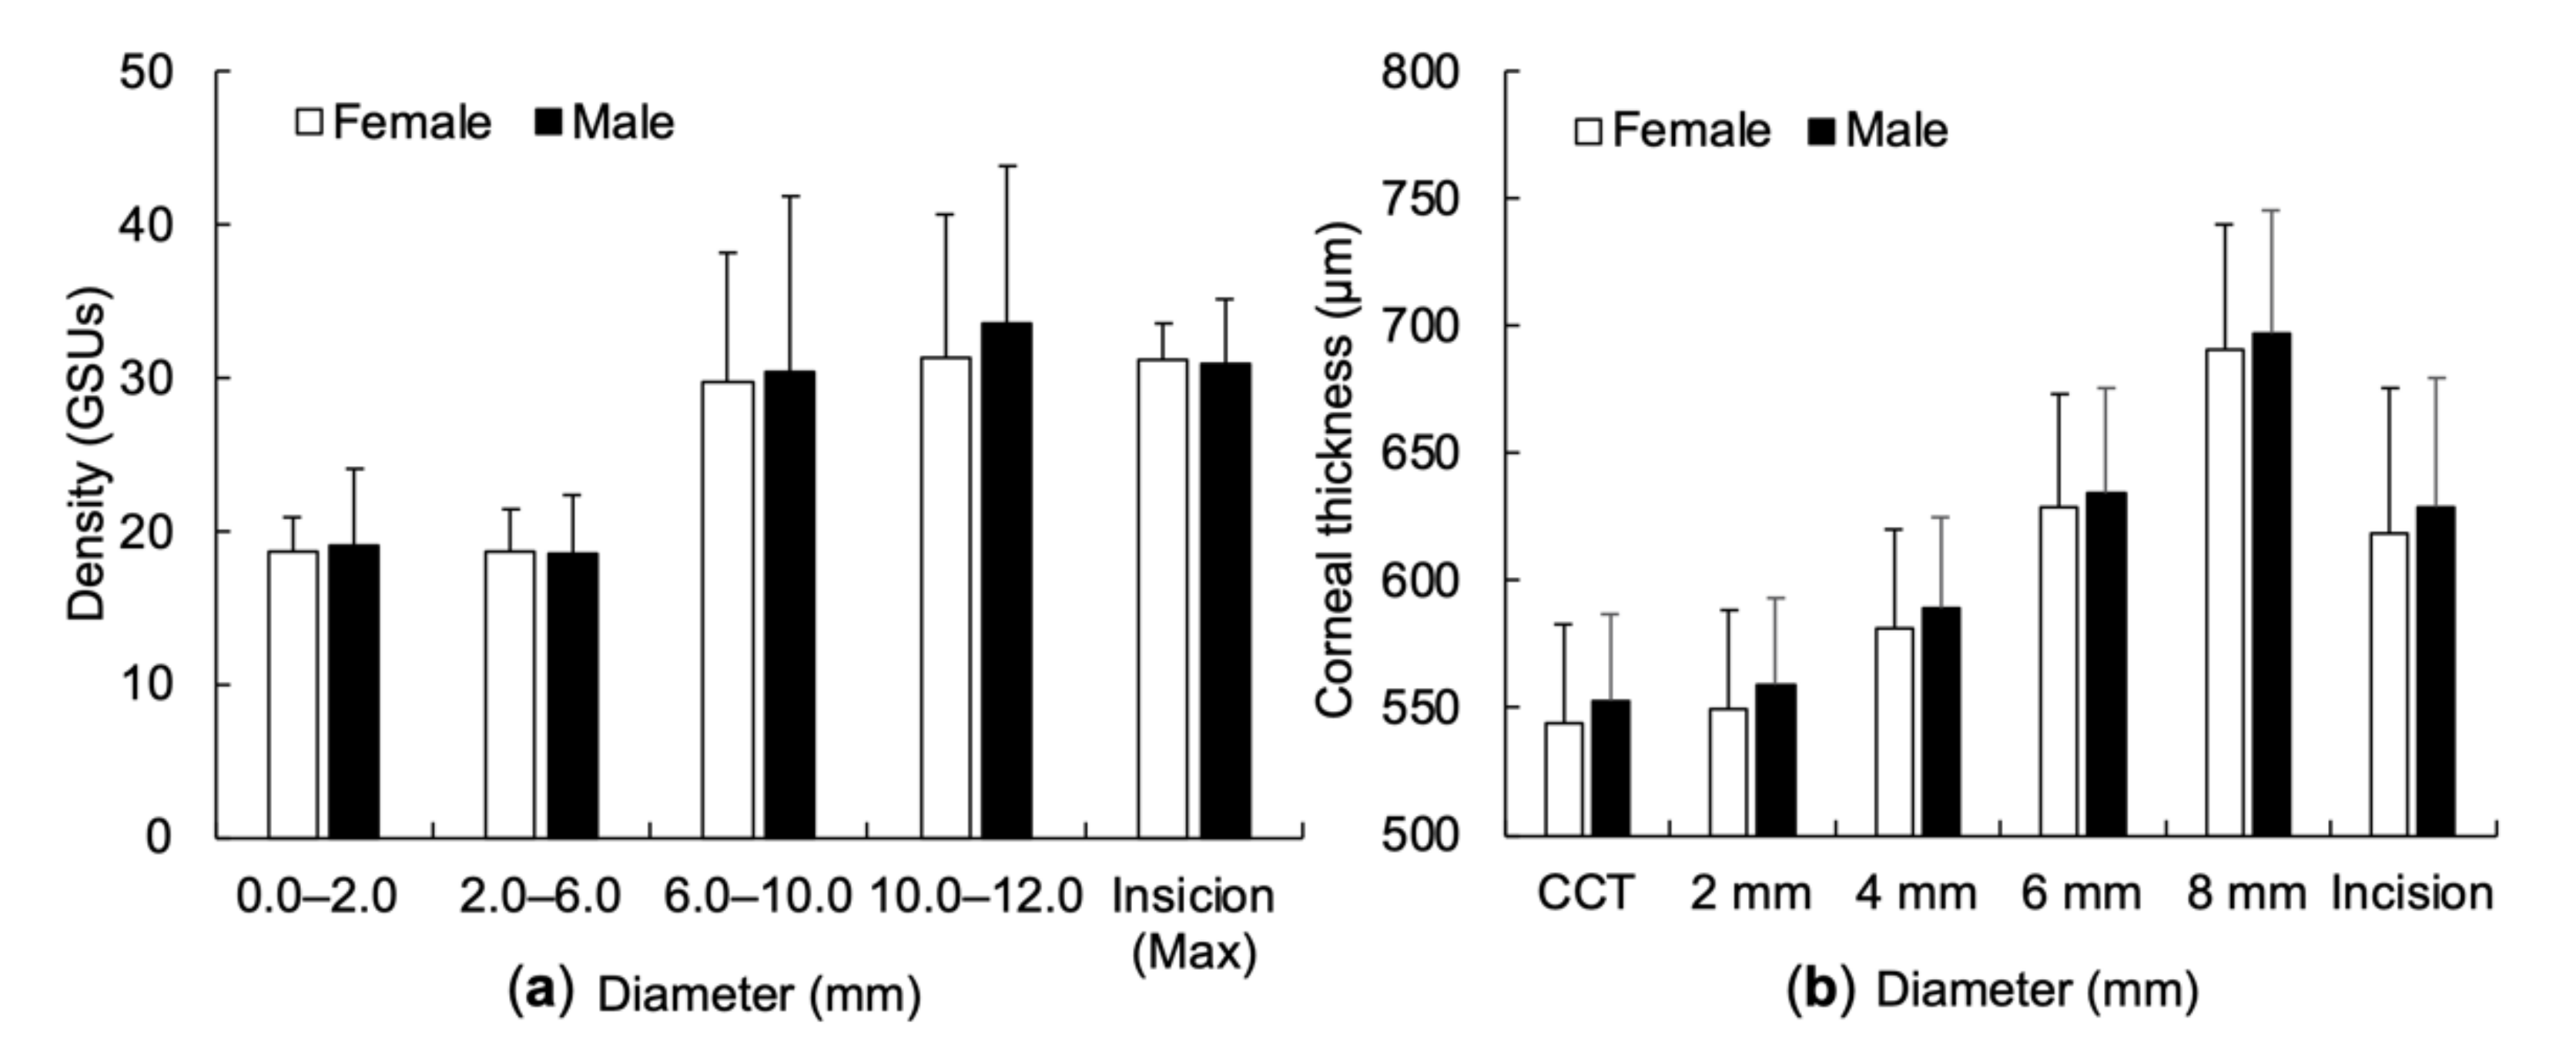
3.1. Participants
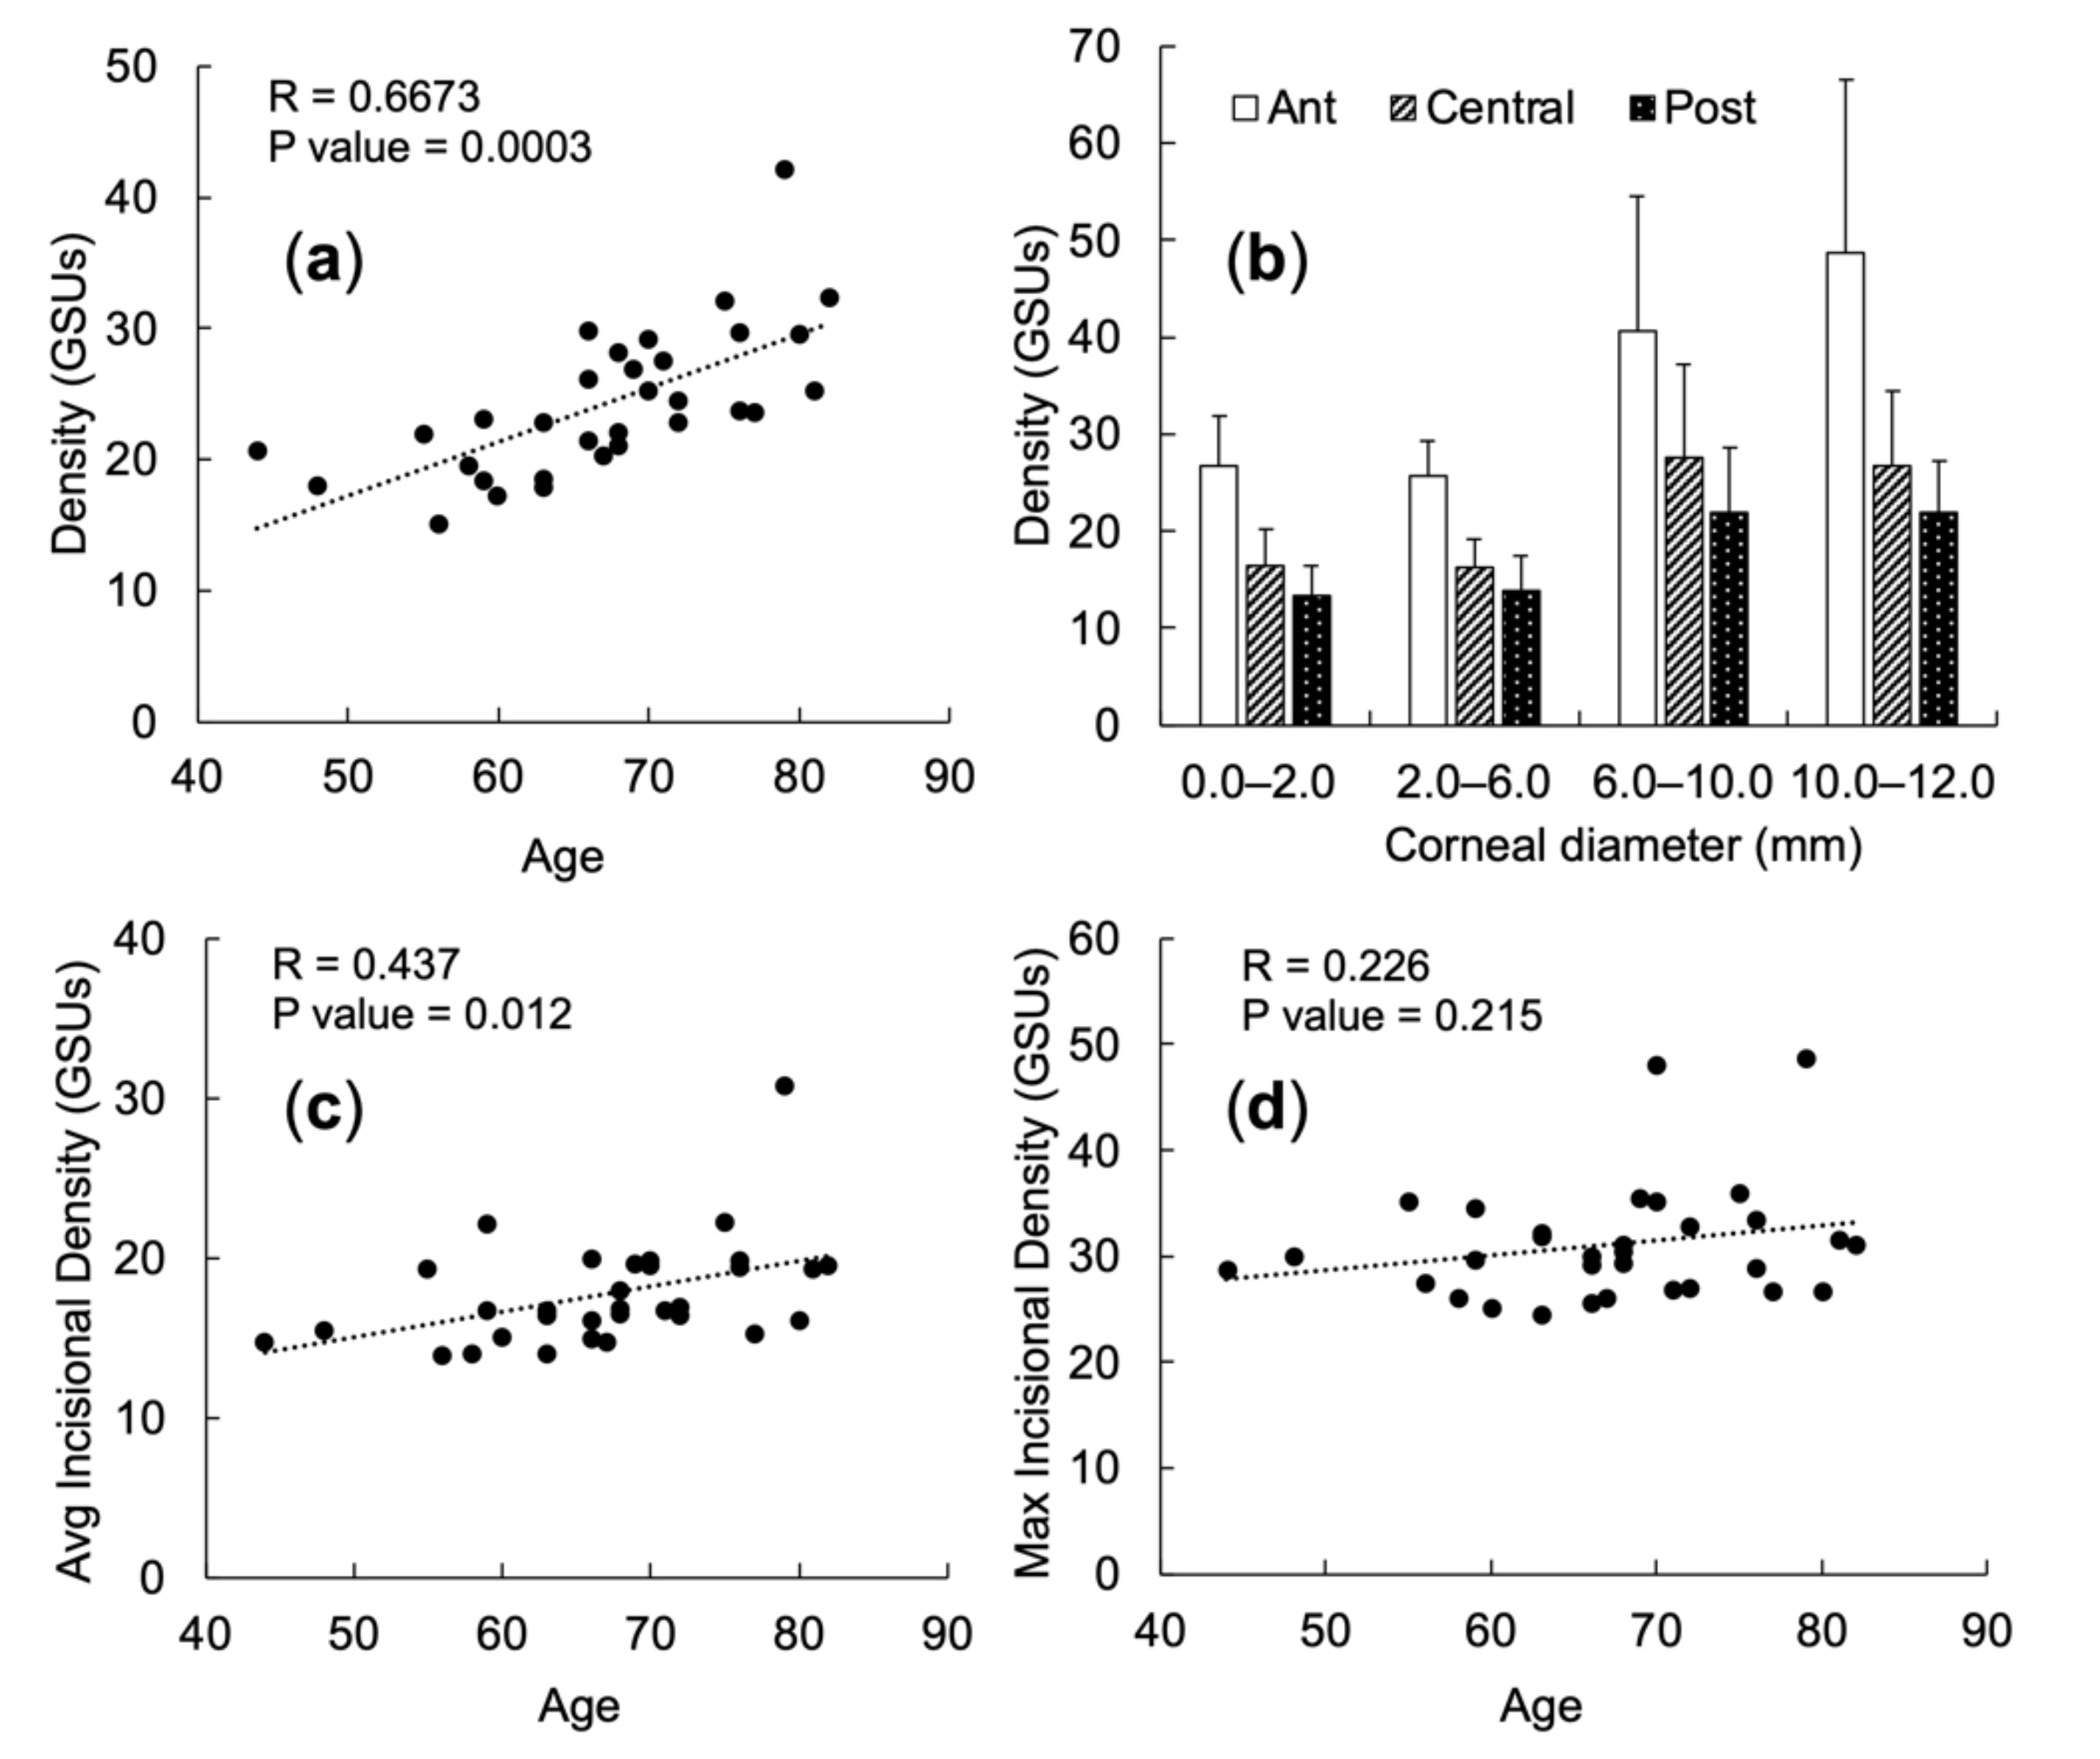
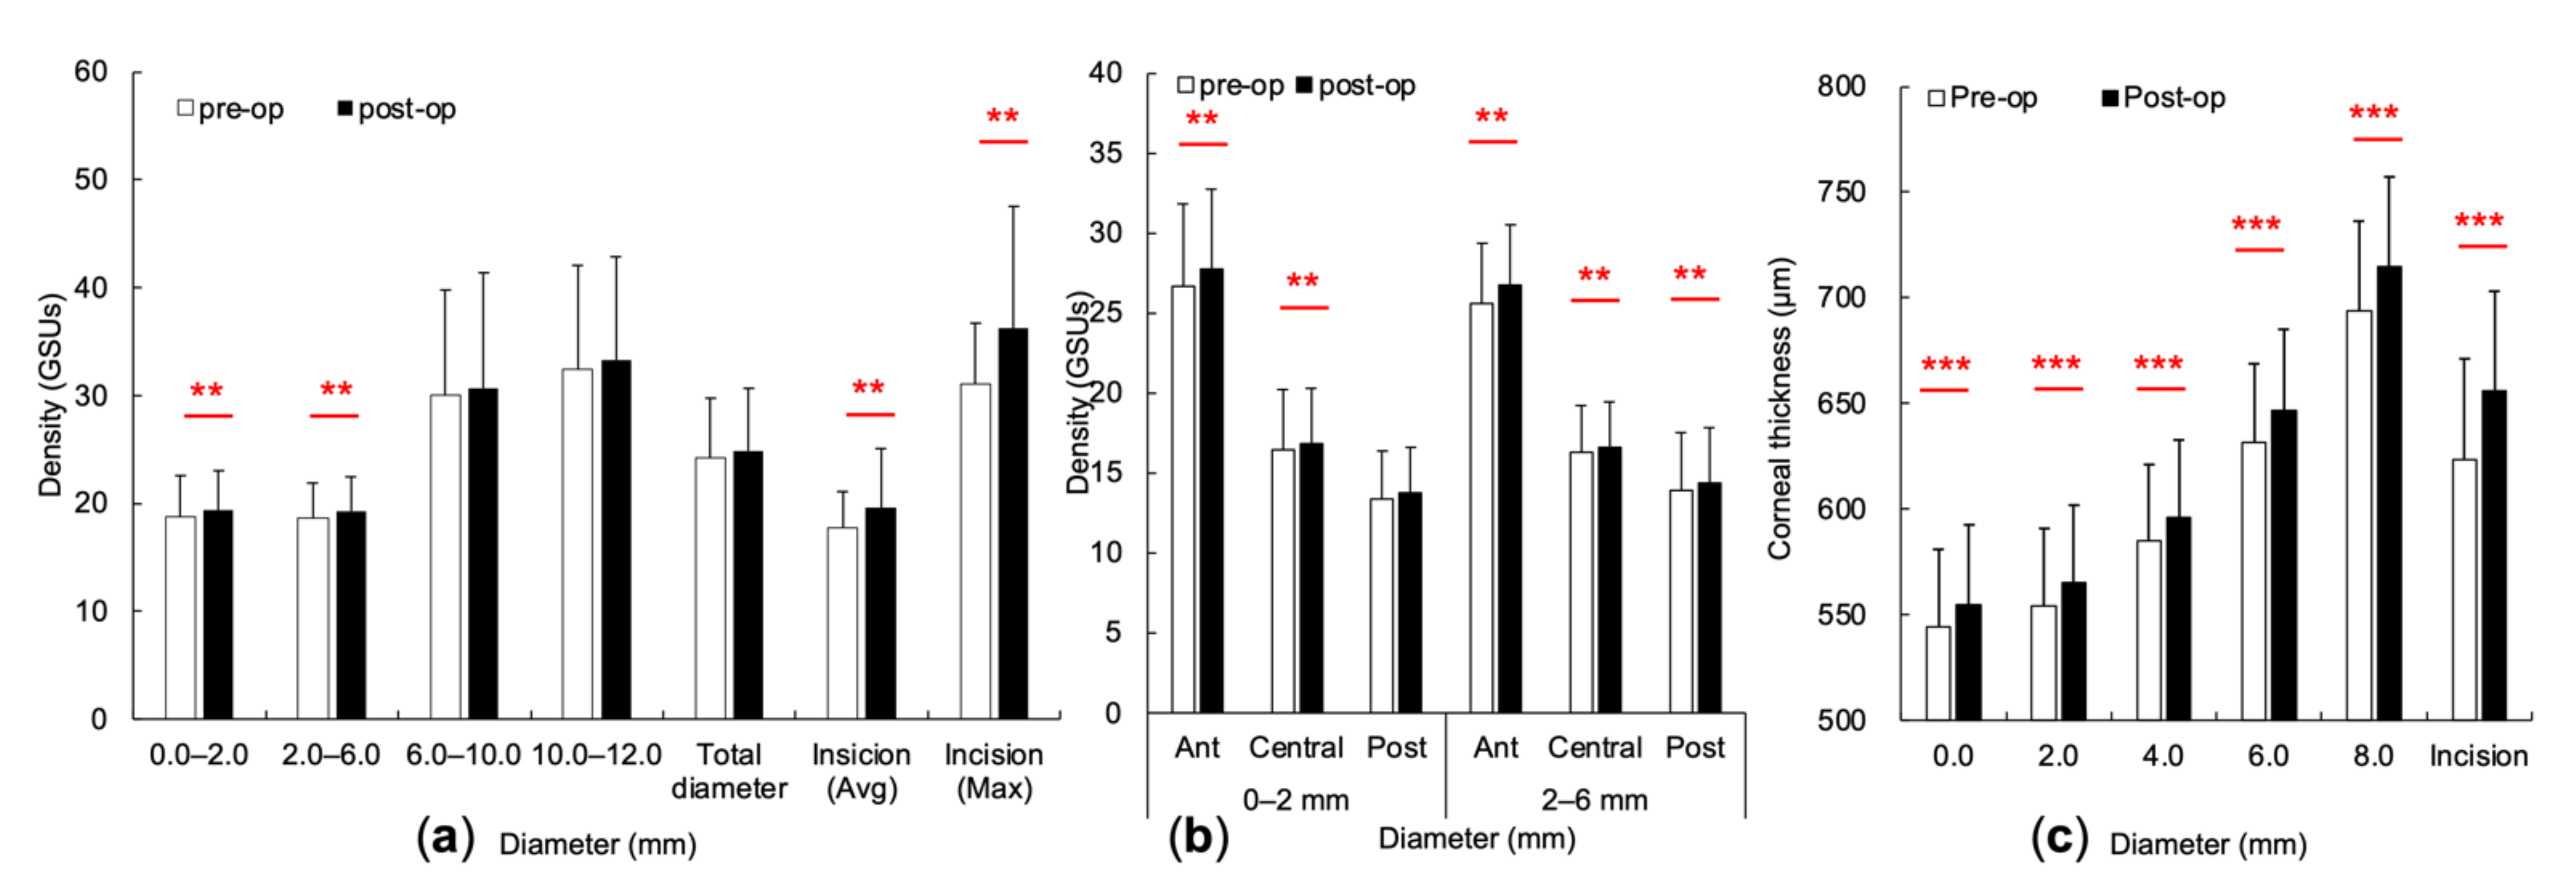
3.2. Changes of the CODs and CTs at Concentric Annuli and Incisional Site
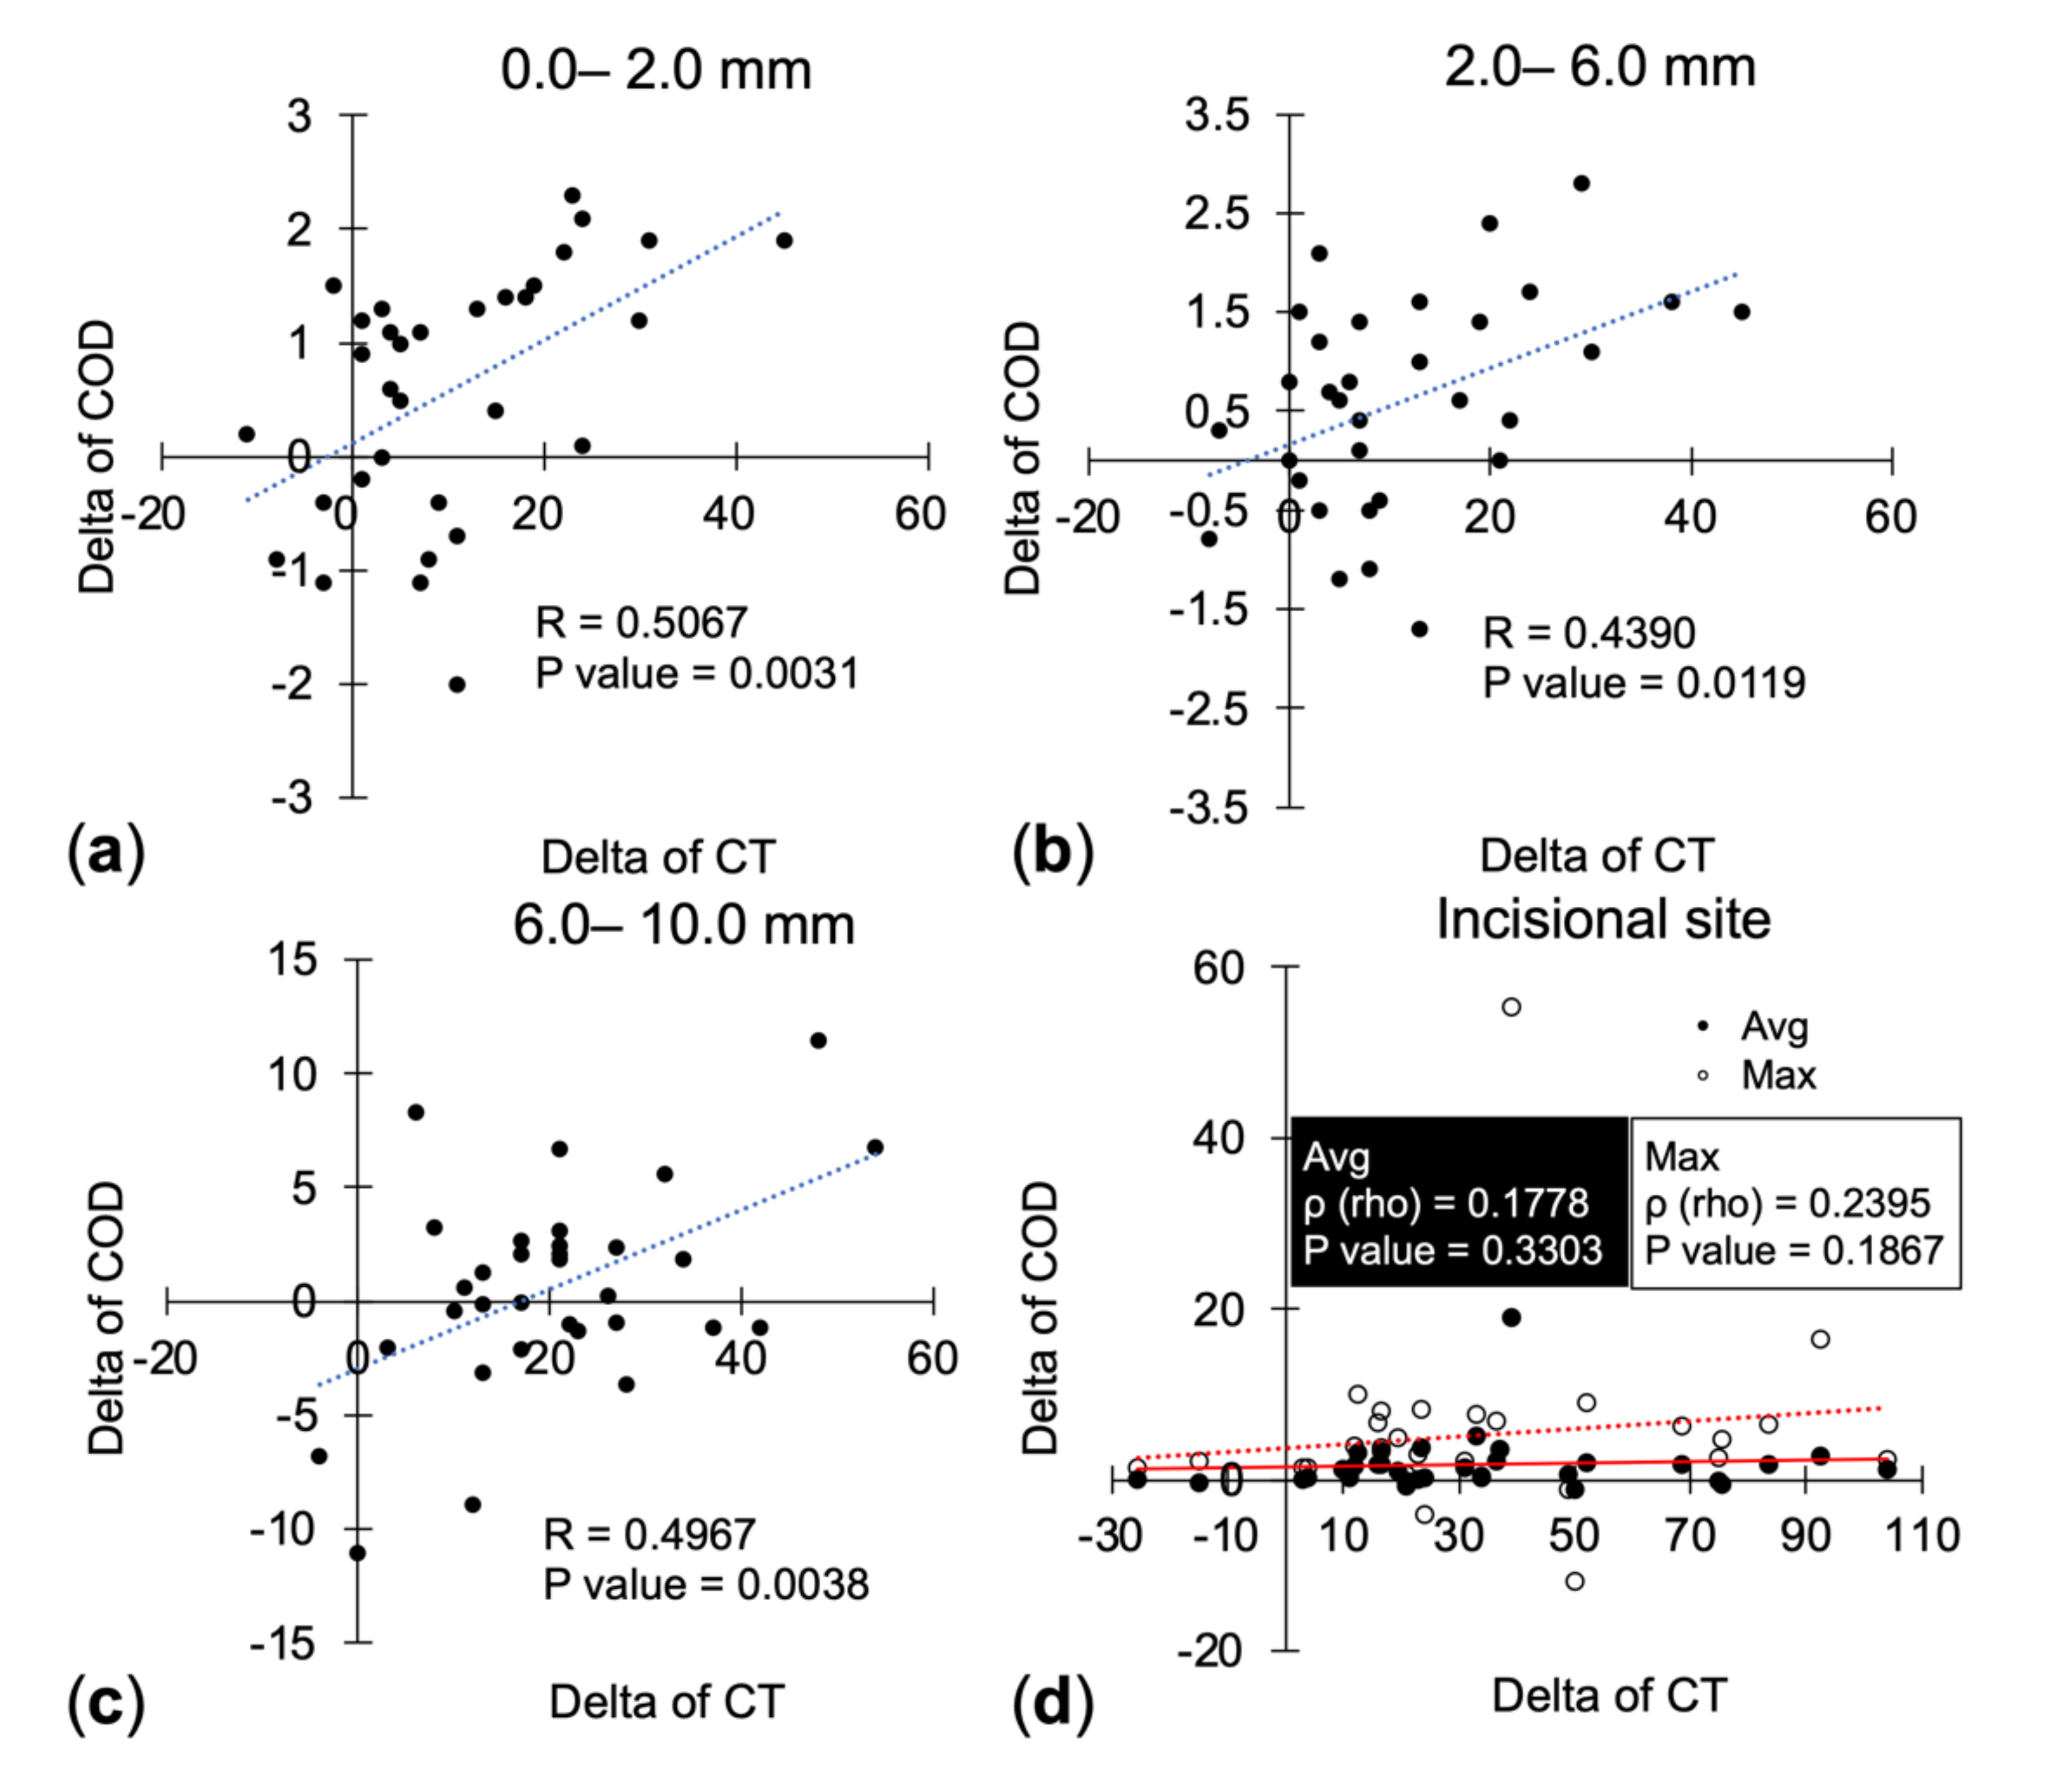
3.3. Correlation between CODs’ and CTs’ Changes
4. Discussion
5. Conclusions
Supplementary Materials
Author Contributions
Funding
Institutional Review Board Statement
Informed Consent Statement
Data Availability Statement
Acknowledgments
Conflicts of Interest
References
- Prokofyeva, E.; Wegener, A.; Zrenner, E. Cataract prevalence and prevention in Europe: A literature review. Acta Ophthalmol. 2013, 91, 395–405. [Google Scholar] [CrossRef] [PubMed]
- Toro, M.D.; Brézin, A.P.; Burdon, M.; Cummings, A.B.; Evren Kemer, O.; Malyugin, B.E.; Prieto, I.; Teus, M.A.; Tognetto, D.; Törnblom, R.; et al. Early impact of COVID-19 outbreak on eye care: Insights from EUROCOVCAT group. Eur. J. Ophthalmol. 2021, 31, 5–9. [Google Scholar] [CrossRef]
- Tognetto, D.; Brézin, A.P.; Cummings, A.B.; Malyugin, B.E.; Evren Kemer, O.; Prieto, I.; Rejdak, R.; Teus, M.A.; Törnblom, R.; Toro, M.D.; et al. Rethinking Elective Cataract Surgery Diagnostics, Assessments, and Tools after the COVID-19 Pandemic Experience and Beyond: Insights from the EUROCOVCAT Group. Diagnostics 2020, 10, 1035. [Google Scholar] [CrossRef]
- Chen, X.; Ji, Y.; Lu, Y. Comparison of clear corneal incision injuries between torsional and conventional phacoemulsification. Graefes Arch. Clin. Exp. Ophthalmol. 2013, 251, 2147–2154. [Google Scholar] [CrossRef] [PubMed]
- Cennamo, G.; Montorio, D.; Del Prete, S.; Del Prete, A.; Cennamo, G. Anterior-Segment Optical Coherence Tomography and Scanning Electron Microscopy to Evaluate Corneal Epithelial Changes in Patients Undergoing Glaucoma Therapy. Cornea 2018, 37, 1522–1526. [Google Scholar] [CrossRef]
- Tuft, S.J.; Coster, D.J. The corneal endothelium. Eye 1990, 4, 389–424. [Google Scholar] [CrossRef]
- Hillenaar, T.; Cals, R.H.; Eilers, P.H.; Wubbels, R.J.; van Cleynenbreugel, H.; Remeijer, L. Normative database for corneal backscatter analysis by in vivo confocal microscopy. Invest. Ophthalmol. Vis. Sci. 2011, 52, 7274–7281. [Google Scholar] [CrossRef]
- Wong, M.M.; Shukla, A.N.; Munir, W.M. Correlation of corneal thickness and volume with intraoperative phacoemulsification parameters using Scheimpflug imaging and optical coherence tomography. J. Cataract Refract. Surg. 2014, 40, 2067–2075. [Google Scholar] [CrossRef] [PubMed]
- Wongchaisuwat, N.; Metheetrairat, A.; Chonpimai, P.; Nujoi, W.; Prabhasawat, P.; Nujoi, W.; Prabhasawat, P. Comparison of central corneal thickness measurements in corneal edema using ultrasound pachymetry, Visante anterior-segment optical coherence tomography, Cirrus optical coherence tomography, and Pentacam Scheimpflug camera tomography. Clin. Ophthalmol. 2018, 12, 1865–1873. [Google Scholar] [CrossRef] [Green Version]
- O’Donnell, C.; Maldonado-Codina, C. Agreement and repeatability of central thickness measurement in normal corneas using ultrasound pachymetry and the OCULUS Pentacam. Cornea 2005, 24, 920–924. [Google Scholar] [CrossRef]
- Mishima, S. Clinical investigations on the corneal endothelium-XXXVIII Edward Jackson Memorial Lecture. Am. J. Ophthalmol. 1982, 93, 1–29. [Google Scholar] [CrossRef]
- Garg, P.; Gupta, A.; Tandon, N.; Raj, P. Dry Eye Disease after Cataract Surgery: Study of its Determinants and Risk Factors. Turk. J. Ophthalmol. 2020, 50, 133–142. [Google Scholar] [CrossRef]
- Toro, M.D.; Longo, A.; Avitabile, T.; Nowomiejska, K.; Gagliano, C.; Tripodi, S.; Choragiewicz, T.; Kaminska, A.; Figus, M.; Posarelli, C.; et al. Five-year follow-up of secondary iris-claw intraocular lens implantation for the treatment of aphakia: Anterior chamber versus retropupillary implantation. PLoS ONE 2019, 14, e0214140. [Google Scholar] [CrossRef]
- Sharma, N.; Gupta, S.; Maharana, P.; Shanmugam, P.; Nagpal, R.; Vajpayee, R.B. Anterior Segment Optical Coherence Tomography-Guided Management Algorithm for Descemet Membrane Detachment After Intraocular Surgery. Cornea 2015, 34, 1170–1174. [Google Scholar] [CrossRef]
- Ishikawa, S.; Kato, N.; Takeuchi, M. Quantitative evaluation of corneal epithelial edema after cataract surgery using corneal densitometry: A prospective study. BMC Ophthalmol. 2018, 18, 334. [Google Scholar] [CrossRef] [PubMed]
- Kuerten, D.; Plange, N.; Koch, E.C.; Koutsonas, A.; Walter, P.; Fuest, M. Central corneal thickness determination in corneal edema using ultrasound pachymetry, a Scheimpflug camera, and anterior segment OCT. Graefes Arch. Clin. Exp. Ophthalmol. 2015, 253, 1105–1109. [Google Scholar] [CrossRef]
- AnswerMine. Available online: https://www.answerminer.com/calculators/correlation-test/. (accessed on 10 September 2020).
- Ní Dhubhghaill, S.; Rozema, J.J.; Jongenelen, S.; Ruiz Hidalgo, I.; Zakaria, N.; Tassignon, M.J. Normative values for corneal densitometry analysis by Scheimpflug optical assessment. Invest. Ophthalmol. Vis. Sci. 2014, 55, 162–168. [Google Scholar] [CrossRef] [Green Version]
- Garzón, N.; Poyales, F.; Illarramendi, I.; Mendicute, J.; Jáñez, Ó.; Caro, P.; López, A.; Argüeso, F. Corneal densitometry and its correlation with age, pachymetry, corneal curvature, and refraction. Int. Ophthalmol. 2017, 37, 1263–1268. [Google Scholar] [CrossRef]
- Ang, M.; Baskaran, M.; Werkmeister, R.M.; Chua, J.; Schmidl, D.; Santos, V.A.D.; Garhöfer, G.; Mehta, J.S.; Schmetterer, L. Anterior segment optical coherence tomography. Prog. Retin. Eye Res. 2018, 66, 132–156. [Google Scholar] [CrossRef] [PubMed]
- Galgauskas, S.; Juodkaite, G.; Tutkuvienė, J. Age-related changes in central corneal thickness in normal eyes among the adult Lithuanian population. Clin. Interv. Aging. 2014, 9, 1145–1151. [Google Scholar] [CrossRef] [Green Version]
- Vitályos, G.; Kolozsvári, B.L.; Németh, G.; Losonczy, G.; Hassan, Z.; Pásztor, D.; Fodor, M. Effects of aging on corneal parameters measured with Pentacam in healthy subjects. Sci. Rep. 2019, 9, 3419. [Google Scholar] [CrossRef] [PubMed]
- Asfuroglu, Y.; Kemer, O.E. Central corneal thickness and corneal volume changes in eyes with and without pseudoexfoliation after uneventful phacoemulsification. Int. Ophthalmol. 2019, 39, 275–280. [Google Scholar] [CrossRef]
- Wu, Z.; Wang, Y.; Zhang, L.; Wu, D.; Wei, S.; Su, X. Distribution of corneal densitometry and its correlation with ocular stray light in healthy eyes. Zhonghua yan ke za zhi Chin. J. Ophthalmol. 2014, 50, 20–26. [Google Scholar]
- Fukuda, S.; Kawana, K.; Yasuno, Y.; Oshika, T. Wound architecture of clear corneal incision with or without stromal hydration observed with 3-dimensional optical coherence tomography. Am. J. Ophthalmol. 2011, 151, 413–419.e1. [Google Scholar] [CrossRef]
- Fine, I.H.; Hoffman, R.S.; Packer, M. Profile of clear corneal cataract incisions demonstrated by ocular coherence tomography. J. Cataract Refract. Surg. 2007, 33, 94–97. [Google Scholar] [CrossRef] [PubMed]
- Suzuki, H.; Takahashi, H.; Hori, J.; Hiraoka, M.; Igarashi, T.; Shiwa, T. Phacoemulsification associated corneal damage evaluated by corneal volume. Am. J. Ophthalmol. 2006, 142, 525–528. [Google Scholar] [CrossRef] [PubMed]


| Overall (N = 32) | |
|---|---|
| Age | 67.03 ± 9.18 |
| Sex | |
| Female | 17/32 (53.13%) |
| Male | 15/32 (46.87%) |
| Laterality | |
| OD | 20/32 (62.5%) |
| OS | 12/32 (37.5%) |
| Axial length (mm) | 24.67 ± 2.28 |
| Anterior chamber depth (mm) | 3.04 ± 0.47 |
| Pre-op bare vision (logMAR) | 0.89 ± 0.88 |
| Pre-op best-corrected visual acuity (logMAR) | 0.55 ± 0.77 |
| Post-op bare vision (logMAR) | 0.31 ± 0.66 |
| COD (GSUs) | CT (μm) | r | p Value | |
|---|---|---|---|---|
| Average COD | CT | |||
| Pre-op | 17.78 ± 3.33 | 623.34 ± 53.66 | −0.090 | 0.626 |
| Post-op | 19.65 ± 5.40 | 656.27 ± 67.04 | 0.152 | 0.408 |
| Increment rate | 0.099 ± 0.160 | 0.056 ± 0.041 | 0.069 | 0.706 |
| Maximal COD | CT | |||
| Pre-op | 31.09 ± 5.57 | 623.34 ± 53.66 | −0.080 | 0.663 |
| Post-op | 36.31 ± 11.28 | 656.27 ± 67.04 | 0.217 | 0.232 |
| Increment rate | 0.172 ± 0.296 | 0.056 ± 0.041 | 0.157 | 0.390 |
Publisher’s Note: MDPI stays neutral with regard to jurisdictional claims in published maps and institutional affiliations. |
© 2021 by the authors. Licensee MDPI, Basel, Switzerland. This article is an open access article distributed under the terms and conditions of the Creative Commons Attribution (CC BY) license (https://creativecommons.org/licenses/by/4.0/).
Share and Cite
Hsieh, T.-H.; Yu, H.-J.; Yang, I.-H.; Ho, R.-W.; Hsiao, Y.-T.; Fang, P.-C.; Kuo, M.-T. Simultaneously Monitoring Whole Corneal Injury with Corneal Optical Density and Thickness in Patients Undergoing Cataract Surgery. Diagnostics 2021, 11, 1639. https://doi.org/10.3390/diagnostics11091639
Hsieh T-H, Yu H-J, Yang I-H, Ho R-W, Hsiao Y-T, Fang P-C, Kuo M-T. Simultaneously Monitoring Whole Corneal Injury with Corneal Optical Density and Thickness in Patients Undergoing Cataract Surgery. Diagnostics. 2021; 11(9):1639. https://doi.org/10.3390/diagnostics11091639
Chicago/Turabian StyleHsieh, Tzu-Han, Hun-Ju Yu, I-Hui Yang, Ren-Wen Ho, Yu-Ting Hsiao, Po-Chiung Fang, and Ming-Tse Kuo. 2021. "Simultaneously Monitoring Whole Corneal Injury with Corneal Optical Density and Thickness in Patients Undergoing Cataract Surgery" Diagnostics 11, no. 9: 1639. https://doi.org/10.3390/diagnostics11091639
APA StyleHsieh, T.-H., Yu, H.-J., Yang, I.-H., Ho, R.-W., Hsiao, Y.-T., Fang, P.-C., & Kuo, M.-T. (2021). Simultaneously Monitoring Whole Corneal Injury with Corneal Optical Density and Thickness in Patients Undergoing Cataract Surgery. Diagnostics, 11(9), 1639. https://doi.org/10.3390/diagnostics11091639