
Cord Blood Extracellular Vesicles Analyzed by Flow Cytometry with Thresholding Using 405 nm or 488 nm Laser Leads to Concurrent Results

 , ,
, ,  and
and
Abstract
:1. Introduction
2. Materials and Methods
2.1. Samples
2.2. Materials
2.3. Sample Preparation
2.4. Flow Cytometry Analysis
2.5. Evaluation and Statistics
2.6. Calibration
3. Results
4. Discussion
Supplementary Materials
Author Contributions
Funding
Institutional Review Board Statement
Informed Consent Statement
Data Availability Statement
Acknowledgments
Conflicts of Interest
References
- Welsh, J.A.; Van Der Pol, E.; Arkesteijn, G.J.A.; Bremer, M.; Brisson, A.; Coumans, F.; Dignat-George, F.; Duggan, E.; Ghiran, I.; Giebel, B.; et al. MIFlowCyt-EV: A framework for standardized reporting of extracellular vesicle flow cytometry experiments. J. Extracell. Vesicles 2020, 9, 17. [Google Scholar] [CrossRef]
- Ayers, L.; Kohler, M.; Harrison, P.; Sargent, I.; Dragovic, R.; Schaap, M.; Nieuwland, R.; Brooks, S.A.; Ferry, B. Measurement of circulating cell-derived microparticles by flow cytometry: Sources of variability within the assay. Thromb. Res. 2011, 127, 370–377. [Google Scholar] [CrossRef]
- Lacroix, R.; Judicone, C.; Poncelet, P.; Robert, S.; Arnaud, L.; Sampol, J.; Dignat-George, F. Impact of pre-analytical parameters on the measurement of circulating microparticles: Towards standardization of protocol. J. Thromb. Haemost. 2012, 10, 437–446. [Google Scholar] [CrossRef] [PubMed]
- Hujacova, A.; Brozova, T.; Mosko, T.; Kostelanska, M.; Stranak, Z.; Holada, K. Platelet extracellular vesicles in cord blood of term and preterm newborns assayed by flow cytometry: The effect of delay in sample preparation and of sample freezing. Folia Biol. 2020, 66, 204–211. [Google Scholar]
- Lacroix, R.; Judicone, C.; Mooberry, M.; Boucekine, M.; Key, N.S.; Dignat-George, F.; Workshop, I.S. Standardization of pre-analytical variables in plasma microparticle determination: Results of the International Society on Thrombosis and Haemostasis SSC Collaborative workshop. J. Thromb. Haemost. 2013, 11, 1190–1193. [Google Scholar] [CrossRef]
- Cointe, S.; Judicone, C.; Robert, S.; Mooberry, M.J.; Poncelet, P.; Wauben, M.; Nieuwland, R.; Key, N.S.; Dignat-George, F.; Lacroix, R. Standardization of microparticle enumeration across different flow cytometry platforms: Results of a multicenter collaborative workshop. J. Thromb. Haemost. 2017, 15, 187–193. [Google Scholar] [CrossRef] [PubMed]
- Van Der Pol, E.; Sturk, A.; van Leeuwen, T.; Nieuwland, R.; Coumans, F.; Mobarrez, F.; Arkesteijn, G.; Wauben, M.; Siljander, P.R.; Sánchez-López, V.; et al. Standardization of extracellular vesicle measurements by flow cytometry through vesicle diameter approximation. J. Thromb. Haemost. 2018, 16, 1236–1245. [Google Scholar] [CrossRef] [Green Version]
- Welsh, J.A.; Horak, P.; Wilkinson, J.S.; Ford, V.J.; Jones, J.C.; Smith, D.; Holloway, J.A.; Englyst, N.A. FCMPASS software aids extracellular vesicle light scatter standardization. Cytom. Part A 2020, 97, 569–581. [Google Scholar] [CrossRef] [PubMed] [Green Version]
- Lötvall, J.; Hill, A.F.; Hochberg, F.; Buzás, E.I.; Di Vizio, D.; Gardiner, C.; Gho, Y.S.; Kurochkin, I.V.; Mathivanan, S.; Quesenberry, P.; et al. Minimal experimental requirements for definition of extracellular vesicles and their functions: A position statement from the International Society for Extracellular Vesicles. J. Extracell. Vesicles 2014, 3, 26913. [Google Scholar] [CrossRef]
- Thery, C.; Witwer, K.W.; Aikawa, E.; Alcaraz, M.J.; Anderson, J.D.; Andriantsitohaina, R.; Antoniou, A.; Arab, T.; Archer, F.; Atkin-Smith, G.K.; et al. Minimal information for studies of extracellular vesicles 2018 (MISEV2018): A position statement of the International Society for Extracellular Vesicles and update of the MISEV2014 guidelines. J. Extracell. Vesicles 2018, 7, 43. [Google Scholar] [CrossRef] [Green Version]
- Hujacova, A.S.J.; Pekarkova, K.; Brozova, T.; Kostelanska, M.; Soukup, J.; Mosko, T.; Holada, K.; Stranak, Z. Large platelet and endothelial extracellular vesicles in cord blood of preterm newborns: Correlation with the pres-ence of hemolysis. Diagnostics 2021. under review. [Google Scholar]
- Simeone, P.; Celia, C.; Bologna, G.; Ercolino, E.; Pierdomenico, L.; Cilurzo, F.; Grande, R.; Diomede, F.; Vespa, S.; Canonico, B.; et al. Diameters and fluorescence calibration for extracellular vesicle analyses by flow cytometry. Int. J. Mol. Sci. 2020, 21, 7885. [Google Scholar] [CrossRef]
- Arraud, N.; Gounou, C.; Turpin, D.; Brisson, A.R. Fluorescence triggering: A general strategy for enumerating and phenotyping extracellular vesicles by flow cytometry. Cytom. Part A 2016, 89A, 184–195. [Google Scholar] [CrossRef] [PubMed]
- Gardiner, C.; Shaw, M.; Hole, P.; Smith, J.; Tannetta, D.; Redman, C.W.; Sargent, I.L. Measurement of refractive index by nanoparticle tracking analysis reveals heterogeneity in extracellular vesicles. J. Extracell. Vesicles 2014, 3, 25361. [Google Scholar] [CrossRef] [PubMed]
- McVey, M.J.; Spring, C.M.; Kuebler, W.M. Improved resolution in extracellular vesicle populations using 405 instead of 488 nm side scatter. J. Extracell. Vesicles 2018, 7, 11. [Google Scholar] [CrossRef] [PubMed]
- Dasgupta, S.K.; Guchhait, P.; Thiagarajan, P. Lactadherin binding and phosphatidylserine expression on cell surface-comparison with annexin A5. Transl. Res. 2006, 148, 19–25. [Google Scholar] [CrossRef] [PubMed]
- Erdbrugger, U.; Rudy, C.K.; Etter, M.E.; Dryden, K.A.; Yeager, M.; Klibanov, A.L.; Lannigan, J. Imaging flow cytometry elucidates limitations of microparticle analysis by conventional flow cytometry. Cytom. Part A 2014, 85A, 756–770. [Google Scholar] [CrossRef]
- Jamaly, S.; Ramberg, C.; Olsen, R.; Latysheva, N.; Webster, P.; Sovershaev, T.; Braekkan, S.K.; Hansen, J.B. Impact of preanalytical conditions on plasma concentration and size distribution of extracellular vesicles using Nanoparticle Tracking Analysis. Sci. Rep. 2018, 8, 11. [Google Scholar] [CrossRef] [Green Version]
- Morales-Kastresana, A.; Telford, B.; Musich, T.A.; McKinnon, K.; Clayborne, C.; Braig, Z.; Rosner, A.; Demberg, T.; Watson, D.C.; Karpova, T.S.; et al. Labeling extracellular vesicles for nanoscale flow cytometry. Sci. Rep. 2017, 7, 10. [Google Scholar] [CrossRef]
- Mastoridis, S.; Bertolino, G.M.; Whitehouse, G.; Dazzi, F.; Sanchez-Fueyo, A.; Martinez-Llordella, M. Multiparametric analysis of circulating exosomes and other small extracellular vesicles by advanced imaging flow cytometry. Front. Immunol. 2018, 9, 13. [Google Scholar] [CrossRef] [Green Version]
- Lannigan, J.; Erdbruegger, U. Imaging flow cytometry for the characterization of extracellular vesicles. Methods 2017, 112, 55–67. [Google Scholar] [CrossRef]


| Marker | Thresholding | Pre-Term | 95% CI | Control | 95% CI | p Value |
|---|---|---|---|---|---|---|
| lEVs | VSSC | 78,932 | 74,618–83,245 | 75,607 | 69,769–81,446 | 0.4472 |
| FITC + VSSC | 10,253 | 9355–11,511 | 8169 | 7491–8846 | 0.0438 * | |
| CD36+/CD41+ | VSSC | 1155 | 663–1647 | 1133 | 468–1798 | 0.7655 |
| FITC + VSSC | 855 | 457–1254 | 716 | 75–1357 | 0.5356 | |
| CD41+/CD62P+ | VSSC | 138 | 67–210 | 113 | −53–279 | 0.1685 |
| FITC + VSSC | 152 | 71–233 | 104 | −53–261 | 0.0664 | |
| CD31+/CD105+ | VSSC | 169 | 81–256 | 223 | −43–489 | 0.6629 |
| FITC + VSSC | 102 | 41–164 | 159 | −16–334 | 0.9451 |
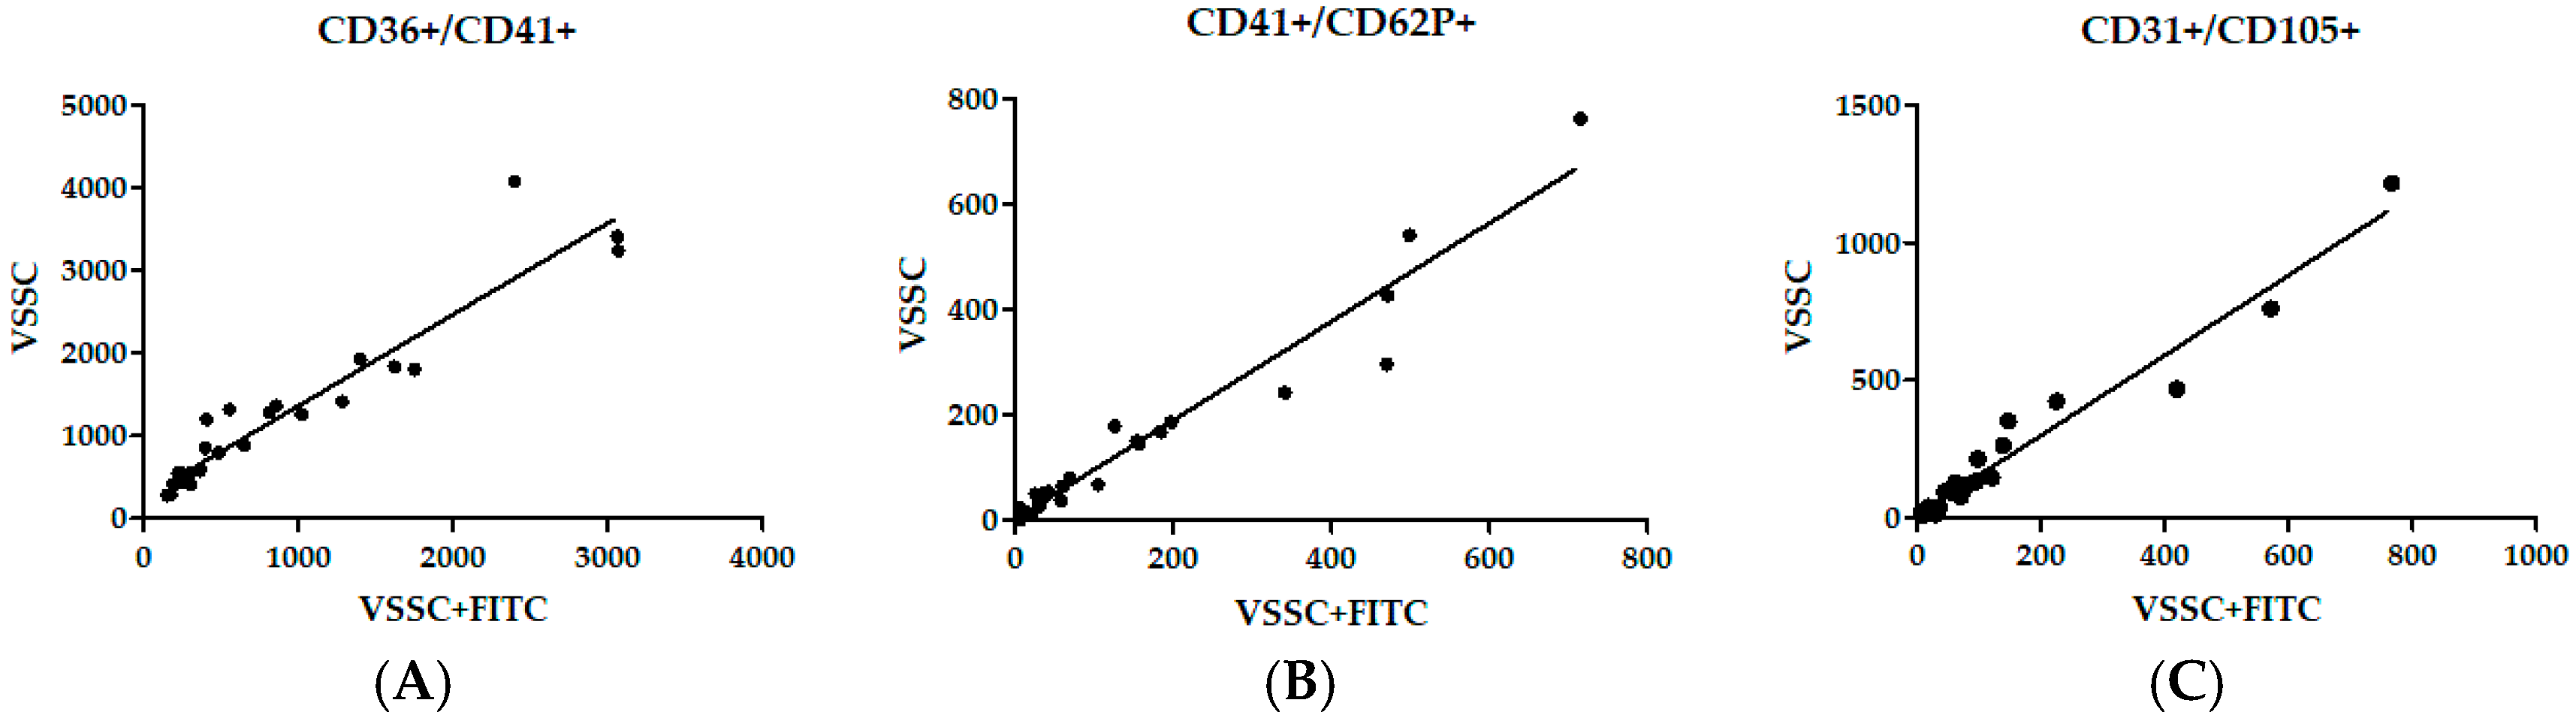
| Marker | Thresholding Correlation | Linear Trendline (R2) | Spearman’s R | 95% CI | p Value |
|---|---|---|---|---|---|
| CD36+/CD41+ | SSC and VSSC | 0.8086 | 0.8527 | 0.7015–0.9305 | <0.0001 |
| SSC and FITC + VSSC | 0.9195 | 0.8931 | 0.7784–0.9501 | <0.0001 | |
| VSSC and FITC + VSSC | 0.9046 | 0.9488 | 0.8903–0.9765 | <0.0001 | |
| CD41+/CD62P+ | SSC and VSSC | 0.8254 | 0.9322 | 0.8563–0.9687 | <0.0001 |
| SSC and FITC + VSSC | 0.9182 | 0.9352 | 0.8624–0.9701 | <0.0001 | |
| VSSC and FITC + VSSC | 0.9457 | 0.9565 | 0.9064–0.9801 | <0.0001 | |
| CD31+/CD105+ | SSC and VSSC | 0.8413 | 0.8336 | 0.6663–0.9210 | <0.0001 |
| SSC and FITC + VSSC | 0.7953 | 0.8034 | 0.6122–0.9059 | <0.0001 | |
| VSSC and FITC + VSSC | 0.9593 | 0.9605 | 0.9148–0.9819 | <0.0001 |
Publisher’s Note: MDPI stays neutral with regard to jurisdictional claims in published maps and institutional affiliations. |
© 2021 by the authors. Licensee MDPI, Basel, Switzerland. This article is an open access article distributed under the terms and conditions of the Creative Commons Attribution (CC BY) license (https://creativecommons.org/licenses/by/4.0/).
Share and Cite
Pekárková, K.; Soukup, J.; Kostelanská, M.; Širc, J.; Straňák, Z.; Holada, K. Cord Blood Extracellular Vesicles Analyzed by Flow Cytometry with Thresholding Using 405 nm or 488 nm Laser Leads to Concurrent Results. Diagnostics 2021, 11, 1320. https://doi.org/10.3390/diagnostics11081320
Pekárková K, Soukup J, Kostelanská M, Širc J, Straňák Z, Holada K. Cord Blood Extracellular Vesicles Analyzed by Flow Cytometry with Thresholding Using 405 nm or 488 nm Laser Leads to Concurrent Results. Diagnostics. 2021; 11(8):1320. https://doi.org/10.3390/diagnostics11081320
Chicago/Turabian StylePekárková, Kristýna, Jakub Soukup, Marie Kostelanská, Jan Širc, Zbyněk Straňák, and Karel Holada. 2021. "Cord Blood Extracellular Vesicles Analyzed by Flow Cytometry with Thresholding Using 405 nm or 488 nm Laser Leads to Concurrent Results" Diagnostics 11, no. 8: 1320. https://doi.org/10.3390/diagnostics11081320
APA StylePekárková, K., Soukup, J., Kostelanská, M., Širc, J., Straňák, Z., & Holada, K. (2021). Cord Blood Extracellular Vesicles Analyzed by Flow Cytometry with Thresholding Using 405 nm or 488 nm Laser Leads to Concurrent Results. Diagnostics, 11(8), 1320. https://doi.org/10.3390/diagnostics11081320