1. Introduction
Primary ciliary dyskinesia (PCD) is a rare disease with a prevalence of 1:20,000 live births (OMIM 242650, ORPHA244). It is a genetic disease characterized by an alteration in the motility pattern and/or frequency of motile cilia and flagella. This results in a deficit in mucociliary clearance, causing infections and chronic inflammation of the airways. This disease is also associated with fertility problems, and the distribution of organs in these patients is random, resulting in situs inversus in 50% of cases (known as Kartagener’s syndrome) and situs ambiguous in 6% [
1].
At present, there is no “gold standard” technique for the diagnosis of PCD [
2], and a combination of different tests is required: analysis of the ciliary beat pattern (CBP) and ciliary beat frequency (CBF) [
3] by high-speed video microscopy (HSVM) [
4,
5], the study of ciliary ultrastructure by transmission electron microscopy (TEM) [
6], and genetic diagnosis [
7]. In addition, nasal nitric oxide (nNO) determination is sometimes used as a screening test [
8], and immunofluorescent labeling of specific proteins of the ciliary structure is emerging as another potential test that still needs to be validated [
9]. Although TEM and genetics are two definitive diagnostic tests, 20–30% of cases of PCD show [
9] normal ciliary ultrastructure. PCD is a multigenic disorder, as evidenced by the identification of more than 40 genes related with the diseases; these, however, are only present in 60–70% of the studied families. These circumstances imply a relatively high false-negative rate in PCD diagnosis. Therefore, ciliary function analysis by HSVM is still considered a key test, according to the European Guidelines for the diagnosis of PCD [
2,
10,
11,
12].
It has been demonstrated [
13] that air–liquid interface culture of PCD epithelial cells before analyzing ciliary function and ultrastructure is a robust and informative diagnostic aid that helps to reduce false positives due to secondary defects. However, there are important disadvantages when comparing with direct observation of the samples of nasal ciliary cells: (1) ALI culture requires highly specialized personnel and expensive material; (2) the success rate of ALI-cultured nasal epithelium varies from 54% to 79%. Since the diagnostic process is costly and time-consuming, and requires specialized and trained staff, it is performed in reference centers [
8]. One of the main problems of this rare disease is that it is often diagnosed late, worsening prognostics, especially at the respiratory level [
14]. The improvement of diagnostic tests’ effectiveness is necessary for an early PCD diagnosis. HSVM is a key test that must be carried out in reference centers, which are often located far from patients’ homes. It is necessary to know how time and the temperature at which the ciliated epithelium samples are transported to these centers affect the test results.
Therefore, in this study, our objectives were: (1) to describe how ciliary function parameters (CBP and CBF) vary in function of time and temperature conservation using HSVM from fresh samples of healthy volunteers; and (2) to determine what is the maximum time after sample collection at which assessment of ciliary function using HSVM could be carried out in order to reduce the error rate in the diagnosis of PCD using this test. The novelty of this work resides in the fact that, on the one hand, we provide information on the effect of temperature on CBP in relation to CBF and, on the other hand, we establish the time limits in which a sample can be reliably analyzed in a specialized unit for the diagnosis of PCD.
2. Materials and Methods
All epithelial cell samples were collected after informed consent was signed by the participants. The study protocol complied with the ethical criteria of the 1975 Declaration of Helsinki [
15].
The study involved 27 healthy volunteers (age 27, 53 ± 8, 91) from whom samples of airway epithelial cells were obtained by curettage of the nasal middle turbinate mucosa. No local anesthetic was used to obtain the samples in order to avoid the possibility of interaction between the drug and the subsequent analysis of the ciliary movement. None of the volunteers were receiving nasal topical treatments, and none of them suffered from acute or chronic airway disease. Additionally, none of them were smokers.
Obtained tissue samples were disaggregated and dissolved (for transport and analysis) in 1 mL of Dulbeccois Modified Enaglesis Medium (DMEM, Cambrex, East Rutherford, New Jersey) supplemented with 10% fetal bovine serum, 100 U/mL of penicillin, 100 µg/mL of streptomycin, and 2 mM of glutamine.
CBP and CBF were determined in all samples. Prior to ciliary function analysis, each sample was divided in two to determine temperature-dependent differences. Half of the samples were kept at room temperature (22–24 °C) and the other half in a refrigerator (4 °C). For each sample, videos were recorded at 0, 3, 24, and 48 h after collection; only three of the samples were also analyzed at 72 h.
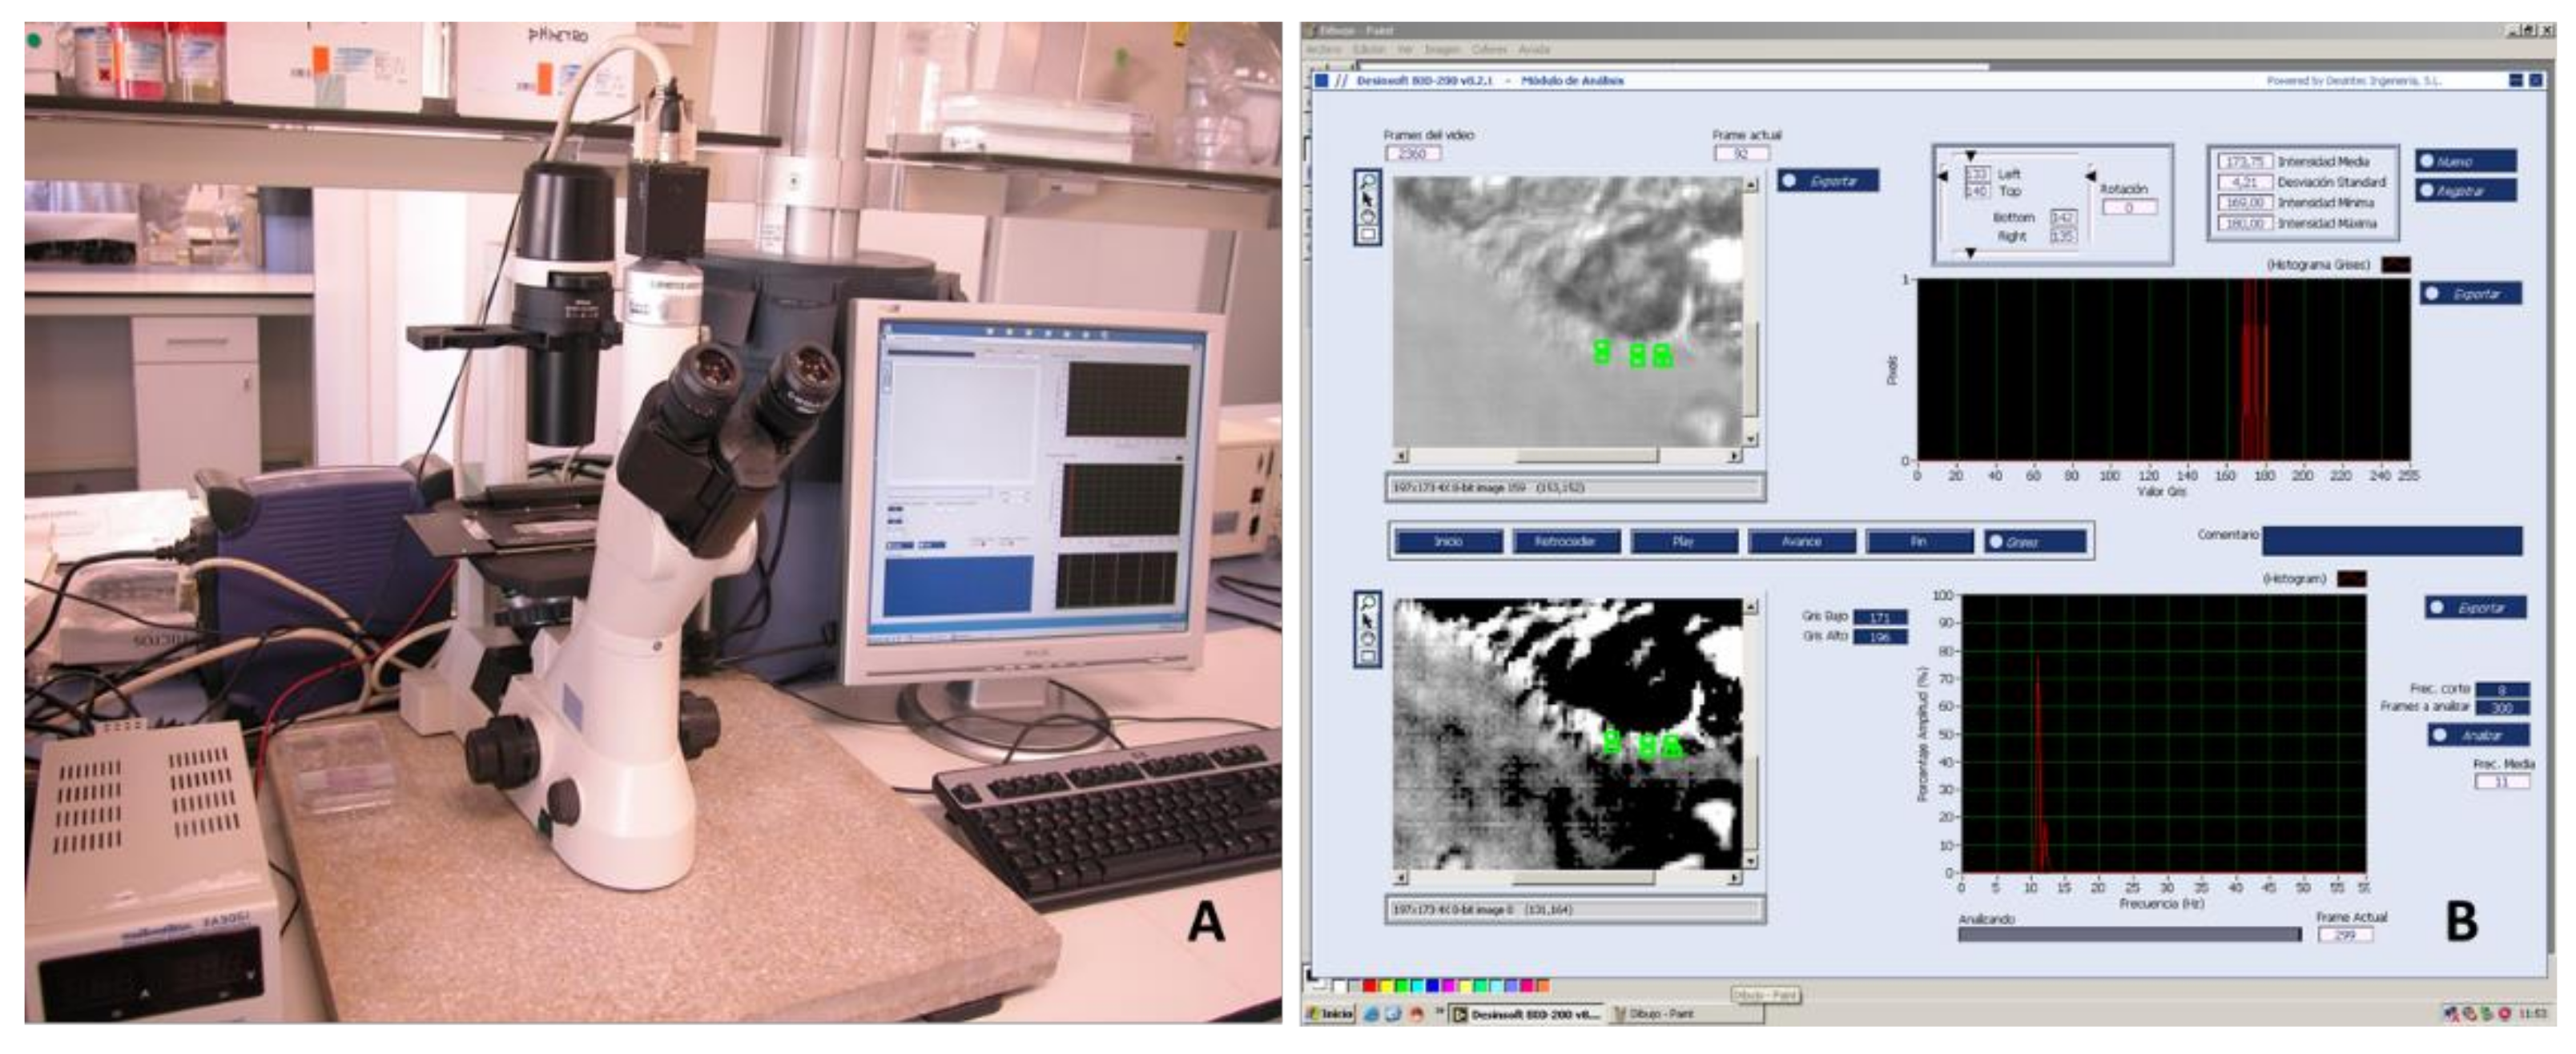
Visualization of the samples was performed at room temperature with the high-speed digital video-imaging system associated with a Nikon Eclipse TS100 microscope (Nikon, Tokyo, Japan). A phase-contrast objective with 40X magnification was used (
Figure 1). A Multimetrix
® XA3051 (Dewsintec SL, Valencia, Spain) was used for on-line CBF measurement. Transillumination was performed with a 150 W green light filter, whose beam was directly connected to a CCD camera (CV-A33 CL Digital Quad High-Speed Progressive Scan Camera, Jai UK Ltd., Unbridge, UK), with a resolution of 649 × 494 pixels and a maximum resolution speed of 128 fps. Video signals were digitized and processed using Desinsoft-Bio 200 software (Valencia, Spain). The video images were analyzed by monitoring the variation in light intensity of each pixel using Fourier transform [
16]. All statistical analyses were conducted using R software version 4.0, brms package version 2.12, and clickR package version 0.4.39.
For CBF determination, 3 area measurements were obtained in which a good ciliary image was captured in each condition. Any measurement below 7 Hz was not taken into account because it did not correspond to normal expected measurements, and it could be due to artefactual values due to methodological or biological reasons. Similarly, any measurement with an amplitude percentage higher than 40% was discarded because it was considered an excessively heterogeneous determination.
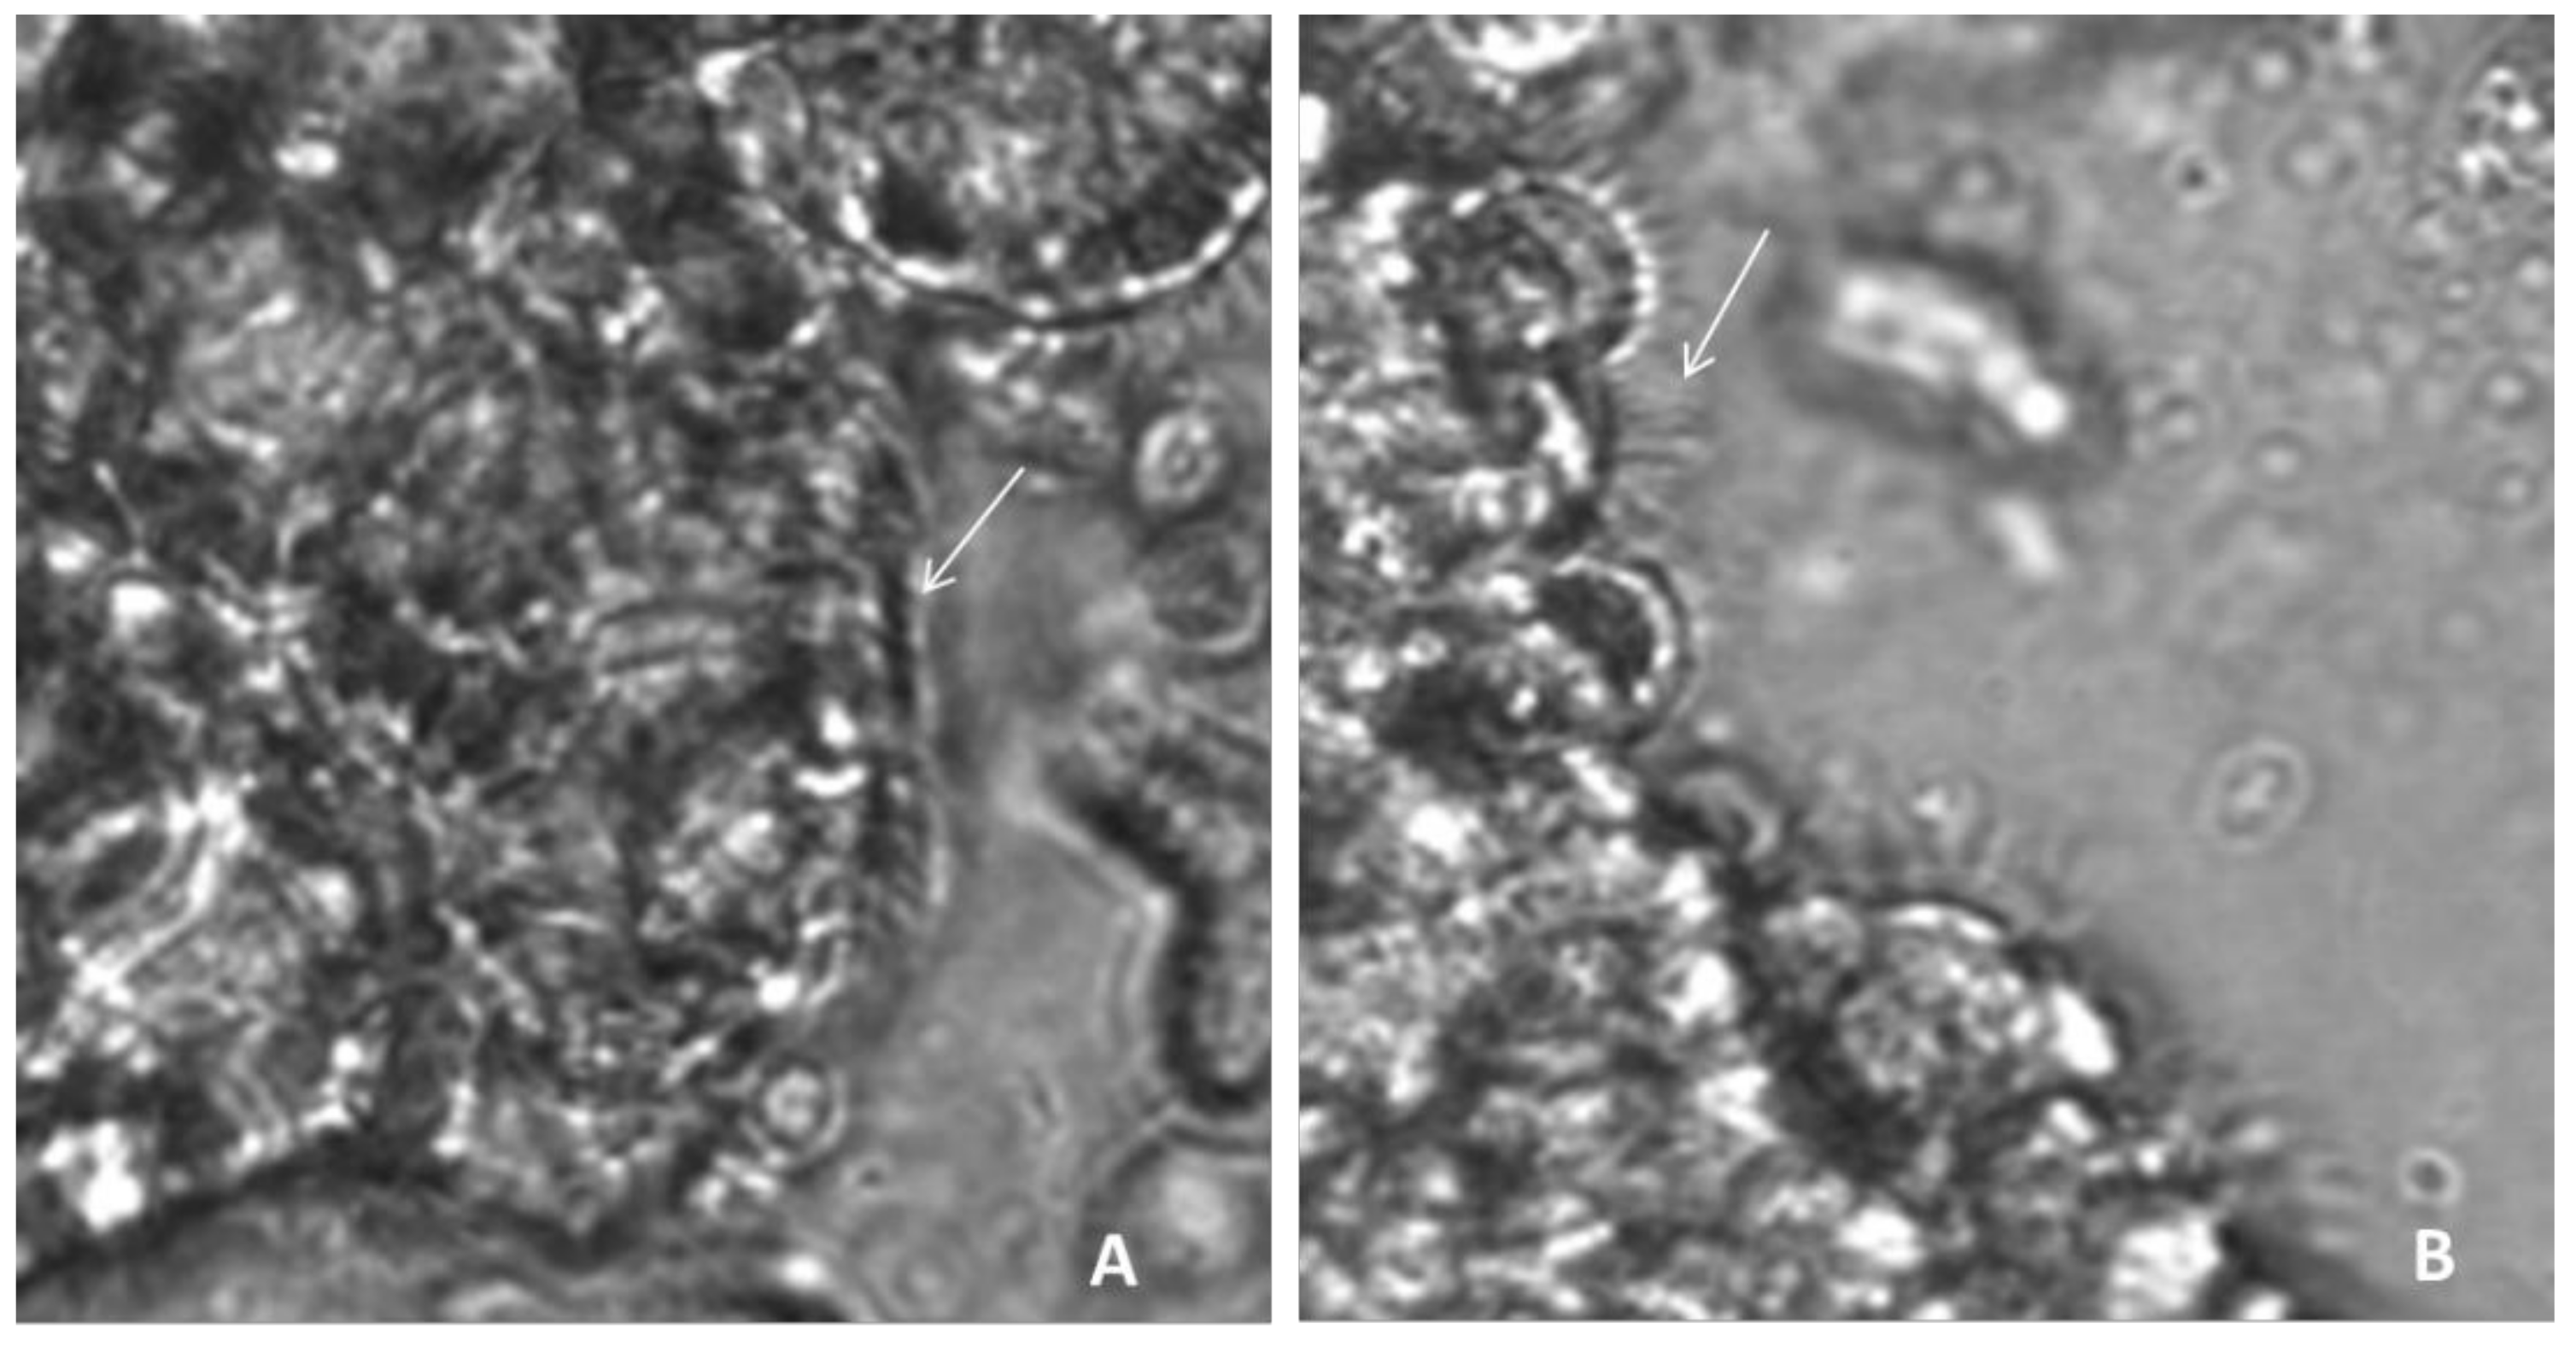
The determination of CBP was made by direct visualization by an observer and was classified into two categories based on a modification of Chilvers MA et al. [
17], considering that the beat pattern could be normal (N)—the ciliary beating consists of all phases with adequate amplitude and coordination—or dyskinetic, which would include the categories of vibratile (V)—the beating amplitude is decreased, and the cilia appear stiff—and uncoordinated (I), i.e., the cilia do not beat in synchronized metachronous phases (
Figure 2). In order to evaluate CBP, cilia from at least 10 edges were examined. Cilia movement was registered for 1 min at 118 fps. The measurements were performed by two investigators using homogeneous criteria previously validated by a k-test. (>85%).
Data were summarized using mean (sd) and median (1st and 3rd quartiles) for numeric variables and absolute frequency (%) for qualitative variables. A Bayesian Gamma regression model was used to evaluate the evolution over time and its differences between the temperature on CBF values. Additionally, a Bayesian logistic regression model was used to assess the evolution over time and the differences between the temperature on dyskinetic CBP probability. These models considered a 2-way interaction between time and temperature. Given the longitudinal nature of the study and the non-independence of the observations, a slope for time and an independent term for each sample were included in the models. Furthermore, as the effect of CBP overtime was not expected to be linear, time was included in the model as a monotonic effect. Since the use of interactions made estimated coefficients difficult to interpret, focus was given to the partial dependence plots with their 95% confidence intervals and post hoc density probabilities.
3. Results
3.1. Ciliary Beat Frequency
Table 1 shows the ciliary beat frequency measurements, expressed in Hz using the mean and standard deviation, at the different times and temperatures.
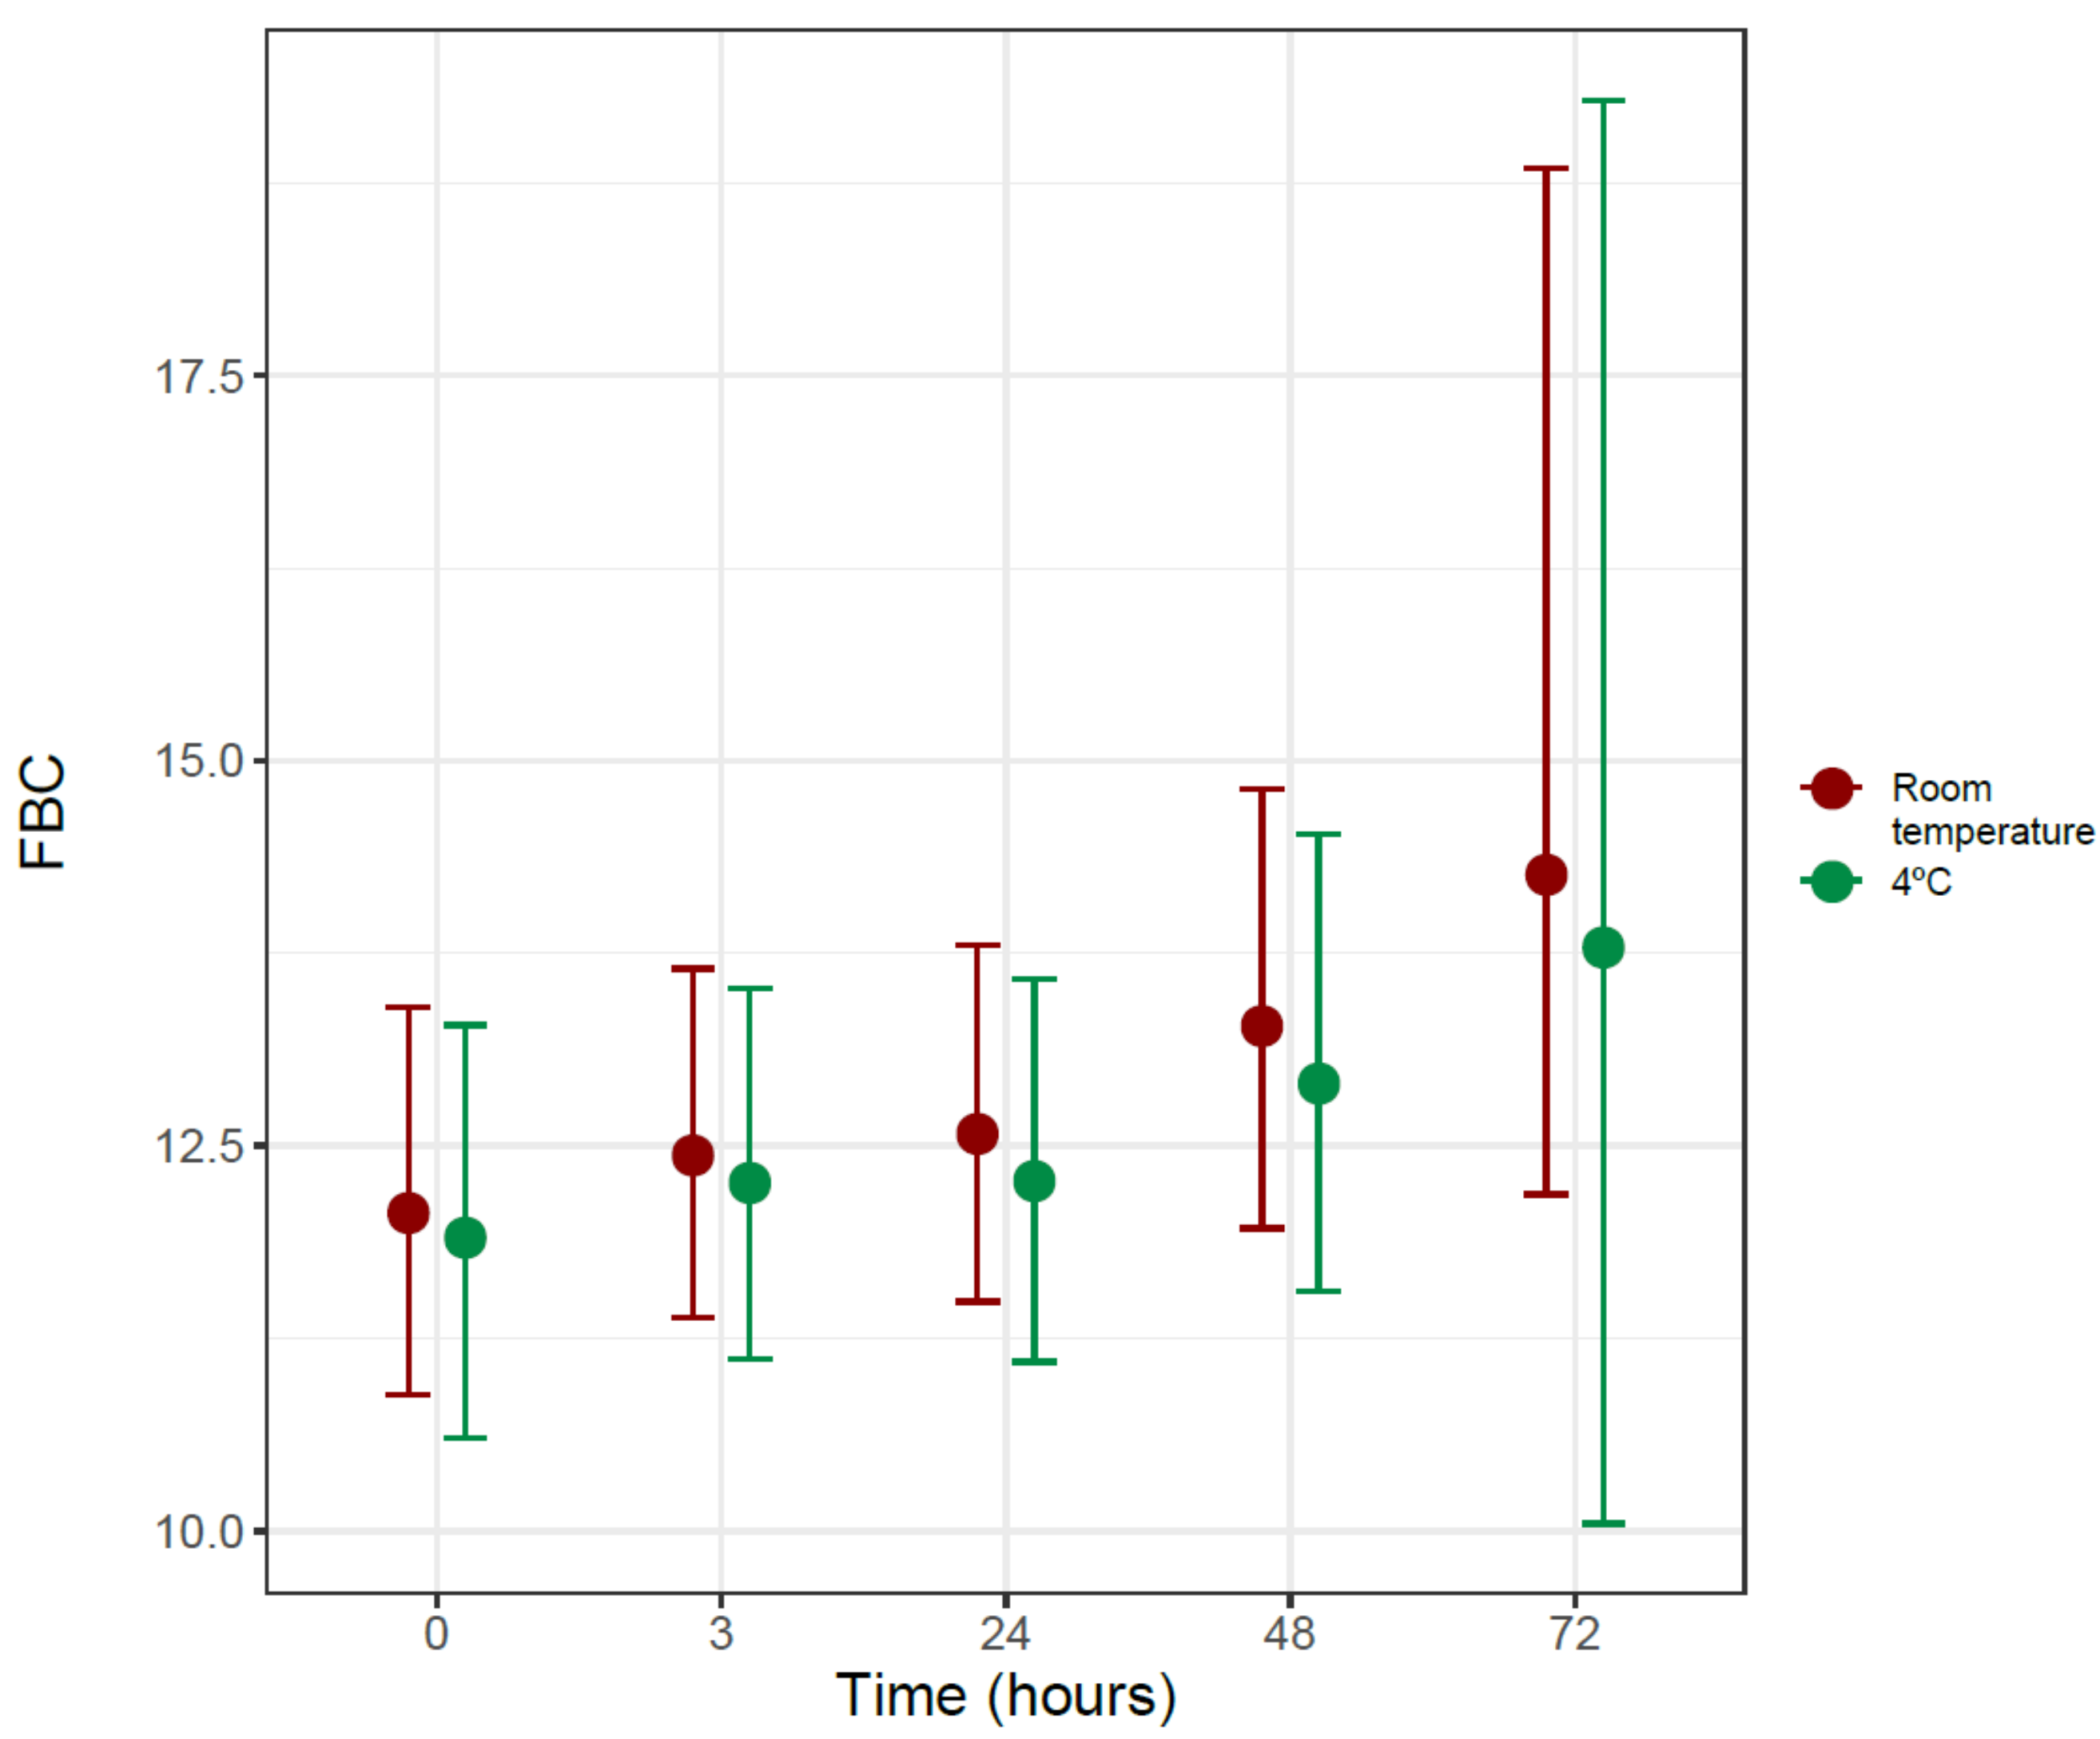
Figure 3 shows the evolution of CBF as a function of time, both at room temperature and 4 °C, from the Bayesian Gamma regression model performed.
The Bayesian Gamma regression model shows that time is associated with an increase in the ciliary beat frequency, with a probability (PD) of 97.51% and a confidence interval very close to statistical significance (Exp (estimate) 1.047 CI95% [0.999; 1.121]). When comparing the data obtained at room temperature with those obtained in the refrigerator, no differences were observed between them, neither at time 0 (Exp (estimate) 0.986 CI95% [0.903; 1.072]) nor when comparing their evolution over time (Exp (estimate) 0.992 CI95% [0.908; 1.069]).
3.2. Ciliary Beat Pattern
Table 2 shows the absolute and relative frequencies of the normal and dyskinetic ciliary beat pattern, including vibratile and uncoordinate, as well as the proportions at each time and temperature.
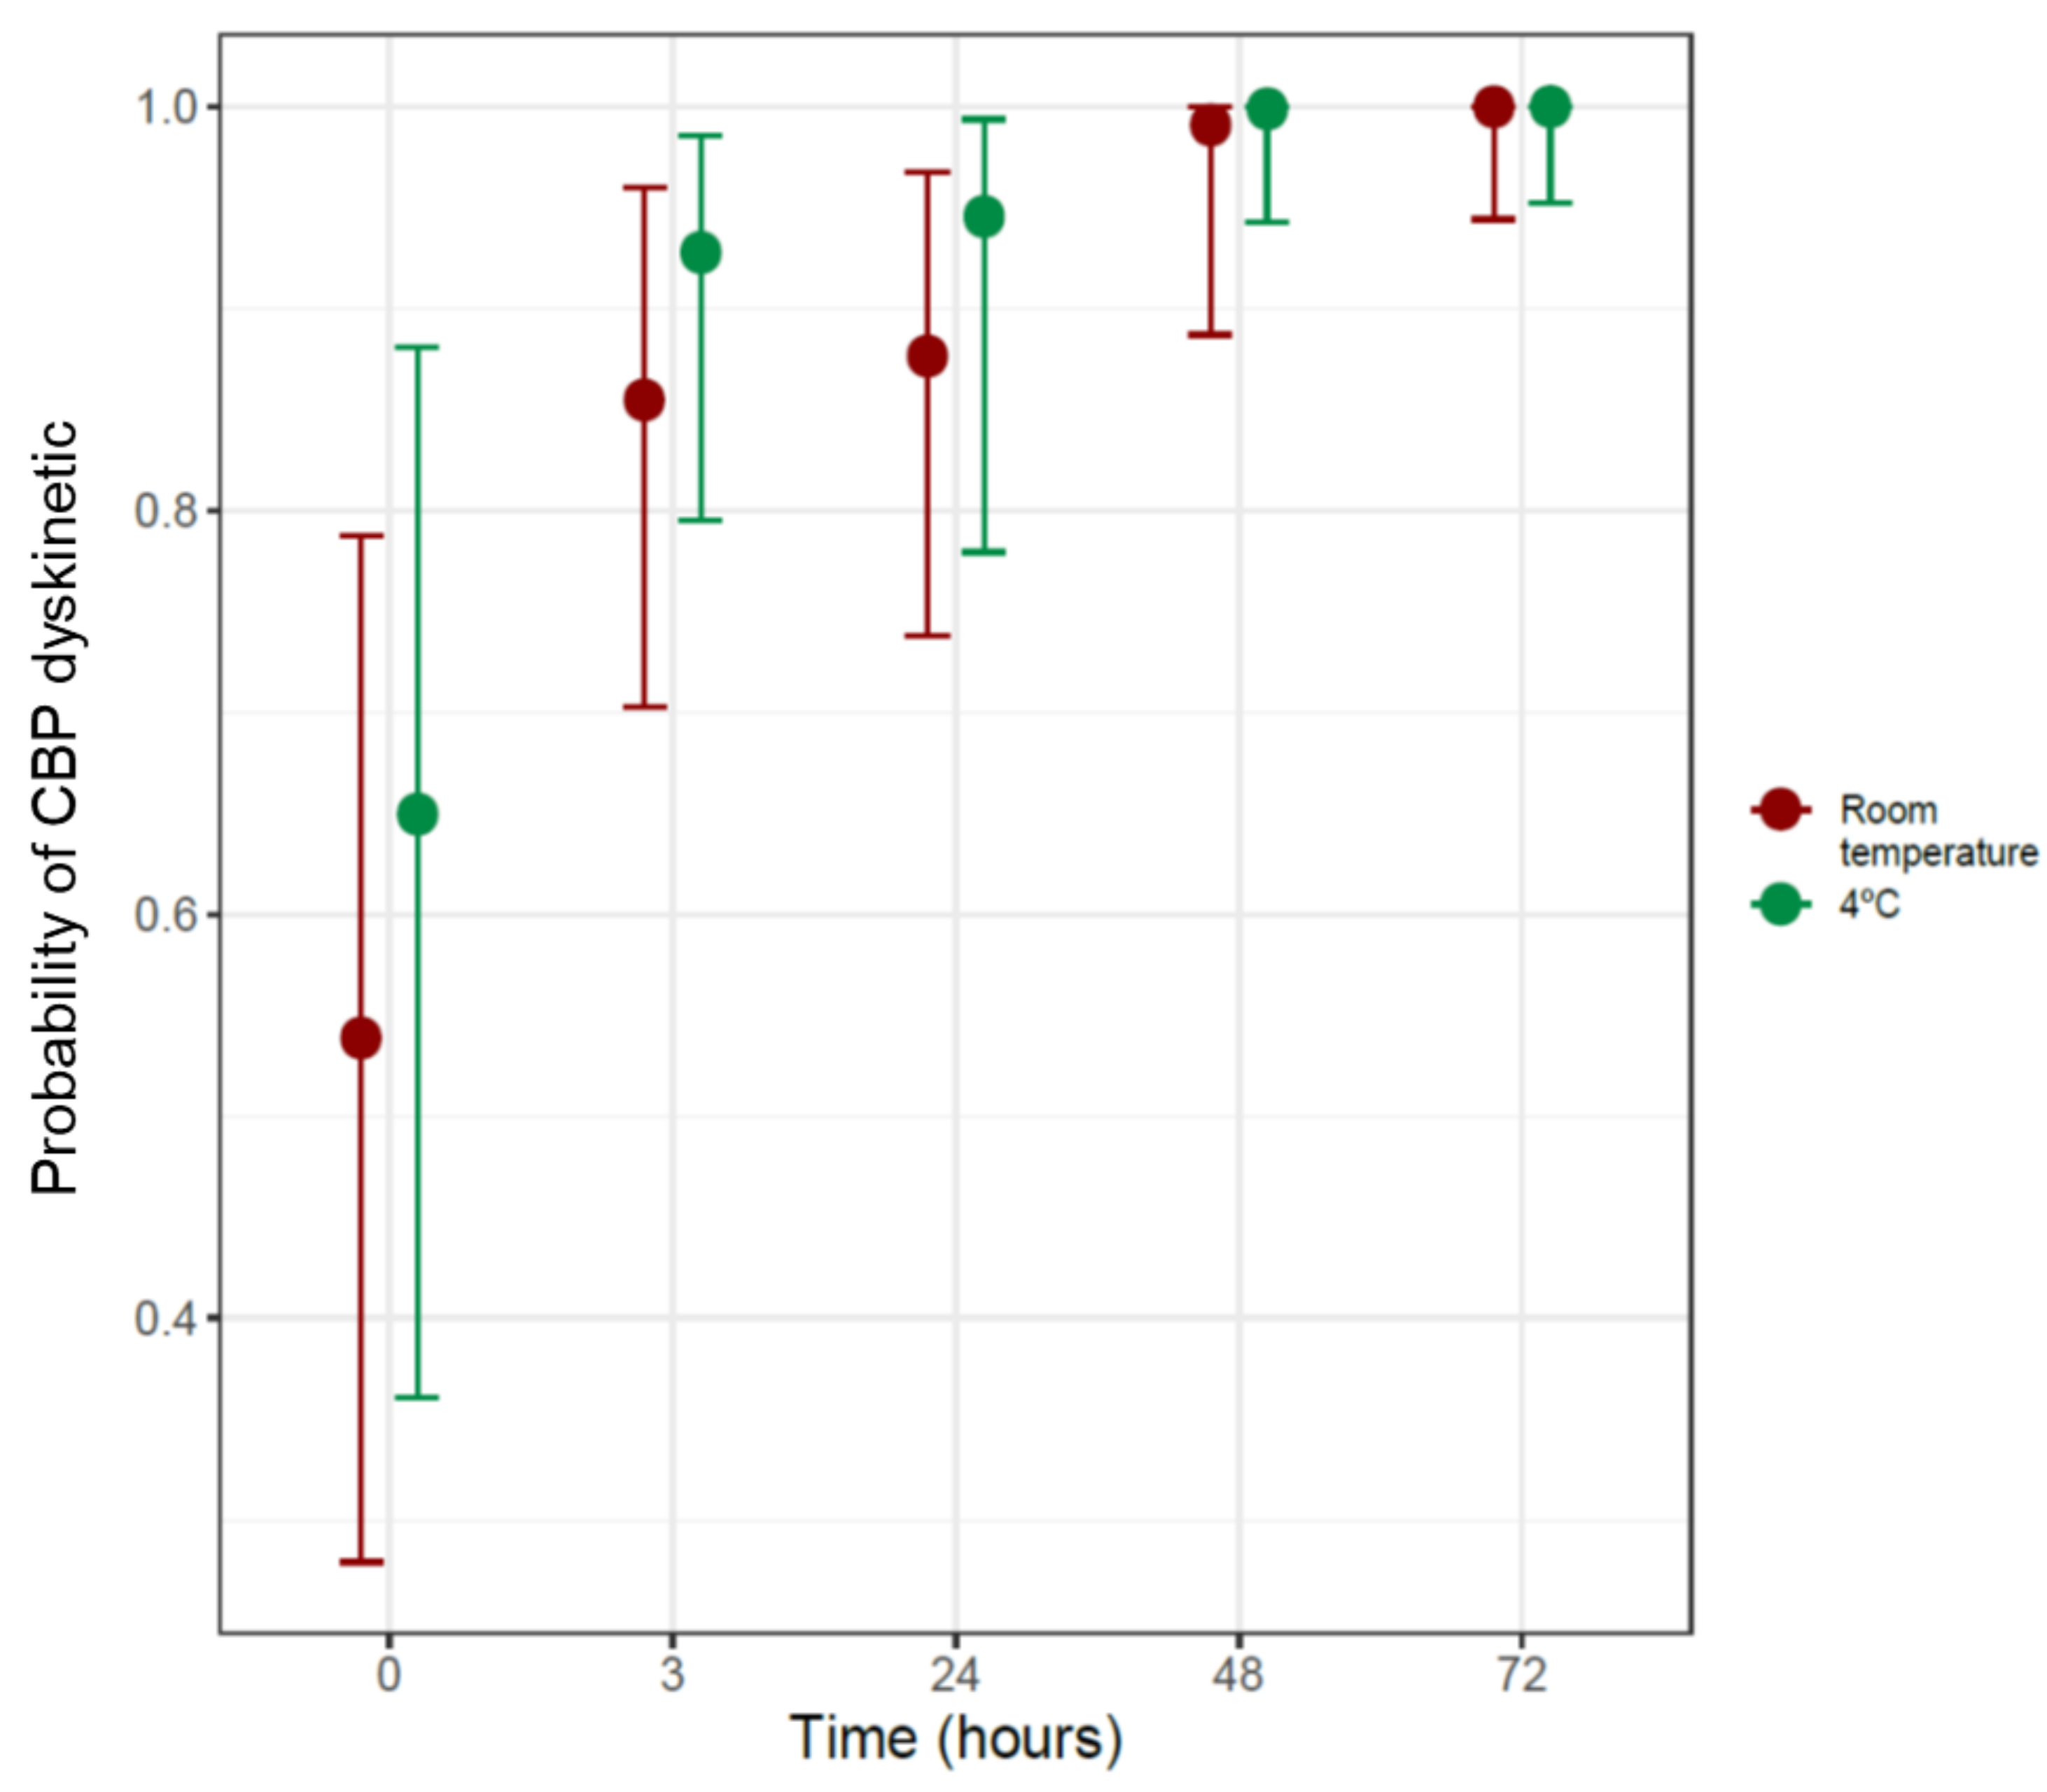
A Bayesian logistic regression model was performed in this case, represented in
Figure 4, showing the probability of the appearance of a dyskinetic ciliary beat pattern (vibratile + uncoordinated) at room temperature and at 4 °C as a function of time.
It was observed how, at room temperature, as a function of time, the probability of the ciliary beat pattern being dyskinetic increased significantly (OR = 33, 95%CI [1.79, 1165]), with a probability greater than 99%. When comparing these data with those observed in samples preserved at 4 °C, no significantly differences were observed (OR = 2.59, 95%CI 0.2, 352.5), so it can be deduced that the probability of presenting a dyskinetic pattern at 4 °C also increases as a function of time. No differences were observed when comparing the samples at baseline to time 0 (OR = 1.6, 95%CI 0.41, 7.15).
4. Discussion
In the present work, we have studied the variation in CBF and CBP at different temperatures and conservation times in nasal epithelial biopsies from healthy individuals, with the aim of defining a protocol to improve the efficacy of HSVM as a diagnostic test for PCD.
A similar study was performed by Sommer et al. in 2010, but only focused on the change in CBF [
18]. As previously stated, to assess ciliary function, CBP (and not CBF) is the main parameter to evaluate when studying a case of PCD by HSVM, since there are phenotypes with normal CBF in which only CBP is altered [
17,
19,
20]. According to the European Respiratory Guidelines, CBP, together with a consistent clinical history, may be more useful to diagnose these patients than ciliary ultrastructure analysis by transmission electron microscopy, as in many cases it can be normal [
21,
22]. The results show how, over time, there are increases in CBF in nasal epithelial samples. Despite not being clearly defined in the bibliography, this increase could be due to the mechanism of ciliary movement regulation carried out by dynein proteins, which are regulated by cAMP-controlled phosphorylation.
Among other factors, intracellular calcium increases CBF, first through a mechanism independent of PKA and then through mechaninsms dependent on cAMP increases [
23,
24,
25]. Regarding the increase in CBF at 72 h, it cannot be considered as a strong evidence, because it could be due to the low sample size.
The evaluation of the ciliary beat pattern is fundamental for the diagnosis of PCD. In this regard, it should be noted that, in our work, CBP changes over time in a significant way, as a function of time, in favor of dyskinetic patterns, showing a rapid decrease in patterns considered normal.
The literature shows controversy regarding the preservation of samples at 4 °C [
20]. In our study, there is a decreasing trend in normal CBP in favor of vibratile and uncoordinated CBP at this temperature. Alterations in CBP are due to problems in cilia beating coordination and amplitude. However, there were areas with cilia beating at normal frequencies, despite the low temperature. We believe that preservation at room temperature introduces fewer external factors that can alter the analysis, and thus could provide advantages over low temperature preservation. Although some centers make measurements using a heating plate at 37 °C, in others, such as our own, the analysis of samples is performed at room temperature, since the aim of the work is to determine how the sample preservation temperature affects CBP rather than to ascertain the temperature at which the measurement is made.
Few centers have both the technical and human resources to perform ciliary beat pattern assessments. The alteration in CBP during the first hours after sample collection must be taken into account. As previously mentioned, the PCD diagnostic pathway is complex and expensive. A patient’s displacement to the reference center to obtain the sample and its analysis within the first 3 h would significantly decrease the rate of false positives and non-assessable samples, thus improving the diagnostics of PCD.
Despite the low number of samples analyzed, our results indicate a clear trend in the variation of ciliary beat frequency as a function of time, as well as statistically significant differences in the variation of ciliary beat patterns as a function of time.
5. Conclusions
Ciliary beat frequency increase in a time-dependent manner due to alterations in CBP.
The ciliary beat pattern is one of the most valuable tools for the diagnosis of primary ciliary dyskinesia. It is, however, markedly altered depending on the time after sample extraction, with dyskinetic patterns appearing both at room temperature and at 4 °C, especially after 3 h.
The analysis of nasal epithelium samples from patients suspected of having primary ciliary dyskinesia should be performed early, preferably within the first 3 h after collection, and kept at room temperature. This analysis should be carried out in reference centers in order to guarantee the correct processing of samples and therefore the correct diagnosis of PCD.
Author Contributions
A.R.: Analysis of results and writing; J.P.-F., L.M.: sampling and videos and writing. J.M., J.C., M.M.-R.: fine-tuning of the high-speed video-microscopy system; M.A.: study design, review, and final approval. All authors have read and agreed to the published version of the manuscript.
Funding
This work was supported by grants European Regional Development Fund (ERDF) and Instituto de Salud Carlos III, FIS PI16/01315, FIS PI17 / 02158 (JM), FIS PI19/00949, JR18 / 00050 (JM), SAF2017-82913-R (JC), CIBERES (CB06 / 06/0027) from the Spanish Government, and through research grants from the Regional Government Prometheus 2017/023 / UV (JC). The funding entities did not contribute to the study design or the collection, analysis, and interpretation of data or to the writing of the manuscript.
Institutional Review Board Statement
The study was conducted according to the guidelines of the Declaration of Helsinki, and approved by the Ethics Committee of Consorcio Hospital General Universitario de Valencia (CPMP/ICH/135/95 on 19 July 2016).
Informed Consent Statement
Informed consent was obtained from all subjects involved in the study.
Acknowledgments
The authors would especially like to thank the Biostatistics Department of the Health Research Institute La Fe (Valencia), as well as Arash Javadinejad for the English translation of the manuscript.
Conflicts of Interest
The authors declare no conflict of interest.
References
- Reula, A.; Lucas, J.S.; Moreno-Galdó, A.; Romero, T.; Milara, X.; Carda, C.; Roig, M.M.; Escribano, A.; Dasí, F.; Armengot-Carceller, M. New insights in primary ciliary dyskinesia. Expert Opin. Orphan Drugs 2017, 5, 537–548. [Google Scholar] [CrossRef] [Green Version]
- Lucas, J.S.; Barbato, A.; Collins, S.A.; Goutaki, M.; Behan, L.; Caudri, D.; Dell, S.; Eber, E.; Escudier, E.; Hirst, R.A.; et al. European Respiratory Society guidelines for the diagnosis of primary ciliary dyskinesia. Eur. Respir. J. 2017, 49, 1601090. [Google Scholar] [CrossRef] [PubMed]
- Kempeneers, C.; Seaton, C.; Chilvers, M.A. Variation of Ciliary Beat Pattern in Three Different Beating Planes in Healthy Subjects. Chest 2017, 151, 993–1001. [Google Scholar] [CrossRef]
- Rubbo, B.; Shoemark, A.; Jackson, C.L.; Hirst, R.; Thompson, J.; Hayes, J.; Frost, E.; Copeland, F.; Hogg, C.; O’Callaghan, C.; et al. Accuracy of High-Speed Video Analysis to Diagnose Primary Ciliary Dyskinesia. Chest 2019, 155, 1008–1017. [Google Scholar] [CrossRef] [Green Version]
- Kempeneers, C.; Seaton, C.; Garcia Espinosa, B.; Chilvers, M.A. Ciliary functional analysis: Beating a path towards standardization. Pediatr. Pulmonol. 2019, 54, 1627–1638. [Google Scholar] [CrossRef] [PubMed]
- Carda, C.; Armengot, M.; Escribano, A.; Peydró, A. Ultrastructural Patterns of Primary Ciliar Dyskinesia Syndrome. Ultrastruct. Pathol. 2005, 29, 3–8. [Google Scholar] [CrossRef]
- Baz-Redón, N.; Rovira-Amigo, S.; Paramonov, I.; Castillo-Corullón, S.; Roig, M.C.; Antolín, M.; Arumí, E.G.; Torrent-Vernetta, A.; Messa, I.D.M.; Gartner, S.; et al. Implementación de un panel de genes para el diagnóstico genético de la discinesia ciliar primaria. Arch. Bronconeumol. 2021, 57, 186–194. [Google Scholar] [CrossRef] [PubMed]
- Armengot-Carceller, M.; Reula, A.; Mata-Roig, M.; Pérez-Panadés, J.; Milian-Medina, L.; Carda-Batalla, C. Understanding Primary Ciliary Dyskinesia: Experience From a Mediterranean Diagnostic Reference Centre. J. Clin. Med. 2020, 9, 810. [Google Scholar] [CrossRef] [PubMed] [Green Version]
- Baz-Redón, N. Role of Immunofluorescence and Molecular Diagnosis in the Characterization of Primary Ciliary Dyskinesia. Arch. Bronconeumol. 2019, 55, 439–441. [Google Scholar] [CrossRef] [PubMed]
- Lavie, M.; Amirav, I. In Defense of High-Speed Video Microscopy in Evaluating Patients with Suspected Primary Ciliary Dyskinesia. Am. J. Respir. Crit. Care Med. 2019, 200, 1181–1183. [Google Scholar] [CrossRef] [PubMed]
- Jackson, C.; Behan, L.; Collins, S.A.; Goggin, P.M.; Adam, E.C.; Coles, J.L.; Evans, H.J.; Harris, A.; Lackie, P.; Packham, S.; et al. Accuracy of diagnostic testing in primary ciliary dyskinesia. Eur. Respir. J. 2016, 47, 837–848. [Google Scholar] [CrossRef] [Green Version]
- Lucas, J.S. Exploring the Art of Ciliary Beating: The Benefits of High-Speed Video Analysis. Chest 2017, 152, 1348–1349. [Google Scholar] [CrossRef]
- Hirst, R.A.; Jackson, C.; Coles, J.L.; Williams, G.; Rutman, A.; Goggin, P.M.; Adam, E.C.; Page, A.; Evans, H.J.; Lackie, P.M.; et al. Culture of Primary Ciliary Dyskinesia Epithelial Cells at Air-Liquid Interface Can Alter Ciliary Phenotype but Remains a Robust and Informative Diagnostic Aid. PLoS ONE 2014, 9, e89675. [Google Scholar] [CrossRef] [Green Version]
- Kuehni, C.E.; Frischer, T.; Strippoli, M.-P.; Maurer, E.; Bush, A.; Nielsen, K.G.; Escribano, A.; Lucas, J.; Yiallouros, P.; Omran, H.; et al. Factors influencing age at diagnosis of primary ciliary dyskinesia in European children. Eur. Respir. J. 2010, 36, 1248–1258. [Google Scholar] [CrossRef] [Green Version]
- World Medical Association. Declaration of Helsinki. Br. Med. J. 1996, 313, 1448–1449. [Google Scholar] [CrossRef]
- Armengot, M.; Milara, J.; Mata, M.; Carda, C.; Cortijo, J. Cilia Motility and Structure in Primary and Secondary Ciliary Dyskinesia. Am. J. Rhinol. Allergy 2010, 24, 175–180. [Google Scholar] [CrossRef]
- Chilvers, M.; Rutman, A.; O’Callaghan, C. Ciliary beat pattern is associated with specific ultrastructural defects in primary ciliary dyskinesia. J. Allergy Clin. Immunol. 2003, 112, 518–524. [Google Scholar] [CrossRef]
- Sommer, J.U.; Gross, S.; Hörmann, K.; Stuck, B.A. Time-dependent changes in nasal ciliary beat frequency. Eur. Arch. Oto-Rhino-Laryngol. 2010, 267, 1383–1387. [Google Scholar] [CrossRef] [PubMed]
- Zariwala, M.A.; Knowles, M.R.; Omran, H. Genetic Defects in Ciliary Structure and Function. Annu. Rev. Physiol. 2007, 69, 423–450. [Google Scholar] [CrossRef] [PubMed]
- Smith, C.M.; Hirst, R.A.; Bankart, M.J.; Jones, D.W.; Easton, A.J.; Andrew, P.W.; O’Callaghan, C. Cooling of Cilia Allows Functional Analysis of the Beat Pattern for Diagnostic Testing. Chest 2011, 140, 186–190. [Google Scholar] [CrossRef] [PubMed]
- Pifferi, M.; Michelucci, A.; Conidi, M.E.; Cangiotti, A.M.; Simi, P.; Macchia, P.; Boner, A.L. New DNAH11 mutations in primary ciliary dyskinesia with normal axonemal ultrastructure. Eur. Respir. J. 2010, 35, 1413–1416. [Google Scholar] [CrossRef]
- Schwabe, G.C. Primary ciliary dyskinesia associated with normal axoneme ultrastructure is caused by DNAH11 mutations. Hum. Mutat. 2008, 29, 289–298. [Google Scholar] [CrossRef] [PubMed]
- Salathe, M. Regulation of mammalian ciliary beating. Annu. Rev. Physiol. 2007, 69, 401–422. [Google Scholar] [CrossRef] [PubMed]
- Schmid, A. Real-time analysis of cAMP-mediated regulation of ciliary motility in single primary human airway epithelial cells. J. Cell Sci. 2006, 119, 4176–4186. [Google Scholar] [CrossRef] [PubMed] [Green Version]
- Lee, D.D.H.; Petris, A.; Hynds, R.E.; O’Callaghan, C. Ciliated Epithelial Cell Differentiation at Air-Liquid Interface Using Commercially Available Culture Media. Methods Mol. Biol. 2020, 2109, 275–291. [Google Scholar]
| Publisher’s Note: MDPI stays neutral with regard to jurisdictional claims in published maps and institutional affiliations. |
© 2021 by the authors. Licensee MDPI, Basel, Switzerland. This article is an open access article distributed under the terms and conditions of the Creative Commons Attribution (CC BY) license (https://creativecommons.org/licenses/by/4.0/).


