
Machine-Learning-Based Radiomics MRI Model for Survival Prediction of Recurrent Glioblastomas Treated with Bevacizumab

 , , , ,
  , ,
, ,
Abstract
1. Introduction
2. Materials and Methods
2.1. Patient Selection
2.2. MRI Protocol
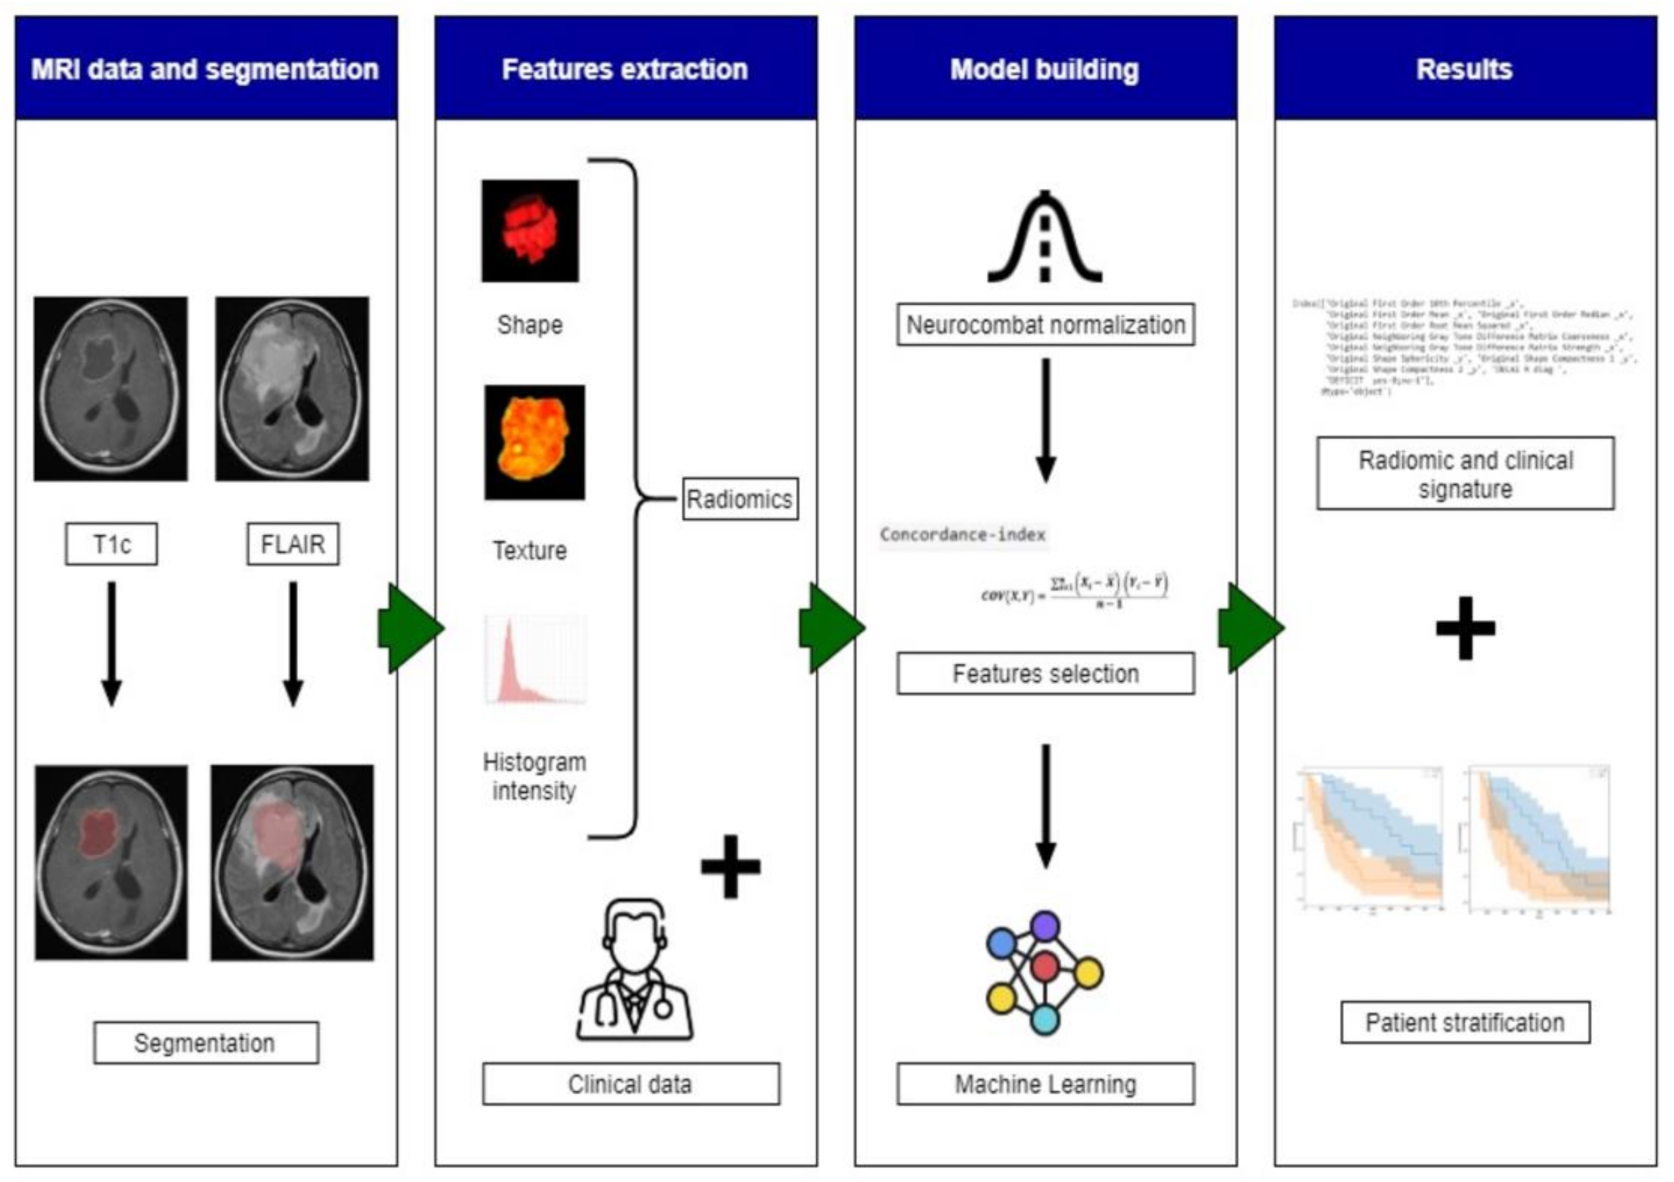
2.3. Image Analysis
2.3.1. Pre-Processing
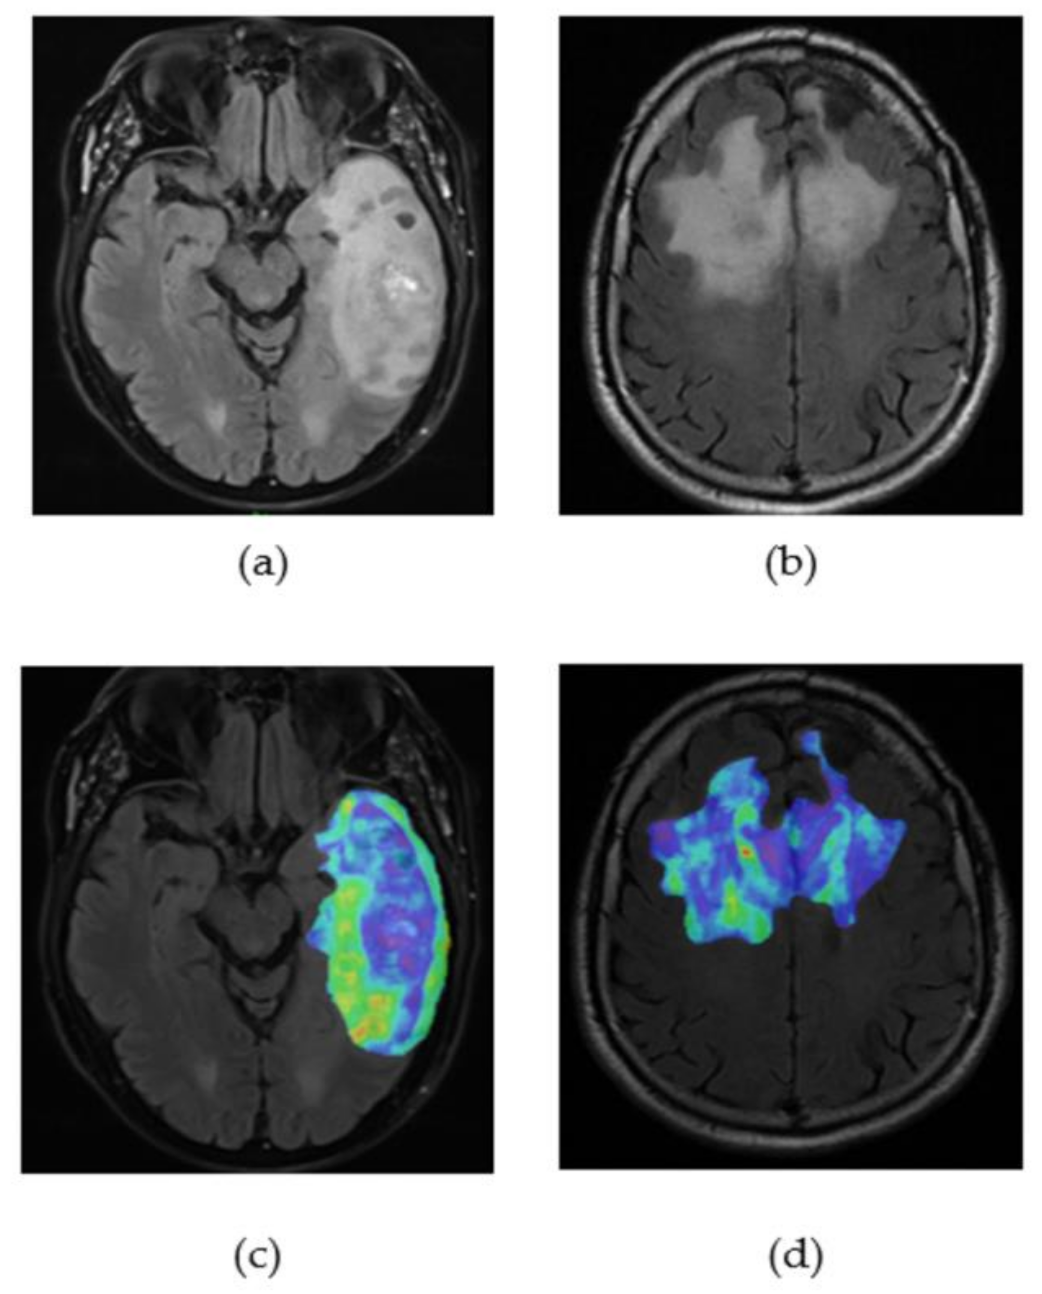
2.3.2. Tumour Segmentation
2.3.3. Radiomics and Features Extraction Technique
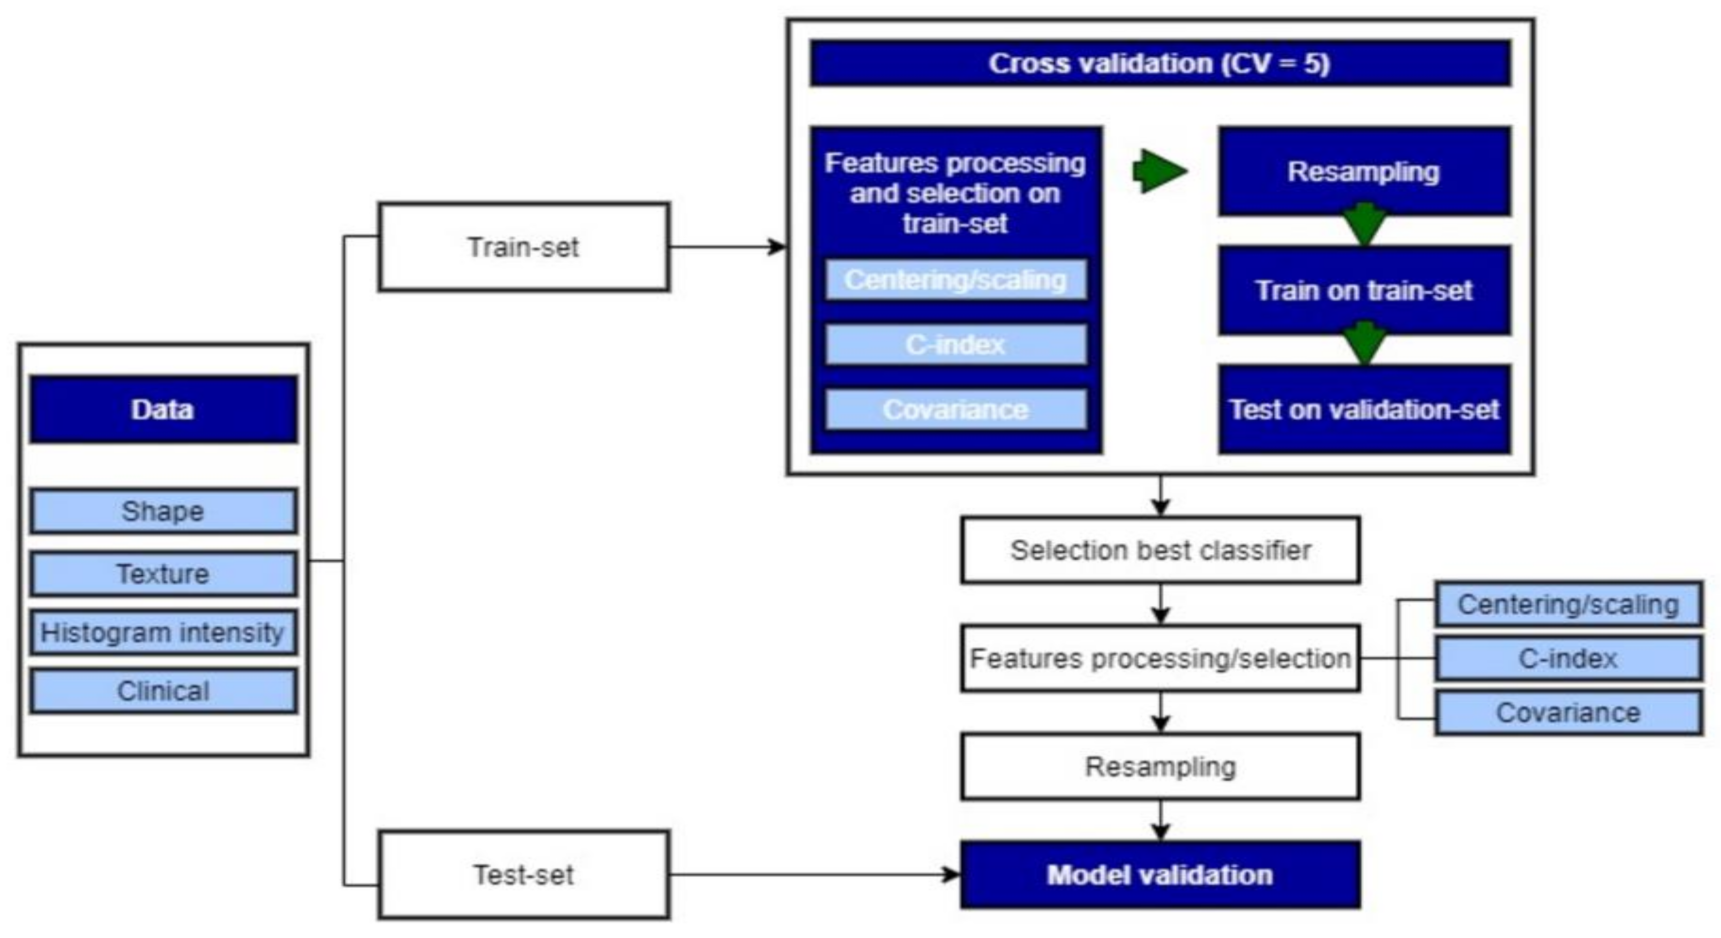
2.3.4. Machine-Learning (ML) Algorithms
2.3.5. Model Building
2.3.6. Resampling
2.4. Statistical Analysis
3. Results
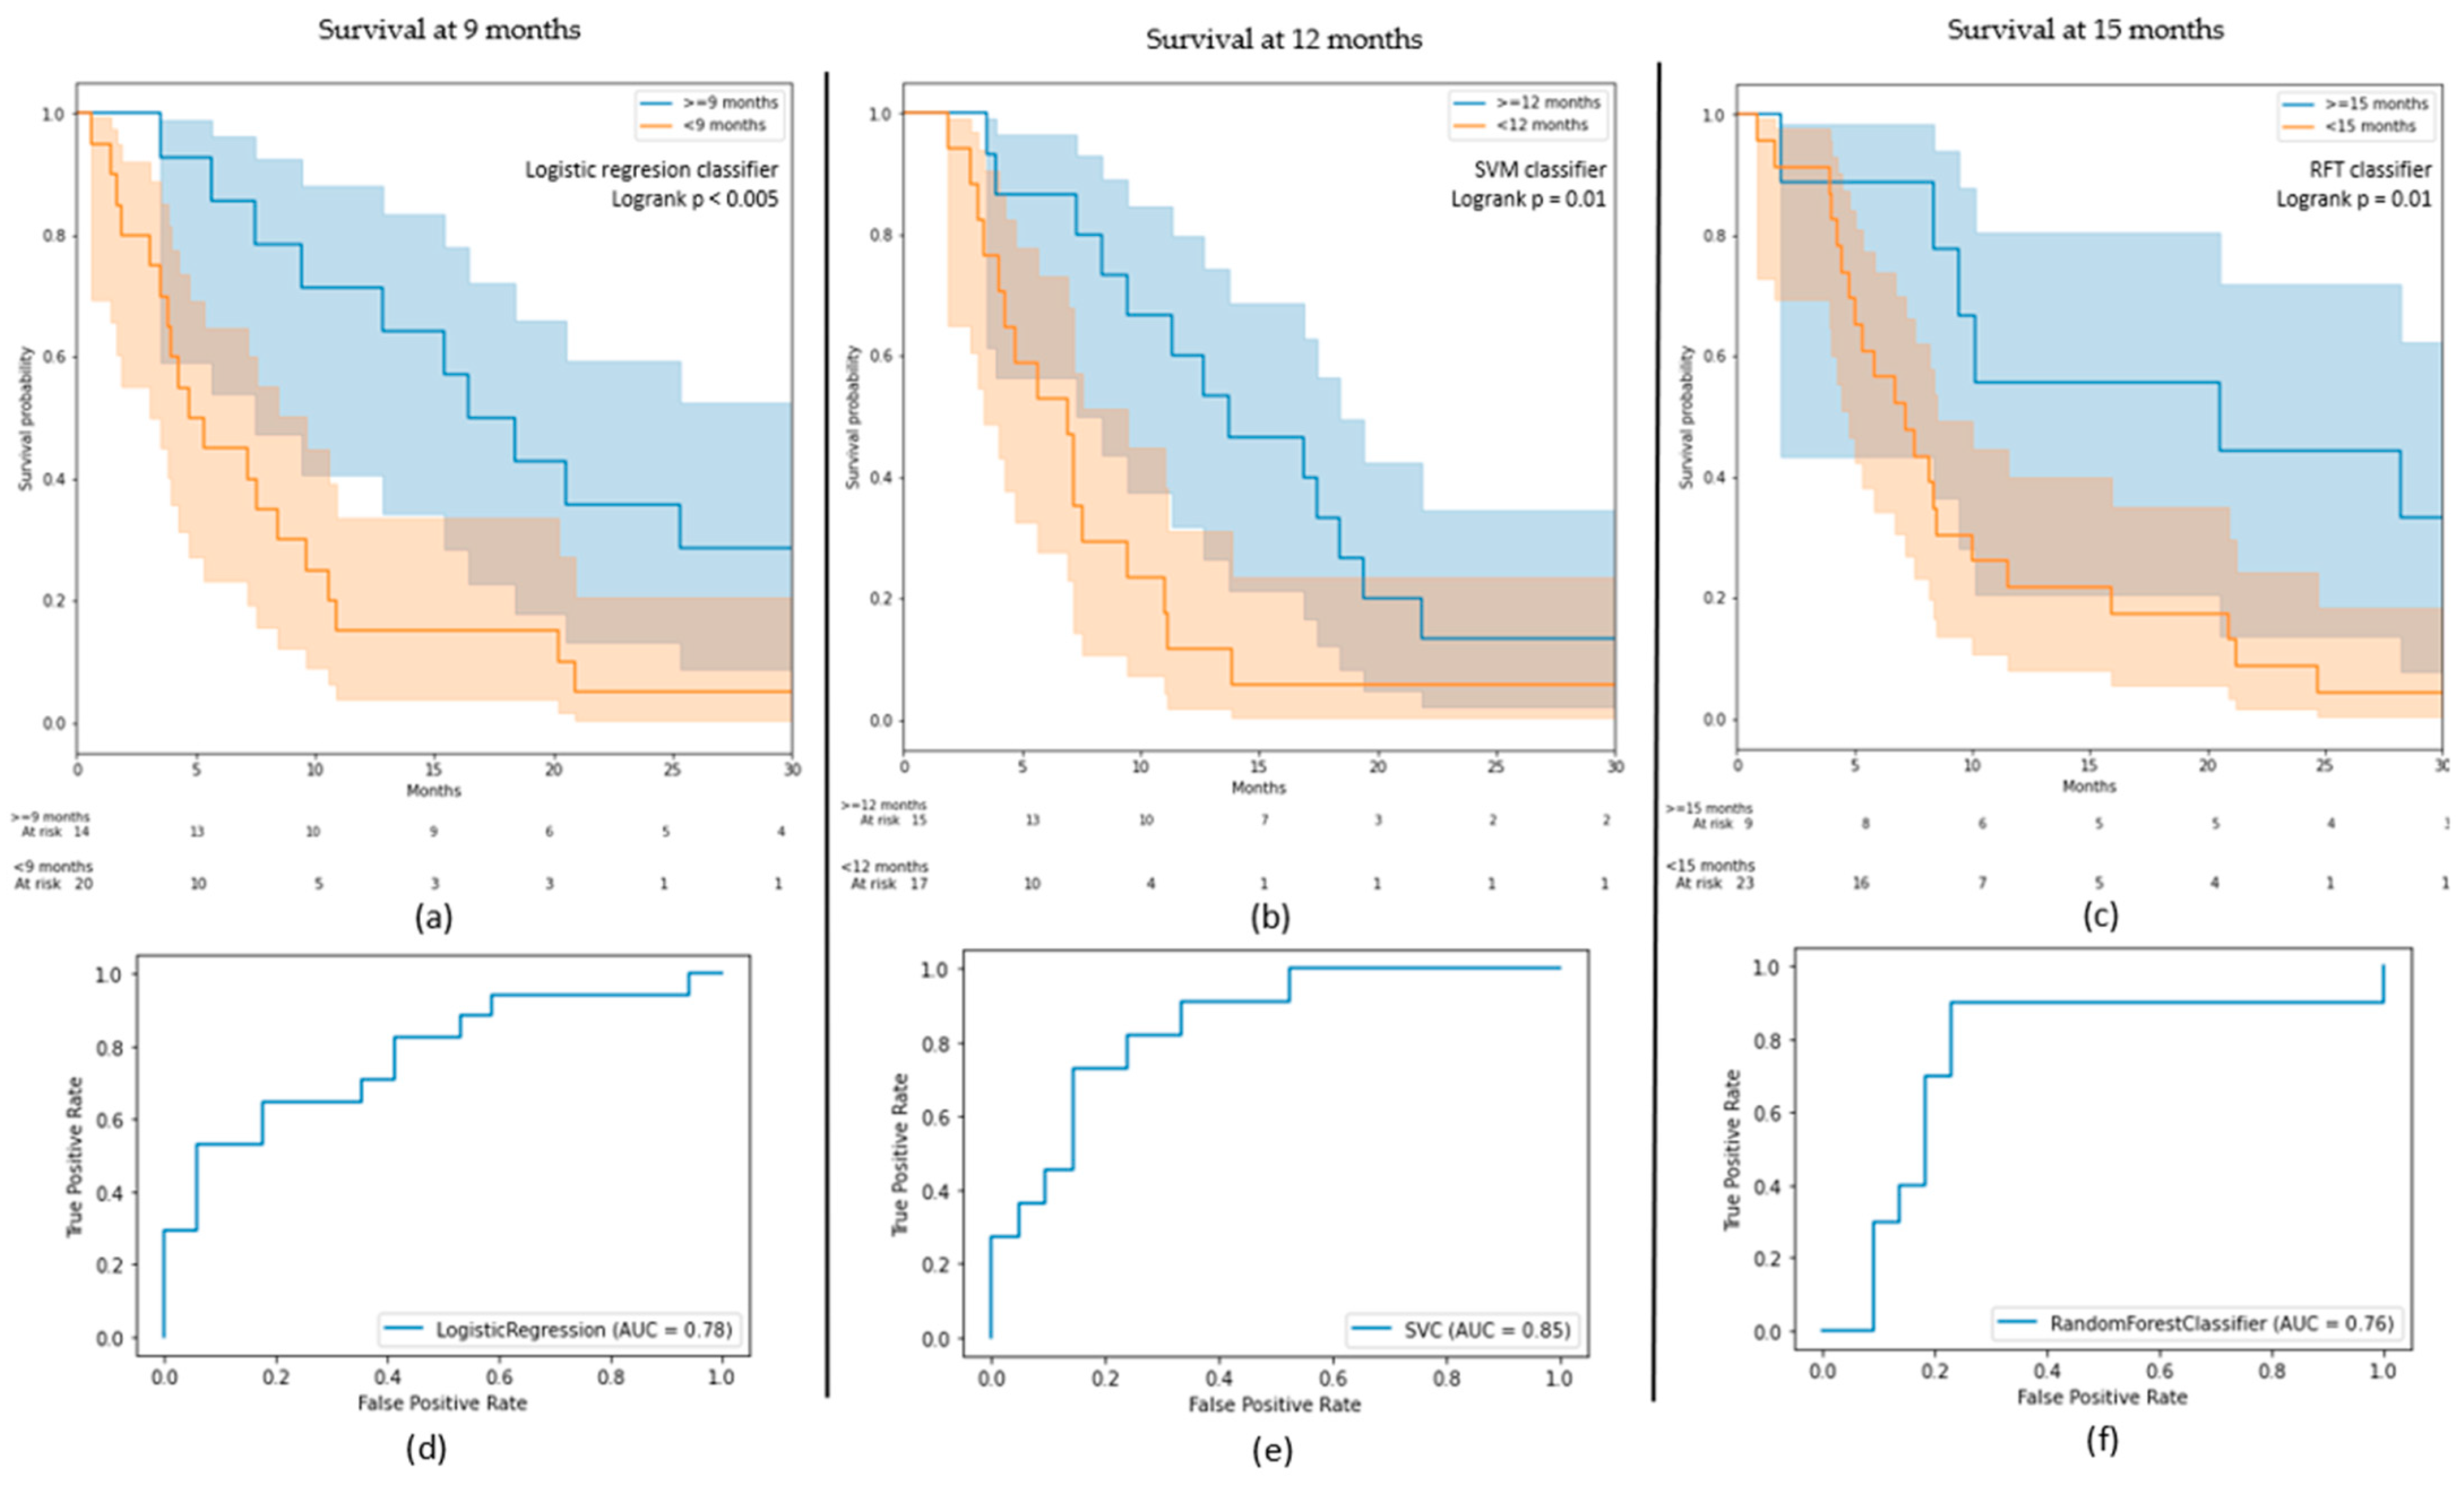
3.1. OS Outcomes
3.2. PFS Outcomes
3.3. Clinical and Radiomic Signature
4. Discussion
Supplementary Materials
Author Contributions
Funding
Institutional Review Board Statement
Informed Consent Statement
Data Availability Statement
Acknowledgments
Conflicts of Interest
References
- Wen, P.Y.; Kesari, S. Malignant Gliomas in Adults. N. Engl. J. Med. 2008, 359, 492–507. [Google Scholar] [CrossRef]
- Lapointe, S.; Perry, A.; Butowski, N.A. Primary Brain Tumours in Adults. Lancet 2018, 392, 432–446. [Google Scholar] [CrossRef]
- Nam, J.Y.; de Groot, J.F. Treatment of Glioblastoma. JOP 2017, 13, 629–638. [Google Scholar] [CrossRef] [PubMed]
- Wick, W.; Osswald, M.; Wick, A.; Winkler, F. Treatment of Glioblastoma in Adults. Adv. Neurol. Disord 2018, 11. [Google Scholar] [CrossRef]
- Mayra, P.; Cinzia, B. Sergio Schinelli Glioblastoma under Siege: An Overview of Current Therapeutic Strategies. Brain Sci. 2018, 8, 15. [Google Scholar] [CrossRef]
- Ostrom, Q.T.; Gittleman, H.; Fulop, J.; Liu, M.; Blanda, R.; Kromer, C.; Wolinsky, Y.; Kruchko, C.; Barnholtz-Sloan, J.S. CBTRUS Statistical Report: Primary Brain and Central Nervous System Tumors Diagnosed in the United States in 2008–2012. Neuro. Oncol. 2015, 17 (Suppl. 4), iv1–iv62. [Google Scholar] [CrossRef] [PubMed]
- Thakkar, J.P.; Dolecek, T.A.; Horbinski, C.; Ostrom, Q.T.; Lightner, D.D.; Barnholtz-Sloan, J.S.; Villano, J.L. Epidemiologic and Molecular Prognostic Review of Glioblastoma. Cancer Epidemiol Biomark. Prev. 2014, 23, 1985–1996. [Google Scholar] [CrossRef] [PubMed]
- Stupp, R.; Hegi, M.E.; Mason, W.P.; van den Bent, M.J.; Taphoorn, M.J.B.; Janzer, R.C.; Ludwin, S.K.; Allgeier, A.; Fisher, B.; Belanger, K.; et al. Effects of Radiotherapy with Concomitant and Adjuvant Temozolomide versus Radiotherapy Alone on Survival in Glioblastoma in a Randomised Phase III Study: 5-Year Analysis of the EORTC-NCIC Trial. Lancet Oncol. 2009, 10, 459–466. [Google Scholar] [CrossRef]
- Stupp, R.; Mason, W.P.; van den Bent, M.J.; Weller, M.; Fisher, B.; Taphoorn, M.J.B.; Belanger, K.; Brandes, A.A.; Marosi, C.; Bogdahn, U.; et al. Radiotherapy plus Concomitant and Adjuvant Temozolomide for Glioblastoma. N. Engl. J. Med. 2005, 352, 987–996. [Google Scholar] [CrossRef] [PubMed]
- Khasraw, M.; Ameratunga, M.S.; Grant, R.; Wheeler, H.; Pavlakis, N. Antiangiogenic Therapy for High-Grade Glioma. Cochrane Database Syst. Rev. 2014. [Google Scholar] [CrossRef]
- De Vleeschouwer, S. (Ed.) Glioblastoma; Codon Publications, Department of Neurosurgery, University Hospitals Leuven: Leuven, Belgium, 2017; ISBN 9780994438126. [Google Scholar]
- Takano, S.; Yoshii, Y.; Kondo, S.; Suzuki, H.; Maruno, T.; Shirai, S.; Nose, T. Concentration of vascular endothelial growth factor in the serum and tumor tissue of brain tumor patients. Cancer Res. 1996, 56, 2185–2190. [Google Scholar] [PubMed]
- Cohen, M.H.; Shen, Y.L.; Keegan, P.; Pazdur, R. FDA Drug Approval Summary: Bevacizumab (Avastin®) as Treatment of Recurrent Glioblastoma Multiforme. Oncologist 2009, 14, 1131–1138. [Google Scholar] [CrossRef]
- Ellingson, B.M.; Kim, H.J.; Woodworth, D.C.; Pope, W.B.; Cloughesy, J.N.; Harris, R.J.; Lai, A.; Nghiemphu, P.L.; Cloughesy, T.F. Recurrent Glioblastoma Treated with Bevacizumab: Contrast-Enhanced T1-Weighted Subtraction Maps Improve Tumor Delineation and Aid Prediction of Survival in a Multicenter Clinical Trial. Radiology 2014, 271, 200–210. [Google Scholar] [CrossRef]
- Lai, A.; Tran, A.; Nghiemphu, P.L.; Pope, W.B.; Solis, O.E.; Selch, M.; Filka, E.; Yong, W.H.; Mischel, P.S.; Liau, L.M.; et al. Phase II Study of Bevacizumab Plus Temozolomide During and After Radiation Therapy for Patients With Newly Diagnosed Glioblastoma Multiforme. J. Clin. Oncol. 2011, 29, 142–148. [Google Scholar] [CrossRef]
- Gilbert, M.R.; Dignam, J.J.; Armstrong, T.S.; Wefel, J.S.; Blumenthal, D.T.; Vogelbaum, M.A.; Colman, H.; Chakravarti, A.; Pugh, S.; Won, M.; et al. A Randomized Trial of Bevacizumab for Newly Diagnosed Glioblastoma. N. Engl. J. Med. 2014, 370, 699–708. [Google Scholar] [CrossRef]
- Wick, W.; Brandes, A.A.; Gorlia, T.; Bendszus, M.; Sahm, F.; Taal, W.; Taphoorn, M.J.B.; Domont, J.; Idbaih, A.; Campone, M.; et al. EORTC 26101 Phase III Trial Exploring the Combination of Bevacizumab and Lomustine in Patients with First Progression of a Glioblastoma. J. Clin. Oncol. 2016, 34, 2001. [Google Scholar] [CrossRef]
- Chinot, O.L.; Wick, W.; Mason, W.; Henriksson, R.; Saran, F.; Nishikawa, R.; Carpentier, A.F.; Hoang-Xuan, K.; Kavan, P.; Cernea, D.; et al. Bevacizumab plus Radiotherapy–Temozolomide for Newly Diagnosed Glioblastoma. N. Engl. J. Med. 2014, 370, 709–722. [Google Scholar] [CrossRef]
- Morisse, M.C.; Etienne-Selloum, N.; Bello-Roufai, D.; Blonski, M.; Taillandier, L.; Lorgis, V.; Noël, G.; Ahle, G.; Durán-Peña, A.; Boone, M.; et al. Long-Term Survival in Patients with Recurrent Glioblastoma Treated with Bevacizumab: A Multicentric Retrospective Study. J. Neurooncol. 2019, 144, 419–426. [Google Scholar] [CrossRef] [PubMed]
- Kickingereder, P.; Isensee, F.; Tursunova, I.; Petersen, J.; Neuberger, U.; Bonekamp, D.; Brugnara, G.; Schell, M.; Kessler, T.; Foltyn, M.; et al. Automated Quantitative Tumour Response Assessment of MRI in Neuro-Oncology with Artificial Neural Networks: A Multicentre, Retrospective Study. Lancet Oncol. 2019, 20, 728–740. [Google Scholar] [CrossRef]
- Grossmann, P.; Narayan, V.; Chang, K.; Rahman, R.; Abrey, L.; Reardon, D.A.; Schwartz, L.H.; Wen, P.Y.; Alexander, B.M.; Huang, R.; et al. Quantitative Imaging Biomarkers for Risk Stratification of Patients with Recurrent Glioblastoma Treated with Bevacizumab. Neuro Oncol. 2017, 19, 1688–1697. [Google Scholar] [CrossRef]
- Chang, K.; Zhang, B.; Guo, X.; Zong, M.; Rahman, R.; Sanchez, D.; Winder, N.; Reardon, D.A.; Zhao, B.; Wen, P.Y.; et al. Multimodal Imaging Patterns Predict Survival in Recurrent Glioblastoma Patients Treated with Bevacizumab. Neuro Oncol. 2016, 18, 1680–1687. [Google Scholar] [CrossRef]
- Kickingereder, P.; Götz, M.; Muschelli, J.; Wick, A.; Neuberger, U.; Shinohara, R.T.; Sill, M.; Nowosielski, M.; Schlemmer, H.-P.; Radbruch, A.; et al. Large-Scale Radiomic Profiling of Recurrent Glioblastoma Identifies an Imaging Predictor for Stratifying Anti-Angiogenic Treatment Response. Clin. Cancer Res. 2016, 22, 5765–5771. [Google Scholar] [CrossRef]
- Park, J.E.; Kim, H.S.; Jo, Y.; Yoo, R.-E.; Choi, S.H.; Nam, S.J.; Kim, J.H. Radiomics Prognostication Model in Glioblastoma Using Diffusion- and Perfusion-Weighted MRI. Sci. Rep. 2020, 10, 4250. [Google Scholar] [CrossRef] [PubMed]
- Cai, J.; Zheng, J.; Shen, J.; Yuan, Z.; Xie, M.; Gao, M.; Tan, H.; Liang, Z.; Rong, X.; Li, Y.; et al. A Radiomics Model for Predicting the Response to Bevacizumab in Brain Necrosis after Radiotherapy. Clin. Cancer Res. 2020, 26, 5438–5447. [Google Scholar] [CrossRef]
- Gupta, A.; Dwivedi, T. A Simplified Overview of World Health Organization Classification Update of Central Nervous System Tumors 2016. J. Neurosci. Rural. Pract. 2017, 8, 629–641. [Google Scholar] [CrossRef]
- Fortin, J.-P.; Cullen, N.; Sheline, Y.I.; Taylor, W.D.; Aselcioglu, I.; Cook, P.A.; Adams, P.; Cooper, C.; Fava, M.; McGrath, P.J.; et al. Harmonization of Cortical Thickness Measurements across Scanners and Sites. NeuroImage 2018, 167, 104–120. [Google Scholar] [CrossRef] [PubMed]
- Johnson, W.E.; Li, C.; Rabinovic, A. Adjusting Batch Effects in Microarray Expression Data Using Empirical Bayes Methods. Biostat. 2007, 8, 118–127. [Google Scholar] [CrossRef] [PubMed]
- Ingrisch, M.; Schneider, M.J.; Nörenberg, D.; de Figueiredo, G.N.; Maier-Hein, K.; Suchorska, B.; Schüller, U.; Albert, N.; Brückmann, H.; Reiser, M.; et al. Radiomic Analysis Reveals Prognostic Information in T1-Weighted Baseline Magnetic Resonance Imaging in Patients With Glioblastoma. Invest Radiol. 2017, 52, 360–366. [Google Scholar] [CrossRef]
- Ishwaran, H.; Kogalur, U.B.; Blackstone, E.H.; Lauer, M.S. Random Survival Forests. Ann. Appl. Stat. 2008, 2. [Google Scholar] [CrossRef]
- Sun, Y.; Wong, A.K.C.; Kamel, M.S. Classification OF Imbalanced Data: A Review. Int. J. Patt. Recogn. Artif. Intell. 2009, 23, 687–719. [Google Scholar] [CrossRef]
- Menardi, G.; Torelli, N. Training and Assessing Classification Rules with Imbalanced Data. Data Min. Knowl. Disc. 2014, 28, 92–122. [Google Scholar] [CrossRef]
- Balaña, C.; Capellades, J.; Pineda, E.; Estival, A.; Puig, J.; Domenech, S.; Verger, E.; Pujol, T.; Martinez-García, M.; Oleaga, L.; et al. Pseudoprogression as an Adverse Event of Glioblastoma Therapy. Cancer Med. 2017, 6, 2858–2866. [Google Scholar] [CrossRef] [PubMed]
- Ellingson, B.M.; Chung, C.; Pope, W.B.; Boxerman, J.L.; Kaufmann, T.J. Pseudoprogression, Radionecrosis, Inflammation or True Tumor Progression? Challenges Associated with Glioblastoma Response Assessment in an Evolving Therapeutic Landscape. J. Neurooncol. 2017, 134, 495–504. [Google Scholar] [CrossRef] [PubMed]
- Wick, W.; Chinot, O.L.; Bendszus, M.; Mason, W.; Henriksson, R.; Saran, F.; Nishikawa, R.; Revil, C.; Kerloeguen, Y.; Cloughesy, T. Evaluation of Pseudoprogression Rates and Tumor Progression Patterns in a Phase III Trial of Bevacizumab plus Radiotherapy/Temozolomide for Newly Diagnosed Glioblastoma. NEUONC 2016, 18, 1434–1441. [Google Scholar] [CrossRef]
- Buemi, F.; Guzzardi, G.; Del Sette, B.; Sponghini, A.P.; Matheoud, R.; Soligo, E.; Trisoglio, A.; Carriero, A.; Stecco, A. Apparent Diffusion Coefficient and Tumor Volume Measurements Help Stratify Progression-Free Survival of Bevacizumab-Treated Patients with Recurrent Glioblastoma Multiforme. Neuroradiol. J. 2019, 32, 241–249. [Google Scholar] [CrossRef]
- Ellingson, B.M.; Sahebjam, S.; Kim, H.J.; Pope, W.B.; Harris, R.J.; Woodworth, D.C.; Lai, A.; Nghiemphu, P.L.; Mason, W.P.; Cloughesy, T.F. Pretreatment ADC Histogram Analysis Is a Predictive Imaging Biomarker for Bevacizumab Treatment but Not Chemotherapy in Recurrent Glioblastoma. Am. J. Neuroradiol. 2014, 35, 673–679. [Google Scholar] [CrossRef] [PubMed]
- Zhang, M.; Gulotta, B.; Thomas, A.; Kaley, T.; Karimi, S.; Gavrilovic, I.; Woo, K.M.; Zhang, Z.; Arevalo-Perez, J.; Holodny, A.I.; et al. Large-Volume Low Apparent Diffusion Coefficient Lesions Predict Poor Survival in Bevacizumab-Treated Glioblastoma Patients. Neuro Oncol. 2016, 18, 735–743. [Google Scholar] [CrossRef]
- García, B.A.; Guirado, F.N.; Raya, F.N.; Denis, M.V.; Rodríguez, F.B.; Montenegro, P.G. ADC Quantification to Classify Patients Candidate to Receive Bevacizumab Treatment for Recurrent Glioblastoma. Acta Radiol. 2020, 61, 404–413. [Google Scholar] [CrossRef]
- Pope, W.B. Predictive Imaging Marker of Bevacizumab Efficacy: Perfusion MRI: Table 1. Neuro Oncol. 2015, 17, 1046–1047. [Google Scholar] [CrossRef]
- van Linde, M.E.; van der Mijn, J.C.; Pham, T.V.; Knol, J.C.; Wedekind, L.E.; Hovinga, K.E.; Aliaga, E.S.; Buter, J.; Jimenez, C.R.; Reijneveld, J.C.; et al. Evaluation of Potential Circulating Biomarkers for Prediction of Response to Chemoradiation in Patients with Glioblastoma. J. Neurooncol. 2016, 129, 221–230. [Google Scholar] [CrossRef][Green Version]
- Kickingereder, P.; Wiestler, B.; Burth, S.; Wick, A.; Nowosielski, M.; Heiland, S.; Schlemmer, H.-P.; Wick, W.; Bendszus, M.; Radbruch, A. Relative Cerebral Blood Volume Is a Potential Predictive Imaging Biomarker of Bevacizumab Efficacy in Recurrent Glioblastoma. Neuro Oncol. 2015, 17, 1139–1147. [Google Scholar] [CrossRef]
- Zheng, S.; Tao, W. Identification of Novel Transcriptome Signature as a Potential Prognostic Biomarker for Anti-Angiogenic Therapy in Glioblastoma Multiforme. Cancers 2021, 13, 1013. [Google Scholar] [CrossRef] [PubMed] [PubMed Central]
- Carvalho, B.; Lopes, J.M.; Silva, R.; Peixoto, J.; Leitão, D.; Soares, P.; Fernandes, A.C.; Linhares, P.; Vaz, R.; Lima, J. The Role of C-Met and VEGFR2 in Glioblastoma Resistance to Bevacizumab. Sci. Rep. 2021, 11, 6067. [Google Scholar] [CrossRef]
- Nishikawa, M.; Inoue, A.; Ohnishi, T.; Yano, H.; Kanemura, Y.; Kohno, S.; Ohue, S.; Ozaki, S.; Matsumoto, S.; Suehiro, S.; et al. CD44 Expression in the Tumor Periphery Predicts the Responsiveness to Bevacizumab in the Treatment of Recurrent Glioblastoma. Cancer Med. 2021, 10, 2013–2025. [Google Scholar] [CrossRef] [PubMed]
- Lopes, M.; Carvalho, B.; Vaz, R.; Linhares, P. Influence of Neutrophil–Lymphocyte Ratio in Prognosis of Glioblastoma Multiforme. J. Neurooncol. 2018, 136, 173–180. [Google Scholar] [CrossRef] [PubMed]
- La Thangue, N.B.; Kerr, D.J. Predictive Biomarkers: A Paradigm Shift towards Personalized Cancer Medicine. Nat. Rev. Clin. Oncol. 2011, 8, 587–596. [Google Scholar] [CrossRef] [PubMed]


| Characteristics | Value |
| Age----------year | |
| Mean | 56.6 |
| Median | 58 |
| Min–max | 18–80 |
| Sex----------n (%) | |
| Female | 74 (37%) |
| Male | 126 (63%) |
| OS----------days | |
| Mean | 357 |
| Median | 244 |
| Min–max | 19–2686 |
| PFS----------days | |
| Mean | 294 |
| Median | 204 |
| Min–max | 16–2686 |
| Tumour location----------n (%) | |
| Left | 93 (45%) |
| Right | 93 (47%) |
| Multifocal | 16 (8%) |
| Clinical Variable 1 | Value |
| Delay R 2----------days | |
| Mean | 415 |
| Median | 327 |
| Min–max | 23–2202 |
| Surgery---------- n (%) | |
| Yes | 143 (72%) |
| No | 57 (28%) |
| Symptoms---------- n (%) | |
| Yes | 164 (78%) |
| No | 44 (22%) |
| Neurological deficit---------- n (%) | |
| Yes | 68 (34%) |
| No | 132 (66%) |
| Epilepsy---------- n (%) | |
| Yes | 26 (13%) |
| No | 174 (87%) |
| Intracranial hypertension ---------- n (%) | |
| Yes | 41 (21%) |
| No | 159 (79%) |
| Haematological toxicity---------- n (%) | |
| Yes | 48 (24%) |
| No | 152 (76%) |
| Machine | Weighting | Sequence | TR | TE | Slice Thickness |
|---|---|---|---|---|---|
| Optima MR450w 1.5 T Installed in 2016, 70 cm tunnel, 32 channels, 40 cm z-axisFOV, gradient 40 mT/m SR 200 T/m/s. | T1 pre-contrast | 3D rapid gradient echo | 9 ms | 4.2 ms | 1 mm |
| T2-FLAIR | Turbo spin echo | 7002 ms | 138 ms | 1.4 mm | |
| DWI | EPI, two b-values (0 and 1000 mm/s) | 3349 ms | 79 ms | 4 mm | |
| T1 post-contrast | 3D rapid gradient echo | 6.1 ms | 1.2 ms | 1 mm | |
| Discovery MR 750w 3 T Installed in 2012, 70 cm tunnel, 32 channels, 50 cm z-axisFOV, gradient 44 mT/m SR 200 T/m/s. | T1 pre-contrast | 3D rapid gradient echo | 9 ms | 2.1 ms | 1 mm |
| T2-FLAIR | Turbo spin echo | 7002 ms | 118 ms | 1 mm | |
| DWI | EPI, two b-values (0 and 1000 mm/s) | 3349 ms | 62.6 ms | 3 mm | |
| T1 post-contrast | 3D rapid gradient echo | 6.1 ms | 2.1 ms | 1 mm |
| Model | Train–Test | Total |
|---|---|---|
| Survival regression | 155 39 | 194 |
| 9 months survival | 132 | 166 |
| 34 | ||
| 12 months survival | 126 | 158 |
| 32 | ||
| 15 months survival | 126 | 158 |
| 32 | ||
| 6 months progression | 147 37 | 184 |
| 12 months progression | 147 37 | 184 |
| Model | Classes | Number (%) |
|---|---|---|
| 9 months survival | ≥9 | 81 (49%) |
| <9 | 85 (51%) | |
| 12 months survival | ≥12 | 56 (35%) |
| <12 | 102 (56%) | |
| 15 months survival | ≥15 | 47 (30%) |
| <15 | 111 (70%) |
| Model | Best Classifier | AUC on Test (on Train) | Classes | Precision | Recall |
|---|---|---|---|---|---|
| 9 months survival | Logistic regression | 0.78 (0.79) | ≥9 | 0.70 | 0.82 |
| <9 | 0.79 | 0.65 | |||
| 12 months survival | SVM | 0.85 (0.82) | ≥12 | 0.88 | 0.60 |
| <12 | 0.71 | 0.82 | |||
| 15 months survival | RFT | 0.76 (0.87) | ≥15 | 0.78 | 0.82 |
| <15 | 0.56 | 0.50 |
| Feature | Source | Radiomic Type | 9 Months (C-Index) | 12 Months (C-Index) | 15 Months (C-Index) | Regression (C-Index) |
|---|---|---|---|---|---|---|
| 1st-order 10th percentile | FLAIR | Histogram intensity | 0.59 | 0.56 | 0.56 | 0.59 |
| Sphericity | Gadolinium | Shape | 0.59 | 0.60 | 0.57 | 0.59 |
| Deficit | Clinical | - | 0.56 | 0.56 | 0.58 | 0.59 |
| Symptoms | Clinical | - | 0.56 | 0.58 | 0.57 | 0.57 |
| Delay R | Clinical | - | - | 0.55 | 0.59 | 0.55 |
| Area-to-volume ratio | FLAIR | Shape | 0.57 | 0.57 | 0.55 | - |
| Difference matrix strength | FLAIR | Texture | 0.57 | 0.57 | - | 0.59 |
| Sex | Clinical | - | 0.57 | - | 0.56 | 0.59 |
Publisher’s Note: MDPI stays neutral with regard to jurisdictional claims in published maps and institutional affiliations. |
© 2021 by the authors. Licensee MDPI, Basel, Switzerland. This article is an open access article distributed under the terms and conditions of the Creative Commons Attribution (CC BY) license (https://creativecommons.org/licenses/by/4.0/).
Share and Cite
Ammari, S.; Sallé de Chou, R.; Assi, T.; Touat, M.; Chouzenoux, E.; Quillent, A.; Limkin, E.; Dercle, L.; Hadchiti, J.; Elhaik, M.; et al. Machine-Learning-Based Radiomics MRI Model for Survival Prediction of Recurrent Glioblastomas Treated with Bevacizumab. Diagnostics 2021, 11, 1263. https://doi.org/10.3390/diagnostics11071263
Ammari S, Sallé de Chou R, Assi T, Touat M, Chouzenoux E, Quillent A, Limkin E, Dercle L, Hadchiti J, Elhaik M, et al. Machine-Learning-Based Radiomics MRI Model for Survival Prediction of Recurrent Glioblastomas Treated with Bevacizumab. Diagnostics. 2021; 11(7):1263. https://doi.org/10.3390/diagnostics11071263
Chicago/Turabian StyleAmmari, Samy, Raoul Sallé de Chou, Tarek Assi, Mehdi Touat, Emilie Chouzenoux, Arnaud Quillent, Elaine Limkin, Laurent Dercle, Joya Hadchiti, Mickael Elhaik, and et al. 2021. "Machine-Learning-Based Radiomics MRI Model for Survival Prediction of Recurrent Glioblastomas Treated with Bevacizumab" Diagnostics 11, no. 7: 1263. https://doi.org/10.3390/diagnostics11071263
APA StyleAmmari, S., Sallé de Chou, R., Assi, T., Touat, M., Chouzenoux, E., Quillent, A., Limkin, E., Dercle, L., Hadchiti, J., Elhaik, M., Moalla, S., Khettab, M., Balleyguier, C., Lassau, N., Dumont, S., & Smolenschi, C. (2021). Machine-Learning-Based Radiomics MRI Model for Survival Prediction of Recurrent Glioblastomas Treated with Bevacizumab. Diagnostics, 11(7), 1263. https://doi.org/10.3390/diagnostics11071263