Abstract
Colorectal cancer (CRC) is a multifactorial malignancy, and its high incidence and mortality rate remain a global public health burden. Fibroblast growth factor receptor 4 (FGFR4) is a receptor tyrosine kinase that has been shown to play a key role in cancer development and prognosis via the activation of its downstream oncogenic signaling pathways. The present study aimed to explore the impact of FGFR4 gene polymorphisms on the risk and progression of CRC. Three FGFR4 single-nucleotide polymorphisms (SNPs), including rs1966265, rs351855, and rs7708357, were evaluated in 413 CRC cases and 413 gender- and age-matched cancer-free controls. We did not observe any significant association of three individual SNPs with the risk of CRC between the case and control group. However, while assessing the clinicopathological parameters, patients of rectal cancer possessing at least one minor allele of rs1966265 (AG and GG; AOR, 0.236; p = 0.046) or rs351855 (GA and AA; AOR, 0.191; p = 0.022) were found to develop less metastasis as compared to those who are homozygous for the major allele. Further analyses using the datasets from the Genotype-Tissue Expression (GTEx) Portal and The Cancer Genome Atlas (TCGA) revealed that rs351855 regulated FGFR4 expression in many human tissues, and increased FGFR4 levels were associated with the occurrence, advanced stage, and distal metastasis of colon adenocarcinoma. These data suggest that the amino acid change in combination with altered expression levels of FGFR4 due to genetic polymorphisms may affect CRC progression.
1. Introduction
Colorectal cancer (CRC) is among the most frequent malignancies worldwide [1]. In Taiwan, it is the most common cancer in males and the second in females, accounting for one of top common causes of cancer-related deaths [2]. Despite the current advance in surgery and other therapy options, the age-standardized mortality rate of CRC has increased over the years in Taiwan [3]. Such high incidence and death rates are largely attributed to the multifactorial nature of this neoplasm. It has been well documented that major external causes of CRC include but are not limited to diet and habitual exposure of cancer-causing substances, such as tobacco use and alcohol consumption [4]. Moreover, diverse genetic alterations that influence proteolysis, adhesion, angiogenesis, and cell growth have been demonstrated to mediate colorectal tumorigenesis [5]. In addition to host parameters, the dysbiosis of gut microflora lying at the intersection of those susceptibility factors mentioned above recently has emerged as a key determinant of CRC etiology [6]. Considering the high heterogeneity in CRC pathogenesis, all these disease risks appear to be mutually intertwined and necessary to assess the cancer prognosis.
Fibroblast growth factor receptor 4 (FGFR4) belongs to a highly conserved family of transmembrane receptor tyrosine kinases family, along with FGFR1-3. This family has been demonstrated to orchestrate a variety of oncogenic signaling involved in angiogenesis and epithelial–mesenchymal transition (EMT) in multiple types of cancers [7]. Similar with other members of the FGFR family, aberrant FGFR4 activation is linked to the formation of tumors, especially for those bearing FGF19 amplification [8]. Converging observations indicate that dysregulation of FGFR4 downstream signaling pathways, such as Wnt/β-catenin [9], JAK/STAT [10], and PI3K-AKT [11], leads to enhanced cell growth and metastatic potential in cancer progression. Recently, an explosion of investigations has revealed the associations of FGFR4 gene polymorphisms with the risk, prognosis, or treatment outcome of numerous cancer types, such as head and neck [12,13], lung [14], prostate [15,16,17], breast [18,19], colon [19], ovarian [20], liver [21], and uterine cervical cancer [22]. One FGFR4 single-nucleotide polymorphism (SNP), rs351855, has been shown to promote tumorigenesis and cancer progression in a mouse model of breast cancer [23]. In addition to the oncogenic role, rs351855 may act as an expression quantitative trait locus (eQTL) as this allele was found to be associated with increased expression of FGFR4 protein [24]. Another FGFR4 SNP, rs1966265, in combination with another Klothoβ gene variant were reported to link bile acid homeostasis to colonic transit. Nevertheless, the impact of FGFR4 gene variants on the predisposition to CRC remains incompletely defined. Here, we performed a hypothesis-driven case-control study to assess the influences of FGFR4 SNPs on the progression of CRC.
2. Materials and Methods
2.1. Subjects
This case-control study encompassed 413 patients with CRC and 413 cancer-free controls, with the approval by the institutional review board of Chung Shan Medical University Hospital in Taichung, Taiwan (IRB number CS1-20111). All participants, recruited from 2016 to 2020, provided informed written consent at enrollment. CRC patients were staged clinically at the time of diagnosis according to the TNM staging system of the American Joint Committee on Cancer (AJCC) [25]. Tumor differentiation was examined by a pathologist and rated according to the AJCC classification. In addition to the exclusion of history of cancer of any sites, subjects without self-reported asthma, diabetes, cardiovascular, neurological, and autoimmune diseases were enrolled in the control group. Demographic data on age and gender were recorded from each participant.
2.2. Genotyping
Genomic DNA was extracted from the whole blood using QIAamp DNA blood mini kits (Qiagen, Valencia, CA, USA). Evaluation of allelic discrimination for three FGFR4 SNPs (rs1966265, rs351855, and rs7708357) was conducted by using the TaqMan assay with an ABI StepOne™ Real-Time PCR System (Applied Biosystems, Foster City, CA, USA), and further evaluated with SDS version 3.0 software using the default settings (Applied Biosystems).
2.3. Statistical Analysis
The differences in demographic parameters between cases and cancer-free controls were estimated by using Fisher’s exact test. The adjusted odds ratios (AORs) with their 95% confidence intervals (CIs) for the association between genotype frequencies and the risk of CRC were calculated by multiple logistic regression models (dominant model and log-additive model) after controlling for potential confounders. Significant association between genotypes and FGFR4 expression levels in the GTEx portal was detected with the linear regression model and based on a p-value threshold determined by a web-based eQTL calculator on the GTEx portal. Tissue types (Colon and whole blood) were selected based on the location of cancer and tumor microenvironment. Clinical and mRNA expression data by RNA sequencing from patients with colon adenocarcinoma in The Cancer Genome Atlas (TCGA) were analyzed, and the differences of FGFR4 levels in the colon adenocarcinoma dataset were compared by Student’s t-test. Data were analyzed by using SAS statistical software (Version 9.1, 2005; SAS Institute Inc., Cary, NC, USA). A p-value < 0.05 was considered significant.
3. Results
3.1. Cohort Characteristics
In the present study, 413 CRC cases were recruited to explore the risk effect of FGFR4 gene polymorphisms on the development of colorectal neoplasm. Since age and gender are potential risk factors for CRC [26], 413 cancer-free controls with matched age and gender were enrolled to rule out potential confounders. The demographic and clinical characteristics of two study cohorts were evaluated (Table 1). Among the CRC cases, 106 and 307 suffered from cancers of the rectum and colon, respectively. Lymphatic spread and distal metastasis were observed in 48.4% and 16.7% of patients, respectively.

Table 1.
The distributions of demographical characteristics in 413 controls and 413 patients with CRC.
3.2. Association of FGFR4 Gene Polymorphism with the Progression of CRC
To examine the potential influence of FGFR4 gene polymorphisms on CRC progression, three SNPs from FGFR4 gene (rs1966265, rs351855, and rs7708357) were selected based on their wide associations with the development of various cancer types [13,14,16,27] and genotyped in this investigation. The distributions of genotype frequencies for each SNP in our cohort were evaluated (Table 2). We failed to individually observe any significant correlation of these FGFR4 variants with the occurrence of CRC between the case and control group. Further, we assessed the correlations of polymorphic genotypes of FGFR4 with clinicopathological characteristics of CRC patients. We found that patients of rectal cancer who carry at least one polymorphic allele of two missense SNPs (AG and GG for rs1966265; AOR, 0.236; 95% CI, 0.057–0.972; p = 0.046) (GA and AA for rs351855; AOR, 0.191; 95% CI, 0.046–0.786; p = 0.022) developed less distal metastasis (Table 3 and Table 4), yet the genetic effect was marginal as considering multiple testing. These data implicate a protective impact of FGFR4 gene polymorphisms on metastatic potential of cancers in the rectum.
Table 2.
Genotype distributions of FGFR4 gene polymorphisms in 413 controls and 413 patients with CRC.
Table 3.
Distribution frequency of the clinical status and FGFR4 rs1966265 genotype frequencies in 413 CRC patients.
Table 4.
Distribution frequency of the clinical status and FGFR4 rs351855 genotype frequencies in 413 CRC patients.
3.3. Functional and Clinical Relevance of rs351855 in CRC
Since missense SNPs, rs1966265 and rs351855, were found to be associated with CRC metastasis, additional analyses using public datasets were performed to gain putative functional relevance of these two SNPs. We found that, in addition to the amino acid change, rs351855 regulated the expression of FGFR4 in multiple human tissues, such as whole blood (p = 1.9 × 10⁻⁷, based on a p-value threshold of 1.3 × 10⁻⁴) and, to a lesser extent, the colon (p = 0.069), as determined by eQTL studies (GTEx database) (Figure 1A,B). Moreover, further analysis of data from patients with colon adenocarcinoma in TCGA dataset revealed associations of increased FGFR4 expression levels with the occurrence, advanced stage, and distal metastasis of colon cancer (Figure 2A–C). There data support genetic associations detected in our study and suggest that the amino acid change in combination with altered expression levels of FGFR4 due to genetic polymorphisms may affect CRC progression.
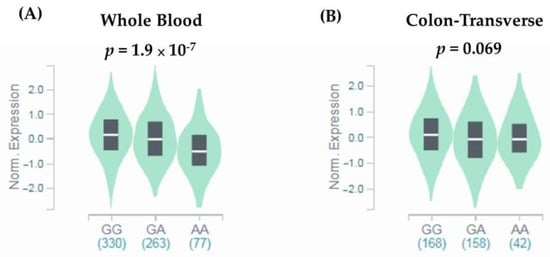
Figure 1.
rs351855 regulates the expression of FGFR4. eQTL analysis of rs351855 in representative (A) whole blood and (B) colon tissues based on data from the GTEx portal. p-Values are calculated with the linear regression model.
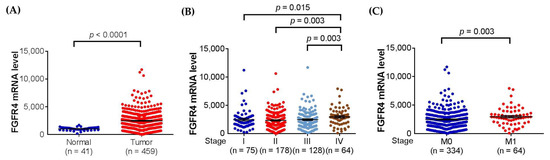
Figure 2.
FGFR4 expression levels are associated with clinicopathological parameters in colon adenocarcinoma. Correlations of increased FGFR4 expression with the (A) occurrence, (B) advanced stage (stage IV), and (C) distal metastasis of colon adenocarcinoma from The Cancer Genome Atlas (TCGA) database. p-Values are calculated with Student’s t test and adjusted by using Bonferroni correction.
4. Discussion
Accumulative evidence has manifested that CRC progression is a complex process orchestrated by both external and inherited factors. In the present study, we reported that FGFR4 gene polymorphisms, rs1966265 and rs351855, mediated the metastatic potential of CRC but did not confer the susceptibility to colorectal malignancies. In addition, rs351855 may act as an eQTL for FGFR4 gene expression, which correlated with the onset, advancement, and metastasis of colon cancer.
FGFR4 SNP, rs351855, has been extensively reported for its association with the occurrence, progression, and prognosis of multiple tumor types [28]. This genetic variation (G > A) causes the substitution of glycine by arginine at position 388 in the transmembrane domain of the receptor [19]. Functional analysis of such amino acid change indicated that both polymorphic alleles are oncogenic [29]. Specifically, FGFR4gly388 was the stronger inducer of tumor growth, whereas FGFR4arg388 was the stronger inducer of cancer cell motility and migration. In addition to altered functionality, we found that rs351855 also regulated the expression levels of FGFR4 in many tissue types. Our data and findings from other investigations of solid tumors [30] have shown that elevated FGFR4 expression, leading to activation of downstream oncogenic signaling pathways, was highly associated with cancer development. In particular, we showed that the FGFR4 expression fluctuated with the genotypes of rs351855 in blood cells, implicating a differential impact of tumor-infiltrating immune cells on CRC progression according to distinct FGFR4 activation levels among patients of different rs351855 genotypes. Of note, unlike several previous reports linking rs351855 to cancer risk [15,17,19], we failed to detect a genetic association of rs351855 with the predisposition to CRC. This discrepancy may be, in part, accounted for by variations in the allele frequency of FGFR4arg388 across the general population of different ethnic groups. It was estimated that FGFR4arg388 has an allele frequency of ~13% in the African population, roughly 30% in the European and Northeast Asian populations, and nearly 45% in the Latino and Southeast Asian (such as Taiwan) populations [28,31]. As such, rs351855 was often demonstrated to be correlated with clinicopathological features of cancer but not with the occurrence of the disease.
In our study, another missense SNP, rs1966265, was found to be associated with the metastasis of CRC. This genetic polymorphism (A > G) leads to a valine to isoleucine change at position 10 in the signal peptide of the receptor. This FGFR4 SNP in combination with another Klothoβ gene variant was previously shown to link bile acid homeostasis to colonic transit in irritable bowel syndrome (IBS) with diarrhea [32]. Exposure of cells of the gastrointestinal tract to repeated high physiologic levels of bile acids has been considered as a vital risk factor for gastrointestinal cancers [33]. In addition to host cells, bile acid malabsorption reshapes the composition of microflora in the ecosystem of the colon, and this bile acid-microbiota axis is believed to play a key role in intestinal carcinogenesis [34]. Other than gastrointestinal cancers, rs1966265 has been associated with the risk of developing breast cancer [35]. Here, we showed that patients with rectal cancer who possess at least one minor allele of rs1966265 developed less metastasis as compared with those who are homozygous for the major allele. This, for the first time, connects rs1966265 to the progression of rectal cancer.
Our data revealed an influence of FGFR4 gene variations on the metastasis of rectal cancer; however, additional work is needed to address several limitations in the study. One is that the effects of FGFR4 gene polymorphisms on the risk of developing CRC may be underestimated because of a lack of information regarding habitual drinking and smoking for adjustment. Another weakness is that the molecular mechanism underlying the protective role of rs1966265 in cancer metastasis remains an open question. Whether the genetic polymorphism (A > G) or substitution of valine by isoleucine controls the expression, membrane translocation, or downstream signaling of the receptor requires further investigations. Moreover, likely due to a limited genetic effect or sample size, the genetic relationship detected was marginal as considering multiple testing or in the absence of a replication cohort. In addition, the findings reported in this study may be unable to be extended to other ethnic groups unless replication experiments are performed.
5. Conclusions
In conclusion, our results demonstrate an association of FGFR4 SNPs (rs1966265 and rs351855) with the metastatic potential in rectal cancer. Elevated FGFR4 expression levels contribute to the occurrence of colon cancer and an inclination to develop late-staged tumors and distant metastasis. These findings reveal a novel genetic relationship between FGFR4 variants and CRC progression and suggest that the diseases of patients with specific genotypes may progress more aggressively than the others, thereby requiring extensive follow-up.
Author Contributions
Conceptualization, B.-H.S., C.-C.H. and S.-F.Y.; formal analysis, L.-C.C. and S.-F.Y., data curation, B.-H.S., M.-H.H. and M.-C.C.; resources, B.-H.S., W.-C.T., M.-C.C. and C.-C.H. writing—original draft preparation, B.-H.S., S.-C.S. and S.-F.Y.; writing—review and editing, B.-H.S., S.-C.S. and S.-F.Y. All authors have read and agreed to the published version of the manuscript.
Funding
This study was supported by a research grant from Chang Gung Memorial Hospital (BMRPE97) to S.-C.S.
Institutional Review Board Statement
The study was conducted according to the guidelines of the Declaration of Helsinki, and approved by the institutional review board of Chung Shan Medical University Hospital in Taichung, Taiwan (IRB number CS1-20111).
Informed Consent Statement
Informed consent was obtained from all subjects involved in the study.
Data Availability Statement
The data presented in this study are available on request from the corresponding author.
Acknowledgments
We would like to thank the Human Biobank of Chung Shan Medical University Hospital for providing the biological specimen and related clinical data for our research. We also thank Tissue Bank at Chang Gung Memorial Hospital, Keelung for sample preparation.
Conflicts of Interest
The authors declare no conflict of interest.
References
- Sung, H.; Ferlay, J.; Siegel, R.L.; Laversanne, M.; Soerjomataram, I.; Jemal, A.; Bray, F. Global cancer statistics 2020: GLOBOCAN estimates of incidence and mortality worldwide for 36 cancers in 185 countries. CA Cancer J. Clin. 2021, 71, 209–249. [Google Scholar] [CrossRef] [PubMed]
- Kuo, C.N.; Liao, Y.M.; Kuo, L.N.; Tsai, H.J.; Chang, W.C.; Yen, Y. Cancers in Taiwan: Practical insight from epidemiology, treatments, biomarkers, and cost. J. Formos. Med. Assoc. 2020, 119, 1731–1741. [Google Scholar] [CrossRef] [PubMed]
- Su, S.Y.; Huang, J.Y.; Jian, Z.H.; Ho, C.C.; Lung, C.C.; Liaw, Y.P. Mortality of colorectal cancer in Taiwan, 1971-2010: Temporal changes and age-period-cohort analysis. Int. J. Colorectal Dis. 2012, 27, 1665–1672. [Google Scholar] [CrossRef] [PubMed]
- Hull, R.; Francies, F.Z.; Oyomno, M.; Dlamini, Z. Colorectal Cancer Genetics, Incidence and Risk Factors: In Search for Targeted Therapies. Cancer Manag. Res. 2020, 12, 9869–9882. [Google Scholar] [CrossRef] [PubMed]
- Takayama, T.; Miyanishi, K.; Hayashi, T.; Sato, Y.; Niitsu, Y. Colorectal cancer: Genetics of development and metastasis. J. Gastroenterol. 2006, 41, 185–192. [Google Scholar] [CrossRef] [PubMed]
- Brennan, C.A.; Garrett, W.S. Gut Microbiota, Inflammation, and Colorectal Cancer. Annu. Rev. Microbiol. 2016, 70, 395–411. [Google Scholar] [CrossRef]
- Babina, I.S.; Turner, N.C. Advances and challenges in targeting FGFR signalling in cancer. Nat. Rev. Cancer 2017, 17, 318–332. [Google Scholar] [CrossRef]
- Liu, Y.; Cao, M.; Cai, Y.; Li, X.; Zhao, C.; Cui, R. Dissecting the Role of the FGF19-FGFR4 Signaling Pathway in Cancer Development and Progression. Front. Cell Dev. Biol. 2020, 8, 95. [Google Scholar] [CrossRef]
- Pai, R.; Dunlap, D.; Qing, J.; Mohtashemi, I.; Hotzel, K.; French, D.M. Inhibition of fibroblast growth factor 19 reduces tumor growth by modulating beta-catenin signaling. Cancer Res. 2008, 68, 5086–5095. [Google Scholar] [CrossRef]
- Hart, K.C.; Robertson, S.C.; Kanemitsu, M.Y.; Meyer, A.N.; Tynan, J.A.; Donoghue, D.J. Transformation and Stat activation by derivatives of FGFR1, FGFR3, and FGFR4. Oncogene 2000, 19, 3309–3320. [Google Scholar] [CrossRef]
- Touat, M.; Ileana, E.; Postel-Vinay, S.; Andre, F.; Soria, J.C. Targeting FGFR Signaling in Cancer. Clin. Cancer Res. 2015, 21, 2684–2694. [Google Scholar] [CrossRef]
- Farnebo, L.; Tiefenbock, K.; Ansell, A.; Thunell, L.K.; Garvin, S.; Roberg, K. Strong expression of survivin is associated with positive response to radiotherapy and improved overall survival in head and neck squamous cell carcinoma patients. Int. J. Cancer 2013, 133, 1994–2003. [Google Scholar] [CrossRef] [PubMed]
- Chou, C.H.; Hsieh, M.J.; Chuang, C.Y.; Lin, J.T.; Yeh, C.M.; Tseng, P.Y.; Yang, S.F.; Chen, M.K.; Lin, C.W. Functional FGFR4 Gly388Arg polymorphism contributes to oral squamous cell carcinoma susceptibility. Oncotarget 2017, 8, 96225–96238. [Google Scholar] [CrossRef] [PubMed]
- Li, J.P.; Huang, H.C.; Yang, P.J.; Chang, C.Y.; Chao, Y.H.; Tsao, T.C.; Huang, H.; Hung, Y.C.; Hsieh, M.J.; Yang, S.F. FGFR4 Gene Polymorphism Reduces the Risk of Distant Metastasis in Lung Adenocarcinoma in Taiwan. Int. J. Environ. Res. Public Health 2020, 17, 5694. [Google Scholar] [CrossRef] [PubMed]
- Ma, Z.; Tsuchiya, N.; Yuasa, T.; Inoue, T.; Kumazawa, T.; Narita, S.; Horikawa, Y.; Tsuruta, H.; Obara, T.; Saito, M.; et al. Polymorphisms of fibroblast growth factor receptor 4 have association with the development of prostate cancer and benign prostatic hyperplasia and the progression of prostate cancer in a Japanese population. Int. J. Cancer 2008, 123, 2574–2579. [Google Scholar] [CrossRef]
- FitzGerald, L.M.; Karlins, E.; Karyadi, D.M.; Kwon, E.M.; Koopmeiners, J.S.; Stanford, J.L.; Ostrander, E.A. Association of FGFR4 genetic polymorphisms with prostate cancer risk and prognosis. Prostate Cancer Prostatic Dis. 2009, 12, 192–197. [Google Scholar] [CrossRef]
- Wang, J.; Stockton, D.W.; Ittmann, M. The fibroblast growth factor receptor-4 Arg388 allele is associated with prostate cancer initiation and progression. Clin. Cancer Res. 2004, 10, 6169–6178. [Google Scholar] [CrossRef]
- Marme, F.; Werft, W.; Benner, A.; Burwinkel, B.; Sinn, P.; Sohn, C.; Lichter, P.; Hahn, M.; Schneeweiss, A. FGFR4 Arg388 genotype is associated with pathological complete response to neoadjuvant chemotherapy for primary breast cancer. Ann. Oncol. 2010, 21, 1636–1642. [Google Scholar] [CrossRef]
- Bange, J.; Prechtl, D.; Cheburkin, Y.; Specht, K.; Harbeck, N.; Schmitt, M.; Knyazeva, T.; Muller, S.; Gartner, S.; Sures, I.; et al. Cancer progression and tumor cell motility are associated with the FGFR4 Arg(388) allele. Cancer Res. 2002, 62, 840–847. [Google Scholar]
- Marme, F.; Hielscher, T.; Hug, S.; Bondong, S.; Zeillinger, R.; Castillo-Tong, D.C.; Sehouli, J.; Braicu, I.; Vergote, I.; Isabella, C.; et al. Fibroblast growth factor receptor 4 gene (FGFR4) 388Arg allele predicts prolonged survival and platinum sensitivity in advanced ovarian cancer. Int. J. Cancer 2012, 131, E586–E591. [Google Scholar] [CrossRef]
- Yang, Y.; Zhou, Y.; Lu, M.; An, Y.; Li, R.; Chen, Y.; Lu, D.R.; Jin, L.; Zhou, W.P.; Qian, J.; et al. Association between fibroblast growth factor receptor 4 polymorphisms and risk of hepatocellular carcinoma. Mol. Carcinog. 2012, 51, 515–521. [Google Scholar] [CrossRef]
- Chen, T.H.; Yang, S.F.; Liu, Y.F.; Lin, W.L.; Han, C.P.; Wang, P.H. Association of Fibroblast Growth Factor Receptor 4 Genetic Polymorphisms With the Development of Uterine Cervical Cancer and Patient Prognosis. Reprod. Sci. 2018, 25, 86–93. [Google Scholar] [CrossRef]
- Seitzer, N.; Mayr, T.; Streit, S.; Ullrich, A. A single nucleotide change in the mouse genome accelerates breast cancer progression. Cancer Res. 2010, 70, 802–812. [Google Scholar] [CrossRef]
- Wei, W.; You, Z.; Sun, S.; Wang, Y.; Zhang, X.; Pang, D.; Jiang, Y. Prognostic implications of fibroblast growth factor receptor 4 polymorphisms in primary breast cancer. Mol. Carcinog. 2018, 57, 988–996. [Google Scholar] [CrossRef]
- Edge, S.B.; Compton, C.C. The American Joint Committee on Cancer: The 7th edition of the AJCC cancer staging manual and the future of TNM. Ann. Surg. Oncol. 2010, 17, 1471–1474. [Google Scholar] [CrossRef] [PubMed]
- Rawla, P.; Sunkara, T.; Barsouk, A. Epidemiology of colorectal cancer: Incidence, mortality, survival, and risk factors. Prz. Gastroenterol. 2019, 14, 89–103. [Google Scholar] [CrossRef] [PubMed]
- Tsay, M.D.; Hsieh, M.J.; Lee, C.Y.; Wang, S.S.; Chen, C.S.; Hung, S.C.; Lin, C.Y.; Yang, S.F. Involvement of FGFR4 Gene Variants on the Clinicopathological Severity in Urothelial Cell Carcinoma. Int. J. Environ. Res. Public Health 2019, 17, 129. [Google Scholar] [CrossRef] [PubMed]
- Moazeni-Roodi, A.; Sarabandi, S.; Karami, S.; Hashemi, M.; Ghavami, S. An updated meta-analysis of the association between fibroblast growth factor receptor 4 polymorphisms and susceptibility to cancer. Biosci. Rep. 2020, 40. [Google Scholar] [CrossRef] [PubMed]
- Heinzle, C.; Gsur, A.; Hunjadi, M.; Erdem, Z.; Gauglhofer, C.; Stattner, S.; Karner, J.; Klimpfinger, M.; Wrba, F.; Reti, A.; et al. Differential effects of polymorphic alleles of FGF receptor 4 on colon cancer growth and metastasis. Cancer Res. 2012, 72, 5767–5777. [Google Scholar] [CrossRef] [PubMed]
- Levine, K.M.; Ding, K.; Chen, L.; Oesterreich, S. FGFR4: A promising therapeutic target for breast cancer and other solid tumors. Pharmacol. Ther. 2020, 214, 107590. [Google Scholar] [CrossRef]
- Lek, M.; Karczewski, K.J.; Minikel, E.V.; Samocha, K.E.; Banks, E.; Fennell, T.; O’Donnell-Luria, A.H.; Ware, J.S.; Hill, A.J.; Cummings, B.B.; et al. Analysis of protein-coding genetic variation in 60,706 humans. Nature 2016, 536, 285–291. [Google Scholar] [CrossRef] [PubMed]
- Wong, B.S.; Camilleri, M.; Carlson, P.J.; Guicciardi, M.E.; Burton, D.; McKinzie, S.; Rao, A.S.; Zinsmeister, A.R.; Gores, G.J. A Klothobeta variant mediates protein stability and associates with colon transit in irritable bowel syndrome with diarrhea. Gastroenterology 2011, 140, 1934–1942. [Google Scholar] [CrossRef] [PubMed]
- Ajouz, H.; Mukherji, D.; Shamseddine, A. Secondary bile acids: An underrecognized cause of colon cancer. World J. Surg. Oncol. 2014, 12, 164. [Google Scholar] [CrossRef] [PubMed]
- Liu, T.; Song, X.; Khan, S.; Li, Y.; Guo, Z.; Li, C.; Wang, S.; Dong, W.; Liu, W.; Wang, B.; et al. The gut microbiota at the intersection of bile acids and intestinal carcinogenesis: An old story, yet mesmerizing. Int. J. Cancer 2020, 146, 1780–1790. [Google Scholar] [CrossRef]
- Jiang, Y.; Sun, S.; Wei, W.; Ren, Y.; Liu, J.; Pang, D. Association of FGFR3 and FGFR4 gene polymorphisms with breast cancer in Chinese women of Heilongjiang province. Oncotarget 2015, 6, 34023–34029. [Google Scholar] [CrossRef][Green Version]
Publisher’s Note: MDPI stays neutral with regard to jurisdictional claims in published maps and institutional affiliations. |
© 2021 by the authors. Licensee MDPI, Basel, Switzerland. This article is an open access article distributed under the terms and conditions of the Creative Commons Attribution (CC BY) license (https://creativecommons.org/licenses/by/4.0/).