
Machine Learning Quantitation of Cardiovascular and Cerebrovascular Disease: A Systematic Review of Clinical Applications

 ,
,  , , and
Abstract
1. Introduction
2. Materials and Methods
2.1. Data Sources
2.2. Data Extraction and Quality Assessment
3. Results
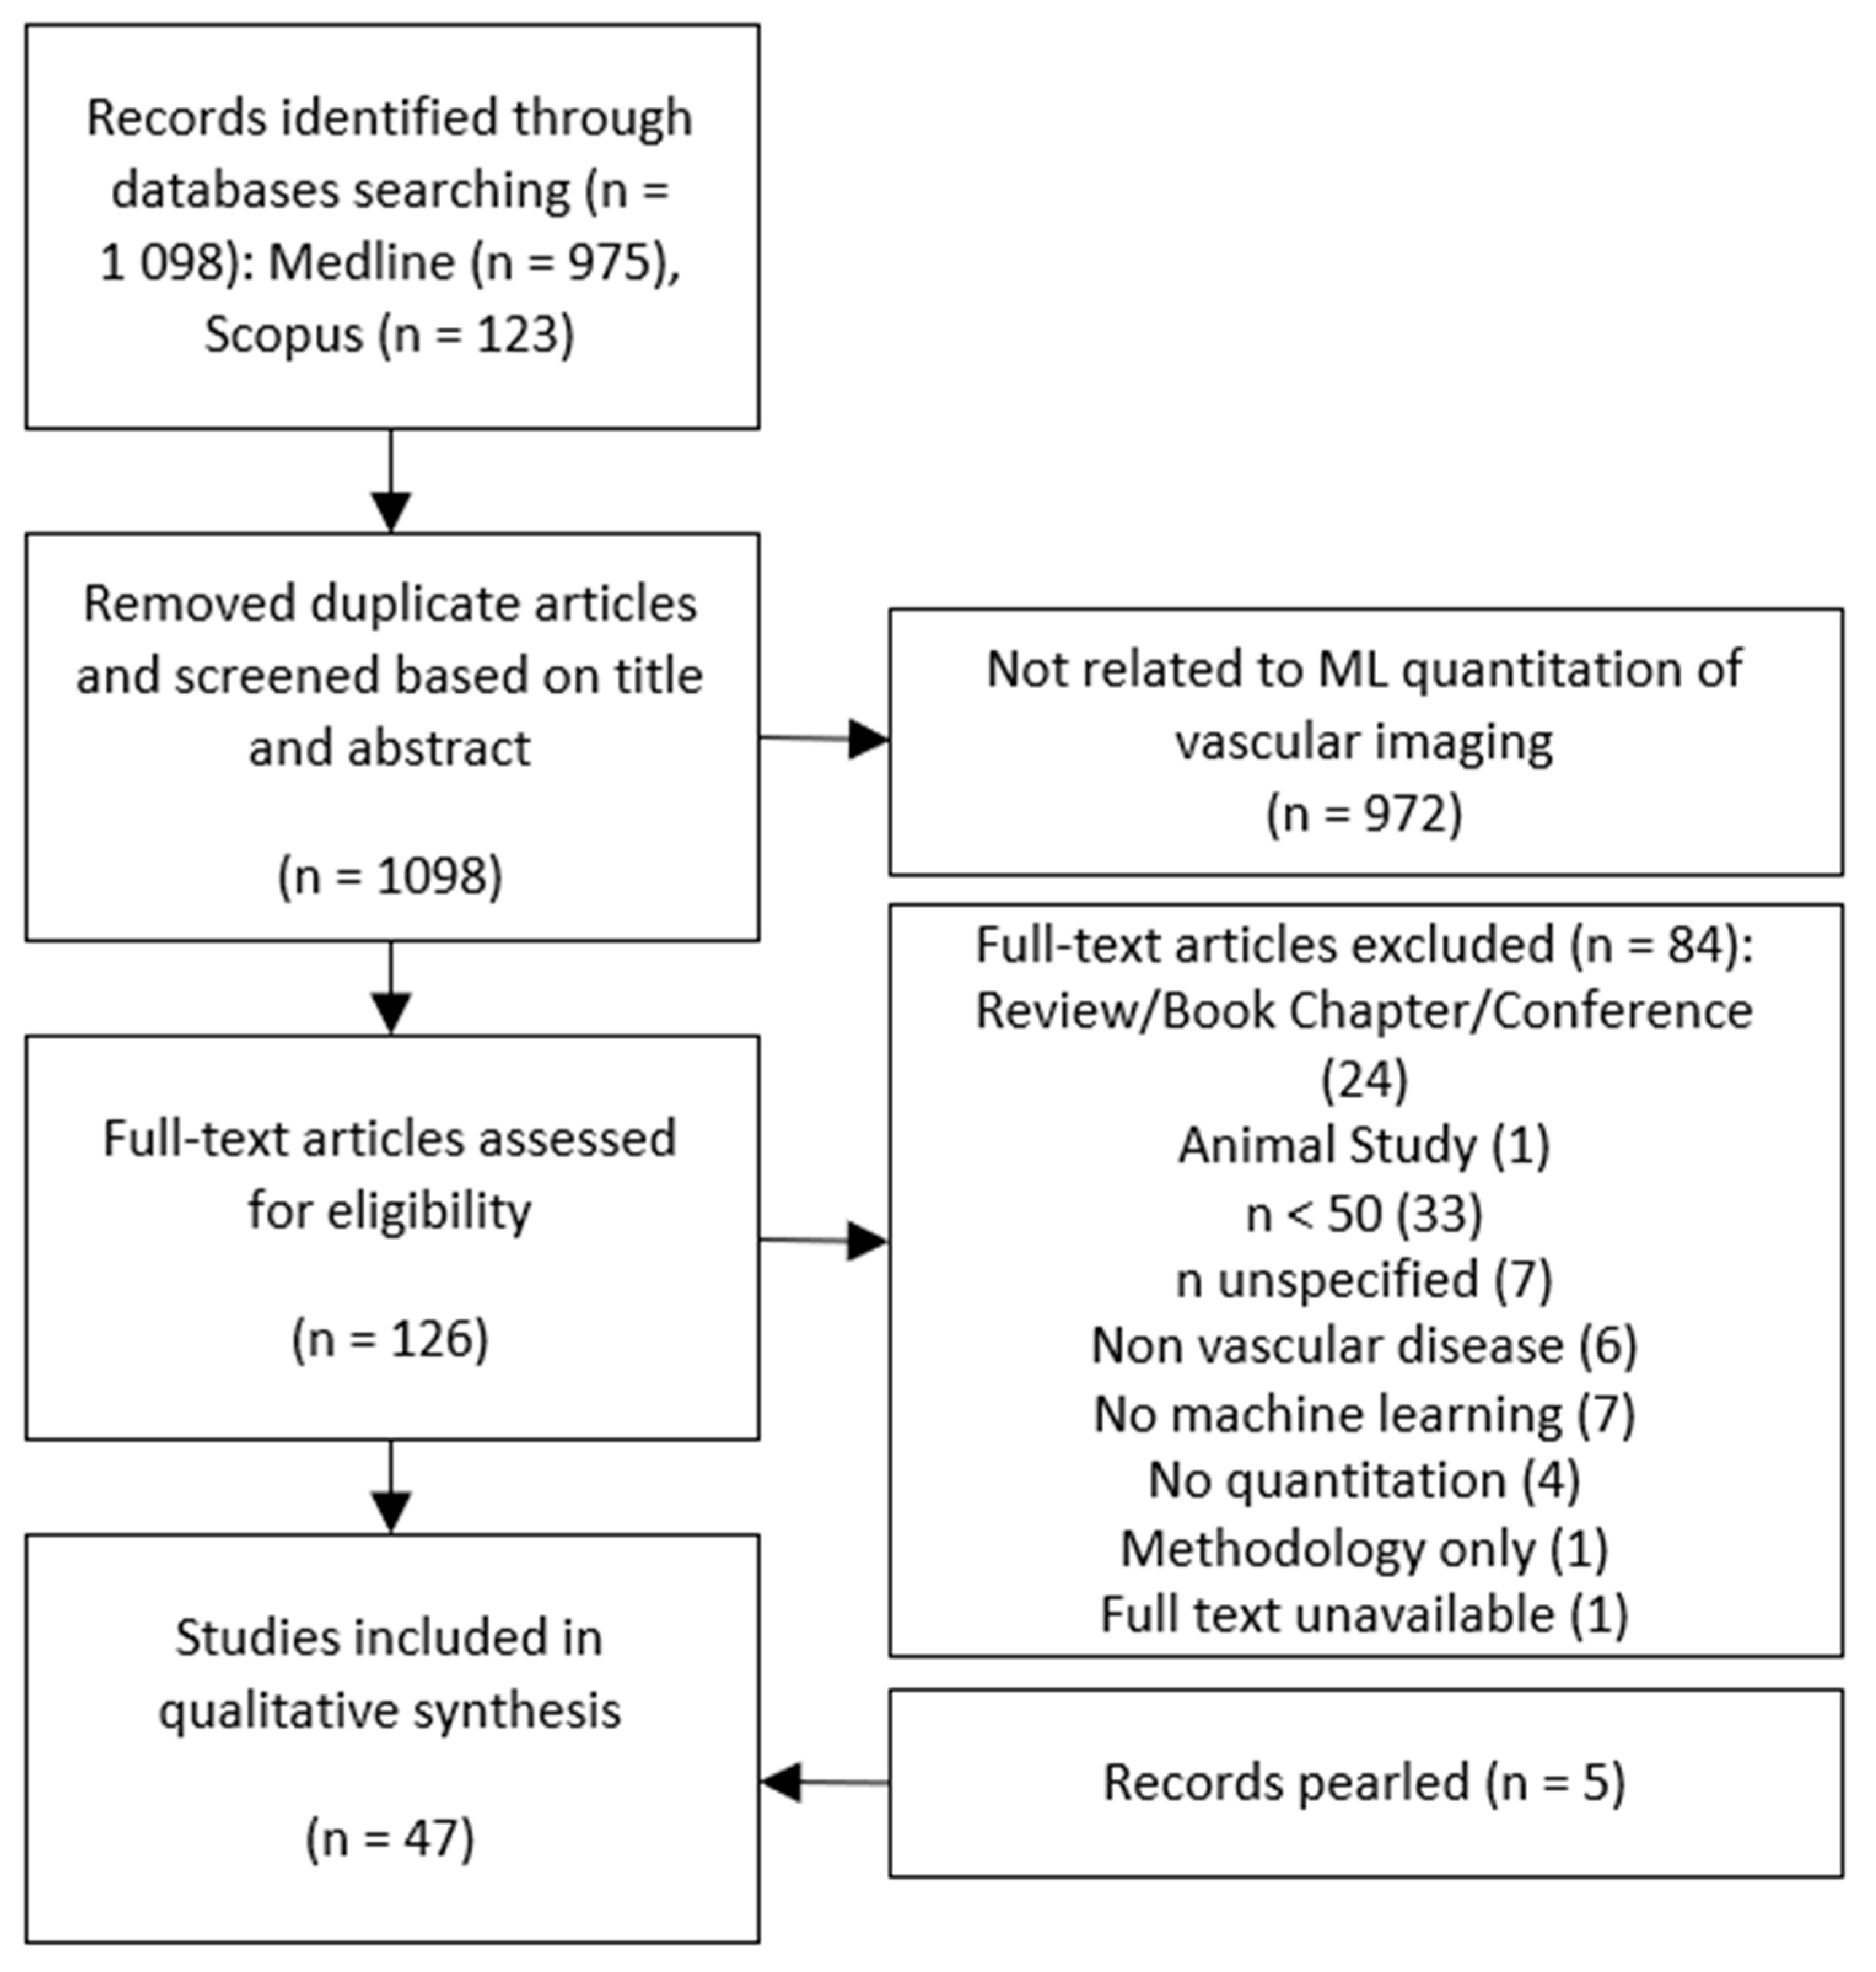
3.1. Literature Search
3.2. Modality Specific Vascular Imaging
3.2.1. Computed Tomography Angiography
3.2.2. Ultrasound
3.2.3. Other Imaging Modalities
Magnetic Resonance Imaging
Nuclear Medicine
4. Discussion
4.1. Limitations and Future Work
4.1.1. Common Machine Learning Limitations
4.1.2. Reference Standards
4.1.3. Image Standards
4.1.4. Reporting Standards
5. Conclusions
Author Contributions
Funding
Institutional Review Board Statement
Informed Consent Statement
Conflicts of Interest
References
- GBD 2015 Mortality and Causes of Death Collaborators. Global, regional, and national life expectancy, all-cause mortality, and cause-specific mortality for 249 causes of death, 1980–2015: A systematic analysis for the Global Burden of Disease Study 2015. Lancet 2016, 388, 1459–1544. [Google Scholar] [CrossRef]
- Nowbar, A.N.; Gitto, M.; Howard, J.P.; Francis, D.P.; Al-Lamee, R. Mortality From Ischemic Heart Disease. Circ. Cardiovasc. Qual. Outcomes 2019, 12, e005375. [Google Scholar] [CrossRef] [PubMed]
- Feigin, V.L.; Norrving, B.; Mensah, G.A. Global Burden of Stroke. Circ. Res. 2017, 120, 439–448. [Google Scholar] [CrossRef] [PubMed]
- American Stroke Association. Types of Stroke. Available online: www.strokeassociation.org/en/about-stroke/types-of-stroke (accessed on 4 December 2019).
- Birenbaum, D.; Bancroft, L.W.; Felsberg, G.J. Imaging in acute stroke. West. J. Emerg. Med. 2011, 12, 67–76. [Google Scholar]
- Flachskampf, F.A.; Schmid, M.; Rost, C.; Achenbach, S.; DeMaria, A.N. Cardiac imaging after myocardial infarction. Eur. Heart J. 2011, 32. [Google Scholar] [CrossRef] [PubMed]
- Russell, S.; Norvig, P. Artificial Intelligence: A Modern Approach, 3 ed.; Prentice Hall: Upper Saddle River, NJ, USA, 2010; p. 1132. [Google Scholar]
- Buch, V.H.; Ahmed, I.; Maruthappu, M. Artificial intelligence in medicine: Current trends and future possibilities. Br. J. Gen. Pract. 2018, 68, 143–144. [Google Scholar] [CrossRef]
- Pesapane, F.; Codari, M.; Sardanelli, F. Artificial intelligence in medical imaging: Threat or opportunity? Radiologists again at the forefront of innovation in medicine. Eur. Radiol. Exp. 2018, 2, 35. [Google Scholar] [CrossRef]
- Erickson, B.J.; Korfiatis, P.; Akkus, Z.; Kline, T.L. Machine Learning for Medical Imaging. Radiographics 2017, 37, 505–515. [Google Scholar] [CrossRef]
- Bishop, C.M. Pattern Recognition and Machine Learning; Springer: New York, NY, USA, 2006. [Google Scholar]
- Shen, D.; Wu, G.; Suk, H.I. Deep Learning in Medical Image Analysis. Annu. Rev. Biomed. Eng. 2017, 19, 221–248. [Google Scholar] [CrossRef]
- Hesamian, M.H.; Jia, W.; He, X.; Kennedy, P. Deep Learning Techniques for Medical Image Segmentation: Achievements and Challenges. J. Digit. Imaging 2019, 32, 582–596. [Google Scholar] [CrossRef]
- Litjens, G.; Kooi, T.; Bejnordi, B.E.; Setio, A.A.A.; Ciompi, F.; Ghafoorian, M.; van der Laak, J.A.W.M.; van Ginneken, B.; Sánchez, C.I. A survey on deep learning in medical image analysis. Med. Image Anal. 2017, 42, 60–88. [Google Scholar] [CrossRef] [PubMed]
- Faust, O.; Acharya, U.R.; Sudarshan, V.K.; Tan, R.S.; Yeong, C.H.; Molinari, F.; Ng, K.H. Computer aided diagnosis of Coronary Artery Disease, Myocardial Infarction and carotid atherosclerosis using ultrasound images: A review. Phys. Med. 2017, 33, 1–15. [Google Scholar] [CrossRef]
- Liu, S.; Wang, Y.; Yang, X.; Lei, B.; Liu, L.; Li, S.X.; Ni, D.; Wang, T. Deep Learning in Medical Ultrasound Analysis: A Review. Engineering 2019, 5, 261–275. [Google Scholar] [CrossRef]
- Jodas, D.S.; Pereira, A.S.; Tavares, J.M.R.S. A review of computational methods applied for identification and quantification of atherosclerotic plaques in images. Expert Syst. Appl. 2016, 46, 1–14. [Google Scholar] [CrossRef]
- Commandeur, F.; Goeller, M.; Dey, D. Cardiac CT: Technological Advances in Hardware, Software, and Machine Learning Applications. Curr. Cardiovasc. Imaging Rep. 2018, 11. [Google Scholar] [CrossRef] [PubMed]
- Gandhi, S.; Mosleh, W.; Shen, J.; Chow, C.M. Automation, machine learning, and artificial intelligence in echocardiography: A brave new world. Echocardiography 2018, 35, 1402–1418. [Google Scholar] [CrossRef]
- Krittanawong, C.; Zhang, H.; Wang, Z.; Aydar, M.; Kitai, T. Artificial Intelligence in Precision Cardiovascular Medicine. J. Am. Coll. Cardiol. 2017, 69, 2657–2664. [Google Scholar] [CrossRef]
- Henglin, M.; Stein, G.; Hushcha, P.V.; Snoek, J.; Wiltschko, A.B.; Cheng, S. Machine Learning Approaches in Cardiovascular Imaging. Circ. Cardiovasc. Imaging 2017, 10. [Google Scholar] [CrossRef]
- Opincariu, D.; Benedek, T.; Chitu, M.; Rat, N.; Benedek, I. From CT to artificial intelligence for complex assessment of plaque-associated risk. Int. J. Card. Imaging 2020, 36, 2403–2427. [Google Scholar] [CrossRef]
- Sharma, A.M.; Gupta, A.; Kumar, P.K.; Rajan, J.; Saba, L.; Nobutaka, I.; Laird, J.R.; Nicolades, A.; Suri, J.S. A Review on Carotid Ultrasound Atherosclerotic Tissue Characterization and Stroke Risk Stratification in Machine Learning Framework. Curr. Atheroscler. Rep. 2015, 17, 55. [Google Scholar] [CrossRef]
- Soun, J.E.; Chow, D.S.; Nagamine, M.; Takhtawala, R.S.; Filippi, C.G.; Yu, W.; Chang, P.D. Artificial Intelligence and Acute Stroke Imaging. AJNR Am. J. Neuroradiol. 2021, 42, 2–11. [Google Scholar] [CrossRef] [PubMed]
- Muscogiuri, G.; Van Assen, M.; Tesche, C.; De Cecco, C.N.; Chiesa, M.; Scafuri, S.; Guglielmo, M.; Baggiano, A.; Fusini, L.; Guaricci, A.I.; et al. Artificial Intelligence in Coronary Computed Tomography Angiography: From Anatomy to Prognosis. BioMed Res. Int. 2020, 2020, 6649410. [Google Scholar] [CrossRef]
- Australian Institute of Health and Welfare. Australia’s Health 2018; Australia’s Health Series no. 16; AIHW: Canberra, Australia, 2018. [Google Scholar]
- Liberati, A.; Altman, D.G.; Tetzlaff, J.; Mulrow, C.; Gotzsche, P.C.; Ioannidis, J.P.; Clarke, M.; Devereaux, P.J.; Kleijnen, J.; Moher, D. The PRISMA statement for reporting systematic reviews and meta-analyses of studies that evaluate health care interventions: Explanation and elaboration. PLoS Med. 2009, 6, e1000100. [Google Scholar] [CrossRef] [PubMed]
- Uchino, E.; Kubota, R.; Koga, T.; Misawa, H.; Suetake, N. Multiple k-nearest neighbor classifier and its application to tissue characterization of coronary plaque. IEICE Trans. Inf. Syst. 2016, E99D, 1920–1927. [Google Scholar] [CrossRef]
- Menchón-Lara, R.M.; Sancho-Gómez, J.L.; Bueno-Crespo, A. Early-stage atherosclerosis detection using deep learning over carotid ultrasound images. Appl. Soft Comput. J. 2016, 49, 616–628. [Google Scholar] [CrossRef]
- Khowaja, S.A.; Unar, M.A.; Ismaili, I.A.; Khuwaja, P. Supervised method for blood vessel segmentation from coronary angiogram images using 7-D feature vector. Imaging Sci. J. 2016, 64, 196–203. [Google Scholar] [CrossRef]
- Rosati, S.; Meiburger, K.M.; Balestra, G.; Acharya, U.R.; Molinari, F. Carotid wall measurement and assessment based on pixel-based and local texture descriptors. J. Mech. Med. Biol. 2016, 16. [Google Scholar] [CrossRef]
- Jawaid, M.M.; Narejo, S.; Pirzada, N.; Baloch, J.; Reyes-Aldasoro, C.C.; Slabaugh, G. Automated Quantification of Non-Calcified Coronary Plaques in Cardiac CT Angiographic Imagery. Int. J. Adv. Comput. Sc. 2018, 9, 216–222. [Google Scholar] [CrossRef]
- Hassan, M.; Chaudhry, A.; Khan, A.; Iftikhar, M.A. Robust information gain based fuzzy c-means clustering and classification of carotid artery ultrasound images. Comput. Methods Programs Biomed. 2014, 113, 593–609. [Google Scholar] [CrossRef]
- Bae, Y.; Kang, S.J.; Kim, G.; Lee, J.G.; Min, H.S.; Cho, H.; Kang, D.Y.; Lee, P.H.; Ahn, J.M.; Park, D.W.; et al. Prediction of coronary thin-cap fibroatheroma by intravascular ultrasound-based machine learning. Atherosclerosis 2019, 288, 168–174. [Google Scholar] [CrossRef] [PubMed]
- Araki, T.; Ikeda, N.; Shukla, D.; Londhe, N.D.; Shrivastava, V.K.; Banchhor, S.K.; Saba, L.; Nicolaides, A.; Shafique, S.; Laird, J.R.; et al. A new method for IVUS-based coronary artery disease risk stratification: A link between coronary & carotid ultrasound plaque burdens. Comput. Methods Programs Biomed. 2016, 124, 161–179. [Google Scholar] [CrossRef]
- Araki, T.; Ikeda, N.; Shukla, D.; Jain, P.K.; Londhe, N.D.; Shrivastava, V.K.; Banchhor, S.K.; Saba, L.; Nicolaides, A.; Shafique, S.; et al. PCA-based polling strategy in machine learning framework for coronary artery disease risk assessment in intravascular ultrasound: A link between carotid and coronary grayscale plaque morphology. Comput. Methods Programs Biomed. 2016, 128, 137–158. [Google Scholar] [CrossRef] [PubMed]
- Banchhor, S.K.; Londhe, N.D.; Araki, T.; Saba, L.; Radeva, P.; Laird, J.R.; Suri, J.S. Wall-based measurement features provides an improved IVUS coronary artery risk assessment when fused with plaque texture-based features during machine learning paradigm. Comput. Biol. Med. 2017, 91, 198–212. [Google Scholar] [CrossRef]
- Giannoglou, V.G.; Stavrakoudis, D.G.; Theocharis, J.B.; Petridis, V. Genetic fuzzy rule based classification systems for coronary plaque characterization based on intravascular ultrasound images. Eng. Appl. Artif. Intell. 2015, 38, 203–220. [Google Scholar] [CrossRef]
- Rezaei, Z.; Selamat, A.; Taki, A.; Mohd Rahim, M.S.; Abdul Kadir, M.R. Automatic plaque segmentation based on hybrid fuzzy clustering and k nearest neighborhood using virtual histology intravascular ultrasound images. Appl. Soft Comput. J. 2017, 53, 380–395. [Google Scholar] [CrossRef]
- Su, S.; Hu, Z.; Lin, Q.; Hau, W.K.; Gao, Z.; Zhang, H. An artificial neural network method for lumen and media-adventitia border detection in IVUS. Comput. Med. Imaging Graph. 2017, 57, 29–39. [Google Scholar] [CrossRef] [PubMed]
- Sudarshan, V.; Acharya, U.R.; Ng, E.Y.K.; Meng, C.S.; Tan, R.S.; Ghista, D.N. Automated Identification of Infarcted Myocardium Tissue Characterization Using Ultrasound Images: A Review. IEEE Rev. Biomed. Eng. 2015, 8, 86–97. [Google Scholar] [CrossRef]
- Forssen, H.; Patel, R.; Fitzpatrick, N.; Hingorani, A.; Timmis, A.; Hemingway, H.; Denaxas, S. Evaluation of Machine Learning Methods to Predict Coronary Artery Disease Using Metabolomic Data. In Stud Health Technol Inform; Randell, R., Cornet, R., Scott, P.J., Cornet, R., Peek, N., McCowan, C., Eds.; IOS Press: Amsterdam, The Netherlands, 2017; Volume 235, pp. 111–115. [Google Scholar]
- Nakajima, K.; Okuda, K.; Watanabe, S.; Matsuo, S.; Kinuya, S.; Toth, K.; Edenbrandt, L. Artificial neural network retrained to detect myocardial ischemia using a Japanese multicenter database. Ann. Nucl. Med. 2018, 32, 303–310. [Google Scholar] [CrossRef] [PubMed]
- Nakajima, K.; Matsuo, S.; Wakabayashi, H.; Yokoyama, K.; Bunko, H.; Okuda, K.; Kinuya, S.; Nystrom, K.; Edenbrandt, L. Diagnostic Performance of Artificial Neural Network for Detecting Ischemia in Myocardial Perfusion Imaging. Circ. J. 2015, 79, 1549–1556. [Google Scholar] [CrossRef] [PubMed]
- Nakajima, K.; Kudo, T.; Nakata, T.; Kiso, K.; Kasai, T.; Taniguchi, Y.; Matsuo, S.; Momose, M.; Nakagawa, M.; Sarai, M.; et al. Diagnostic accuracy of an artificial neural network compared with statistical quantitation of myocardial perfusion images: A Japanese multicenter study. Eur. J. Nucl. Med. Mol. Imaging 2017, 44, 2280–2289. [Google Scholar] [CrossRef]
- Cho, H.; Lee, J.G.; Kang, S.J.; Kim, W.J.; Choi, S.Y.; Ko, J.; Min, H.S.; Choi, G.H.; Kang, D.Y.; Lee, P.H.; et al. Angiography-based machine learning for predicting fractional flow reserve in intermediate coronary artery lesions. Am. Heart J. 2019, 8. [Google Scholar] [CrossRef]
- Patel, M.R.; Peterson, E.D.; Dai, D.; Brennan, J.M.; Redberg, R.F.; Anderson, H.V.; Brindis, R.G.; Douglas, P.S. Low diagnostic yield of elective coronary angiography. N. Engl. J. Med. 2010, 362, 886–895. [Google Scholar] [CrossRef]
- Kolossváry, M.; De Cecco, C.N.; Feuchtner, G.; Maurovich-Horvat, P. Advanced atherosclerosis imaging by CT: Radiomics, machine learning and deep learning. J. Cardiovasc. Comput. Tomogr. 2019, 13, 274–280. [Google Scholar] [CrossRef]
- Oikonomou, E.K.; West, H.W.; Antoniades, C. Cardiac Computed Tomography: Assessment of Coronary Inflammation and Other Plaque Features. Arterioscler. Thromb. Vasc. Biol. 2019, 39, 2207–2219. [Google Scholar] [CrossRef]
- Dey, D.; Gaur, S.; Ovrehus, K.A.; Slomka, P.J.; Betancur, J.; Goeller, M.; Hell, M.M.; Gransar, H.; Berman, D.S.; Achenbach, S.; et al. Integrated prediction of lesion-specific ischaemia from quantitative coronary CT angiography using machine learning: A multicentre study. Eur. Radiol. 2018, 28, 2655–2664. [Google Scholar] [CrossRef] [PubMed]
- Hu, X.; Yang, M.; Han, L.; Du, Y. Diagnostic performance of machine-learning-based computed fractional flow reserve (FFR) derived from coronary computed tomography angiography for the assessment of myocardial ischemia verified by invasive FFR. Int. J. Cardiovasc. Imaging 2018, 34, 1987–1996. [Google Scholar] [CrossRef] [PubMed]
- Tesche, C.; De Cecco, C.N.; Baumann, S.; Renker, M.; McLaurin, T.W.; Duguay, T.M.; Bayer, R.R.; Steinberg, D.H.; Grant, K.L.; Canstein, C.; et al. Coronary CT angiography–derived fractional flow reserve: Machine learning algorithm versus computational fluid dynamics modeling. Radiology 2018, 288, 64–72. [Google Scholar] [CrossRef] [PubMed]
- von Knebel Doeberitz, P.L.; De Cecco, C.N.; Schoepf, U.J.; Duguay, T.M.; Albrecht, M.H.; van Assen, M.; Bauer, M.J.; Savage, R.H.; Pannell, J.T.; De Santis, D.; et al. Coronary CT angiography-derived plaque quantification with artificial intelligence CT fractional flow reserve for the identification of lesion-specific ischemia. Eur. Radiol. 2018, 6. [Google Scholar] [CrossRef]
- Yu, M.; Lu, Z.; Li, W.; Wei, M.; Yan, J.; Zhang, J. CT morphological index provides incremental value to machine learning based CT-FFR for predicting hemodynamically significant coronary stenosis. Int. J. Cardiol. 2018, 265, 256–261. [Google Scholar] [CrossRef]
- Kurata, A.; Fukuyama, N.; Hirai, K.; Kawaguchi, N.; Tanabe, Y.; Okayama, H.; Shigemi, S.; Watanabe, K.; Uetani, T.; Ikeda, S.; et al. On-site computed tomography-derived fractional flow reserve using a machine-learning algorithm: Clinical effectiveness in a retrospective multicenter cohort. Circ. J. 2019, 83, 1563–1571. [Google Scholar] [CrossRef]
- Wardziak, Ł.; Kruk, M.; Pleban, W.; Demkow, M.; Rużyłło, W.; Dzielińska, Z.; Kępka, C. Coronary CTA enhanced with CTA based FFR analysis provides higher diagnostic value than invasive coronary angiography in patients with intermediate coronary stenosis. J. Cardiovasc. Comput. Tomogr. 2019, 13, 62–67. [Google Scholar] [CrossRef]
- Yu, M.; Lu, Z.; Shen, C.; Yan, J.; Wang, Y.; Lu, B.; Zhang, J. The best predictor of ischemic coronary stenosis: Subtended myocardial volume, machine learning–based FFR CT, or high-risk plaque features? Eur. Radiol. 2019. [Google Scholar] [CrossRef]
- Nicol, E.D.; Norgaard, B.L.; Blanke, P.; Ahmadi, A.; Weir-McCall, J.; Horvat, P.M.; Han, K.; Bax, J.J.; Leipsic, J. The Future of Cardiovascular Computed Tomography: Advanced Analytics and Clinical Insights. JACC Cardiovasc. Imaging 2019, 12, 1058–1072. [Google Scholar] [CrossRef]
- Zhuang, B.; Wang, S.; Zhao, S.; Lu, M. Computed tomography angiography-derived fractional flow reserve (CT-FFR) for the detection of myocardial ischemia with invasive fractional flow reserve as reference: Systematic review and meta-analysis. Eur. Radiol. 2019. [Google Scholar] [CrossRef]
- Bizopoulos, P.; Koutsouris, D. Deep Learning in Cardiology. IEEE Rev. Biomed. Eng. 2019, 12, 168–193. [Google Scholar] [CrossRef] [PubMed]
- Pijls, N.H.; Van Gelder, B.; Van der Voort, P.; Peels, K.; Bracke, F.A.; Bonnier, H.J.; el Gamal, M.I. Fractional flow reserve. A useful index to evaluate the influence of an epicardial coronary stenosis on myocardial blood flow. Circulation 1995, 92, 3183–3193. [Google Scholar] [CrossRef]
- Han, D.; Lee, J.H.; Rizvi, A.; Gransar, H.; Baskaran, L.; Schulman-Marcus, J.; ó Hartaigh, B.; Lin, F.Y.; Min, J.K. Incremental role of resting myocardial computed tomography perfusion for predicting physiologically significant coronary artery disease: A machine learning approach. J. Nucl. Cardiol. 2018, 25, 223–233. [Google Scholar] [CrossRef] [PubMed]
- Itu, L.; Rapaka, S.; Passerini, T.; Georgescu, B.; Schwemmer, C.; Schoebinger, M.; Flohr, T.; Sharma, P.; Comaniciu, D. A machine-learning approach for computation of fractional flow reserve from coronary computed tomography. J. Appl. Physiol. 2016, 121, 42–52. [Google Scholar] [CrossRef]
- Coenen, A.; Kim, Y.H.; Kruk, M.; Tesche, C.; De Geer, J.; Kurata, A.; Lubbers, M.L.; Daemen, J.; Itu, L.; Rapaka, S.; et al. Diagnostic accuracy of a machine-learning approach to coronary computed tomographic angiography–Based fractional flow reserve result from the MACHINE Consortium. Circ. Cardiovasc. Imaging 2018, 11. [Google Scholar] [CrossRef]
- Hae, H.; Kang, S.J.; Kim, W.J.; Choi, S.Y.; Lee, J.G.; Bae, Y.; Cho, H.; Yang, D.H.; Kang, J.W.; Lim, T.H.; et al. Machine learning assessment of myocardial ischemia using angiography: Development and retrospective validation. PLoS Med. 2018, 15, e1002693. [Google Scholar] [CrossRef]
- Park, A.; Chute, C.; Rajpurkar, P.; Lou, J.; Ball, R.L.; Shpanskaya, K.; Jabarkheel, R.; Kim, L.H.; McKenna, E.; Tseng, J.; et al. Deep Learning-Assisted Diagnosis of Cerebral Aneurysms Using the HeadXNet Model. JAMA Netw. Open 2019, 2, e195600. [Google Scholar] [CrossRef]
- van Rosendael, A.R.; Maliakal, G.; Kolli, K.K.; Beecy, A.; Al’Aref, S.J.; Dwivedi, A.; Singh, G.; Panday, M.; Kumar, A.; Ma, X.; et al. Maximization of the usage of coronary CTA derived plaque information using a machine learning based algorithm to improve risk stratification; insights from the CONFIRM registry. J. Cardiovasc. Comput. Tomogr. 2018, 12, 204–209. [Google Scholar] [CrossRef] [PubMed]
- Wang, W.; Wang, H.; Chen, Q.; Zhou, Z.; Wang, R.; Wang, H.; Zhang, N.; Chen, Y.; Sun, Z.; Xu, L. Coronary artery calcium score quantification using a deep-learning algorithm. Clin. Radiol. 2020, 75, 237.e11–237.e16. [Google Scholar] [CrossRef] [PubMed]
- von Knebel Doeberitz, P.L.; De Cecco, C.N.; Schoepf, U.J.; Albrecht, M.H.; van Assen, M.; De Santis, D.; Gaskins, J.; Martin, S.; Bauer, M.J.; Ebersberger, U.; et al. Impact of Coronary Computerized Tomography Angiography-Derived Plaque Quantification and Machine-Learning Computerized Tomography Fractional Flow Reserve on Adverse Cardiac Outcome. Am. J. Cardiol. 2019, 124, 1340–1348. [Google Scholar] [CrossRef]
- Priyatharshini, R.; Chitrakala, S. An efficient coronary disease diagnosis system using dual-phase multi-objective optimization and embedded feature selection. Int. J. Intell. Inf. Technol. 2017, 13, 15–36. [Google Scholar] [CrossRef][Green Version]
- Han, D.; Kolli, K.K.; Al’Aref, S.J.; Baskaran, L.; van Rosendael, A.R.; Gransar, H.; Andreini, D.; Budoff, M.J.; Cademartiri, F.; Chinnaiyan, K.; et al. Machine Learning Framework to Identify Individuals at Risk of Rapid Progression of Coronary Atherosclerosis: From the PARADIGM Registry. Am. Heart J. 2020, 9, e013958. [Google Scholar] [CrossRef]
- Tesche, C.; Plank, F.; De Cecco, C.N.; Duguay, T.M.; Albrecht, M.H.; Varga-Szemes, A.; Bayer, R.R., 2nd; Yang, J.; Jacks, I.L.; Gramer, B.M.; et al. Prognostic implications of coronary CT angiography-derived quantitative markers for the prediction of major adverse cardiac events. J. Cardiovasc. Comput. Tomogr. 2016, 10, 458–465. [Google Scholar] [CrossRef]
- Zhang, W.; Zhang, J.; Du, X.; Zhang, Y.; Li, S. An end-to-end joint learning framework of artery-specific coronary calcium scoring in non-contrast cardiac CT. Computing 2019, 101, 667–678. [Google Scholar] [CrossRef]
- Wolterink, J.M.; Leiner, T.; Viergever, M.A.; Išgum, I. Automatic coronary calcium scoring in cardiac CT angiography using convolutional neural networks. In Lecture Notes in Computer Science (including subseries Lecture Notes in Artificial Intelligence and Lecture Notes in Bioinformatics); Springer: Cham, Switzerland, 2015; Volume 9349, pp. 589–596. [Google Scholar]
- Wolterink, J.M.; Leiner, T.; Takx, R.A.P.; Viergever, M.A.; Išgum, I. Automatic Coronary Calcium Scoring in Non-Contrast-Enhanced ECG-Triggered Cardiac CT with Ambiguity Detection. IEEE Trans. Med. Imaging 2015, 34, 1867–1878. [Google Scholar] [CrossRef]
- Wolterink, J.M.; Leiner, T.; De Vos, B.D.; Coatrieux, J.L.; Kelm, B.M.; Kondo, S.; Salgado, R.A.; Shahzad, R.; Shu, H.; Snoeren, M.; et al. An evaluation of automatic coronary artery calcium scoring methods with cardiac CT using the orCaScore framework. Med. Phys. 2016, 43, 2361–2373. [Google Scholar] [CrossRef] [PubMed]
- Shahzad, R.; van Walsum, T.; Schaap, M.; Rossi, A.; Klein, S.; Weustink, A.C.; de Feyter, P.J.; van Vliet, L.J.; Niessen, W.J. Vessel specific coronary artery calcium scoring: An automatic system. Acad. Radiol. 2013, 20, 1–9. [Google Scholar] [CrossRef]
- Motwani, M.; Dey, D.; Berman, D.S.; Germano, G.; Achenbach, S.; Al-Mallah, M.H.; Andreini, D.; Budoff, M.J.; Cademartiri, F.; Callister, T.Q.; et al. Machine learning for prediction of all-cause mortality in patients with suspected coronary artery disease: A 5-year multicentre prospective registry analysis. Eur. Heart J. 2017, 38, 500–507. [Google Scholar] [CrossRef]
- Han, D.; Kolli, K.K.; Gransar, H.; Lee, J.H.; Choi, S.Y.; Chun, E.J.; Han, H.W.; Park, S.H.; Sung, J.; Jung, H.O.; et al. Machine learning based risk prediction model for asymptomatic individuals who underwent coronary artery calcium score: Comparison with traditional risk prediction approaches. J. Cardiovasc. Comput. Tomogr. 2019. [Google Scholar] [CrossRef] [PubMed]
- Zreik, M.; Lessmann, N.; van Hamersvelt, R.W.; Wolterink, J.M.; Voskuil, M.; Viergever, M.A.; Leiner, T.; Išgum, I. Deep learning analysis of the myocardium in coronary CT angiography for identification of patients with functionally significant coronary artery stenosis. Med. Image Anal. 2018, 44, 72–85. [Google Scholar] [CrossRef] [PubMed]
- van Hamersvelt, R.W.; Zreik, M.; Voskuil, M.; Viergever, M.A.; Išgum, I.; Leiner, T. Deep learning analysis of left ventricular myocardium in CT angiographic intermediate-degree coronary stenosis improves the diagnostic accuracy for identification of functionally significant stenosis. Eur. Radiol. 2019, 29, 2350–2359. [Google Scholar] [CrossRef]
- De Geer, J.; Coenen, A.; Kim, Y.H.; Kruk, M.; Tesche, C.; Schoepf, U.J.; Kepka, C.; Yang, D.H.; Nieman, K.; Persson, A. Effect of tube voltage on diagnostic performance of fractional flow reserve derived from coronary CT angiography with machine learning: Results from the machine registry. Am. J. Roentgenol. 2019, 213, 325–331. [Google Scholar] [CrossRef] [PubMed]
- Freiman, M.; Nickisch, H.; Prevrhal, S.; Schmitt, H.; Vembar, M.; Maurovich-Horvat, P.; Donnelly, P.; Goshen, L. Improving CCTA-based lesions’ hemodynamic significance assessment by accounting for partial volume modeling in automatic coronary lumen segmentation. Med. Phys. 2017, 44, 1040–1049. [Google Scholar] [CrossRef]
- Acharya, U.R.; Sree, S.V.; Mookiah, M.R.; Saba, L.; Gao, H.; Mallarini, G.; Suri, J.S. Computed tomography carotid wall plaque characterization using a combination of discrete wavelet transform and texture features: A pilot study. Proc. Inst. Mech. Eng. H 2013, 227, 643–654. [Google Scholar] [CrossRef]
- Mao, F.; Gill, J.; Downey, D.; Fenster, A. Segmentation of carotid artery in ultrasound images. In Proceedings of the Proceedings of the 22nd Annual International Conference of the IEEE Engineering in Medicine and Biology Society (Cat. No.00CH37143), Chicago, IL, USA, 23–28 July 2000; pp. 1734–1737. [Google Scholar]
- Sabetai, M.M.; Tegos, T.J.; Nicolaides, A.N.; Dhanjil, S.; Pare, G.J.; Stevens, J.M. Reproducibility of computer-quantified carotid plaque echogenicity: Can we overcome the subjectivity? Stroke 2000, 31, 2189–2196. [Google Scholar] [CrossRef]
- WA Health. Diagnostic Imaging Pathways—Stroke. Available online: http://www.imagingpathways.health.wa.gov.au/index.php/imaging-pathways/neurological/stroke#pathway (accessed on 26 April 2019).
- WA Health. Diagnostic Imaging Pathways—Transient Ischemic Attack. Available online: http://www.imagingpathways.health.wa.gov.au/index.php/imaging-pathways/neurological?id=63#pathway (accessed on 26 April 2019).
- National Institute for Health and Care Excellence. Stroke Overview; National Institute for Health and Care Excellence: London, UK, 2020. [Google Scholar]
- Touboul, P.J.; Hennerici, M.G.; Meairs, S.; Adams, H.; Amarenco, P.; Bornstein, N.; Csiba, L.; Desvarieux, M.; Ebrahim, S.; Hernandez Hernandez, R.; et al. Mannheim carotid intima-media thickness and plaque consensus (2004–2006–2011). An update on behalf of the advisory board of the 3rd, 4th and 5th watching the risk symposia, at the 13th, 15th and 20th European Stroke Conferences, Mannheim, Germany, 2004, Brussels, Belgium, 2006, and Hamburg, Germany, 2011. Cerebrovasc. Dis. 2012, 34, 290–296. [Google Scholar] [CrossRef]
- Golemati, S.; Stoitsis, J.; Sifakis, E.G.; Balkizas, T.; Nikita, K.S. Using the Hough transform to segment ultrasound images of longitudinal and transverse sections of the carotid artery. Ultrasound Med. Biol. 2007, 33, 1918–1932. [Google Scholar] [CrossRef] [PubMed]
- Bastida-Jumilla, M.C.; Menchón-Lara, R.M.; Morales-Sánchez, J.; Verdú-Monedero, R.; Larrey-Ruiz, J.; Sancho-Gómez, J.L. Frequency-domain active contours solution to evaluate intima–media thickness of the common carotid artery. Biomed. Signal. Process. Contr 2015, 16, 68–79. [Google Scholar] [CrossRef]
- Huang, X.; Zhang, Y.; Meng, L.; Qian, M.; Wong, K.K.L.; Abbott, D.; Zheng, R.; Zheng, H.; Niu, L.; Huang, X.; et al. Identification of Ultrasonic Echolucent Carotid Plaques Using Discrete Frechet Distance Between Bimodal Gamma Distributions. IEEE Trans. Biomed. Eng. 2018, 65, 949–955. [Google Scholar] [CrossRef] [PubMed]
- Grønholdt, M.L.M.; Wiebe, B.M.; Laursen, H.; Nielsen, T.G.; Schroeder, T.V.; Sillesen, H. Lipid-rich carotid artery plaques appear echolucent on ultrasound B-mode images and may be associated with intraplaque haemorrhage. Eur. J. Vasc. Endovasc. Surg. 1997, 14, 439–445. [Google Scholar] [CrossRef]
- Mathiesen, E.B.; Bonaa, K.H.; Joakimsen, O. Echolucent plaques are associated with high risk of ischemic cerebrovascular events in carotid stenosis: The tromso study. Circulation 2001, 103, 2171–2175. [Google Scholar] [CrossRef]
- Pedro, L.M.; Sanches, J.M.; Seabra, J.; Suri, J.S.; Fernandes, E.; Fernandes, J. Asymptomatic carotid disease—A new tool for assessing neurological risk. Echocardiography 2014, 31, 353–361. [Google Scholar] [CrossRef]
- Roy-Cardinal, M.H.; Destrempes, F.; Soulez, G.; Cloutier, G. Assessment of carotid artery plaque components with machine learning classification using homodyned-K parametric maps and elastograms. IEEE Trans. Ultrason Ferroelectr. Freq. Control. 2018, 29, 29. [Google Scholar] [CrossRef] [PubMed]
- Golemati, S.; Patelaki, E.; Gastounioti, A.; Andreadis, I.; Liapis, C.D.; Nikita, K.S. Motion synchronisation patterns of the carotid atheromatous plaque from B-mode ultrasound. Sci. Rep. 2020, 10, 11221. [Google Scholar] [CrossRef]
- Waddle, S.L.; Juttukonda, M.R.; Lants, S.K.; Davis, L.T.; Chitale, R.; Fusco, M.R.; Jordan, L.C.; Donahue, M.J. Classifying intracranial stenosis disease severity from functional MRI data using machine learning. J. Cereb. Blood Flow Metab. 2020, 40, 705–719. [Google Scholar] [CrossRef] [PubMed]
- Wu, J.; Xin, J.; Yang, X.; Sun, J.; Xu, D.; Zheng, N.; Yuan, C. Deep morphology aided diagnosis network for segmentation of carotid artery vessel wall and diagnosis of carotid atherosclerosis on black-blood vessel wall MRI. Med. Phys. 2019, 46, 5544–5561. [Google Scholar] [CrossRef]
- Zhao, X.; Li, R.; Hippe, D.S.; Hatsukami, T.S.; Yuan, C. Chinese Atherosclerosis Risk Evaluation (CARE II) study: A novel cross-sectional, multicentre study of the prevalence of high-risk atherosclerotic carotid plaque in Chinese patients with ischaemic cerebrovascular events-design and rationale. Stroke Vasc. Neurol. 2017, 2, 15–20. [Google Scholar] [CrossRef] [PubMed]
- Brown, B.G.; Boden, W.E.; Probstfield, J.R.; McBride, R.; Anderson, T.; Chaitman, B.; Marcovina, S.; Weintraub, W.; Zhao, X.Q.; Teo, K.; et al. The role of niacin in raising high-density lipoprotein cholesterol to reduce cardiovascular events in patients with atherosclerotic cardiovascular disease and optimally treated low-density lipoprotein cholesterol Rationale and study design. The Atherothrombosis Intervention in Metabolic syndrome with low HDL/high triglycerides: Impact on Global Health outcomes (AIM-HIGH). Am. Heart J. 2011, 161, 471–477. [Google Scholar] [CrossRef]
- Cai, J.M.; Hatsukami, T.S.; Ferguson, M.S.; Small, R.; Polissar, N.L.; Yuan, C. Classification of human carotid atherosclerotic lesions with in vivo multicontrast magnetic resonance imaging. Circulation 2002, 106, 1368–1373. [Google Scholar] [CrossRef]
- Van Den Bouwhuijsen, Q.J.A.; Vernooij, M.W.; Verhaaren, B.F.J.; Vrooman, H.A.; Niessen, W.J.; Krestin, G.P.; Ikram, M.A.; Franco, O.H.; Van Der Lugt, A. Carotid plaque morphology and ischemic vascular brain disease on MRI. Am. J. Neuroradiol. 2017, 38, 1776–1782. [Google Scholar] [CrossRef] [PubMed]
- Vermeer, S.E.; Hollander, M.; van Dijk, E.J.; Hofman, A.; Koudstaal, P.J.; Breteler, M.M.; Rotterdam Scan, S. Silent brain infarcts and white matter lesions increase stroke risk in the general population: The Rotterdam Scan Study. Stroke 2003, 34, 1126–1129. [Google Scholar] [CrossRef]
- Ziegler, M.; Good, E.; Engvall, J.; Warntjes, M.; de Muinck, E.; Dyverfeldt, P. Towards Automated Quantification of Vessel Wall Composition Using MRI. J. Magn. Reson. Imaging 2020, 52, 710–719. [Google Scholar] [CrossRef]
- van Hespen, K.M.; Zwanenburg, J.J.M.; Hendrikse, J.; Kuijf, H.J. Subvoxel vessel wall thickness measurements of the intracranial arteries using a convolutional neural network. Med. Image Anal. 2021, 67, 101818. [Google Scholar] [CrossRef]
- Hadamitzky, M.; Achenbach, S.; Al-Mallah, M.; Berman, D.; Budoff, M.; Cademartiri, F.; Callister, T.; Chang, H.J.; Cheng, V.; Chinnaiyan, K.; et al. Optimized prognostic score for coronary computed tomographic angiography: Results from the CONFIRM registry (COronary CT Angiography EvaluatioN For Clinical Outcomes: An InteRnational Multicenter Registry). J. Am. Coll. Cardiol. 2013, 62, 468–476. [Google Scholar] [CrossRef]
- Lee, S.E.; Chang, H.J.; Rizvi, A.; Hadamitzky, M.; Kim, Y.J.; Conte, E.; Andreini, D.; Pontone, G.; Volpato, V.; Budoff, M.J.; et al. Rationale and design of the Progression of AtheRosclerotic PlAque DetermIned by Computed TomoGraphic Angiography IMaging (PARADIGM) registry: A comprehensive exploration of plaque progression and its impact on clinical outcomes from a multicenter serial coronary computed tomographic angiography study. Am. Heart J. 2016, 182, 72–79. [Google Scholar] [CrossRef]
- Nous, F.M.A.; Coenen, A.; Boersma, E.; Kim, Y.H.; Kruk, M.B.P.; Tesche, C.; de Geer, J.; Yang, D.H.; Kepka, C.; Schoepf, U.J.; et al. Comparison of the Diagnostic Performance of Coronary Computed Tomography Angiography-Derived Fractional Flow Reserve in Patients With Versus Without Diabetes Mellitus (from the MACHINE Consortium). Am. J. Cardiol. 2019, 123, 537–543. [Google Scholar] [CrossRef]
- Sofian, H.; Ming, J.T.C.; Muhammad, S.; Noor, N.M. Calcification detection using convolutional neural network architectures in intravascular ultrasound images. Indones J. Electr. Eng. Comput. Sci. 2019, 17, 1313–1321. [Google Scholar] [CrossRef]
- The Royal Australian and New Zealand College of Radiologists. Ethical Principles for Artificial Intelligence in Medicine; RANZCR: Sydney, Australia, 2019; p. 10. [Google Scholar]
- Gao, Z.; Wang, X.; Sun, S.; Wu, D.; Bai, J.; Yin, Y.; Liu, X.; Zhang, H.; de Albuquerque, V.H.C. Learning physical properties in complex visual scenes: An intelligent machine for perceiving blood flow dynamics from static CT angiography imaging. Neural Netw. 2019, 123, 82–93. [Google Scholar] [CrossRef] [PubMed]
- Cerqueira, M.D.; Weissman, N.J.; Dilsizian, V.; Jacobs, A.K.; Kaul, S.; Laskey, W.K.; Pennell, D.J.; Rumberger, J.A.; Ryan, T.; Verani, M.S.; et al. Standardized myocardial segmentation and nomenclature for tomographic imaging of the heart. A statement for healthcare professionals from the Cardiac Imaging Committee of the Council on Clinical Cardiology of the American Heart Association. Circulation 2002, 105, 539–542. [Google Scholar] [CrossRef] [PubMed]
- Wolterink, J.M.; Hamersvelt, R.W.V.; Viergever, M.A.; Leiner, T.; Išgum, I. Coronary artery centerline extraction in cardiac CT angiography using a CNN-based orientation classifier. Med. Image Anal. 2019, 51, 46–60. [Google Scholar] [CrossRef] [PubMed]
- Ferguson, G.G.; Eliasziw, M.; Barr, H.W.; Clagett, G.P.; Barnes, R.W.; Wallace, M.C.; Taylor, D.W.; Haynes, R.B.; Finan, J.W.; Hachinski, V.C.; et al. The North American Symptomatic Carotid Endarterectomy Trial: Surgical results in 1415 patients. Stroke 1999, 30, 1751–1758. [Google Scholar] [CrossRef] [PubMed]
- NASCET Collaborators; Barnett, H.J.M.; Taylor, D.W.; Haynes, R.B.; Sackett, D.L.; Peerless, S.J.; Ferguson, G.G.; Fox, A.J.; Rankin, R.N.; Hachinski, V.C. Beneficial effect of carotid endarterectomy in symptomatic patients with high-grade carotid stenosis. N. Engl. J. Med. 1991, 325, 445–453. [Google Scholar] [CrossRef]
- Kirisli, H.A.; Schaap, M.; Metz, C.T.; Dharampal, A.S.; Meijboom, W.B.; Papadopoulou, S.L.; Dedic, A.; Nieman, K.; de Graaf, M.A.; Meijs, M.F.; et al. Standardized evaluation framework for evaluating coronary artery stenosis detection, stenosis quantification and lumen segmentation algorithms in computed tomography angiography. Med. Image Anal. 2013, 17, 859–876. [Google Scholar] [CrossRef]
- Schaap, M.; Metz, C.T.; van Walsum, T.; van der Giessen, A.G.; Weustink, A.C.; Mollet, N.R.; Bauer, C.; Bogunovic, H.; Castro, C.; Deng, X.; et al. Standardized evaluation methodology and reference database for evaluating coronary artery centerline extraction algorithms. Med. Image Anal. 2009, 13, 701–714. [Google Scholar] [CrossRef]
- Carson, J.M.; Pant, S.; Roobottom, C.; Alcock, R.; Javier Blanco, P.; Alberto Bulant, C.; Vassilevski, Y.; Simakov, S.; Gamilov, T.; Pryamonosov, R.; et al. Non-invasive coronary CT angiography-derived fractional flow reserve: A benchmark study comparing the diagnostic performance of four different computational methodologies. Int. J. Numer. Methods Biomed. Eng. 2019, 35. [Google Scholar] [CrossRef]
- Zreik, M.; Van Hamersvelt, R.W.; Wolterink, J.M.; Leiner, T.; Viergever, M.A.; Išgum, I. A Recurrent CNN for Automatic Detection and Classification of Coronary Artery Plaque and Stenosis in Coronary CT Angiography. IEEE Trans. Med. Imaging 2019, 38, 1588–1598. [Google Scholar] [CrossRef]
- Oakden-Rayner, L.; Dunnmon, J.; Carneiro, G.; Re, C. Hidden Stratification Causes Clinically Meaningful Failures in Machine Learning for Medical Imaging. Proc. ACM Conf. Health Inference Learn. 2020, 2020, 151–159. [Google Scholar] [CrossRef]
- Marcu, L.G.; Marcu, D. Points of view on artificial intelligence in medical imaging—One good, one bad, one fuzzy. Health Technol. 2021, 11, 17–22. [Google Scholar] [CrossRef]


| Organ | ML Prediction Endpoint | Author (Year) | No. of Patients (M/F) | ML Approach or Software | ML Validation | Gold Standard | Contrast Used? |
|---|---|---|---|---|---|---|---|
| Brain | Faster clinician identificiation of intracranial aneurysm | Park (2019) | 662 (157/505) | 3-D CNN. | 75/14/11 train/validation/test | Clinicians’ segmentation (n = 8) | Yes |
| Heart | 5 year ACM | Motwani (2017) | 10,030 (5628/4402) | LogitBoost | k-fold cross validation (n = 10) | Existing clinical or cCTA metrics | Yes |
| ACM | Han (2019) | 86,155 (59,745/26,410) | LogitBoost | 70/30 holdout validation | Mortality status at follow up (median 4.6 years) | No | |
| CAD—Calcium scoring | Shahzad (2013) | 366 (280/86) | k-Nearest Neighbour | 57/43 holdout validation | Expert Calcium Scoring | No | |
| Coronary vessel centreline extraction | Wolterink (2019) | 82 | 3-D CNN. + SVM | MICCAI 2008 CAT08 dataset—32 pre segmented cCTA images | Clinicians’ segmentation (n = 3) | Yes | |
| FFR variation with kVp | De Geer (2019) | 351 | SyngoTM cFFR | 12,000 virtual coronary models | Invasive coronary angiography FFR | Yes | |
| Functional stenosis significance | Coenen (2018) | 351 (258/93) | SyngoTM cFFR | 12,000 virtual coronary models | Invasive coronary angiography FFR | Yes | |
| Hae (2018) | 1132 (860/272) | Light Gradient Boosting Machine | 83/17 Holdout validation k-fold cross validation (n = 3) | 79 external patients CAAS-5 software | Yes | ||
| Han (2018) | 252 (178/74) | SmartHeart Software | Leave one out cross validation | Invasive coronary angiography FFR | Yes | ||
| Kurata (2019) | 74 (56/18) | SyngoTM cFFR | 12,000 virtual coronary models | Invasive coronary angiography FFR | Yes | ||
| van Hamersvelt (2019) | 126 (97/29) | As described in Zreik (2018) | k-fold cross validation (n = 50) | Invasive coronary angiography FFR | Yes | ||
| Zreik (2018) | 166 (128/38) | 3-D CNN + SVM | Manual segmentation of 40 patients | Invasive coronary angiography FFR | Yes | ||
| Dey (2018) | 254 (162/92) | Ensemble classification approach (Supervised ensemble learning) | k-fold cross validation (n = 10) | Invasive coronary angiography FFR | Yes | ||
| von Knebel Doeberitz (2018) | 84 (54/30) | SyngoTM cFFR | 12,000 virtual coronary models | Invasive coronary angiography FFR | Yes | ||
| Wardziak (2019) | 90 (61/29) | SyngoTM cFFR | 12,000 virtual coronary models | Invasive coronary angiography FFR | Yes | ||
| Yu (2018) | 129 | SyngoTM cFFR | 12,000 virtual coronary models | Invasive coronary angiography FFR | Yes | ||
| Yu (2019) | 180 | SyngoTM cFFR | 12,000 virtual coronary models | Invasive coronary angiography FFR | Yes | ||
| Hu (2018) | 105 (73/32) | SyngoTM cFFR | 12,000 virtual coronary models | Invasive coronary angiography FFR | Yes | ||
| Nous (2019) | 351 (258/93) | SyngoTM cFFR | 12,000 virtual coronary models | Invasive coronary angiography FFR | Yes | ||
| Zreik (2019) | 163 (126/37) | Recurrent CNN | 50/10/40 train/validation/test | Clinicians’ segmentation (n = 2) | Yes | ||
| Functional stenosis significance (myocardial bridging) | Zhou (2019) | 161 (103/58) | SyngoTM cFFR | 12,000 virtual coronary models | 41 control patients Clinicians segmentations (n = 2) | Yes | |
| MACE related lesions | Tesche (2016) | 92 (57/35) | SyngoTM Coronary Plaque Analysis 2.0.3 | Invasive coronary angiography FFR | Yes | ||
| von Knebel Doeberitz (2019) | 82 (51/30) | SyngoTM cFFR | 12,000 virtual coronary models | Invasive coronary angiography FFR | Yes | ||
| Machine learning ischemia risk score | Kwan (2020) | 352 (238/114) | Ensemble classification approach (Supervised ensemble learning) | k-fold cross validation (n = 10) | Invasive coronary angiography FFR | Yes | |
| Plaque based risk stratification | Priyatharshini (2017) | 76 | Active contour model-based region growing | Agatston score | Yes | ||
| Plaque based risk stratification | Zhang (2019) | 129 | Dense U-net | k-fold cross validation (n = 5) 40 “orScore” database patients | 2 expert Agatston score | No | |
| Plaque based risk stratification | van Rosendael (2018) | 8844 (5102/3742) | Gradient boosted decision trees | 80/20 holdout validation k-fold cross validation (n = 5) | Clinician segmentation + cCTA risk score | Yes | |
| Plaque based risk stratification | Wang (2019) | 530 | 3D-Resnet deep neural network | 56/17/27 train/validation/test | Agatston Score | No | |
| Plaque stability | Al’Aref (2020) | 468 | XGBoost | 80/20 holdout validation k-fold cross validation (n = 10) | Invasive coronary angiography | Yes | |
| Rapidly progressing plaque | Han (2020) | 1083 (624/459) | LogitBoost, Naïve Bayes, BayesNet, AdaBoost, Random Forest, Bagging, Stacking, MLP, Sequential Minimimal Optimization, ADTree | 70/30 holdout validation | Atherosclerotic cardiovascular disease risk score/duke coronary artery disease score | Yes |
| Organ | ML PredictionEndpoint | Statistics Quoted | Author (Year) | Sample Size | Sensitivity | Specificity | Accuracy | AUC | ||||
|---|---|---|---|---|---|---|---|---|---|---|---|---|
| Min | Max | Min | Max | Min | Max | Min | Max | |||||
| Brain | Faster aneurysm identification | Per clinician | Park (2019) | 818 exams | 0.89 | 0.98 | 0.93 | |||||
| Heart | 5-year ACM | Per patient | Motwani (2017) | 10,030 patients | 0.79 | 0.79 | ||||||
| ACM (CAD) | Per patient | Han (2019) | 86,155 patients | 0.74 | 0.78 | |||||||
| CAD—Calcium scoring | Per patient | Shahzad (2013) | 366 patients | 0.84 | ||||||||
| Coronary vessel centreline extraction | Wolterink (2019) | 82 patients | ||||||||||
| FFR variation with kVp | Per vessel | De Geer (2019) | 525 vessels | 0.74 | 1.00 | 0.73 | 0.79 | 0.77 | 0.86 | 0.82 | 0.90 | |
| Functional stenosis significance | Per patient | Coenen (2018) | 525 lesions | 0.82 | 0.96 | 0.60 | 0.83 | 0.75 | 0.91 | |||
| Hae (2018) | 1132 lesions | 0.73 | 0.84 | 0.76 | 0.85 | 0.74 | 0.84 | 0.80 | 0.91 | |||
| Han (2018) | 252 patients | 0.52 | 0.71 | 0.61 | 0.85 | 0.64 | 0.68 | |||||
| Kurata (2019) | 91 lesions | 0.33 | 0.90 | 0.38 | 0.91 | 0.59 | 0.85 | |||||
| van Hamersvelt (2019) | 126 patients | 0.85 | 0.48 | 0.72 | 0.76 | |||||||
| Zreik (2018) | 166 patients | 0.70 | 0.71 | 0.71 | 0.62 | 0.85 | ||||||
| Per lesion | Dey (2018) | 2758 artery segments | 0.84 | |||||||||
| von Knebel Doeberitz (2018) | 103 lesions | 0.62 | 0.88 | 0.33 | 0.68 | 0.61 | 0.93 | |||||
| Wardziak (2019) | 96 lesions | 0.76 | 0.72 | 0.74 | 0.84 | |||||||
| Yu (2018) | 166 lesions | 0.85 | 0.88 | |||||||||
| Yu (2019) | 208 lesions | 0.81 | 0.94 | 0.82 | 0.87 | 0.83 | 0.86 | 0.87 | 0.94 | |||
| Per vessel | Hu (2018) | 117 lesions | 0.61 | 0.91 | 0.82 | 0.86 | 0.92 | |||||
| Nous (2019) | 525 arteries | 0.79 | 0.88 | 0.72 | 0.80 | 0.75 | 0.83 | 0.82 | 0.88 | |||
| Per segment | Zreik (2019) | 676 lesions | 0.62 | 0.80 | ||||||||
| Functional stenosis significance (myocardial bridging) | Per lesion | Zhou (2019) | 161 patients | 0.65 | 0.77 | |||||||
| MACE | Per patient | Tesche (2016) | 258 lesions | 0.63 | 0.83 | 0.73 | 0.83 | 0.72 | 0.82 | |||
| Per lesion | von Knebel Doeberitz (2019) | 82 patients | 0.82 | 0.79 | 0.94 | |||||||
| Machine learning ischemia risk score | Per vessel | Kwan (2020) | 352 patients | 0.78 | ||||||||
| Plaque based risk stratification | Per patient | Priyatharshini (2017) | 76 patients | 0.91 | ||||||||
| Per lesion | Zhang (2019) | 129 patients | 0.86 | 0.91 | ||||||||
| Per vessel | van Rosendael (2018) | 8844 patients | 0.77 | |||||||||
| Wang (2019) | 530 patients | |||||||||||
| Plaque stability | Per lesion | Al’Aref (2020) | 582 lesions | 0.77 | ||||||||
| Rapidly progressing plaque | Per patient | Han (2020) | 1083 patients | 0.79 | 0.83 | |||||||
| Organ | ML Prediction Endpoint | Statistics Quoted | Author (Year) | Sample Size | Sensitivity | Specificity | Accuracy | AUC | ||||
|---|---|---|---|---|---|---|---|---|---|---|---|---|
| Min | Max | Min | Max | Min | Max | Min | Max | |||||
| Heart | FFR variation with kVp | Per vessel | De Geer (2019) | 525 vessels | 0.74 | 1.00 | 0.73 | 0.79 | 0.77 | 0.86 | 0.82 | 0.90 |
| Functional stenosis significance | Per patient | Coenen (2018) | 525 lesions | 0.82 | 0.96 | 0.60 | 0.83 | 0.75 | 0.91 | |||
| Kurata (2019) | 91 lesions | 0.33 | 0.90 | 0.38 | 0.91 | 0.59 | 0.85 | |||||
| von Knebel Doeberitz (2018) | 103 lesions | 0.62 | 0.88 | 0.33 | 0.68 | 0.61 | 0.93 | |||||
| Wardziak (2019) | 96 lesions | 0.76 | 0.72 | 0.74 | 0.84 | |||||||
| Yu (2018) | 166 lesions | 0.85 | 0.88 | |||||||||
| Yu (2019) | 208 lesions | 0.81 | 0.94 | 0.82 | 0.87 | 0.83 | 0.86 | 0.87 | 0.94 | |||
| Per vessel | Hu (2018) | 117 lesions | 0.61 | 0.91 | 0.82 | 0.86 | 0.92 | |||||
| Nous (2019) | 525 arteries | 0.79 | 0.88 | 0.72 | 0.80 | 0.75 | 0.83 | 0.82 | 0.88 | |||
| Functional stenosis significance (myocardial bridging) | Per lesion | Zhou (2019) | 161 patients | 0.65 | 0.77 | |||||||
| MACE related lesions | Per lesion | von Knebel Doeberitz (2019) | 82 patients | 0.82 | 0.79 | 0.94 | ||||||
| Organ | ML Prediction Endpoint | Author (Year) | No. of Patients (M/F) | US Type | ML Approach | ML Validation | Gold Standard |
|---|---|---|---|---|---|---|---|
| Brain | Carotid elastography | Roy-Cardinal (2019) | 66 (47/19) | B-Mode | Random forest | 0.632+ validation | Patient symptoms |
| Carotid plaque echomorphology | Golemati (2020) | 77 (59/18) | B-Mode | Random forest | Leave one out | Clinicians’ segmentations (n = 1) | |
| Huang (2018) | 153 | B-Mode | k-nearest neighbours | k-fold cross validation (n = 3) | Grayscale median | ||
| Pedro (2014) | 109 (34/75) | B-Mode | Cutoff of ROC | Leave one out | Clinician assignment of symptomatic plaque status | ||
| Carotid plaque segmentation | Menchon-Lara (2016) | 67 | B-Mode | Neural Network | 66/33 Holdout validation | Clinicians’ segmentations (repeated) (n = 2) | |
| IMT measurement & plaque detection | Hassan (2013) | 300 | B-Mode | Fuzzy C-mean & probabilistic neural network | Clinicians’ segmentations (n = 1) | ||
| Heart | Probability of OCT identified thin-cap fibroatheroma | Bae (2019) | 517 (382/135) | IVUS | ANN, SVM, naïve bayes | k-fold cross (n = 5) 80/20 Holdout | Presence of OCT thin-cap fibroatheroma |
| Organ | ML Prediction Endpoint | Statistics Quoted | Author (Year) | Sample Size | Sensitivity | Specificity | Accuracy | AUC | ||||
|---|---|---|---|---|---|---|---|---|---|---|---|---|
| Min | Max | Min | Max | Min | Max | Min | Max | |||||
| Brain | Carotid elastography | Per patient | Roy-Cardinal (2019) | 66 patients | 0.79 | 0.83 | ||||||
| Carotid plaque echomorphology | Per lesion | Golemati (2020) | 77 patients | 0.69 | 0.86 | 0.68 | 0.88 | 0.69 | 0.85 | 0.79 | 0.90 | |
| Per patient | Huang (2018) | 315 frames | 0.68 | 0.81 | 0.63 | 0.89 | 0.72 | 0.85 | 0.71 | 0.83 | ||
| Per image | Pedro (2014) | 146 frames | 0.66 | 0.70 | 0.76 | 0.80 | 0.73 | 0.77 | 0.79 | 0.89 | ||
| Carotid plaque segmentation | Menchon-Lara (2016) | 67 patients | ||||||||||
| IMT measurement & plaque detection | Per patient | Hassan (2013) | 300 frames | 0.98 | 0.98 | 0.98 | 0.98 | |||||
| Heart | Probability of OCT identified thin-cap fibroatheroma | Per image | Bae (2019) | 41,101 frames | 0.81 | 0.84 | 0.61 | 0.79 | 0.76 | 0.82 | 0.74 | 0.82 |
| Organ | ML Prediction Endpoint | Author (Year) | No. of Patients (M/F) | Imaging Modality | ML Approach | ML Validation | Gold Standard |
|---|---|---|---|---|---|---|---|
| Brain | Atherosclerosis identification | Wu (2019) | 1482 | MRI | 2.5D CNN (U-Net) | 90/10 holdout validation | Clinicians’ segmentations (n unknown) |
| Cerebral blood flow & cerebrovascular reactivity | Waddle (2019) | 53 (10/43) | MRI | LOO-CV k-fold cross validation (n = 3) | Invasive coronary angiography | ||
| Heart | Functional stenosis significance | Cho (2019) | 1501 (1157/344) | Invasive Angiography | XGBoost | 80/20 holdout validation k-fold cross validation (n = 5) | 79 external patients |
| Gao (2019) | 0 | Computer Generated CTA | Recurrent Neural Net | 180 external patients w/Invasive coronary angiography FFR | |||
| Presence of CAD | Forssen (2017) | 3409 | NMR quantification of 256 metabolites | Random Forest + Penalized Logistic Regression | k-fold logistic regression (n = 50) | Coronary angiography reports | |
| Probability of myocardial ischemia | Nakajima (2015) | 106 (65/41) | NM (Tc-MPI) | Artificial Neural Net. | Clinicians’ segmentations (n = 3) | ||
| Nakajima (2017) | 1001 (751/250) | NM (Tc-MPI) | Artificial Neural Net. | 364 (265/98) external patients | Clinicians’ segmentations (n unknown) | ||
| Nakajima (2018) | 106 (65/41) | NM (Tc-MPI) | Artificial Neural Net. | Clinicians’ segmentations (n = 3) | |||
| Wang (2020) | 88 (83/5) | PET (13N-NH3 & 18F-FDG) | SVM, Logistic Regression, Decision Tree, Linear Discriminant Analysis, Naïve Bayes, k-Nearest Neighbour, Random Forest | 60/40 holdout validation | Invasive coronary angiography |
| Organ | ML Prediction Endpoint | Statistics Quoted | Author (Year) | Sample Size | Sensitivity | Specificity | Accuracy | AUC | ||||
|---|---|---|---|---|---|---|---|---|---|---|---|---|
| Min | Max | Min | Max | Min | Max | Min | Max | |||||
| Brain | Atherosclerosis identification | Wu (2019) | 18,915 frames | 0.81 | 0.89 | 0.87 | 0.95 | |||||
| Cerebral blood flow and cerebrovascular reactivity | Waddle (2019) | 112 hemispheres | 0.43 | 0.7 | 0.67 | 0.83 | 0.65 | 0.71 | ||||
| Heart | Functional stenosis significance | Per patient | Cho(2019) | 1501 frames | 0.72 | 0.84 | 0.77 | 0.89 | 0.81 | 0.85 | 0.87 | 0.90 |
| Per patient | Gao (2019) | 13,000 synthetic trees | 0.84 | 0.92 | 0.75 | 0.89 | 0.89 | 0.94 | ||||
| Presence of CAD | Per patient | Forssen (2017) | 3409 patients | 0.94 | 0.94 | 0.21 | 0.28 | 0.71 | 0.73 | 0.68 | 0.71 | |
| Probability of myocardial ischemia | Per patient | Nakajima (2015) | 106 patients | 0.69 | 0.62 | 0.66 | 0.88 | 0.97 | ||||
| Per patient | Nakajima (2017) | 1001 patients | 0.90 | 0.93 | ||||||||
| Per patient | Nakajima (2018) | 106 patients | 0.78 | 0.87 | 0.96 | 0.98 | 0.89 | 0.92 | 0.89 | 0.96 | ||
| Per patient | Wang (2020) | 159 vessels | 0.72 | 0.91 | 0.32 | 0.84 | 0.65 | 0.81 | 0.62 | 0.86 | ||
Publisher’s Note: MDPI stays neutral with regard to jurisdictional claims in published maps and institutional affiliations. |
© 2021 by the authors. Licensee MDPI, Basel, Switzerland. This article is an open access article distributed under the terms and conditions of the Creative Commons Attribution (CC BY) license (http://creativecommons.org/licenses/by/4.0/).
Share and Cite
Boyd, C.; Brown, G.; Kleinig, T.; Dawson, J.; McDonnell, M.D.; Jenkinson, M.; Bezak, E. Machine Learning Quantitation of Cardiovascular and Cerebrovascular Disease: A Systematic Review of Clinical Applications. Diagnostics 2021, 11, 551. https://doi.org/10.3390/diagnostics11030551
Boyd C, Brown G, Kleinig T, Dawson J, McDonnell MD, Jenkinson M, Bezak E. Machine Learning Quantitation of Cardiovascular and Cerebrovascular Disease: A Systematic Review of Clinical Applications. Diagnostics. 2021; 11(3):551. https://doi.org/10.3390/diagnostics11030551
Chicago/Turabian StyleBoyd, Chris, Greg Brown, Timothy Kleinig, Joseph Dawson, Mark D. McDonnell, Mark Jenkinson, and Eva Bezak. 2021. "Machine Learning Quantitation of Cardiovascular and Cerebrovascular Disease: A Systematic Review of Clinical Applications" Diagnostics 11, no. 3: 551. https://doi.org/10.3390/diagnostics11030551
APA StyleBoyd, C., Brown, G., Kleinig, T., Dawson, J., McDonnell, M. D., Jenkinson, M., & Bezak, E. (2021). Machine Learning Quantitation of Cardiovascular and Cerebrovascular Disease: A Systematic Review of Clinical Applications. Diagnostics, 11(3), 551. https://doi.org/10.3390/diagnostics11030551