Abstract
Pituitary adenomas (PAs) can be unpredictable and aggressive tumors. No reliable markers of their biological behavior have been found. Here, a proteomic analysis was applied to identify proteins in the expression profile between invasive and non-invasive PAs to search for possible biomarkers. A histopathological and immunohistochemical (adenohypophyseal hormones, Ki-67, p53, CD34, VEGF, Flk1 antibodies) analysis was done; a proteomic map was evaluated in 64 out of 128 tumors. There were 107 (84%) invasive and 21 (16%) non-invasive PAs; 80.5% belonged to III and IV grades of the Hardy–Vezina classification. Invasive PAs (n = 56) showed 105 ± 43 spots; 86 ± 32 spots in non-invasive PAs (n = 8) were observed. The 13 most prominent spots were selected and 11 proteins related to neoplastic process in different types of tumors were identified. Hint1 (Histidine triad nucleotide-binding protein 1) high expression in invasive PA was found (11.8 ± 1.4, p = 0.005), especially at high index (>10; p = 0.0002). High Hint1 expression was found in invasive VEGF positive PA (13.8 ± 2.3, p = 0.005) and in Flk1 positive PA (14.04 ± 2.28, p = 0.006). Hint1 is related to human tumorigenesis by its interaction with signaling pathways and transcription factors. It could be related to invasive behavior in PAs. This is the first report on Hint expression in PAs. More analysis is needed to find out the possible role of Hint in these tumors.
1. Introduction
Pituitary adenomas (PAs) are the most common alteration of the pituitary gland. At the National Institute of Neurology and Neurosurgery in Mexico City, they are the second most treated tumor after meningeal tumor (22.35%) [1] and account for 91% of sellar and parasellar tumors and 10–15% of intracranial neoplasms with prevalence 2.7–24% in autopsy investigations [2,3,4]. They have monoclonal origin and are classified according to their hormonal type (lactotrophs, gonadotrophs, somatotrophs, corticotrophs, and thyrotrophs). Prolactinomas and adrenocorticotropic hormone (ACTH) PAs are the most common in women, while non-functioning pituitary adenomas (NFPAs) and growth hormone PAs are the most frequent in men [5,6,7,8]. They are classified into functioning or non-functioning pituitary adenomas according to their clinical manifestations related or unrelated to hormone production, and by their size evaluated with imaging studies (microadenomas: ≤10 mm diameter; macroadenomas: ≥10 mm diameter; or giant adenomas: ≥40 mm diameter) [9,10]. They have been considered benign and slow-growing tumors with complex and varied clinical manifestations in relation to hormonal mismatch (galactorrhea, amenorrhea, Cushing’s syndrome, acromegaly, gigantism) or mass effect (headache, visual impairment). Despite their apparent behavior, PAs can cause considerable damage with significant morbidity (diabetes: up to 80%; hypertension: 50%; visual defect: 30.5%; neurosurgery effects: 86.1%), and mortality (up to 16%) [11,12,13]. They can be invasive (30–45% of the cases), destroying adjacent structures as sphenoid and/or cavernous sinus and bones at the base of the skull (grades III and IV of Hardy–Vezina classification system) and invading the cavernous sinus (grades III and IV of Knosp classification system) [14,15,16]. In addition, PAs can be aggressive, presenting rapid growth, significant invasion, resistance to conventional treatment, recurrences (sometimes needing more than one surgery in a period of seven years), increased mitotic index, Ki67 proliferation index (Ki67i) greater than 3%, and extensive p53 immunostaining. These tumors were considered a high risk and were classified as atypical (third edition of WHO classification), but the atypical pituitary term is no longer used in the new WHO classification (2017) [17,18]. Due to the aggressive and invasive character of PAs, the term neuroendocrine pituitary tumor (PitNet, pituitary neuroendocrine tumor) has been proposed, which better describes their behavior [15].
In PA investigation, several experimental strategies (histochemistry and immunohistochemistry techniques) have been performed, which allow for the identification and classification of PAs according to stain affinity (basophils, chromophobes, and acidophils), type of hormonal content (prolactin, growth hormone, LH, FSH, TSH, ACTH), PCR technique (endpoint PCR, RT-PCR, ddPCR), microarrays, RNA-Seq, bidimensional polyacrylamide gel electrophoresis (2-DE), mass spectrometry, and laser-capture microdissection (LCM) [19,20,21,22,23,24,25,26]. Furthermore, DNA sequencing has been applied to find genetic alterations and epigenetic changes [27], but only partial tumor genesis information has been found, since the transcriptome and the proteome are dynamic. Then, new experimental strategies have been used in an effort to elucidate the biological behavior of PAs. The term proteome was first introduced by Wasinger and Wilkins to define the analysis of gene expression based on the analysis of proteins, where the proteome is the PROTEin analysis, the complement expressed by the genOME of a cell or tissue [28,29]. This is why transcriptomics and proteomics play a key role in functional genomics to understand the regulation of biological systems.
The proteomic analysis of the PA has revealed the expression of proteins classified by functional groups (pituitary hormones, cellular signals, enzymes, cellular-defense proteins, and cell-structure proteins, among others) among different subtypes of tumors. They are related to pathway networks (Wnt and Notch pathways; mitochondrial dysfunction, oxidative stress, MAP kinase, PI3K-Akt, mTOR ERK/MAPK, endocytosis, and spliceosome signaling pathways, among others), some of them associated with tumor invasiveness and aggressiveness [30,31,32,33,34,35,36,37]. Variants of prolactin have been identified in prolactinomas, and they may be involved in different signaling pathways [38]. In ACTH-secreting PAs, differentially expressed proteins have been found to be related to the Myc signaling pathway and participate in metabolic changes and tumorigenesis in these tumors [39]. Differentially expressed proteins, genes, and mRNA isoforms have been identified through integrative proteomics and transcriptomics; they have been proposed as markers of invasiveness and possible therapeutic targets [40,41,42,43]. However, further research is necessary to consider some proteins as diagnosis, prognosis, and/or treatment biomarkers.
The aim of this study was to analyze proteomic profiles in invasive and non-invasive PAs to search for proteins associated with the pathophysiology of these tumors. We analyzed proteomic profiles from PA tissues by 2DE, protein spots were selected and identified by mass spectrometry, and Hint1 protein expression was assessed in PA. The results of this work show the search for proteins participating in the neoplastic process that are possible candidates for diagnostic, prognostic, and/or treatment markers.
2. Materials and Methods
The project was approved by the ethics committee of the National Institute of Neurology and Neurosurgery (101-17), and the study was conducted in accordance with the Declaration of Helsinki. Informed consent for the use of the samples for research purposes was obtained from the patients.
A total of 128 PA samples were collected and processed for histopathological analysis. The PAs were classified according to their clinical manifestations and radiological (MRI) and histopathological analysis (Figure 1).
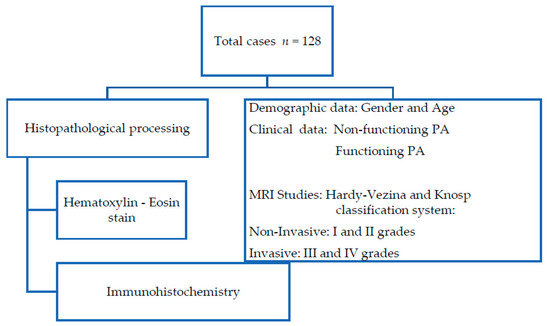
Figure 1.
Flowchart of histopathological procedure and clinical data obtained from medical records.
2.1. Histopathological Processing
Surgical specimens for the patient’s diagnosis of PAs were collected during surgery. The surgical procedure performed for tumor resection was transnasal–transsphenoidal and transcranial. PA tissue intended for histopathological analysis was fixed with 10% formaldehyde, dehydrated in an automatic tissue processor using alcohol (Histokinette 2000, Reichert-Jung, American Optical Buffalo, New York, NY, USA), and embedded in paraffin. Four micrometer-thick sections were stained with hematoxylin–eosin and observed under a wide-field Nikon photo microscope (Nikon Co., Tokyo, Japan). Neuropathologist experts analyzed the biopsies and determined the histopathological diagnostic. PA were characterized by immunohistochemistry with adenohypophyseal hormones, proliferation, and angiogenic markers.
2.2. Immunohistochemistry
Sections of each case were deparaffinized, rehydrated, and rinsed in phosphate-buffer saline (PBS); antigenic retrieval was performed heating the sections in a pressure cooker in a commercial solution (Reveal, Biocare Medical, Concord, CA, USA) for 7 min, and rinsed again in PBS. Afterwards, endogenous peroxidase was blocked with 0.25% H2O2/distilled water for 20 min, rinsed in PBS at first, and then in 0.1%-Triton X-100 PBS. The sections were incubated in a wet chamber, in primary antibodies against adenohypophyseal hormone antibodies (Prl, GH, LH, FSH, ACTH, TSH), proliferation marker antibodies (Ki67, p53), angiogenic marker antibodies (CD34, VEGF, Flk1), and Hint1 protein (Table 1) at 4 °C overnight. Slides were washed after incubation with the primary antibody, and the reaction was detected by streptavidin–biotin system with the Peroxidase Mouse & Rabbit kit (Diagnostic BioSystems, Pleasanton, CA, USA) and revealed with diaminobenzidine using a 2 Component DAB Pack kit (BioGenex, Carpinteria, CA, USA) according to the manufacturer’s instructions; by the last, sections were hematoxylin counterstained. Normal human pituitary tissue sections were used as a positive control of the immunohistochemical technique, and sections incubated without primary antibody were used as negative control. Immunodetection was analyzed by two experts, under a wide-field photo microscope Nikon (Nikon Co. Tokyo, Japan).

Table 1.
Antibodies used in immunohistochemical technique.
The assessment of immunohistochemical reaction (adenohypophyseal hormones, p53, VEGF, Flk1) was reported as positive in tissues with constant brown stain (nuclear or cytoplasmic) throughout the histological section, ruling out a scant or sporadic mark. Ki67i and Hint1 proteins were evaluated by quantifying the number of positively stained nuclei in five to 10 high power fields at ×400 per case and were reported as mean value of positive nuclei. For the evaluation of microvascular density (CD34d), blood positive vessels were quantified in the three most vascularized areas (hot spots) of the tumors at ×400 magnification (×40 objective lens) per case, and the average of each slide was obtained [44].
All data were presented as mean ± SD. To analyze the variables, the Kolmogorov–Smirnov test was performed, and the data were analyzed by one-way ANOVA (IBM SPSS Statistics v. 25.0; GraphPad Prism 5). To identify whether gender, age, MRI characteristics, or hormone expression on tissue were associated with the expression of Ki-67i, p53, CD34, VEGF, Flk1, and Hint1, Student’s t-test, analysis of variance, and chi-square test were used; p < 0.05 was considered statistically significant.
2.3. Proteomic Process
2.3.1. Protein Pituitary Adenoma Extraction
During neurosurgery, a dry tumor sample was collected in a sterile Eppendorf tube and kept on ice immediately to avoid degradation. The sample was evaluated by a neuropathologist to separate tumor tissue and stored at −80 °C until process. PA proteins were analyzed by 2-DE using immobilized pH gradient strips [45]. Tumor tissue samples were homogenized in lysis buffer (7 M urea, 2 M thiourea, 4% CHAPS, 2% IPG buffer pH 3–10 (GE, Healthcare, Piscataway, NJ, USA), 40 mM DTT) with protease inhibitor cocktail (Complete, Roche Diagnostics, Indianapolis, IN, USA) and phosphatase inhibitors (PhosStop, Roche Diagnostics, Penzberg, Germany) followed by three freeze/thaw cycles in liquid nitrogen. Then, the samples were centrifuged at 14,000 × g at 4 °C for 30 min, and the supernatant was recovered and subsequently precipitated with acetone at −20 °C with methanol/ chloroform. Finally, the proteins were cleaned with a 2-D Clean-Up kit (GE Healthcare, Piscataway, NJ, USA) according to the manufacturer’s instructions. The samples were solubilized in rehydration buffer (Destreak Rehydration Solution, GE Healthcare, USA) with protease and phosphatase inhibitors. Protein quantification was done using a 2-D Quant Kit (GE Healthcare, Biosciences, USA) according to the supplier’s instructions. One hundred fifty μL samples (5.153 μg/10 μL ± 1.784; 77 ± 26.8 μg protein) were applied to IPG strips pH 3–10, 7 cm (GE Healthcare, Sweden), and rehydrated at room temperature for 16 h. Afterwards, IEF was carried out in a Protean IEF Cell (Bio-Rad, Hercules, CA, United States), following the manufacturer’s protocol. Second dimension was performed in 15% SDS-PAGE, and gels were stained with Bio-Safe Coomassie (Bio-Rad, USA).
2.3.2. Image and Data Analysis of Gel
Images of 2-DE gels were obtained using the Fusion FX 6 Edge V. 070 imaging system (Vilber Lourmat, Collégien, France), and the proteomic profile of each biopsy was analyzed, using Bio1D EvolutionCapt (Vilber Lourmat, Collégien, France). Protein spots were quantified in each 2-DE gel and compared in invasive and non-invasive PA; differential protein spots (different between invasive and non-invasive PAs) were selected, considering those that showed outstanding intensity and a better definition. The quantification number of 2-DE spots was analyzed by Student’s t-test.
2.3.3. Nanoflow LC-MS/MS
Protein identification was done at PlanTECC National Laboratory of the Center for Research and Advanced Studies at the National Polytechnic Institute, Campus Irapuato, Guanajuato Mexico. All experiments were performed on a nanoACQUITY nano-flow liquid chromatography (LC) system, coupled to an LTQ velos linear ion trap mass spectrometer (Waters, Thermo Fisher Scientific, Bremen, Germany) equipped with a nanoelectrospray ion source.
The selected spots were manually excised from Coomassie blue 2-DE gels under sterile conditions; proteins were extracted and trypsin was digested [46]. Immediately afterwards, 3 µl digested proteins were resuspended in solvent A (0.1% formic acid) and bound to a pre-column (Symmetry® C18, 5 μm, 180μm × 20 mm, Waters). Subsequently, the flow was then switched to a 10-cm capillary UPLC column (100 μm ID BEH-C18 1.7μm particle size). The column temperature was controlled at 35 °C. The peptides were separated by a 60-min gradient method at a flow rate of 400 nL/min. The gradient was programmed as follows: 3–50% solvent B (100% acetonitrile in 0.1% formic acid) over 30 min, 50–85% B over 2 min, 85% B over 4 min, and 3% B over 22 min. The peptides were eluted into the mass spectrometer nano-electrospray ionization source through a standard coated silica tip (NewObjective, Woburn, MA, USA). The mass spectrometer was operated in data-dependent acquisition mode in order to automatically alternate between full scan (400–1600m/z) and subsequent Top 5 MS/MS scans on the linear ion trap. Collision-induced dissociation was performed using helium as collision gas at a normalized collision energy of 35% and 10 ms activation time. Data acquisition was controlled using Xcalibur v2.3 (Thermo Fisher Scientific).
2.3.4. Automated Data Evaluation Work-Flow
Tandem mass spectra were extracted in Proteome Discoverer v1.4 and searched against a database on a Sequest HT engine. Searches were executed with the following parameters: 2 Da parent MS ion window, 1 Da MS/MS ion window, and two missed cleavages allowed. The iodoacetamide derivative of cysteine (carbamidomethylcysteine) was specified on Sequest as a fixed modification and oxidation of methionine as a variable modification.
3. Results
3.1. Clinical Characteristics
Demographic and clinical dates of PA are presented in Table 2.
Table 2.
Pituitary adenoma dates.
Recurrences have no relation with gender (p = 0.437), hormonal PA types (p = 0.116), or between invasive and non-invasive PAs (p = 0.983). These results are in accord with those previously reported. Although PA invasiveness has been associated with recurrence, studies have concluded that the invasive behavior itself is not a significant factor in predicting recurrence. Furthermore, suprasellar extension and/or cavernous sinus invasion are also not associated with tumor recurrence and, although larger tumors are found to recur more frequently, no statistically significant differences were found. [47].
3.2. Histopathological Findings
The tissue sections showed an epithelial neoplasm with solid, papillary, and nodular histological patterns. Scarce biopsies with cellular atypia (7%), nuclear pleomorphism (1.6%), and mitosis (0.8%) were observed (Figure 2A). According to the immunohistochemistry analysis, 70 (54.7%) were FSH and/or LH-positive PA, 26 (20.3%) showed plurihormonal content, 20 (15.6%) exhibited no hormonal detection, four (3.1%) were GH-PA, three (2.3%) presented prolactin hormone, four (3.1%) were ACTH, and one (0.8%) was prolactin-GH (Figure 2B). Cell proliferation was assessed by immunohistochemistry, and Ki-67i expression (Figure 2C) was 0.7 ± 0.08% (range, 0–3.6%). No significant difference was found between invasive (range, 0–3.6; 0.8 ± 0.08) and non-invasive PAs (range, 0–3.2; 0.6 ± 0.2) (p = 0.341). The expression of p53 showed 97 (75.8%) positive cases (Figure 2D), out of which 82 (84.5%) were invasive Pas, but no statistically significant difference was observed between invasive and non-invasive PAs (p = 0.611). No relation between the positive expression of p53 and Ki-67i was found (p = 0.919).
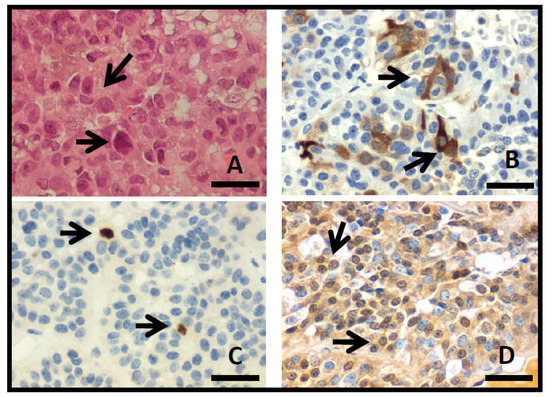
Figure 2.
(A) Photomicrographs of PA with hematoxylin–eosin stain, showing solid pattern with nuclear pleomorfism (arrows). Immunohistochemistry show cytoplasmic detection to FSH (B), Ki-67 nuclear detection (C), and p53 nuclear detection (D) (arrows; original magnification 400×, scale bar 250 µm).
Angiogenic grade in solid tumors, as PA, is commonly evaluated by microvascular density in which the number of vessels in a certain area are quantified. The CD34d (Figure 3A) was 5.1 ± 3.9 (range, 1–33.3), while no statistical difference was found between invasive (CD34d 5.3 ± 3.1) and non-invasive PAs (CD34d 6.3 ± 6.6) (p = 0.274). VEGF expression was found in 49 (38.3%) cases (Figure 3B), out of which 41 (83.7%) were invasive PA; still no statistically significant difference was found between invasive and non-invasive PAs (p = 0.563). The expression of Flk1 was positive in 36 (28.1%) PAs, out of which 33 (91.7%) were invasive (Figure 3C). There was no statistically significant difference between invasive and non-invasive PAs (p = 0.147). An inverse relationship was found between the positive expression of Flk1 and Ki67i (p = 0.030) such that a lower Ki67i was observed in positive Flk1 PAs. Additionally, a relation between Flk1 and positive p53 expression was found (p = 0.031). No relation was found between recurrence with CD34 (p = 0.374), VEGF (p = 0.696), and Flk1 (p = 0.972).
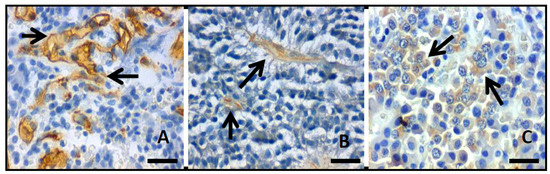
Figure 3.
Photomicrographs showing the inmmunohistochemistry reaction (arrows) to (A) CD34, (B) VEGF, and (C) Flk1.; original magnification 400×, scale bar 250µm).
No statistically significant difference was found between hormonal PA types and Ki-67 (p = 0.182), p53 (p = 0.733), CD34 (p = 0.620), VEGF (p = 0.138), Flk1 (p = 0.266), and gender (p = 0.095).
These results show that even though 80.5% of the cases studied are invasive, they do not show aggressive behavior. It has been shown that the term invasiveness in PA is not synonymous with aggressiveness. Aggressive PAs show a Ki-67 index >3%, extensive p53 positivity, and a high rate of mitosis, recurrence, and resistance to treatment. These factors were not observed in the cases studied; still, it is necessary to follow up these patients, since this was the first surgery for most of them [16,18].
3.3. Proteomic Analysis
Demographic and clinical data of PAs analyzed by proteomics are shown in Table 3.
Table 3.
Pituitary adenoma data.
Sixty four samples out of 128 cases were collected and analyzed by 2-DE. The availability of tissue for proteomic analysis depended on the amount of tumor tissue obtained during surgery. The tissue was divided into two parts: one sample was used in histopathology to make the diagnosis and the other in proteomic analysis. In the proteomic analysis, 103.4 ± 42.3 spots (range, 32–260) were found distributed in the area of pH 4.0–8.0 and mass 10–100 kDa. Invasive PAs (n = 56) showed 105 ± 43 spots, while 86 ± 32 spots were observed in non-invasive PA (n = 8). No statistical difference was found between invasive and non-invasive PAs (p = 0.226). A master 2-DE gel was selected for invasive and non-invasive Pas, and the most representative and differential spots of each group were selected (Figure 4). Thirteen differential spots were selected, and 11 proteins were identified in the proteomic profile (Table 4).
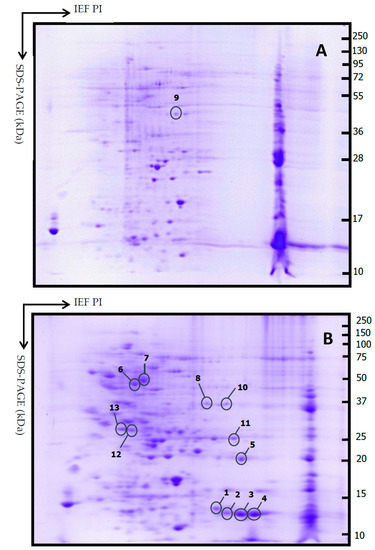
Figure 4.
Representative 2DE gels from non-invasive PA (A) and invasive PA (B). Thirteen spots were selected comparing between all gels. Isoelectric focusing (IEF) was carried out with a 7 cm IPG strip (pH 3–10); second dimension SDS-PAGE (15% polyacrylamide gel).
Table 4.
Mass-spectrometric identification from the selected spots.
3.4. Hint1 Expression
In order to rectify the presence of Hint1 in PA, Hint1 expression index (Hint1i) was assessed by immunohistochemistry in the same 64 cases where Hint1 was identified (Figure 5). PAs show Hint1i 10.9 ± 1.3 (range 0.5–38.1). Non-invasive PAs show Hint1i 4.8 ± 0.94 (range 2.6–9); a statistically significant difference was found between non-invasive and invasive PAs (11.8 ± 1.46, p = 0.005). Since non-invasive PAs showed a range of expression of 2.6–9, and the invasive PAs showed a wider range of expression, the values were grouped in two levels: low level <10 and high level >10. A statistically significant difference was found between non-invasive and invasive PAs with a high Hint1i (Hint1i >10; p = 0.0002). Statistically significant differences were found between Ki-67i in low Hint1i (0.95 ± 0.15) with Ki-67i in high Hint1i (0.47 ± 0.16; p = 0.044). Hint1i was compared against p53 expression. No statistically significant differences were found between Hint1i in p53 positive cases (12.2 ± 1.5) and Hint1i in p53 negative cases (6.4 ± 2.5; p = 0.08); however, a statistically significant difference was observed in p53 positive cases between low (5.4 ± 0.5) and high Hint1i (20 ± 0.8; p = 0.0001).
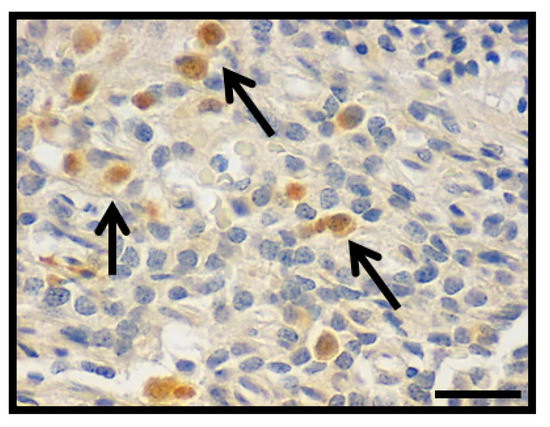
Figure 5.
Photomicrograph showing the nuclear inmmunohistochemistry detection to Hint1 in PA (arrows; original magnification 400×, scale bar 250 µm).
Expressions of angiogenic factors were assessed. Statistically significant difference of CD34d between Hint1i positive cases (5.7 ± 0.5) and Hint1i negative cases (3.73 ± 0.5; p = 0.007) was found. Hint1i showed a statistically significant difference in VEGF positive cases between invasive (13.8 ± 2.3) and non-invasive PA (4.8 ± 0.28; p = 0.005), and between Flk1 positive cases (14.04 ± 2.27) and Flk1negative cases (6.5 ± 1.3; p = 0.006). No relation was found between Hint1 expression and tumor size (p = 0:822), gender (p = 0.560), hormonal type (p = 0.953), and recurrence (p = 0.295).
4. Discussion
The pituitary gland is made up of different cell types, each one related (each cell type) to its hormone secretion. Therefore, PAs are a heterogeneous group of tumors due to their monoclonal origin, giving rise to different tumor types. PAs have been classified according to their radiological, clinical, and histopathological characteristics as well as their hormonal content. In this cellular diversity, many molecular processes participate, complicating the study and limiting the understanding of PAs. Despite being considered benign, PAs can be invasive, aggressive, and recurrent, causing deterioration in human health. Markers are necessary to explain their biological behavior and help in their prognosis and treatment. Our study aimed to identify proteins in the expression profile between invasive and non-invasive PAs to search for possible biomarkers. By proteomic strategy, differences in proteomic profile between invasive and non-invasive PAs were observed, and 11 proteins were identified. Proteins related to metabolic enzymes (Phosphoglycerate mutase 1, Gamma enolase), cellular signals (14-3-3 protein epsilon), cell structure and mobility (Tropomyosin alpha 3 chain), and energy metabolism (ATP synthase beta chain, mitochondrial) were found, as reported in PAs [30]. Proteins involved in a neoplastic process were identified, and no reports of their expression in PA were found.
Hint1 (Histidine triad nucleotide-binding protein 1) was first identified as a human PKC-interacting protein whose cDNA encodes a 13.7 KDa protein located in 5q31.2 human chromosome. Later, it was found in normal and tumor cell lines, and its function as PCK inhibitor was discarded [48,71]. Hint1 is a protein member of the histidine triad family (HIT; Hist-X-Hist-X-HistX-X; X = hydrophobic amino acid), and it is a part of a binding loop for the α-phosphate of purine nucleotides. It can bind to nucleotides as AMP, ADP, and diadenosine polyphosphates Ap3A and Ap4A. Rabbit Hint1 can also bind to several purine nucleosides and nucleoside ‘5-phosphates, while rabbit and human Hint1 can hydrolyze ADP in vitro; therefore, Hint1 is considered a purine nucleotide-binding protein. It has been suggested that the biological effects of unusual purine nucleotides can be mediated by Hint1 protein [49,72,73,74,75].
It has been reported that Hint1 can play a role in transcription regulation that could affect tumorigenesis signaling pathways [50], and it has been observed that Hint1 protein can act as tumor-suppressor [48,49]. Hint1 exerts its tumor suppressor activity by binding to transcription factors, such as MITF and β-catenin, and its suppressive function is in turn regulated by an acetylation-dependent mechanism [51,76,77]. Hint1 negative regulation in TCF/β-catenin transcriptional activity was found, which represses the expression of Wnt signaling pathways target genes such as axin2 and cyclinD1 [52]. The expression of SLC20A1 (phosphate transporter 1) in a study on somatotroph adenomas was associated with the activation of the Wnt/β-catenin signaling pathway. In this study, SLC20A1 expression was related to tumor size, invasive behavior, and tumor recurrence [53]. On the other hand, the MITF–Hint1 interaction can be disrupted by the binding of the second messenger Ap4A, and MITF is activated together with post-translational modifications of Hint1 (acetylation and phosphorylation) [78,79]. It has been reported that MITF expression promotes cell proliferation, invasion, and cell survival in rat prolactinomas. MITF can reverse the antitumor effect of miR-137, which has been correlated with invasive behavior in prolactinomas. miR-137 can upregulate Wtn-inhibitory factor1 and inhibit nuclear translocation of β-catenin [78,80].
Cyclin D1 is a cell cycle regulator and can act as oncoprotein. In PAs, the correlation between cyclin D1 expression with Ki67 and tumor size has been reported, and nuclear accumulation of β-catenin and over expression of cyclin D1 and c-Myc was found in non-functioning PA [81,82]. In corticotroph adenomas, cyclin D1 has been proposed as biomarker of tumor aggressiveness [83].
In a transient transfection experiment with Hint1, apoptosis induction associated with high p53 and Bax expression and decreased Bcl-2 expression was observed [84]. The extensive p53 expression and Ki67i >3% have been associated with tumor recurrence in PA [47]. Our analysis found no relation of p53 positive expression to Ki67i; however, high Hint1i (>10) was observed in p53 positive cases and low Ki67i, which could indicate the tumor suppressor activity of Hint1. This result likely shows a possible relationship between the expression of p53 and Ki-67 and Hint1 expression in invasive PA.
The role of Hint1 in cancer migration and invasion has been analyzed. Downregulated Hint1 expression was found in metastatic lymph nodes cells in hepatocellular carcinoma, involving Hint1 in a migration and invasion process by modulating girdin and AKT expression and phosphorylation [54]. Hint1 gene and mRNA expression were assessed in a family history of gastric cancer (FHGC) cases. Higher Hint1 gene expression levels were found in antrum samples with atrophic changes in FHGC cases, while lower mRNA levels were observed in antrum samples of FHGC patients compared against control samples. The decreased Hint1 mRNA levels in FHGC patient samples could be a predisposing marker to develop gastric cancer [85]. We observed high Hint1i expression in invasive PA, and high Ki67i was found in cases of low Hint1i levels. This may point to a necessary closer follow-up of these patients, since the aggressive and invasive behavior of PA can also be related to tumor recurrence [55]. Hint1 has been proposed as potential biomarker of radiosensitivity and therapeutic target. In the gastric cancer cell line SGC-7901, Hint1 inhibits cell proliferation, arrests the cell cycle in G1 phase, and reduces the DNA damage repair induced by radiation, increasing the radiosensitivity [56]. An increase in Hint1 expression by Taraxasterol inhibits the growth of liver cancer cells and regulates Bax, Bcl2, and cyclin D1 expression in human liver cancer [86].
Angiogenesis is an important factor in cell growth, cell differentiation, and endothelial migration and is regulated by vascular endothelial growth factor (VEGF) and its receptor (Flk1). In PAs, VEGF participates in vascular network formation and PA tumorigenesis, as it is involved in cell proliferation and invasion [87,88,89]. In prolactin, PA angiogenesis, together with Ki67 >3%, p53 positive, mitoses >2, and vascular invasion, has been associated with aggressiveness and is suspicious of malignancy. A high rate of VEGF expression has been found in pituitary carcinomas. This factor has been proposed as a marker of poor outcome after partial tumor resection [90,91,92,93]. The VEGF receptor Flk1 (VEGFR-2) is a signal transducer that participates in signaling cascades that can promote endothelial cell survival, proliferation, and angiogenesis, and it has been associated with aggressiveness [87,94]. Although less vascularization has been observed in PA than in a normal pituitary gland, a greater vascular density has been reported in invasive macroprolactinomas [95,96]. Our study found no relation between CD34d and invasive behavior; however, high CD34d was observed in Hint1 positive cases, while Hint1i expression was elevated in invasive VEGF, positive PA, and Flk1-positive cases. Although a relation between Flk1 expression and p53 positive expression was found, an inverse relationship between the Flk1 positive expression and Ki-67i was observed. No reports of Hint1 participation were found in angiogenesis nor vascularization processes. The results of this analysis suggest the possible participation of HINT1 in some signaling pathway that can be related to angiogenesis mechanism. In our work, significant differences were found between invasive and non-invasive PAs. More research is necessary in order to include a greater number of non-invasive PA cases, which is a limitation in this type of study.
5. Conclusions
Protein expression analysis by proteomic strategy shows a reference map to assess the cell physiology under a special condition. The heterogeneous nature of pituitary adenomas, given that they are originated by different types of cells, has made it difficult to understand their behavior. Then, it has been necessary to identify biomarkers, tools that allow investigating new pathways involved in their development. Here, we identified the expression of Hint1 protein as related to human tumorigenesis by its interaction with signaling pathways and transcription factors. We found that Hint1 expression is higher in invasive pituitary adenomas, showing a possible relation with the expression of cell proliferation markers and angiogenic factors; it could also be related to invasive behavior. This is a first report on Hint1 expression in pituitary adenomas. Further and more detailed analyses are necessary to understand the signaling pathways in which Hint1 participates and elucidate the possible role of Hint1 in these tumors.
Author Contributions
F.d.l.C.H.-H., A.O.-P., and F.C.-R.: conceptualization, direction, and planning. A.O.-P. and C.C.-N. wrote the manuscript, analysis, and interpretation of the data and created the figures and the tables. S.Z.-V. and N.G.-H. performed sample preparation and histopathological process. C.C.-N. performed process and collection of clinical, immunohistochemical, and proteomic data. M.A.R.-P. and J.L.G.-A. performed the neurosurgery and tumor resection. D.R.-B. and M.L.T.-S.: analysis and histopathological interpretation of the cases and revising the results and manuscript for publication. All the authors review and approve of the manuscript. All authors have read and agreed to the published version of the manuscript.
Funding
This research was funded by the Consejo Nacional de Ciencia y Tecnología (grand 289912 to A. O. P.) as part of Fondo Sectorial De Investigación En Salud Y Seguridad Social SS/IMSS/ISSSTE-CONACYT, and was supported by the Instituto Nacional de Neurología y Neurocirugía “Manuel Velasco Suárez”.
Institutional Review Board Statement
The project was approved by the Ethics committee of the National Institute of Neurology and Neurosurgery (101-17) and the study was conducted in accordance with the Declaration of Helsinki.
Informed Consent Statement
Informed consent for the use of the samples for research purposes was obtained from the patients.
Data Availability Statement
The data presented in this study are available on request from the corresponding author.
Acknowledgments
To Alma Rosa Ríos González for her valuable support in obtaining the tumor samples and for guiding. Carolina Carrillo Najar in the clinical knowledge of pituitary adenomas.
Conflicts of Interest
The authors declare no conflict of interest.
References
- Aguirre-Cruz, L.; Rangel-López, E.; De la Cruz-Aguilera, D.L.; Rodríguez-Pérez, C.E.; Ruano, L.; Velásquez-Pérez, L.; Martínez-Moreno, M.; Garduño-Espinosa, J.; Sotelo, J. Historical distribution of central nervous system tumors in the Mexican National Institute of Neurology and Neurosurgery. Salud Pública de Méxco. 2016, 58, 171–178. [Google Scholar] [CrossRef]
- Hashmi, F.A.; Shamim, M.S. Pituitary Adenoma: A review of existing classification systems based on anatomic extension and invasion. J. Pak. Med. Assoc. 2020, 70, 368–370. [Google Scholar] [PubMed]
- Molitch, M.E. Diagnosis and Treatment of Pituitary Adenomas: A Review. JAMA. 2017, 317, 516–524. [Google Scholar] [CrossRef]
- Rojas, D. Management of pituitary tumors. Revista Médica Clínica Las Condes 2017, 28, 409–419. [Google Scholar]
- Zhan, X.; Wang, X.; Cheng, T. Human Pituitary Adenoma Proteomics: New Progresses and Perspectives. Front. Endocrinol. 2016, 54, 1–11. [Google Scholar] [CrossRef]
- Lake, M.G.; Krook, L.S.; Cruz, S.V. Pituitary adenomas: An overview. Am. Fam. Physician. 2013, 88, 319–327. [Google Scholar]
- Lim, C.T.; Korbonits, M. Update on the clinicopathology of pituitary adenomas. Endocr. Pract. 2018, 24, 473–488. [Google Scholar] [CrossRef] [PubMed]
- Langlois, F.; McCartney, S.; Fleseriu, M. Recent Progress in the Medical Therapy of Pituitary Tumors. Endocrinol. Metab. 2017, 32, 162–170. [Google Scholar] [CrossRef] [PubMed]
- Iglesias, P.; Rodríguez, V.; Díez, J. Giant pituitary adenoma: Histological types, clinical features and therapeutic approaches. Endocrine 2018, 61, 407–421. [Google Scholar] [CrossRef] [PubMed]
- Russ, S.; Shafiq, I. Pituitary Adenoma. In StatPearls [Internet]; StatPearls Publishing: Treasure Island, FL, USA, 2020. [Google Scholar] [PubMed]
- AlMalki, M.H.; Ahmad, M.M.; Buhary, B.M.; Aljawair, R.; Alyamani, A.; Alhozali, A.; Alshahrani, A.; Alzahrani, S.; Nasser, T.; Alzahrani, W.; et al. Clinical features and therapeutic outcomes of patients with acromegaly in Saudi Arabia: A retrospective analysis. Hormones (Athens) 2020, 19, 377–383. [Google Scholar] [CrossRef] [PubMed]
- Shashidhar, A.; Arimappamagan, A.; Madhusudhan, N.; Narasinga-Rao, K.V.L.; Bhat, D.; Shukla, D.; Arvinda, H.R.; Srinivas, D.; Indira-Devi, B.; Somanna, S. Transcranial approach for pituitary adenomas—An evaluation of surgical approaches over two decades and factors influencing peri-operative morbidity. Clin. Neurol. Neurosurg. 2021, 200, 1–8. [Google Scholar] [CrossRef]
- Billings, M.; Dahlin, R.; Zampella, B.; Sweiss, R.; Lawandy, S.; Miulli, D. Conditions associated with giant pituitary tumors at the time of surgery effecting outcome morbidity and mortality. Surg. Neurol. Int. 2019, 10, 1–4. [Google Scholar] [CrossRef] [PubMed]
- Raverot, G.; Vasiljevic, A.; Jouanneau, E.; Trouillas, J. A prognostic clinicopathologic classification of pituitary endocrine tumors. Endocrinol. Metab. Clin. North. Am. 2015, 44, 11–18. [Google Scholar] [CrossRef] [PubMed]
- Asa, S.; Casar-Borota, O.; Chanson, P.; Delgrange, E.; Earls, P.; Ezzat, S.; Grossman, A.; Ikeda, H.; Inoshita, N.; Karavitaki, N.; et al. From pituitary adenoma to pituitary neuroendocrine tumor (PitNET): An International Pituitary Pathology Club proposal. Endocr. Relat. Cancer. 2017, 24, C5–C8. [Google Scholar] [CrossRef]
- Di Ieva, A.; Rotondo, F.; Syro, L.V.; Cusimano, M.D.; Kovacs, K. Aggressive pituitary adenomas--diagnosis and emerging treatments. Nat. Rev. Endocrinol. 2014, 10, 423–435. [Google Scholar] [CrossRef] [PubMed]
- Osamura, R.Y.; Lopes, M.B.S.; Grossman, A.; Matsuno, A.; Korbonits, M.; Trouillas, J.; Kovacs, K. Pituitary adenoma. In WHO classification of tumours of endocrine organs, 4th ed.Lloyd, R.V., Osamura, R.Y., Klöppel, G., Rosai, J., Eds.; IARC: Lyon, France, 2017; pp. 14–18. [Google Scholar]
- Nishioka, H.; Inoshita, N. New WHO classification of pituitary adenomas (4th edition): Assessment of pituitary transcription factors and the prognostic histological factors. Brain Tumor Pathol. 2018, 35, 57–61. [Google Scholar] [CrossRef]
- Ribeiro-Oliveira, A., Jr.; Franchi, G.; Kola, B.; Dalino, P.; Pinheiro, S.V.B.; Salahuddin, N.; Musat, M.; Góth, M.I.; Czirják, S.; Hanzély, Z.; et al. Protein western array analysis in human pituitary tumours: Insights and limitations. Endocr. Relat. Cancer. 2008, 15, 1099–1114. [Google Scholar] [CrossRef]
- Liu, Y.; Wu, J.; Yan, G.; Hou, R.; Zhuang, D.; Chen, L.; Pang, Q.; Zhu, J. Proteomic analysis of prolactinoma cells by immuno-laser capture microdissection combined with online two-dimensional nano-scale liquid chromatography/mass spectrometry. Proteome. Sci. 2010, 8, 1–11. [Google Scholar] [CrossRef] [PubMed]
- Ozeri, O.; Cohen, Z.R.; Hadani, M.; Nass, D.; Shimon, L.; Rubinfeld, H. Antibody array strategy for human growth factor secretome profiling of GH-secreting adenomas. Pituitary 2019, 22, 344–352. [Google Scholar] [CrossRef]
- Zhan, X.; Desiderio, D.M. Comparative proteomics analysis of human pituitary adenomas: Current status and future perspectives. Mass. Spectrom. Rev. 2005, 24, 783–813. [Google Scholar] [CrossRef]
- Bălinişteanu, B.; Ceauşu, R.A.; Cîmpean, A.M.; Baciu, I.; Băculescu, N.; Coculescu, M.; Raica, M. Conventional examination versus immunohistochemistry in the prediction of hormone profile of pituitary adenomas. An analysis on 142 cases. Rom. J. Morphol. Embryol. 2011, 52, 1041–1045. [Google Scholar]
- Lopes, B.S. The 2017 world health organization classification of tumors of the pituitary gland: A summary. Acta Neuropathol. 2017, 134, 521–535. [Google Scholar] [CrossRef] [PubMed]
- Seltzer, J.; Ashton, C.E.; Scotton, T.C.; Pangal, D.; Carmichael, J.D.; Zada, G. Gene and protein expression in pituitary corticotroph adenomas: A systematic review of the literature. Neurosurg. Focus 2015, 38, E17. [Google Scholar] [CrossRef]
- Bao, X.; Wang, G.; Yu, S.; Sun, J.; He, L.; Zhao, H.; Ma, Y.; Wang, F.; Wang, X.; Wang, R.; et al. Transcriptomic analysis identifies a tumor subtype mRNA classifier for invasive non-functioning pituitary neuroendocrine tumor diagnostics. Theranostics 2021, 11, 132–146. [Google Scholar] [CrossRef]
- Shen, A.J.J.; King, J.; Scott, H.; Colman, P.; Yates, C.J. Insights into pituitary tumorigenesis: From Sanger sequencing to next-generation sequencing and beyond. Expert. Rev. Endocrinol. Metab. 2019, 14, 399–418. [Google Scholar] [CrossRef]
- Wilkins, M.R.; Pasquali, C.; Appel, R.D.; Ou, K.; Golaz, O.; Sanchez, J.C.; Yan, J.X.; Gooley, A.A.; Hughes, G.; Humphery-Smith, I.; et al. From Proteins to Proteomes: Large Scale Protein Identification by Two-Dimensional Electrophoresis and Amino Acid Analysis. Biotechnology. 1996, 14, 61–65. [Google Scholar] [CrossRef]
- Wilkins, M.R.; Sanchez, J.C.; Gooley, A.A.; Appel, R.D.; Humphery-Smith, I.; Hochstrasser, D.F.; Williams, K.L. Progress With Proteome Projects: Why All Proteins Expressed by a Genome Should Be Identified and How to Do It. Biotechnol. Genet. Eng. Rev. 1996, 13, 19–50. [Google Scholar] [CrossRef] [PubMed]
- Zhan, X.; Desiderio, D.M. A reference map of a human pituitary adenoma proteome. Proteomics. 2003, 3, 699–713. [Google Scholar] [CrossRef] [PubMed]
- Moreno, C.S.; Evans, C.O.; Zhan, X.; Okor, M.; Desiderio, D.M.; Oyesiku, N.M. Novel molecular signaling and classification of human clinically nonfunctional pituitary adenomas identified by gene expression profiling and proteomic analyses. Cancer Res. 2005, 65, 10214–10222. [Google Scholar] [CrossRef] [PubMed]
- Evans, C.O.; Moreno, C.S.; Zhan, X.; McCabe, M.T.; Vertino, P.M.; Desiderio, D.M.; Oyeiku, N.M. Molecular pathogenesis of human prolactinomas identified by gene expression profiling, RT-qPCR, and proteomic analyses. Pituitary 2008, 11, 231–245. [Google Scholar] [CrossRef] [PubMed]
- Liu, Z.; Liu, Y.; Fang, W.; Chen, W.; Li, C.; Xiao, Z. Establishment of differential expression profiles from invasive and non-invasive pituitary adenomas. Zhong Nan Da Xue Xue Bao Yi Xue Ban. 2009, 34, 569–575. [Google Scholar] [PubMed]
- Zhan, X.; Desiderio, D.M.; Wang, X.; Zhan, X.; Guo, T.; Li, M.; Peng, F.; Chen, X.; Yang, H.; Zhang, P.; et al. Identification of the proteomic variations of invasive relative to non-invasive non-functional pituitary adenomas. Electrophoresis 2014, 35, 2184–2194. [Google Scholar]
- Long, Y.; Lu, M.; Cheng, T.; Zhan, X.; Zhan, X. Multiomics-Based Signaling Pathway Network Alterations in Human Non-functional Pituitary Adenomas. Front Endocrinol (Lausanne) 2019, 10, 835. [Google Scholar] [CrossRef]
- Wang, Y.; Cheng, T.; Lu, M.; Mu, Y.; Li, B.; Li, X.; Zhan, X. TMT-based quantitative proteomics revealed follicle-stimulating hormone (FSH)-related molecular characterizations for potentially prognostic assessment and personalized treatment of FSH-positive non-functional pituitary adenomas. EPMA J. 2019, 10, 395–414. [Google Scholar] [CrossRef]
- Cheng, T.; Wang, Y.; Lu, M.; Zhan, X.; Zhou, T.; Li, B.; Zhan, X. Quantitative Analysis of Proteome in Non-functional Pituitary Adenomas: Clinical Relevance and Potential Benefits for the Patients. Front. Endocrinol. (Lausanne) 2019, 10, 854. [Google Scholar] [CrossRef]
- Qian, S.; Yang, Y.; Li, N.; Cheng, T.; Wang, X.; Liu, J.; Li, X.; Desiderio, D.M.; Zhan, X. Prolactin Variants in Human Pituitaries and Pituitary Adenomas Identified With Two-Dimensional Gel Electrophoresis and Mass Spectrometry. Front. Endocrinol. (Lausanne) 2018, 9, 468. [Google Scholar] [CrossRef] [PubMed]
- Feng, J.; Zhang, Q.; Zhou, Y.; Yu, S.; Hong, L.; Zhao, S.; Yang, J.; Wan, H.; Xu, G.; Zhang, Y.; et al. Integration of Proteomics and Metabolomics Revealed Metabolite-Protein Networks in ACTH-Secreting Pituitary Adenoma. Front. Endocrinol. (Lausanne) 2018, 9, 678. [Google Scholar] [CrossRef] [PubMed]
- Yu, S.Y.; Hong, L.C.; Feng, J.; Wu, Y.T.; Zhang, Y.Z. Integrative proteomics and transcriptomics identify novel invasive-related biomarkers of non-functioning pituitary adenomas. Tumour Biol. 2016, 37, 8923–8930. [Google Scholar] [CrossRef]
- Chen, Y.; Chuan, H.L.; Yu, S.Y.; Li, C.Z.; Wu, Z.B.; Li, G.L.; Zhang, Y.Z. A Novel Invasive-Related Biomarker in Three Subtypes of Nonfunctioning Pituitary Adenomas. World Neurosurg. 2017, 100, 514–521. [Google Scholar] [CrossRef]
- Liu, D.; Li, J.; Li, N.; Lu, M.; Wen, S.; Zhan, X. Integration of quantitative phosphoproteomics and transcriptomics revealed phosphorylation-mediated molecular events as useful tools for a potential patient stratification and personalized treatment of human nonfunctional pituitary adenomas. EPMA J. 2020, 11, 419–467. [Google Scholar] [CrossRef] [PubMed]
- Taniguchi-Ponciano, K.; Peña-Martínez, E.; Silva-Román, G.; Vela-Patiño, S.; Guzman-Ortiz, A.L.; Quezada, H.; Gomez-Apo, E.; Chavez-Macias, L.; Mercado-Medrez, S.; Vargas-Ortega, G.; et al. Proteomic and Transcriptomic Analysis Identify Spliceosome as a Significant Component of the Molecular Machinery in the Pituitary Tumors Derived from POU1F1- and NR5A1-Cell Lineages. Genes (Basel) 2020, 11, 1422. [Google Scholar] [CrossRef]
- Viacava, P.; Gasperi, M.; Acerbi, G.; Manetti, L.; Cecconi, E.; Bonadio, A.G.; Genovesi, M. Microvascular density and vascular endothelial growth factor expression in normal pituitary tissue and pituitary adenomas. J. Endocrinol. Invest. 2003, 26, 23–28. [Google Scholar] [CrossRef]
- Görg, A.; Obermaier, C.; Boguth, G.; Harder, A.; Scheibe, B.; Wildgruber, R.; Weiss, W. The current state of two-dimensional electrophoresis with immobilized pH gradients. Electrophoresis 2000, 21, 1037–1053. [Google Scholar] [CrossRef]
- Shevchenko, A.; Tomas, H.; Havlis, J.; Olsen, J.; Mann, M. In-gel digestion for mass spectrometric characterization of proteins and proteomes. Nat. Protoc. 2006, 1, 2856–2860. [Google Scholar] [CrossRef] [PubMed]
- Kim, J.S.; Lee, Y.S.; Jung, M.J.; Hong, Y.K. The Predictive Value of Pathologic Features in Pituitary Adenoma and Correlation with Pituitary Adenoma Recurrence. J. Pathol. Transl. Med. 2016, 50, 419–425. [Google Scholar] [CrossRef] [PubMed]
- Su, T.; Suzui, M.; Wang, L.; Lin, C.S.; Xing, W.Q.; Weinstein, I.B. Deletion of histidine triad nucleotide-binding protein 1/PKC-interacting protein in mice enhances cell growth and carcinogenesis. Proc. Natl. Acad. Sci. USA 2003, 100, 13–7824. [Google Scholar] [CrossRef]
- Li, H.; Zhang, Y.; Su, T.; Santella, R.M.; Weinstein, J.B. Hint1 is a haplo-insufficient tumor suppressor in mice. Oncogene 2006, 25, 713–721. [Google Scholar] [CrossRef]
- Martin, J.; St-Pierre, M.V.; Dufour, J.F. Hit proteins, mitochondria and cancer. Biochim. Biophys. Acta 2011, 1807, 626–632. [Google Scholar] [CrossRef] [PubMed]
- Jung, T.Y.; Jin, G.R.; Koo, Y.B.; Jang, M.M.; Kim, C.W.; Lee, S.Y.; Kim, H.; Lee, C.Y.; Lee, S.Y.; Ju, B.G.; et al. Deacetylation by SIRT1 promotes the tumor-suppressive activity of HINT1 by enhancing its binding capacity for β-catenin or MITF in colon cancer and melanoma cells. Exp. Mol. Med. 2020, 52, 1075–1089. [Google Scholar] [CrossRef]
- Weiske, J.; Huber, O. The histidine triad protein Hint1 interacts with Pontin and Reptin and inhibits TCF-beta-catenin-mediated transcription. J. Cell. Sci. 2005, 118, 3117–3129. [Google Scholar] [CrossRef]
- Li, J.; Dong, W.; Li, Z.; Wang, H.; Gao, H.; Zhang, Y. Impact of SLC20A1 on the Wnt/β-catenin signaling pathway in somatotroph adenomas. Mol. Med. Rep. 2019, 20, 3276–3284. [Google Scholar] [CrossRef] [PubMed]
- Wu, X.S.; Bao, T.H.; Ke, Y.; Sun, D.Y.; Shi, Z.T.; Tang, H.R.; Wang, L. Hint1 suppresses migration and invasion of hepatocellular carcinoma cells in vitro by modulating girdin activity. Tumour Biol. 2016, 37, 14711–14719. [Google Scholar] [CrossRef] [PubMed]
- Wang, J.; Zhang, Z.; Li, R.; Mao, F.; Sun, W.; Chen, J.; Zhang, H.; Bartsch, J.W.; Shu, K.; Lei, T. ADAM12 induces EMT and promotes cell migration, invasion and proliferation in pituitary adenomas via EGFR/ERK signaling pathway. Biomed. Pharmacother. 2018, 97, 1066–1077. [Google Scholar] [CrossRef] [PubMed]
- Wei, X.; Zhou, J.; Hong, L.; Xu, Z.; Zhao, H.; Wu, X.; Chen, J. Hint1 expression inhibits proliferation and promotes radiosensitivity of human SGC7901 gastric cancer cells. Oncol. Lett. 2018, 16, 2135–2142. [Google Scholar] [CrossRef]
- Ivanova, I.; Loughrana, G.; Sachsc, M.; Atkins, J. Initiation context modulates autoregulation of eukaryotic translation initiation factor 1 (eIF1). PNAS 2010, 107, 18056–18060. [Google Scholar] [CrossRef] [PubMed]
- Ali, M.U.; Ur Rahman, M.S.; Jia, Z.; Jiang, C. Eukaryotic translation initiation factors and cancer. Tumour Biol. 2017, 39, 1010428317709805. [Google Scholar] [CrossRef] [PubMed]
- Yunxia, M.; Yuan, C.; Iver, P. Expression and epigenetic regulation of Cystatin B in lung cancer and colorectal cancer. Pathol. Res. Pract. 2017, 213, 1568–1574. [Google Scholar] [CrossRef]
- Wencai, G.M.; Xingxing, W.; Qunbo, L.; Jinguo, Z.; Weimin, R.; Guoxiong, X. Transforming growth factor β/miR 143 3p/cystatin B axisis a therapeutic target in human ovarian cancer. Int. J. Oncolo. 2019, 55, 267–276. [Google Scholar] [CrossRef]
- Huang, Q.; Wei, J.; Wei, L.; Zhang, X.; Bai, F.; Wen, S.; Wei, Y.; Tan, S.; Lu, Z.; Lin, X. Role of RKIP in human hepatic stellate cell proliferation, invasion, and metastasis. J. Cell. Biochem. 2019, 120, 6168–6177. [Google Scholar] [CrossRef] [PubMed]
- Zhou, H.; Fang, Y.; Weinberger, P.; Ding, L.; Cowell, J.; Hudson, F.; Ren, M. Transgelin increases metastasic potencial of colorectal cancer cells in vivo and alters expression of genes involved in cell motility. BMC Cancer. 2016, 16, 1–11. [Google Scholar] [CrossRef] [PubMed]
- Sayar, N.; Karahan, G.; Konu, O.; Bozkurt, B. Transgelin gene is frequently downregulated by promoter DNA hypermethylation in breast cancer. Clin. Epigenetics. 2015, 7, 1–16. [Google Scholar] [CrossRef] [PubMed]
- Speransky, S.; Serafini, P.; Caroli, J.; Bicciato, S.; Lippman, M.E.; Bishopric, N.H. A novel RNA aptamer identifies plasma membrane ATP synthase beta subunit as an early marker and therapeutic target in aggressive cancer. Breast Cancer Res. Treat. 2019, 176, 271–289. [Google Scholar] [CrossRef]
- Lu, Z.; Song, Q.; Jiang, S.; Wang, W.; Zhang, G. Identification of ATP synthase beta subunit (ATPB) on the cell surface as a non-small cell lung cancer (NSCLC) associated antigen. BMC Cancer. 2009, 9, 1–8. [Google Scholar] [CrossRef] [PubMed]
- Moraes, L.A.; Ampomah, P.B.; Lim, L.H.K. Annexin A1 in inflammation and breast cancer: A new axis in the tumor microenvironment, Cell. Adh. Migr. 2018, 12, 417–423. [Google Scholar] [CrossRef] [PubMed]
- Wen, Y.; Zhou, B.; Lv, D.; Shu, F.; Song, X. Phosphoglycerate mutase 1 knockdown inhibits prostate cancer cell growth, migration, and invasion. Asian, J. Androl. 2018, 20, 178–183. [Google Scholar] [CrossRef]
- Zhong, Z.; Chen, X.; Qi, X. Adaptor protein LNK promotes anaplastic thyroid carcinoma cell growth via 14-3-3 ε/γ binding. Cancer Cell Int. 2020, 20, 1–12. [Google Scholar] [CrossRef]
- Leal, M.; Calcagno, D.; Demachki, S.; Assumpção, P.; Chammas, R.; Burbano, R.; Smith, M. Clinical implication of 14-3-3 epsilon expression in gastric cancer. World J. Gastroenterol. 2012, 18, 1531–1537. [Google Scholar] [CrossRef] [PubMed]
- Lam, C.; Yip, C.; Poon, T.; Cheng, C. Identification and characterization of tropomyosin 3 associated with granulin-ephithelin precursor in human hepatocelluar carcinoma. PLoS ONE. 2012, 7, e40324. [Google Scholar] [CrossRef]
- Klein, M.G.; Yao, Y.; Slosberg, E.D.; Lima, C.D.; Doki, Y.; Weinstein, I.B. Characterization of PKCI and comparative studies with FHIT, related members of the HIT protein family. Exp. Cell. Res. 1998, 244, 26–32. [Google Scholar] [CrossRef] [PubMed]
- Lima, C.D.; Klein, M.G.; Hendrickson, W.A. Structure-based analysis of catalysis and substrate definition in the HIT protein family. Science 1997, 10, 278–286. [Google Scholar] [CrossRef]
- Lima, C.D.; Klein, M.G.; Weinstein, I.B.; Hendrickson, W.A. Three-dimensional structure of human protein kinase C interacting protein 1, a member of the HIT family of proteins. Proc. Natl. Acad. Sci. USA 1996, 28, 93–5357. [Google Scholar] [CrossRef] [PubMed]
- Barnes, L.D.; Garrison, P.N.; Siprashvili, Z.; Guranowski, A.; Robinson, A.K.; Ingram, S.W.; Croce, C.M.; Ohta, M.; Huebner, K. Fhit, a putative tumor suppressor in humans, is a dinucleoside 5’,5”‘-P1,P3-triphosphate hydrolase. Biochemistry 1996, 35, 11529–11535. [Google Scholar] [CrossRef] [PubMed]
- Brenner, C.; Bieganowski, P.; Pace, H.C.; Huebner, K. The histidine triad superfamily of nucleotide-binding proteins. J. Cell. Physiol. 1999, 181, 179–187. [Google Scholar] [CrossRef]
- Genovese, G.; Ghosh, O.; Li, H.; Rettino, A.; Sioletic, S.; Cittadini, A.; Sgambato, A. The tumor suppressor HINT1 regulates MITF and β-catenin transcriptional activity in melanoma cells. Cell Cycle 2012, 11, 2206–2215. [Google Scholar] [CrossRef]
- Zhou, X.; Chou, T.F.; Aubol, B.E.; Park, C.J.; Wolfenden, R.; Adams, J.; Wagner, C.R. Kinetic mechanism of human histidine triad nucleotide binding protein 1. Biochemistry 2013, 21, 3588–3600. [Google Scholar] [CrossRef]
- Carmi-Levy, I.; Yannay-Cohen, N.; Kay, G.; Razin, E.; Nechushtan, H. Diadenosine tetraphosphate hydrolase is part of the transcriptional regulation network in immunologically activated mast cells. Mol. Cell. Biol. 2008, 28, 5777–5784. [Google Scholar] [CrossRef]
- Motzik, A.; Amir, E.; Erlich, T.; Wang, J.; Kim, B.G.; Han, J.M.; Kim, J.H.; Nechushtan, H.; Guo, M.; Razin, E.; et al. Post-translational modification of HINT1 mediates activation of MITF transcriptional activity in human melanoma cells. Oncogene 2017, 36, 4732–4738. [Google Scholar] [CrossRef] [PubMed]
- Lei, C.; Jing, G.; Jichao, W.; Xiaohui, L.; Fang, Q.; Hua, G.; Yazhou, M.; Zhang, Y. MiR-137’s tumor suppression on prolactinomas by targeting mitf and modulating Wnt signaling pathway. J. Clin. Endocrinol. Metab. 2019, 104, 6391–6402. [Google Scholar] [CrossRef]
- Gruppetta, M.; Formosa, R.; Falzon, S.; Ariff Scicluna, S.; Falzon, E.; Degeatano, J.; Vassallo, J. Expression of cell cycle regulators and biomarkers of proliferation and regrowth in human pituitary adenomas. Pituitary 2017, 20, 358–371. [Google Scholar] [CrossRef]
- Wu, Y.; Bai, J.; Hong, L.; Liu, C.; Yu, S.; Yu, G.; Zhang, Y. Low expression of secreted frizzled-related protein 2 and nuclear accumulation of β-catenin in aggressive nonfunctioning pituitary adenoma. Oncol. Lett. 2016, 12, 199–206. [Google Scholar] [CrossRef] [PubMed][Green Version]
- Lim, J.S.; Lee, M.K.; Choi, E.; Hong, N.; Il Jee, S.; Kim, S.H.; Lee, E.J. Hormonal aggressiveness according to the expression of cellular markers in corticotroph adenomas. Endocrine 2019, 64, 147–156. [Google Scholar] [CrossRef]
- Weiske, J.; Huber, O. The histidine triad protein Hint1 triggers apoptosis independent of its enzymatic activity. J. Biol. Chem. 2006, 281, 27356–27366. [Google Scholar] [CrossRef]
- Zuk, K.; Peczek, L.; Stec-Michalska, K.; Medrek, M.; Nawrot, B. Family history of gastric cancer correlates with decreased expression of HINT1 tumor suppressor gene in gastric mucosa of dyspeptic patients. Oncol. Lett. 2012, 3, 219–223. [Google Scholar] [CrossRef] [PubMed]
- Bao, T.; Ke, Y.; Wang, Y.; Wang, W.; Li, Y.; Wang, Y.; Kui, X.; Zhou, Q.; Zhou, H.; Zhang, C.; et al. Taraxasterol suppresses the growth of human liver cancer by upregulating Hint1 expression. J. Mol. Med. (Berl) 2018, 96, 661–672. [Google Scholar] [CrossRef]
- Cristina, C.; Luque, G.M.; Demarchi, G.; Lopez Vicchi, F.; Zubeldia-Brenner, L.; Perez Millan, M.I.; Perrone, S.; Ornstein, A.M.; Lacau-Mengido, I.M.; Berner, S.I.; et al. Angiogenesis in pituitary adenomas: Human studies and new mutant mouse models. Int. J. Endocrinol. 2014, 2014, 608497. [Google Scholar] [CrossRef] [PubMed]
- Burcea, I.; Poiana, C. Updates in aggressive pituitary tumors. Acta Endocrinol. (Buchar) 2020, 16, 267–273. [Google Scholar] [CrossRef]
- Corlan, A.S.; Cîmpean, A.M.; Melnic, E.; Raica, M.; Sarb, S. VEGF, VEGF165b and EG-VEGF expression is specifically related with hormone profile in pituitary adenomas. Eur. J. Histochem. 2019, 5, 63–3010. [Google Scholar] [CrossRef] [PubMed]
- Lloyd, R.V.; Scheithauer, B.W.; Kuroki, T.; Vidal, S.; Kovacs, K.; Stefaneanu, L. Vascular Endothelial Growth Factor (VEGF) expression in human pituitary adenomas and carcinomas. Endocr. Pathol. 1999, 10, 229–235. [Google Scholar] [CrossRef] [PubMed]
- Zemmoura, I.; Wierinckx, A.; Vasiljevic, A.; Jan, M.; Trouillas, J.; François, P. Aggressive and malignant prolactin pituitary tumors: Pathological diagnosis and patient management. Pituitary 2013, 16, 515–522. [Google Scholar] [CrossRef]
- Trouillas, J.; Delgrange, E.; Wierinckx, A.; Vasiljevic, A.; Jouanneau, E.; Burman, P.; Raverot, G. Clinical, Pathological, and Molecular Factors of Aggressiveness in Lactotroph Tumours. Neuroendocrinology 2019, 109, 70–76. [Google Scholar] [CrossRef]
- Sánchez-Ortiga, R.; Sánchez-Tejada, L.; Moreno-Perez, O.; Riesgo, P.; Niveiro, M.; Picó-Alfonso, A.M. Over-expression of vascular endothelial growth factor in pituitary adenomas is associated with extrasellar growth and recurrence. Pituitary 2013, 16, 370–377. [Google Scholar] [CrossRef] [PubMed]
- Niveiro, M.; Aranda, F.I.; Peiró, G.; Alenda, C.; Picó, A. Immunohistochemical analysis of tumor angiogenic factors in human pituitary adenomas. Hum. Pathol. 2005, 36, 1090–1095. [Google Scholar] [CrossRef]
- Jugenburg, M.; Kovacs, K.; Stefaneanu, L.; Scheithauer, B.W. Vasculature in nontumorous hypophyses, pituitary adenomas, and carcinomas: A quantitative morphologic study. Endocr. Pathol. Summer. 1995, 6, 115–124. [Google Scholar] [CrossRef] [PubMed]
- Turner, H.E.; Nagy, Z.; Gatter, K.C.; Esiri, M.M.; Harris, A.L.; Wass, J.A.H. Angiogenesis in pituitary adenomas—relationship to endocrine function, treatment and outcome. J. Endocrinol. 2000, 165, 475–481. [Google Scholar] [CrossRef] [PubMed]


Publisher’s Note: MDPI stays neutral with regard to jurisdictional claims in published maps and institutional affiliations. |
© 2021 by the authors. Licensee MDPI, Basel, Switzerland. This article is an open access article distributed under the terms and conditions of the Creative Commons Attribution (CC BY) license (http://creativecommons.org/licenses/by/4.0/).