
Quantitative Evaluation of CFTR Pre-mRNA Splicing Dependent on the (TG)mTn Poly-Variant Tract


 ,
, 
Abstract
1. Introduction
2. Materials and Methods
3. Results
4. Discussion
Supplementary Materials
Author Contributions
Funding
Institutional Review Board Statement
Informed Consent Statement
Data Availability Statement
Conflicts of Interest
References
- Lucarelli, M.; Porcaro, L.; Biffignandi, A.; Costantino, L.; Giannone, V.; Alberti, L.; Bruno, S.M.; Corbetta, C.; Torresani, E.; Colombo, C.; et al. A New Targeted CFTR Mutation Panel Based on Next-Generation Sequencing Technology. J. Mol. Diagn. 2017, 19, 788–800. [Google Scholar] [CrossRef] [PubMed]
- Ferraguti, G.; Pierandrei, S.; Bruno, S.M.; Ceci, F.; Strom, R.; Lucarelli, M. A template for mutational data analysis of the CFTR gene. Clin. Chem. Lab. Med. 2011, 49, 1447–1451. [Google Scholar] [CrossRef] [PubMed][Green Version]
- Ivanov, M.; Matsvay, A.; Glazova, O.; Krasovskiy, S.; Usacheva, M.; Amelina, E.; Chernyak, A.; Ivanov, M.; Musienko, S.; Prodanov, T.; et al. Targeted sequencing reveals complex, phenotype-correlated genotypes in cystic fibrosis. BMC Med Genom. 2018, 11, 13. [Google Scholar] [CrossRef]
- Bergougnoux, A.; D’Argenio, V.; Sollfrank, S.; Verneau, F.; Telese, A.; Postiglione, I.; Lackner, K.J.; Claustres, M.; Castaldo, G.; Rossmann, H.; et al. Multicenter validation study for the certification of a CFTR gene scanning method using next generation sequencing technology. Clin. Chem. Lab. Med. 2018, 56, 1046–1053. [Google Scholar] [CrossRef] [PubMed]
- Bergougnoux, A.; Lopez, M.; Girodon, E. The Role of Extended CFTR Gene Sequencing in Newborn Screening for Cystic Fibrosis. Int. J. Neonatal Screen. 2020, 6, 23. [Google Scholar] [CrossRef] [PubMed]
- Bergougnoux, A.; Taulan-Cadars, M.; Claustres, M.; Raynal, C. Current and future molecular approaches in the diagnosis of cystic fibrosis. Expert Rev. Respir. Med. 2018, 12, 415–426. [Google Scholar] [CrossRef]
- Straniero, L.; Soldà, G.; Costantino, L.; Seia, M.; Melotti, P.; Colombo, C.; Asselta, R.; Duga, S. Whole-gene CFTR sequencing combined with digital RT-PCR improves genetic diagnosis of cystic fibrosis. J. Hum. Genet. 2016, 61, 977–984. [Google Scholar] [CrossRef]
- Lucarelli, M.; Bruno, S.M.; Pierandrei, S.; Ferraguti, G.; Testino, G.; Truglio, G.; Strom, R.; Quattrucci, S. The Impact on Genetic Testing of Mutational Patterns of CFTR Gene in Different Clinical Macrocategories of Cystic Fibrosis. J. Mol. Diagn. 2016, 18, 554–565. [Google Scholar] [CrossRef][Green Version]
- Terlizzi, V.; Piccialli, G.; Salvatore, D.; Lucarelli, M.; Raia, V.; Angioni, A.; Carnovale, V.; Cirilli, N.; Casciaro, R.; Colombo, C.; et al. Genotype–phenotype correlation and functional studies in patients with cystic fibrosis bearing CFTR complex alleles. J. Med. Genet. 2017, 54, 224–235. [Google Scholar] [CrossRef]
- Tsui, L.-C.; Dorfman, R. The Cystic Fibrosis Gene: A Molecular Genetic Perspective. Cold Spring Harb. Perspect. Med. 2013, 3, a009472. [Google Scholar] [CrossRef]
- Cutting, G.R. Cystic fibrosis genetics: From molecular understanding to clinical application. Nat. Rev. Genet. 2015, 16, 45–56. [Google Scholar] [CrossRef] [PubMed]
- Terlizzi, V.; Lucarelli, M.; Salvatore, D.; Angioni, A.; Bisogno, A.; Braggion, C.; Buzzetti, R.; Carnovale, V.; Casciaro, R.; Castaldo, G.; et al. Clinical expression of cystic fibrosis in a large cohort of Italian siblings. BMC Pulm. Med. 2018, 18, 196. [Google Scholar] [CrossRef] [PubMed]
- Terlizzi, V.; Carnovale, V.; Piccialli, G.; Castellani, C.; Cirilli, N.; Colombo, C.; Corti, F.; Cresta, F.; D’Adda, A.; Lucarelli, M.; et al. Clinical expression of patients with the D1152H CFTR mutation. J. Cyst. Fibros. 2015, 14, 447–452. [Google Scholar] [CrossRef]
- Narzi, L.; Ferraguti, G.; Stamato, A.; Narzi, F.; Valentini, S.; Lelli, A.; Delaroche, I.; Lucarelli, M.; Strom, R.; Quattrucci, S. Does cystic fibrosis neonatal screening detect atypical CF forms? Extended genetic characterization and 4-year clinical follow-up. Clin. Genet. 2007, 72, 39–46. [Google Scholar] [CrossRef] [PubMed]
- Bareil, C.; Guittard, C.; Altieri, J.-P.; Templin, C.; Claustres, M.; Georges, M.D. Comprehensive and Rapid Genotyping of Mutations and Haplotypes in Congenital Bilateral Absence of the Vas Deferens and Other Cystic Fibrosis Transmembrane Conductance Regulator-Related Disorders. J. Mol. Diagn. 2007, 9, 582–588. [Google Scholar] [CrossRef] [PubMed]
- Bobadilla, J.L.; Macek, M.; Fine, J.P.; Farrell, P.M. Cystic fibrosis: A worldwide analysis ofCFTR mutations?correlation with incidence data and application to screening. Hum. Mutat. 2002, 19, 575–606. [Google Scholar] [CrossRef] [PubMed]
- Beauchamp, K.A.; Taber, K.A.J.; Grauman, P.V.; Spurka, L.; Lim-Harashima, J.; Svenson, A.; Goldberg, J.D.; Muzzey, D. Sequencing as a first-line methodology for cystic fibrosis carrier screening. Genet. Med. 2019, 21, 2569–2576. [Google Scholar] [CrossRef]
- Bonadia, L.C.; Marson, F.A.L.; Ribeiro, J.D.; Paschoal, I.A.; Pereira, M.C.; Ribeiro, A.F.; Battagin, A.S. CFTR genotype and clinical outcomes of adult patients carried as cystic fibrosis disease. Gene 2014, 540, 183–190. [Google Scholar] [CrossRef]
- Bear, C.E. A Therapy for Most with Cystic Fibrosis. Cell 2020, 180, 211. [Google Scholar] [CrossRef]
- Amaral, M.D. Novel personalized therapies for cystic fibrosis: Treating the basic defect in all patients. J. Intern. Med. 2015, 277, 155–166. [Google Scholar] [CrossRef]
- Rossi, T.; Grandoni, F.; Mazzilli, F.; Quattrucci, S.; Antonelli, M.; Strom, R.; Lucarelli, M. High frequency of (TG)mTn variant tracts in the cystic fibrosis transmembrane conductance regulator gene in men with high semen viscosity. Fertil. Steril. 2004, 82, 1316–1322. [Google Scholar] [CrossRef] [PubMed]
- Lucarelli, M.; Bruno, S.M.; Pierandrei, S.; Ferraguti, G.; Stamato, A.; Narzi, F.; Amato, A.; Cimino, G.; Bertasi, S.; Quattrucci, S.; et al. A Genotypic-Oriented View of CFTR Genetics Highlights Specific Mutational Patterns Underlying Clinical Macrocategories of Cystic Fibrosis. Mol. Med. 2015, 21, 257–275. [Google Scholar] [CrossRef]
- Claustres, M. Molecular pathology of the CFTR locus in male infertility. Reprod. Biomed. Online 2005, 10, 14–41. [Google Scholar] [CrossRef]
- Stuhrmann, M.; Dörk, T. CFTR gene mutations and male infertility. Andrologia 2000, 32, 71–83. [Google Scholar] [CrossRef] [PubMed]
- Pierandrei, S.; Blacona, G.; Fabrizzi, B.; Cimino, G.; Cirilli, N.; Caporelli, N.; Angeloni, A.; Cipolli, M.; Lucarelli, M. Two novel and correlated CF-causing insertions in the (TG)mTn tract of the CFTR gene. PLoS ONE 2019, 14, e0222838. [Google Scholar] [CrossRef]
- Giordano, S.; Amato, F.; Elce, A.; Monti, M.; Iannone, C.; Pucci, P.; Seia, M.; Angioni, A.; Zarrilli, F.; Castaldo, G.; et al. Molecular and Functional Analysis of the Large 5′ Promoter Region of CFTR Gene Revealed Pathogenic Mutations in CF and CFTR-Related Disorders. J. Mol. Diagn. 2013, 15, 331–340. [Google Scholar] [CrossRef]
- Tomaiuolo, A.C.; Alghisi, F.; Petrocchi, S.; Surace, C.; Roberti, M.C.; Bella, S.; Lucidi, V.; Angioni, A. Clinical hallmarks and genetic polymorphisms in the CFTR gene contribute to the disclosure of the A1006E mutation. Clin. Investig. Med. 2010, 33, E234–E239. [Google Scholar] [CrossRef]
- Pagin, A.; Devos, A.; Figeac, M.; Truant, M.; Willoquaux, C.; Broly, F.; Lalau, G. Applicability and Efficiency of NGS in Routine Diagnosis: In-Depth Performance Analysis of a Complete Workflow for CFTR Mutation Analysis. PLoS ONE 2016, 11, e0149426. [Google Scholar] [CrossRef]
- Kiesewetter, S.; Macek, M.; Davis, C.; Curristin, S.M.; Chu, C.-S.; Graham, C.; Shrimpton, A.E.; Cashman, S.M.; Tsui, L.-C.; Mickle, J.; et al. A mutation in CFTR produces different phenotypes depending on chromosomal background. Nat. Genet. 1993, 5, 274–278. [Google Scholar] [CrossRef]
- Massie, R.; Poplawski, N.; Wilcken, B.; Goldblatt, J.; Byrnes, C.; Robertson, C. Intron-8 polythymidine sequence in Australasian individuals with CF mutations R117H and R117C. Eur. Respir. J. 2001, 17, 1195–1200. [Google Scholar] [CrossRef]
- Feldmann, D.; Couderc, R.; Audrezet, M.-P.; Ferec, C.; Bienvenu, T.; Desgeorges, M.; Claustres, M.; Blayau, M.; Bozon, D.; Malinge, M.-C.; et al. CFTR genotypes in patients with normal or borderline sweat chloride levels. Hum. Mutat. 2003, 22, 340. [Google Scholar] [CrossRef] [PubMed]
- Cuppens, H.; Lin, W.; Jaspers, M.; Costes, B.; Teng, H.; Vankeerberghen, A.; Jorissen, M.; Droogmans, G.; Reynaert, I.; Goossens, M.; et al. Polyvariant mutant cystic fibrosis transmembrane conductance regulator genes. The polymorphic (Tg)m locus explains the partial penetrance of the T5 polymorphism as a disease mutation. J. Clin. Investig. 1998, 101, 487–496. [Google Scholar] [CrossRef] [PubMed]
- Niksic, M.; Romano, M.; Buratti, E.; Pagani, F.; Baralle, F.E. Functional Analysis of cis-Acting Elements Regulating the Alternative Splicing of Human CFTR Exon 9. Hum. Mol. Genet. 1999, 8, 2339–2349. [Google Scholar] [CrossRef] [PubMed]
- Lucarelli, M.; Grandoni, F.; Rossi, T.; Mazzilli, F.; Antonelli, M.; Strom, R. Simultaneous Cycle Sequencing Assessment of (TG)m and Tn Tract Length in CFTR Gene. Biotechniques 2002, 32, 540–547. [Google Scholar] [CrossRef]
- Lucarelli, M.; Narzi, L.; Piergentili, R.; Ferraguti, G.; Grandoni, F.; Quattrucci, S.; Strom, R. A 96-well formatted method for exon and exon/intron boundary full sequencing of the CFTR gene. Anal. Biochem. 2006, 353, 226–235. [Google Scholar] [CrossRef]
- Chillón, M.; Casals, T.; Mercier, B.; Bassas, L.; Lissens, W.; Silber, S.; Romey, M.-C.; Ruiz-Romero, J.; Verlingue, C.; Claustres, M.; et al. Mutations in the Cystic Fibrosis Gene in Patients with Congenital Absence of the Vas Deferens. N. Engl. J. Med. 1995, 332, 1475–1480. [Google Scholar] [CrossRef]
- Zhang, L.; Button, B.; Gabriel, S.E.; Burkett, S.; Yan, Y.; Skiadopoulos, M.H.; Dang, Y.L.; Vogel, L.N.; McKay, T.; Mengos, A.; et al. CFTR Delivery to 25% of Surface Epithelial Cells Restores Normal Rates of Mucus Transport to Human Cystic Fibrosis Airway Epithelium. PLoS Biol. 2009, 7, e1000155. [Google Scholar] [CrossRef]
- Buratti, E.; Brindisi, A.; Pagani, F.; Fe, B. Nuclear Factor TDP-43 Binds to the Polymorphic TG Repeats in CFTR Intron 8 and Causes Skipping of Exon 9: A Functional Link with Disease Penetrance. Am. J. Hum. Genet. 2004, 74, 1322–1325. [Google Scholar] [CrossRef]
- Pagani, F.; Buratti, E.; Stuani, C.; Romano, M.; Zuccato, E.; Niksic, M.; Giglio, L.; Faraguna, D.; Baralle, F.E. Splicing Factors Induce Cystic Fibrosis Transmembrane Regulator Exon 9 Skipping through a Nonevolutionary Conserved Intronic Element. J. Biol. Chem. 2000, 275, 21041–21047. [Google Scholar] [CrossRef]
- Pagani, F.; Baralle, F.E. Genomic variants in exons and introns: Identifying the splicing spoilers. Nat. Rev. Genet. 2004, 5, 389–396. [Google Scholar] [CrossRef]
- Amaral, M.D.; Clarke, L.A.; Ramalho, A.; Beck, S.; Broackes-Carter, F.; Rowntree, R.; Mouchel, N.; Williams, S.H.; Harris, A.; Tzetis, M.; et al. Quantitative methods for the analysis of CFTR transcripts/splicing variants. J. Cyst. Fibros. 2004, 3 (Suppl. 2), 17–23. [Google Scholar] [CrossRef] [PubMed]
- Andrieux, J.; Audrézet, M.P.; Frachon, I.; Leroyer, C.; Roge, C.; Scotet, V.; Férec, C. Quantification of CFTR splice variants in adults with disseminated bronchiectasis, using the TaqMan fluorogenic detection system. Clin. Genet. 2002, 62, 60–67. [Google Scholar] [CrossRef] [PubMed]


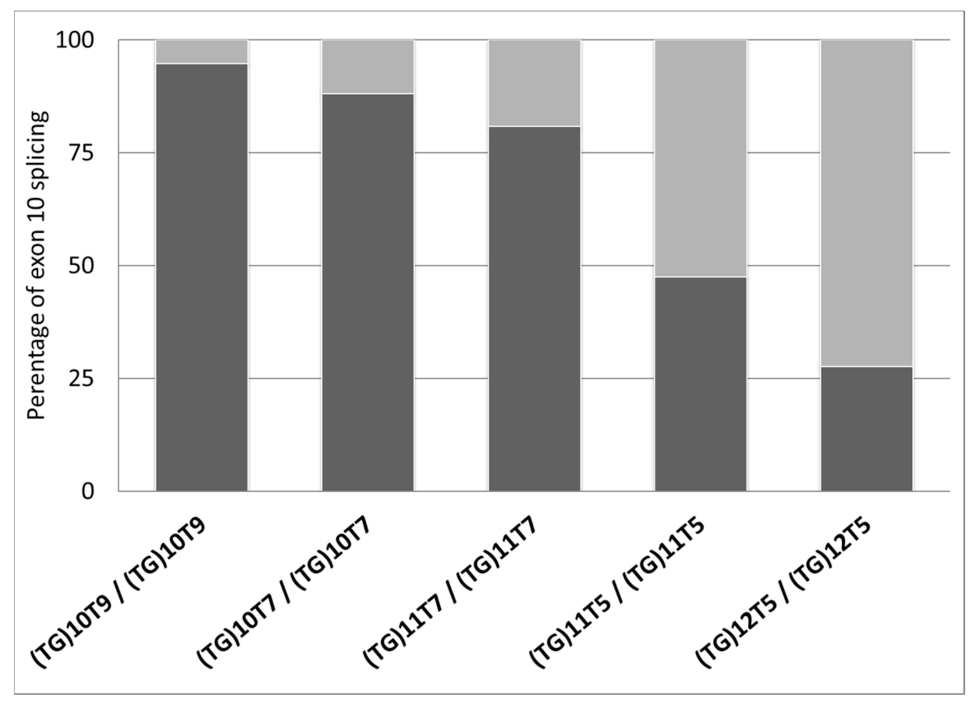
| ID | Diagnosis | Genotype (Legacy Name) | (TG)mTn (Legacy Name) | Exon 10 Splicing Percentages | |||
|---|---|---|---|---|---|---|---|
| Individual Percentages | Average Percentages ± ds | ||||||
| Exon 10+ | Exon 10− | Exon 10+ | Exon 10− | ||||
| 1 | CF-PS | F508del/1585-9412A>G * | (TG)10T9/(TG)10T9 | 97.8 | 2.2 | 94.7 ± 2.7 | 5.3 ± 2.7 |
| 2 | CF-PI | F508del/F508del | (TG)10T9/(TG)10T9 | 93.5 | 6.5 | ||
| 3 | CF-PI | [F508del;I1027T]/F508del | (TG)10T9/(TG)10T9 | 92.9 | 7.1 | ||
| 4 | Uncertain | G576A/G576A | (TG)10T7/(TG)10T7 | 91.3 | 7.7 | 88.0 ± 4.6 | 12.0 ± 4.6 |
| 5 | Healthy (carrier) | CFTRdup19/+ | (TG)10T7/(TG)10T7 | 84.7 | 15.3 | ||
| 6 | CF-PI | R553X/CFTRdele2 | (TG)11T7/(TG)11T7 | 83.1 | 16.9 | 80.9 ± 2.2 | 19.1 ± 2.2 |
| 7 | CFTR-RD | unknown/unknown | (TG)11T7/(TG)11T7 | 81.4 | 18.6 | ||
| 8 | Healthy (carrier) | R553X/+ | (TG)11T7/(TG)11T7 | 79.6 | 20.4 | ||
| 9 | Healthy (carrier) | G85E/+ | (TG)11T7/(TG)11T7 | 77.7 | 22.3 | ||
| 10 | Healthy (carrier) | G85E/+ | (TG)11T7/(TG)11T7 | 82.4 | 17.6 | ||
| 11 | Healthy (gen pop) | +/+ | (TG)11T5/(TG)11T5 | 47.5 | 52.5 | 47.5 ± 0.0 | 52.5 ± 0.0 |
| 12 | CFTR-RD | 359insT/+ | (TG)12T5/(TG)12T5 | 36.2 | 63.8 | 27.6 ± 12.1 | 72.4 ± 12.1 |
| 13 | CFTR-RD | +/+ | (TG)12T5/(TG)12T5 | 19.1 | 80.9 | ||
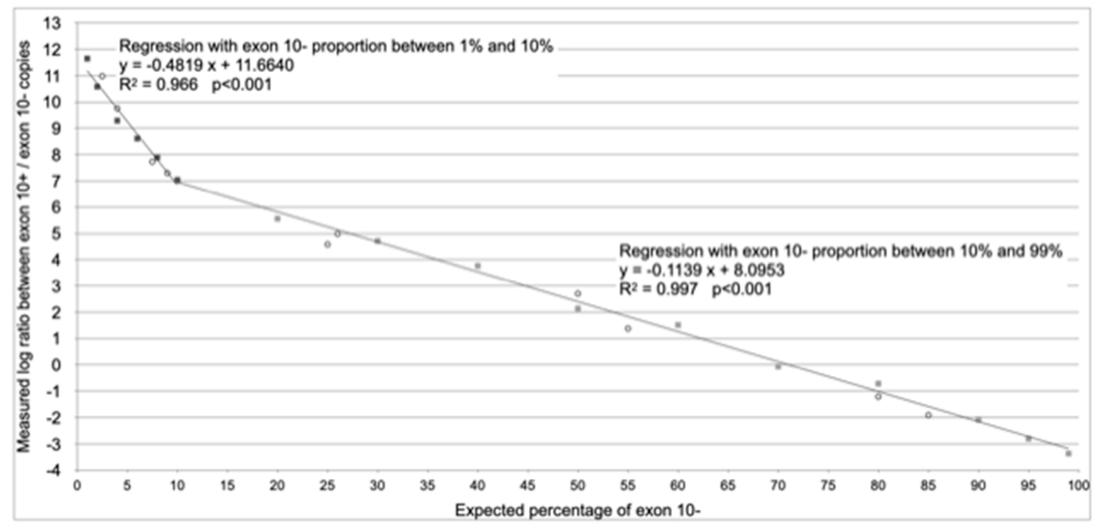
| Range of Applicability | From 1% to 10% of Splicing without Exon 10 (Exon 10− Assay) | From 10% to 99% of Splicing without Exon 10 (Exon 10− Assay) |
|---|---|---|
| Regression equation (according to Figure 2) | y = −0.4819 x + 11.6640 | y = −0.1139 x + 8.0953 |
| Reverse regression equation (x = % of splicing without exon 10) | x = (y − 11.6640)/−0.4819 | x = (y − 8.0953)/−0.1139 |
| Formula with generic efficiency | % splicing without exon 10 = | % splicing without exon 10 = |
| Formula with experimental values of effciencies | % splicing without exon 10 = | % splicing without exon 10 = |
Publisher’s Note: MDPI stays neutral with regard to jurisdictional claims in published maps and institutional affiliations. |
© 2021 by the authors. Licensee MDPI, Basel, Switzerland. This article is an open access article distributed under the terms and conditions of the Creative Commons Attribution (CC BY) license (http://creativecommons.org/licenses/by/4.0/).
Share and Cite
Sterrantino, M.; Fuso, A.; Pierandrei, S.; Bruno, S.M.; Testino, G.; Cimino, G.; Angeloni, A.; Lucarelli, M. Quantitative Evaluation of CFTR Pre-mRNA Splicing Dependent on the (TG)mTn Poly-Variant Tract. Diagnostics 2021, 11, 168. https://doi.org/10.3390/diagnostics11020168
Sterrantino M, Fuso A, Pierandrei S, Bruno SM, Testino G, Cimino G, Angeloni A, Lucarelli M. Quantitative Evaluation of CFTR Pre-mRNA Splicing Dependent on the (TG)mTn Poly-Variant Tract. Diagnostics. 2021; 11(2):168. https://doi.org/10.3390/diagnostics11020168
Chicago/Turabian StyleSterrantino, Manuela, Andrea Fuso, Silvia Pierandrei, Sabina Maria Bruno, Giancarlo Testino, Giuseppe Cimino, Antonio Angeloni, and Marco Lucarelli. 2021. "Quantitative Evaluation of CFTR Pre-mRNA Splicing Dependent on the (TG)mTn Poly-Variant Tract" Diagnostics 11, no. 2: 168. https://doi.org/10.3390/diagnostics11020168
APA StyleSterrantino, M., Fuso, A., Pierandrei, S., Bruno, S. M., Testino, G., Cimino, G., Angeloni, A., & Lucarelli, M. (2021). Quantitative Evaluation of CFTR Pre-mRNA Splicing Dependent on the (TG)mTn Poly-Variant Tract. Diagnostics, 11(2), 168. https://doi.org/10.3390/diagnostics11020168