
Development of a Machine Learning Model to Distinguish between Ulcerative Colitis and Crohn’s Disease Using RNA Sequencing Data

 , , , , ,
Abstract
:1. Introduction
2. Materials and Methods
2.1. Study Population
2.2. Sample Collection
2.3. RNA Extraction, Library Construction, and Sequencing
2.4. RNA Sequencing Data Analysis
2.5. Machine Learning for Prediction Model Development
3. Results
3.1. Unsupervised Learning via PCA
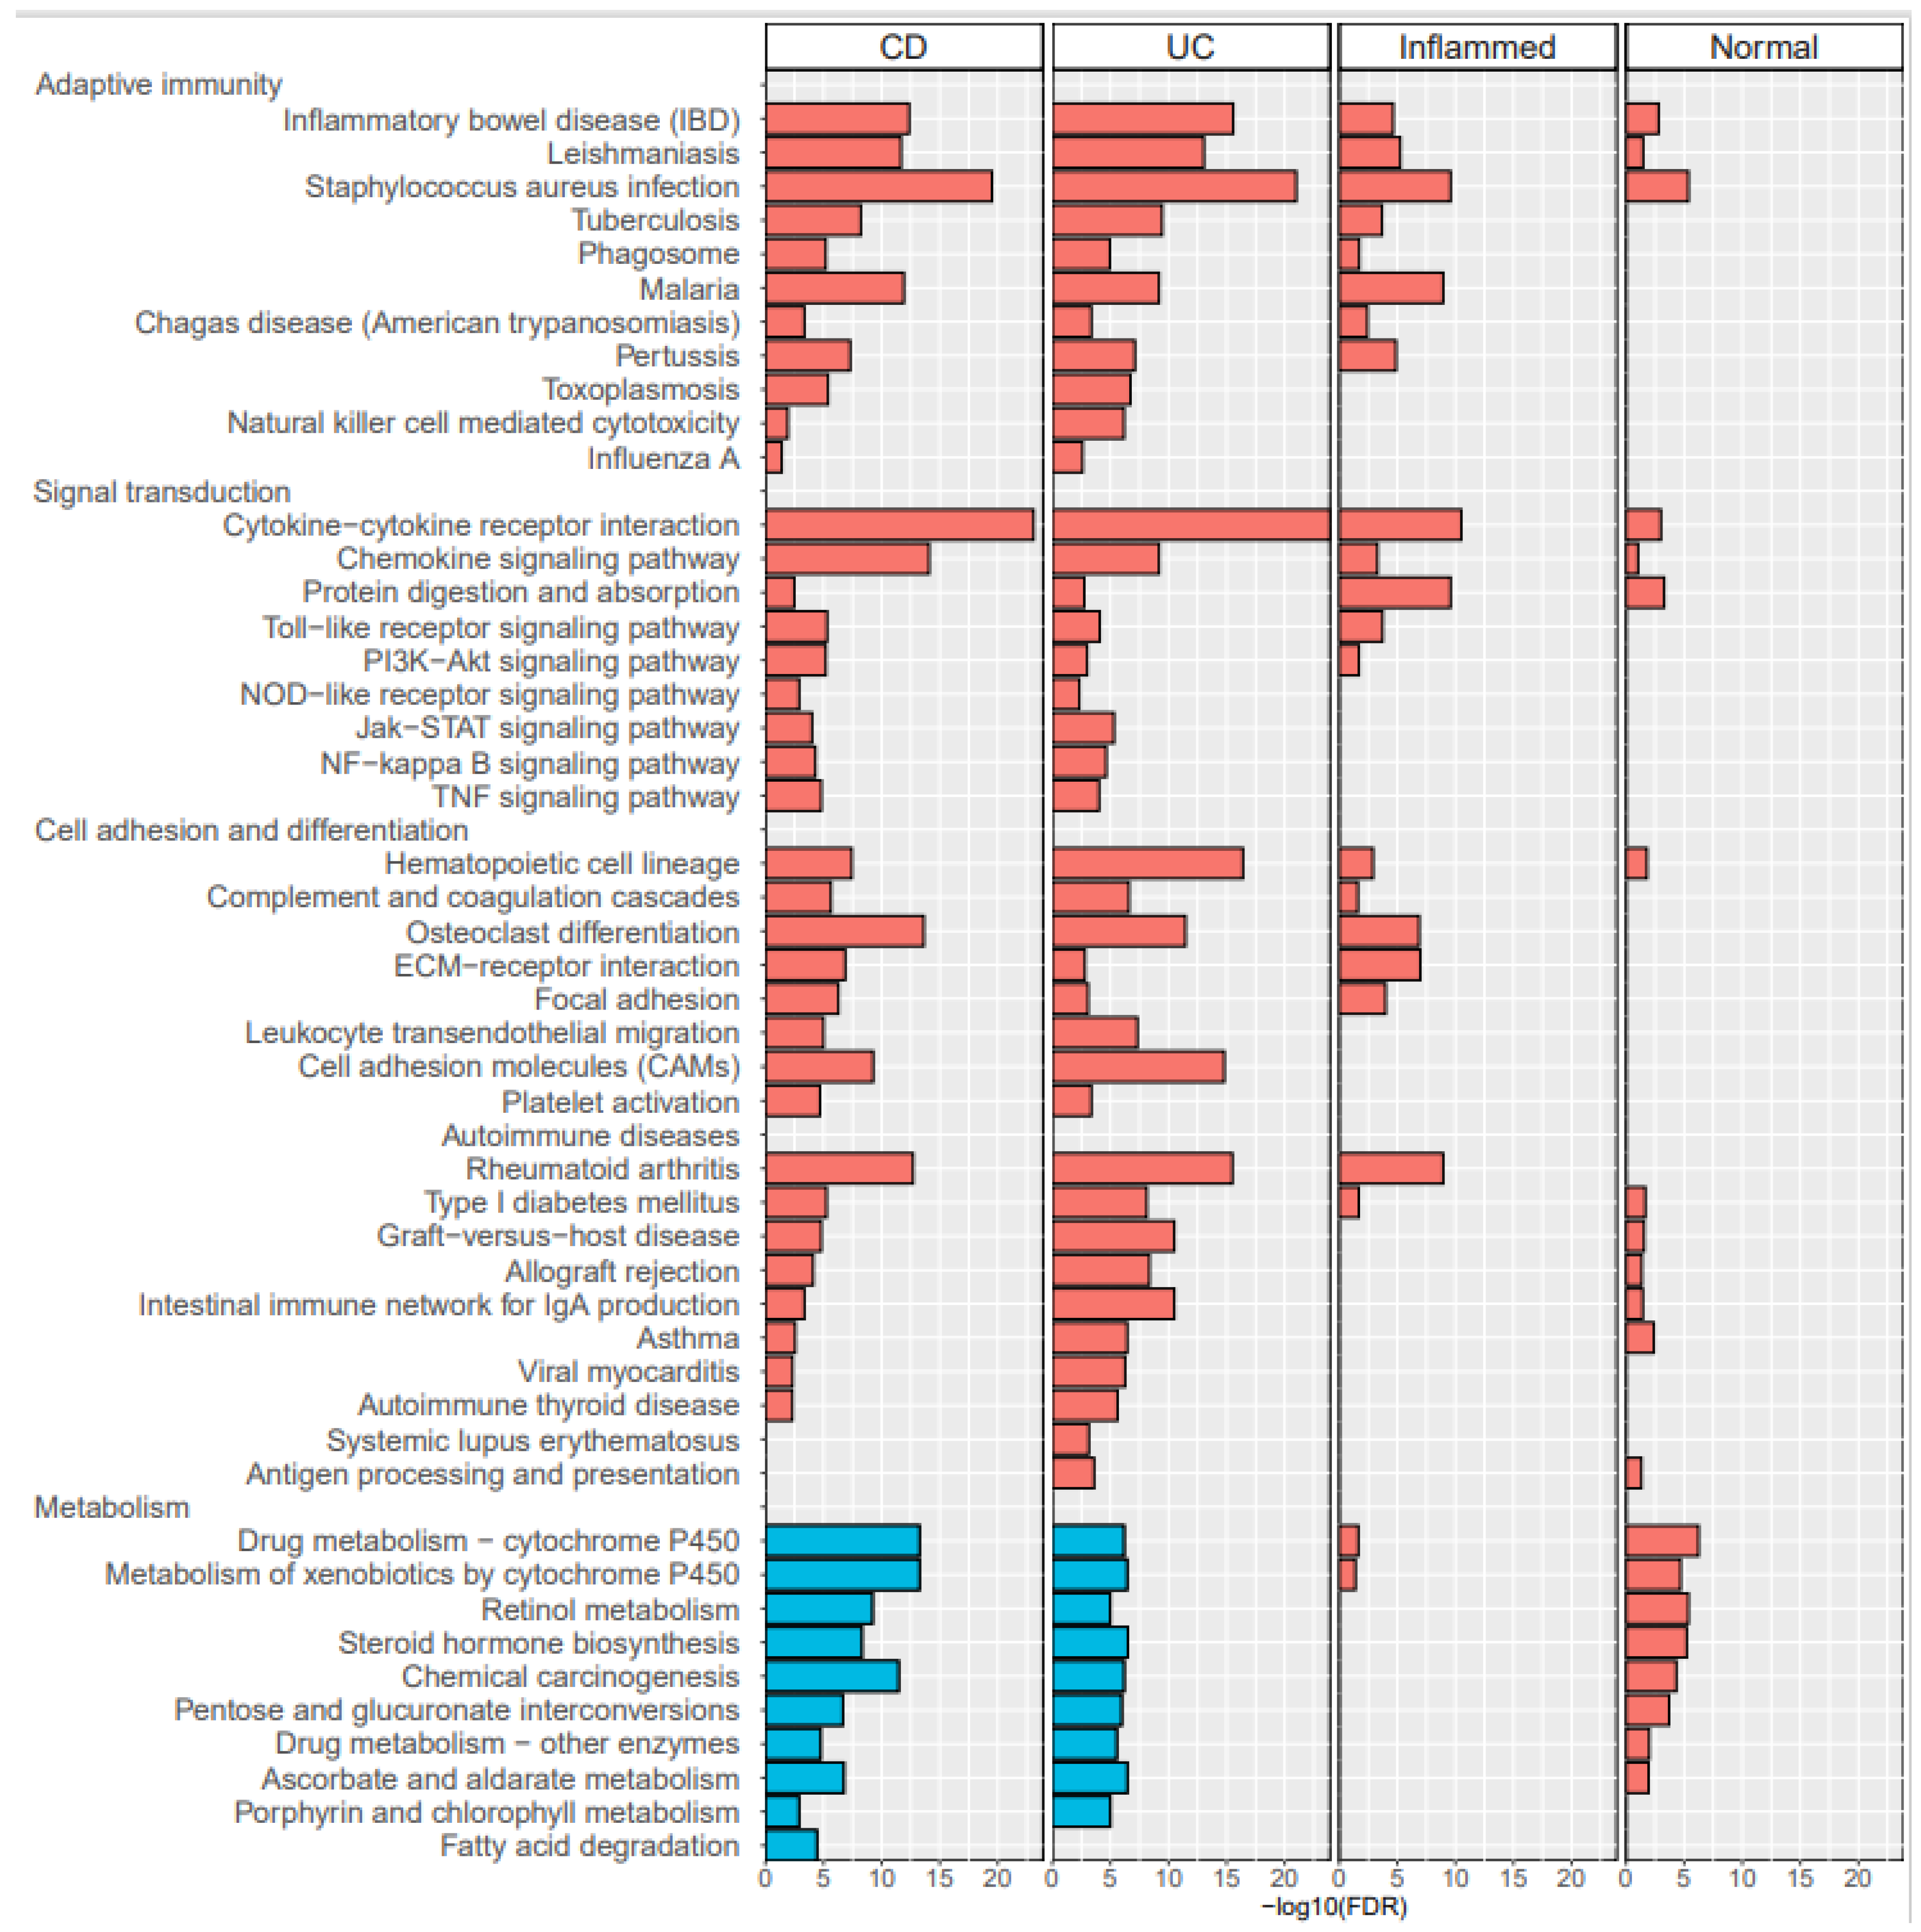
3.2. Supervised Learning of Differentially Expressed Genes (DEGs) and Pathway Analyses
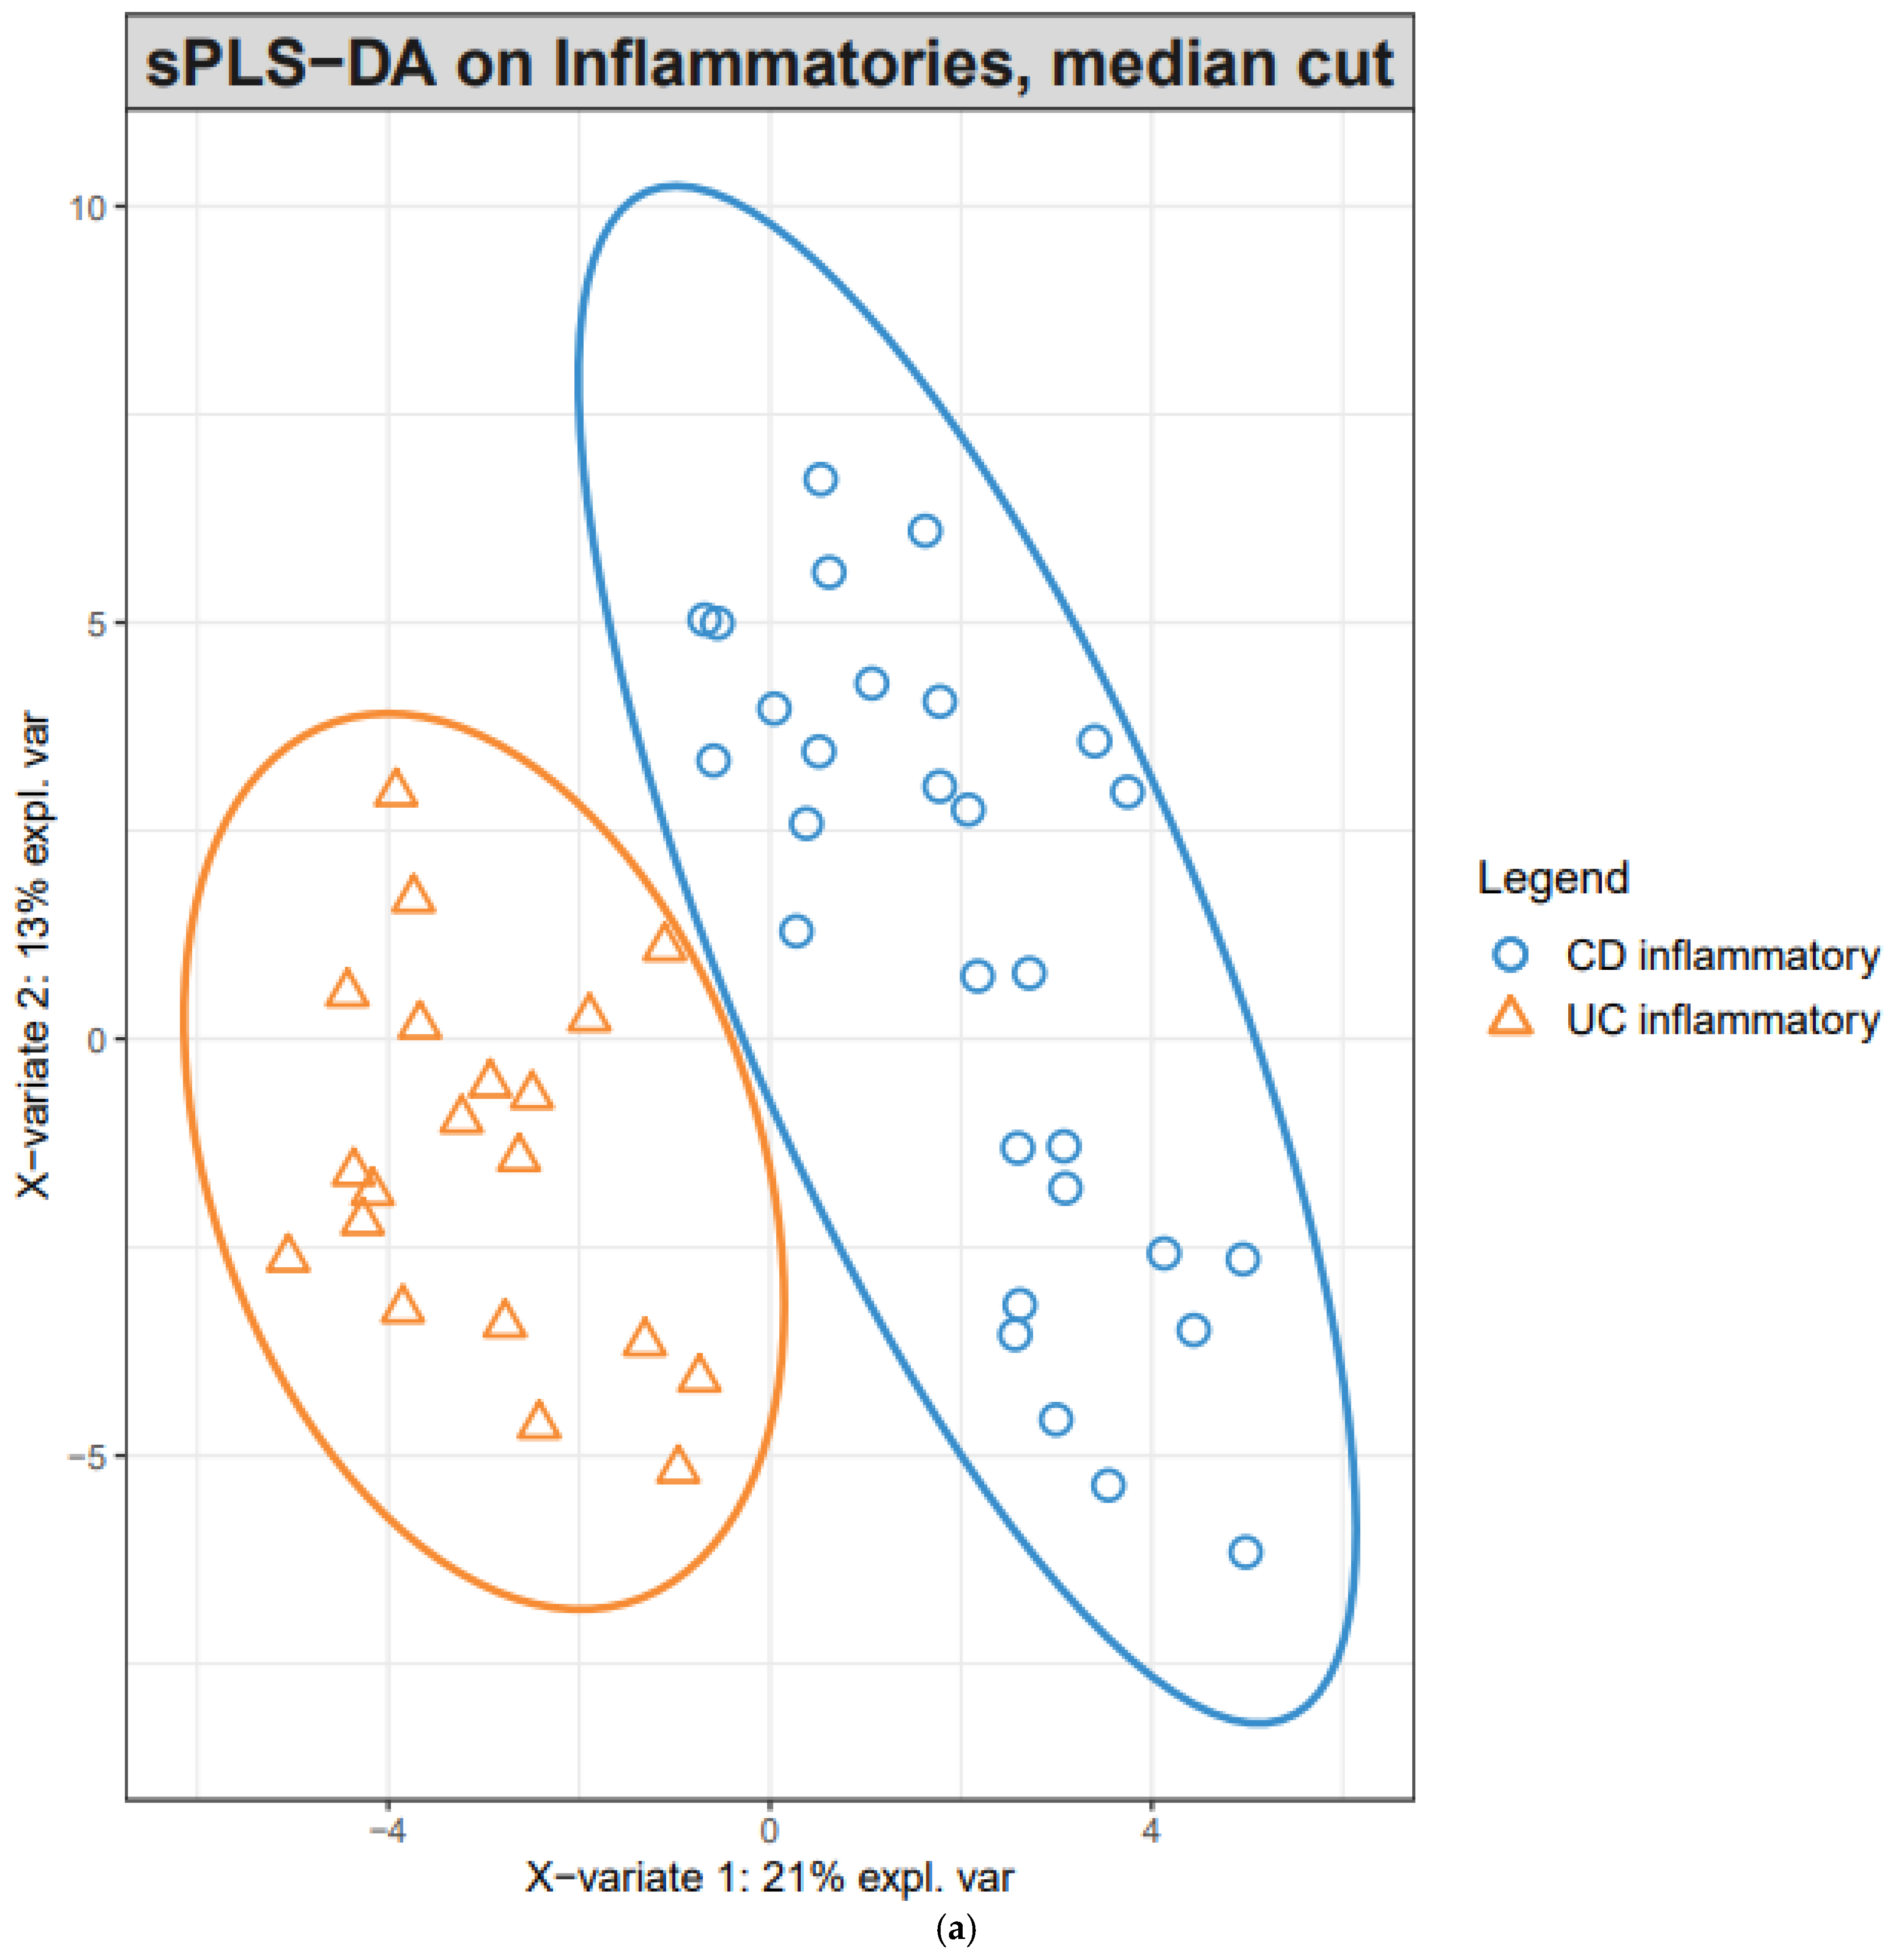
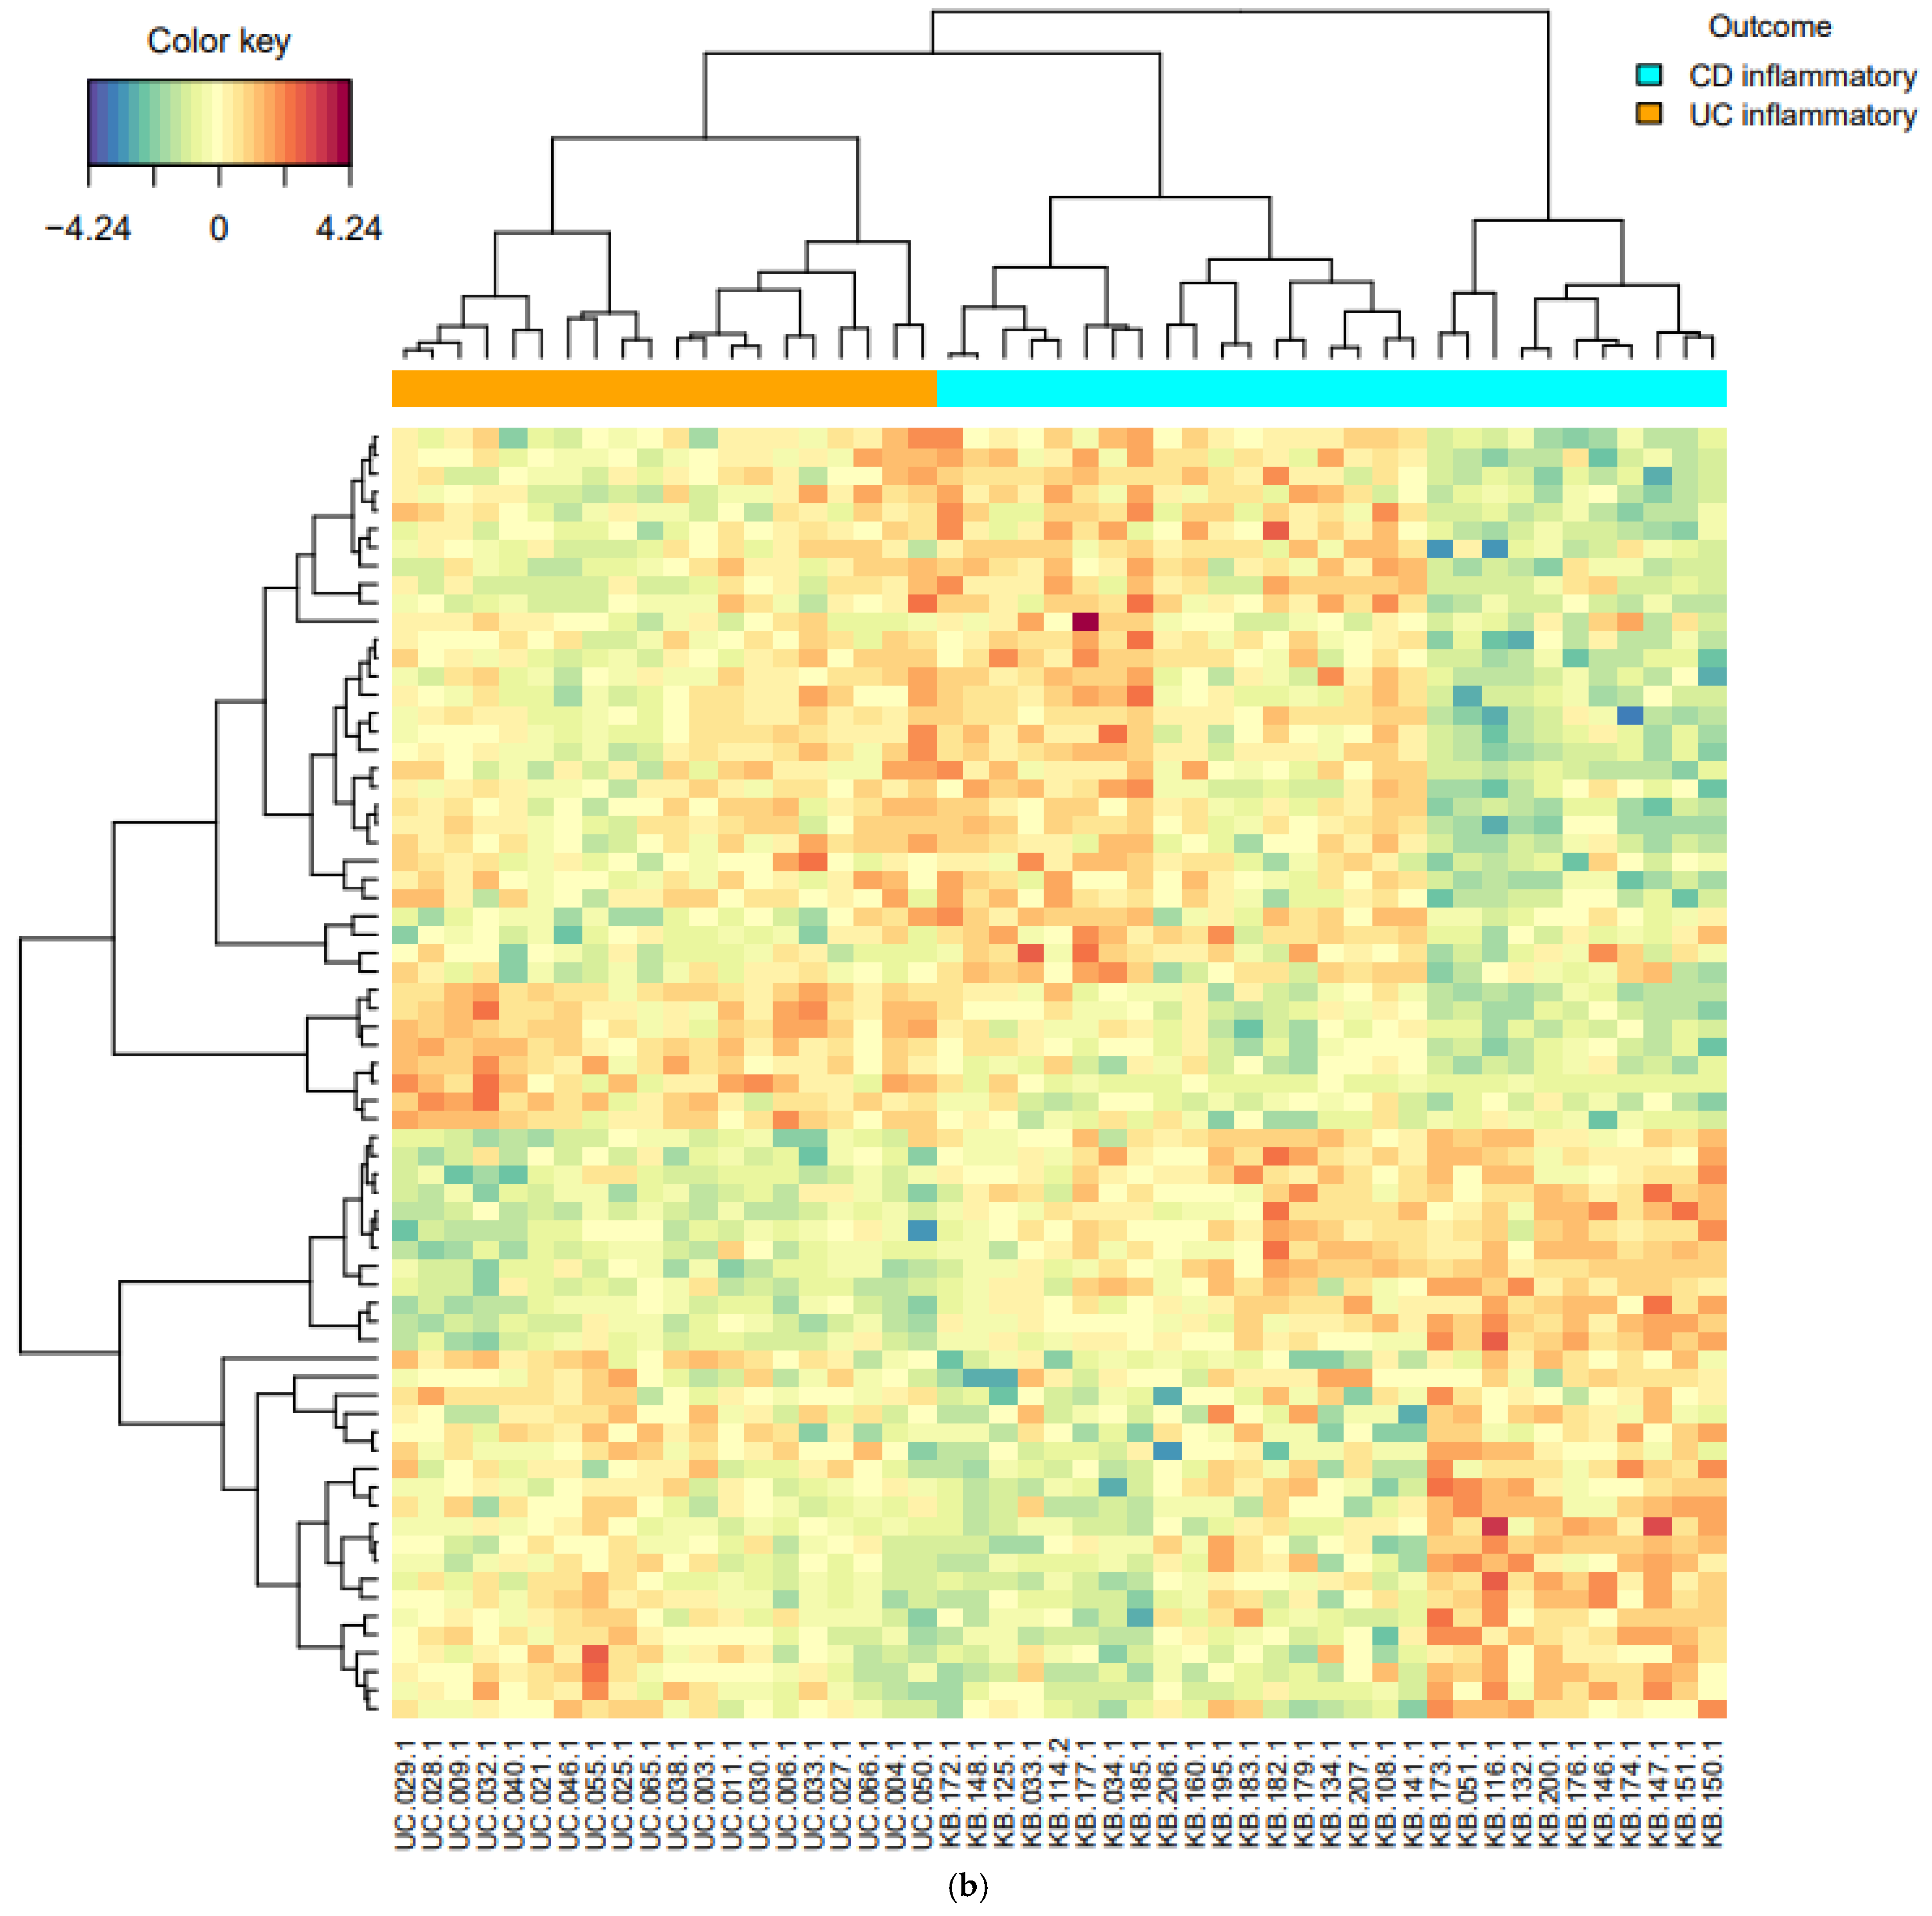
3.3. Classification Models Based on PLS-DA and sPLS-DA
4. Discussion
5. Conclusions
Supplementary Materials
Author Contributions
Funding
Institutional Review Board Statement
Informed Consent Statement
Data Availability Statement
Acknowledgments
Conflicts of Interest
References
- Cho, J.H.; Gregersen, P.K. Genomics and the multifactorial nature of human autoimmune disease. N. Engl. J. Med. 2011, 365, 1612–1623. [Google Scholar] [CrossRef] [PubMed] [Green Version]
- Jostins, L.; Ripke, S.; Weersma, R.K.; Duerr, R.H.; McGovern, D.P.; Hui, K.Y.; Lee, J.C.; Schumm, L.P.; Sharma, Y.; Anderson, C.A.; et al. Host-microbe interactions have shaped the genetic architecture of inflammatory bowel disease. Nature 2012, 491, 119–124. [Google Scholar] [CrossRef] [Green Version]
- Liu, J.Z.; van Sommeren, S.; Huang, H.; Ng, S.C.; Alberts, R.; Takahashi, A.; Ripke, S.; Lee, J.C.; Jostins, L.; Shah, T.; et al. Association analyses identify 38 susceptibility loci for inflammatory bowel disease and highlight shared genetic risk across populations. Nat. Genet. 2015, 47, 979–986. [Google Scholar] [CrossRef] [PubMed]
- Franke, A.; McGovern, D.P.; Barrett, J.C.; Wang, K.; Radford-Smith, G.L.; Ahmad, T.; Lees, C.W.; Balschun, T.; Lee, J.; Roberts, R.; et al. Genome-wide meta-analysis increases to 71 the number of confirmed Crohn’s disease susceptibility loci. Nat. Genet. 2010, 42, 1118–1125. [Google Scholar] [CrossRef] [PubMed] [Green Version]
- Ordás, I.; Eckmann, L.; Talamini, M.; Baumgart, D.C.; Sandborn, W.J. Ulcerative colitis. Lancet 2012, 380, 1606–1619. [Google Scholar] [CrossRef] [Green Version]
- Fukuda, T.; Naganuma, M.; Kanai, T. Current new challenges in the management of ulcerative colitis. Intest. Res. 2019, 17, 36–44. [Google Scholar] [CrossRef] [Green Version]
- Ooi, C.J.; Hilmi, I.; Banerjee, R.; Chuah, S.W.; Ng, S.C.; Wei, S.C.; Makharia, G.K.; Pisespongsa, P.; Chen, M.H.; Ran, Z.H.; et al. Best practices on immunomodulators and biologic agents for ulcerative colitis and Crohn’s disease in Asia. Intest. Res. 2019, 17, 285–310. [Google Scholar] [CrossRef]
- Ozsolak, F.; Milos, P.M. RNA sequencing: Advances, challenges and opportunities. Nat. Rev. Genet. 2011, 12, 87–98. [Google Scholar] [CrossRef] [PubMed]
- Seyed Tabib, N.S.; Madgwick, M.; Sudhakar, P.; Verstockt, B.; Korcsmaros, T.; Vermeire, S. Big data in IBD: Big progress for clinical practice. Gut 2020, 69, 1520–1532. [Google Scholar] [CrossRef] [PubMed]
- Howell, K.J.; Kraiczy, J.; Nayak, K.M.; Gasparetto, M.; Ross, A.; Lee, C.; Mak, T.N.; Koo, B.K.; Kumar, N.; Lawley, T.; et al. DNA Methylation and Transcription Patterns in Intestinal Epithelial Cells From Pediatric Patients With Inflammatory Bowel Diseases Differentiate Disease Subtypes and Associate With Outcome. Gastroenterology 2018, 154, 585–598. [Google Scholar] [CrossRef] [Green Version]
- Kang, E.A.; Jang, J.; Choi, C.H.; Kang, S.B.; Bang, K.B.; Kim, T.O.; Seo, G.S.; Cha, J.M.; Chun, J.; Jung, Y.; et al. Development of a Clinical and Genetic Prediction Model for Early Intestinal Resection in Patients with Crohn’s Disease: Results from the IMPACT Study. J. Clin. Med. 2021, 10, 633. [Google Scholar] [CrossRef]
- Park, S.K.; Kim, H.N.; Choi, C.H.; Im, J.P.; Cha, J.M.; Eun, C.S.; Kim, T.O.; Kang, S.B.; Bang, K.B.; Kim, H.G.; et al. Differentially Abundant Bacterial Taxa Associated with Prognostic Variables of Crohn’s Disease: Results from the IMPACT Study. J. Clin. Med. 2020, 9, 1748. [Google Scholar] [CrossRef]
- Kim, D.; Paggi, J.M.; Park, C.; Bennett, C.; Salzberg, S.L. Graph-based genome alignment and genotyping with HISAT2 and HISAT-genotype. Nat. Biotechnol. 2019, 37, 907–915. [Google Scholar] [CrossRef] [PubMed]
- Liao, Y.; Smyth, G.K.; Shi, W. featureCounts: An efficient general purpose program for assigning sequence reads to genomic features. Bioinformatics 2014, 30, 923–930. [Google Scholar] [CrossRef] [PubMed] [Green Version]
- Robinson, M.D.; McCarthy, D.J.; Smyth, G.K. edgeR: A Bioconductor package for differential expression analysis of digital gene expression data. Bioinformatics 2010, 26, 139–140. [Google Scholar] [CrossRef] [PubMed] [Green Version]
- Rohart, F.; Gautier, B.; Singh, A.; KA, L.C. mixOmics: An R package for ‘omics feature selection and multiple data integration. PLoS Comput. Biol. 2017, 13, e1005752. [Google Scholar] [CrossRef] [PubMed] [Green Version]
- Jiao, X.; Sherman, B.T.; Huang da, W.; Stephens, R.; Baseler, M.W.; Lane, H.C.; Lempicki, R.A. DAVID-WS: A stateful web service to facilitate gene/protein list analysis. Bioinformatics 2012, 28, 1805–1806. [Google Scholar] [CrossRef] [PubMed] [Green Version]
- Noble, C.L.; Abbas, A.R.; Cornelius, J.; Lees, C.W.; Ho, G.T.; Toy, K.; Modrusan, Z.; Pal, N.; Zhong, F.; Chalasani, S.; et al. Regional variation in gene expression in the healthy colon is dysregulated in ulcerative colitis. Gut 2008, 57, 1398–1405. [Google Scholar] [CrossRef] [PubMed]
- Holgersen, K.; Kutlu, B.; Fox, B.; Serikawa, K.; Lord, J.; Hansen, A.K.; Holm, T.L. High-resolution gene expression profiling using RNA sequencing in patients with inflammatory bowel disease and in mouse models of colitis. J. Crohn’s.Colitis 2015, 9, 492–506. [Google Scholar] [CrossRef] [PubMed] [Green Version]

Publisher’s Note: MDPI stays neutral with regard to jurisdictional claims in published maps and institutional affiliations. |
© 2021 by the authors. Licensee MDPI, Basel, Switzerland. This article is an open access article distributed under the terms and conditions of the Creative Commons Attribution (CC BY) license (https://creativecommons.org/licenses/by/4.0/).
Share and Cite
Park, S.-K.; Kim, S.; Lee, G.-Y.; Kim, S.-Y.; Kim, W.; Lee, C.-W.; Park, J.-L.; Choi, C.-H.; Kang, S.-B.; Kim, T.-O.; et al. Development of a Machine Learning Model to Distinguish between Ulcerative Colitis and Crohn’s Disease Using RNA Sequencing Data. Diagnostics 2021, 11, 2365. https://doi.org/10.3390/diagnostics11122365
Park S-K, Kim S, Lee G-Y, Kim S-Y, Kim W, Lee C-W, Park J-L, Choi C-H, Kang S-B, Kim T-O, et al. Development of a Machine Learning Model to Distinguish between Ulcerative Colitis and Crohn’s Disease Using RNA Sequencing Data. Diagnostics. 2021; 11(12):2365. https://doi.org/10.3390/diagnostics11122365
Chicago/Turabian StylePark, Soo-Kyung, Sangsoo Kim, Gi-Young Lee, Sung-Yoon Kim, Wan Kim, Chil-Woo Lee, Jong-Lyul Park, Chang-Hwan Choi, Sang-Bum Kang, Tae-Oh Kim, and et al. 2021. "Development of a Machine Learning Model to Distinguish between Ulcerative Colitis and Crohn’s Disease Using RNA Sequencing Data" Diagnostics 11, no. 12: 2365. https://doi.org/10.3390/diagnostics11122365
APA StylePark, S.-K., Kim, S., Lee, G.-Y., Kim, S.-Y., Kim, W., Lee, C.-W., Park, J.-L., Choi, C.-H., Kang, S.-B., Kim, T.-O., Bang, K.-B., Chun, J., Cha, J.-M., Im, J.-P., Ahn, K.-S., Kim, S.-Y., & Park, D.-I. (2021). Development of a Machine Learning Model to Distinguish between Ulcerative Colitis and Crohn’s Disease Using RNA Sequencing Data. Diagnostics, 11(12), 2365. https://doi.org/10.3390/diagnostics11122365