
Impact of Epiretinal Membrane on Optical Coherence Tomography Tools Used for Monitoring Glaucoma

 , , and
Abstract
:1. Introduction
2. Materials and Methods
3. Results
3.1. Demographics and Ocular Characteristics
3.2. Measurements of Peripapillary Retinal Nerve Fiber Layer Thickness
3.3. Measurements of Ganglion Cell Layer Thickness
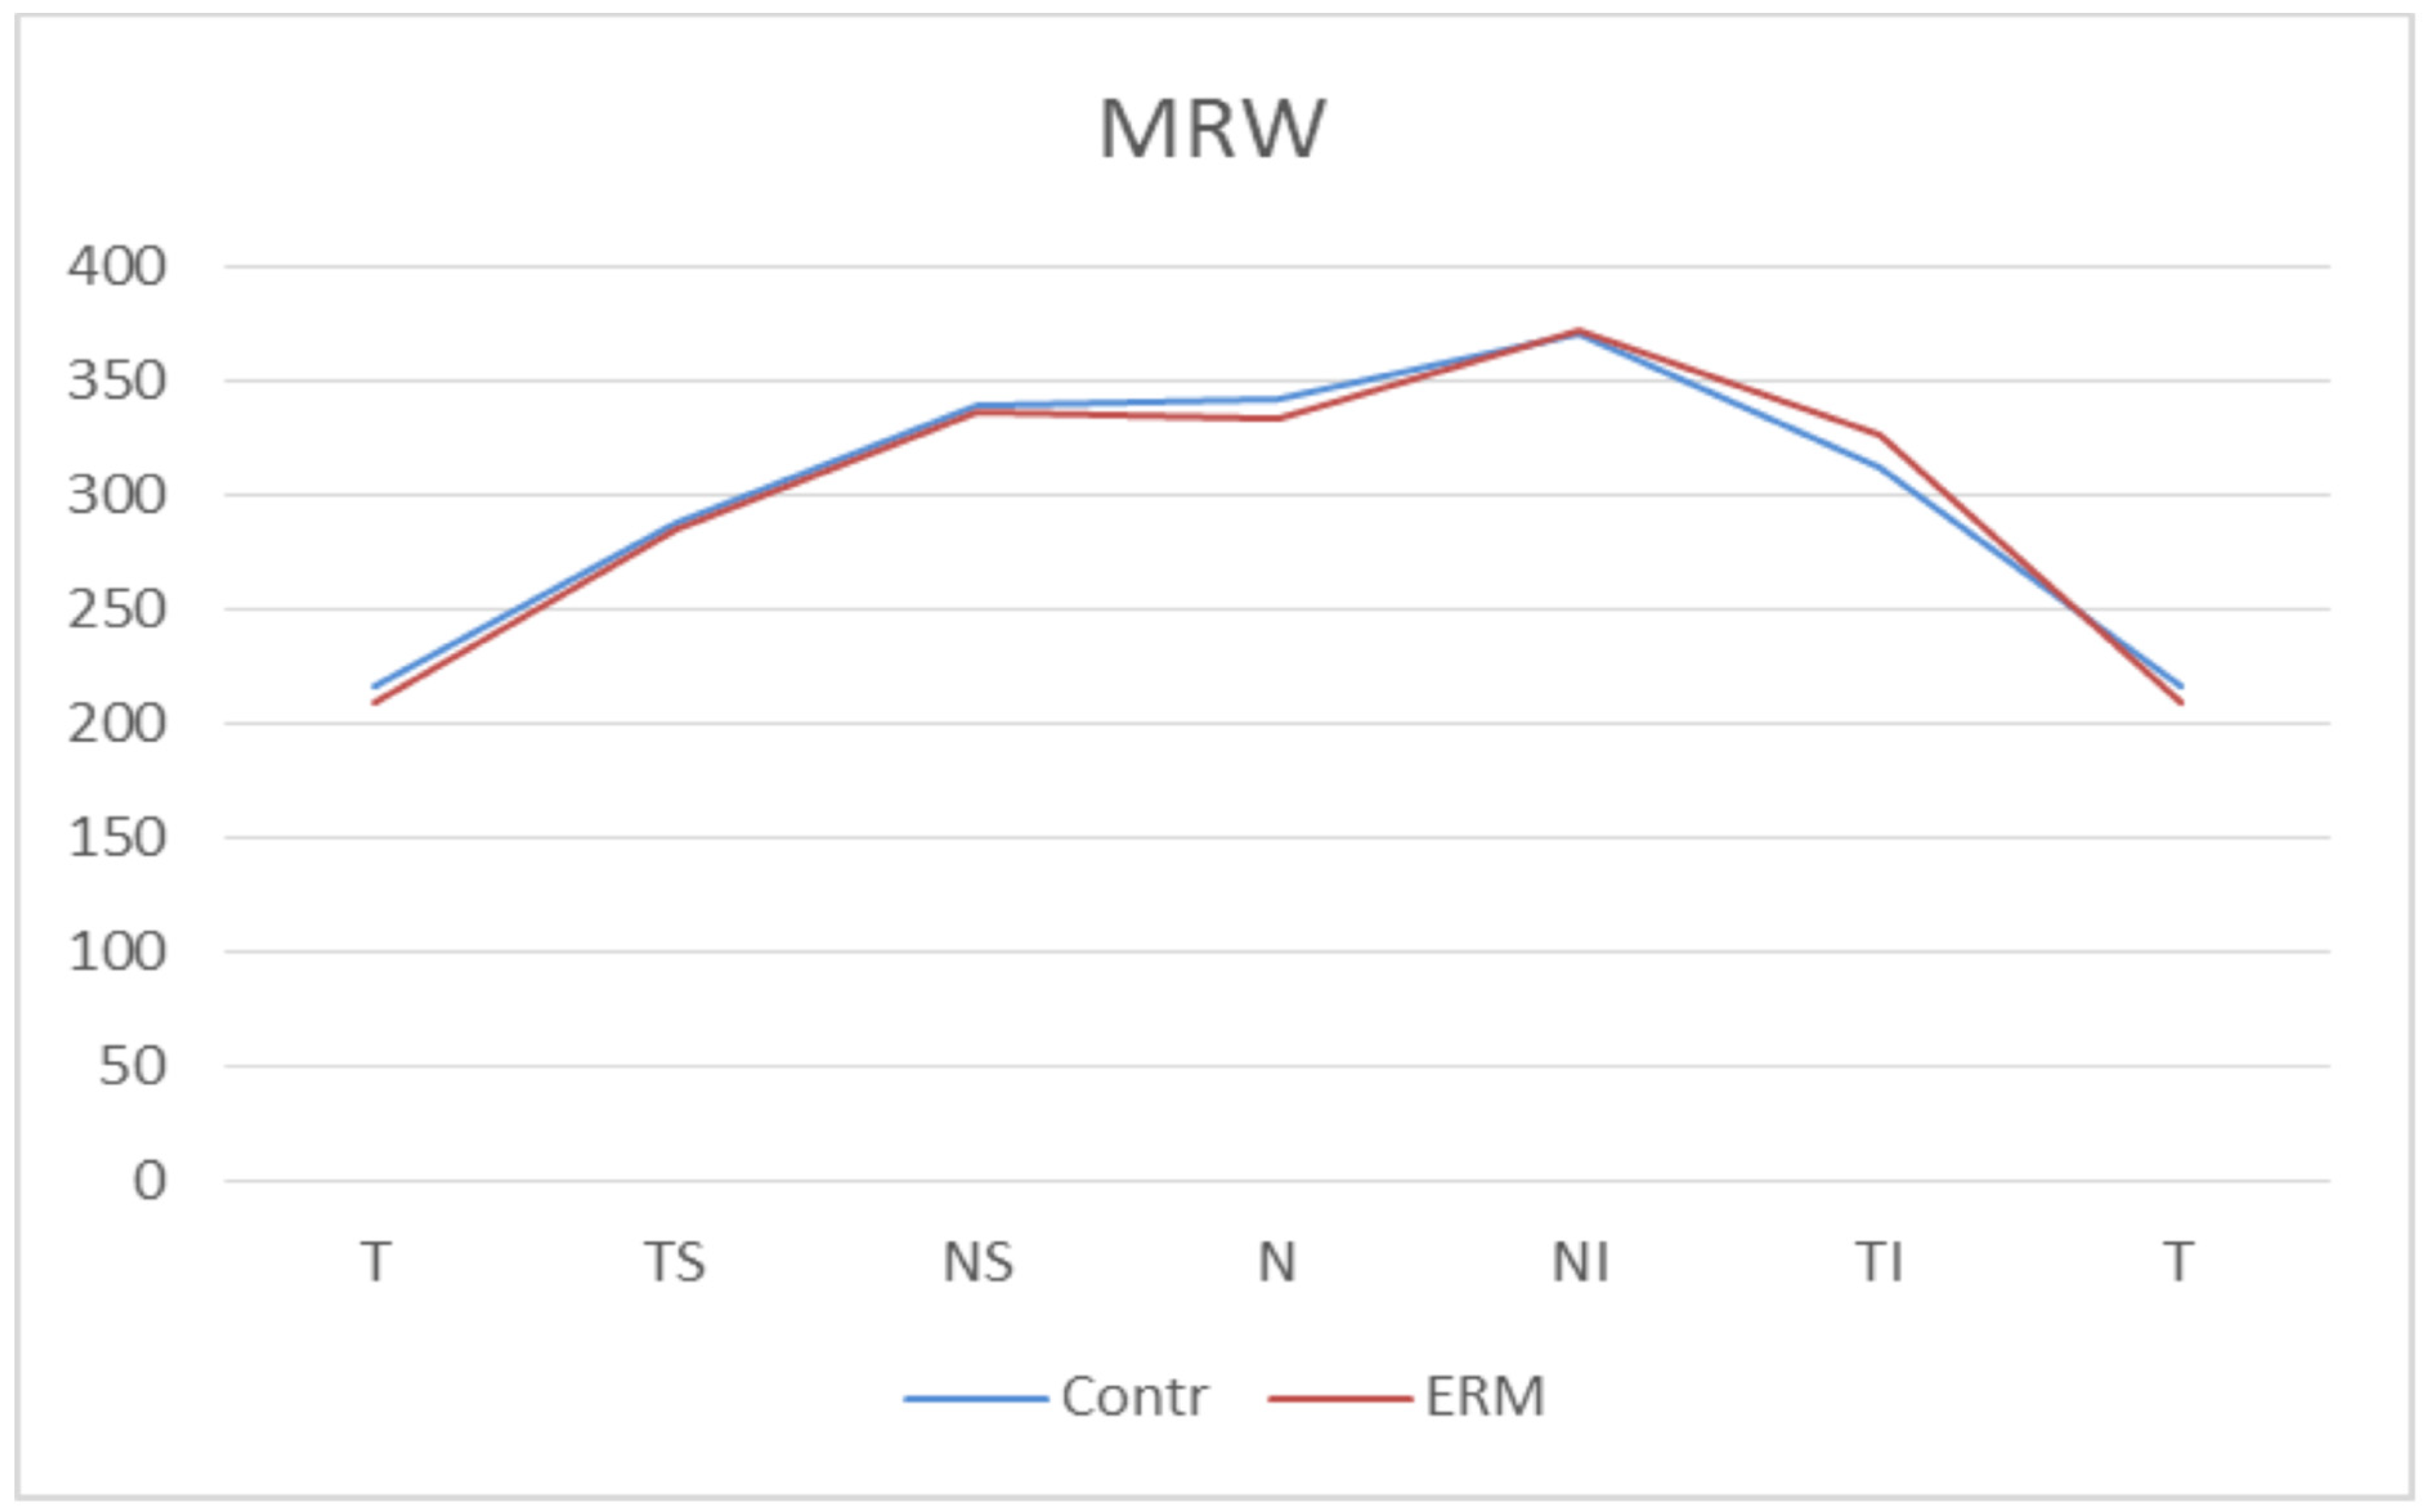
3.4. Measurements of Bruch’s Membrane Opening Minimum Rim Width
4. Discussion
Author Contributions
Funding
Institutional Review Board Statement
Informed Consent Statement
Data Availability Statement
Conflicts of Interest
References
- Tsotridou, E.; Loukovitis, E.; Zapsalis, K.; Pentara, I.; Asteriadis, S.; Tranos, P.; Zachariadis, Z.; Anogeianakis, G. A review of last decade developments on epiretinal membrane pathogenesis. Med. Hypothesis Discov. Innov. Ophthalmol. 2020, 9, 91–110. [Google Scholar]
- Bu, S.C.; Kuijer, R.; Li, X.R.; Hooymans, J.M.M.; Los, L.I. Idiopathic epiretinal membrane. Retina 2014, 34, 2317–2335. [Google Scholar] [CrossRef]
- Rothman, A.L. Epiretinal membrane. In Handbook of Pediatric Retinal OCT and the Eye-Brain Connection; StatPearls Publishing: Treasure Island, FL, USA, 2019; pp. 159–161. ISBN 9780323609845. [Google Scholar]
- Weinreb, R.N.; Aung, T.; Medeiros, F.A. The pathophysiology and treatment of glaucoma: A review. J. Am. Med. Assoc. 2014, 311, 1901–1911. [Google Scholar] [CrossRef] [Green Version]
- Harwerth, R.S.; Quigley, H.A. Visual field defects and retinal ganglion cell losses in patients with glaucoma. Arch. Ophthalmol. 2006, 124, 853–859. [Google Scholar] [CrossRef] [PubMed] [Green Version]
- Bussel, I.I.; Wollstein, G.; Schuman, J.S. OCT for glaucoma diagnosis, screening and detection of glaucoma progression. Br. J. Ophthalmol. 2014, 98, 15–19. [Google Scholar] [CrossRef] [Green Version]
- Martucci, A.; Toschi, N.; Cesareo, M.; Giannini, C.; Pocobelli, G.; Garaci, F.; Mancino, R.; Nucci, C. Spectral Domain Optical Coherence Tomography Assessment of Macular and Optic Nerve Alterations in Patients with Glaucoma and Correlation with Visual Field Index. J. Ophthalmol. 2018, 2018, 6581846. [Google Scholar] [CrossRef] [PubMed] [Green Version]
- Kim, K.E.; Park, K.H. Macular imaging by optical coherence tomography in the diagnosis and management of glaucoma. Br. J. Ophthalmol. 2018, 102, 718–724. [Google Scholar] [CrossRef]
- Renard, J.P.; Fénolland, J.R.; Giraud, J.M. Glaucoma progression analysis by Spectral-Domain Optical Coherence Tomography (SD-OCT). J. Fr. Ophtalmol. 2019, 42, 499–516. [Google Scholar] [CrossRef]
- Mwanza, J.C.; Budenz, D.L. New developments in optical coherence tomography imaging for glaucoma. Curr. Opin. Ophthalmol. 2018, 29, 121–129. [Google Scholar] [CrossRef] [PubMed]
- Oddone, F.; Lucenteforte, E.; Michelessi, M.; Rizzo, S.; Donati, S.; Parravano, M.; Virgili, G. Macular versus Retinal Nerve Fiber Layer Parameters for Diagnosing Manifest Glaucoma: A Systematic Review of Diagnostic Accuracy Studies. Ophthalmology 2016, 123, 939–949. [Google Scholar] [CrossRef]
- Rüfer, F.; Bartsch, J.J.; Erb, C.; Riehl, A.; Zeitz, P.F. Epiretinal membrane as a source of errors during the measurement of peripapillary nerve fibre thickness using spectral-domain optical coherence tomography (SD-OCT). Graefe’s Arch. Clin. Exp. Ophthalmol. 2016, 254, 2017–2023. [Google Scholar] [CrossRef]
- Lee, Y.H.; Bae, H.W.; Seo, S.J.; Lee, S.Y.; Beon, S.H.; Kang, S.; Kim, C.Y. Influence of epiretinal membrane on the measurement of peripapillary retinal nerve fibre layer thickness using spectral-domain coherence tomography. Br. J. Ophthalmol. 2016, 100, 1035–1040. [Google Scholar] [CrossRef]
- Hong, E.H.; Ryu, S.J.; Kang, M.H.; Seong, M.; Cho, H.; Yeom, J.H.; Shin, Y.U. Comparison of repeatability of swept-source and spectral-domain optical coherence tomography for measuring inner retinal thickness in retinal disease. PLoS ONE 2019, 14, e0210729. [Google Scholar] [CrossRef]
- Uchida, A.; Sasaki, M.; Motomura, K.; Yuki, K.; Kurihara, T.; Tomita, Y.; Ozawa, Y.; Yamagishi, K.; Kawasaki, R.; Hanyuda, A.; et al. Relationship between nerve fiber layer defect and the presence of epiretinal membrane in a Japanese population: The JPHC-NEXT Eye Study. Sci. Rep. 2020, 10, 779. [Google Scholar] [CrossRef]
- Govetto, A.; Lalane, R.A.; Sarraf, D.; Figueroa, M.S.; Hubschman, J.P. Insights Into Epiretinal Membranes: Presence of Ectopic Inner Foveal Layers and a New Optical Coherence Tomography Staging Scheme. Am. J. Ophthalmol. 2017, 175, 99–113. [Google Scholar] [CrossRef] [PubMed]
- Bambo, M.P.; Fuentemilla, E.; Cameo, B.; Fuertes, I.; Ferrandez, B.; Güerri, N.; Polo, V.; Larrosa, J.M.; Pablo, L.E.; Garcia-Martin, E. Diagnostic capability of a linear discriminant function applied to a novel Spectralis OCT glaucoma-detection protocol. BMC Ophthalmol. 2020, 20, 1–8. [Google Scholar] [CrossRef] [Green Version]
- Nam, K.Y.; Kim, B.J.; Lee, W.H.; Han, Y.S. Repeatability of spectral domain optical coherence tomography measurements of bruch’s membrane opening-minimum rim width in epiretinal membrane patients with peripapillary involvement. J. Clin. Med. 2021, 10, 2240. [Google Scholar] [CrossRef]
- Asrani, S.; Essaid, L.; Alder, B.D.; Santiago-Turla, C. Artifacts in spectral-domain optical coherence tomography measurements in glaucoma. JAMA Ophthalmol. 2014, 132, 396–402. [Google Scholar] [CrossRef] [Green Version]
- Quaranta, L.; Riva, I.; Gerardi, C.; Oddone, F.; Floriano, I.; Konstas, A.G.P. Quality of Life in Glaucoma: A Review of the Literature. Adv. Ther. 2016, 33, 959–981. [Google Scholar] [CrossRef] [PubMed] [Green Version]
- Lee, H.J.; Kim, M.S.; Jo, Y.J.; Kim, J.Y. Thickness of the macula, retinal nerve fiber layer, and ganglion cell layer in the epiretinal membrane: The repeatability study of optical coherence tomography. Investig. Ophthalmol. Vis. Sci. 2015, 56, 4554–4559. [Google Scholar] [CrossRef] [PubMed]
- Awadalla, M.S.; Andrew, N.H.; Zhou, T.; Marshall, H.; Qassim, A.; Hassall, M.; Casson, R.J.; Graham, S.L.; Healey, P.R.; Agar, A.; et al. Prevalence and type of artefact with spectral domain optical coherence tomography macular ganglion cell imaging in glaucoma surveillance. PLoS ONE 2018, 13, e0206684. [Google Scholar] [CrossRef] [PubMed]
- Kim, J.M.; Kim, K.N.; Kim, W.-J.; Kim, C. Influence of Epiretinal Membranes on the Retinal Nerve Fiber Layer Thickness Measured by Spectral Domain Optical Coherence Tomography in Glaucoma. Korean J. Ophthalmol. 2019, 33, 422. [Google Scholar] [CrossRef]
- Lee, H.J.; Kim, M.S.; Jo, Y.J.; Kim, J.Y. Ganglion Cell-Inner Plexiform Layer Thickness in Retinal Diseases: Repeatability Study of Spectral-Domain Optical Coherence Tomography. Am. J. Ophthalmol. 2015, 160, 283–289. [Google Scholar] [CrossRef] [PubMed]
- Oh, J.; Oh, J.H.; Do, J.R.; Chang, M.; Park, C.Y. Retinal nerve fiber layer configuration in eyes with Epiretinal membrane. Optom. Vis. Sci. 2014, 91, 1328–1334. [Google Scholar] [CrossRef]
- Hwang, Y.H.; Kim, M.K.; Kim, D.W. Segmentation Errors in Macular Ganglion Cell Analysis as Determined by Optical Coherence Tomography. Ophthalmology 2016, 123, 950–958. [Google Scholar] [CrossRef]
- Uzair, N.; Shamim, M.; Mamoon, S.A.; Naz, S.; Feroz, L.; Kumari, K. Comparison of Retinal Nerve Fibre Layer versus Bruch Membrane Opening-Minimum Rim Width as an Optical Coherence Tomography-based Marker for Glaucoma in Myopia. J. Coll. Physicians Surg. Pak. 2021, 31, 162–165. [Google Scholar] [CrossRef] [PubMed]
- Li, R.; Wang, X.; Wei, Y.; Fang, Y.; Tian, T.; Li, M.; Cai, Y.; Pan, Y. Structure–function relationship between Bruch’s membrane opening-minimum rim width and perimetry in open-angle glaucoma subtypes. Graefe’s Arch. Clin. Exp. Ophthalmol. 2020, 258, 595–605. [Google Scholar] [CrossRef]
- Pollet-Villard, F.; Chiquet, C.; Romanet, J.P.; Noel, C.; Aptel, F. Structure-function relationships with spectral-domain optical coherence tomography retinal nerve fiber layer and optic nerve head measurements. Investig. Ophthalmol. Vis. Sci. 2014, 55, 2953–2962. [Google Scholar] [CrossRef] [Green Version]
- Gmeiner, J.M.D.; Schrems, W.A.; Mardin, C.Y.; Laemmer, R.; Kruse, F.E.; Schrems-Hoesl, L.M. Comparison of bruch’s membrane opening minimum rim width and peripapillary retinal nerve fiber layer thickness in early glaucoma assessment. Investig. Ophthalmol. Vis. Sci. 2016, 57, OCT575–OCT584. [Google Scholar] [CrossRef]
- Zheng, F.; Yu, M.; Leung, C.K.S. Diagnostic criteria for detection of retinal nerve fibre layer thickness and neuroretinal rim width abnormalities in glaucoma. Br. J. Ophthalmol. 2020, 104, 270–275. [Google Scholar] [CrossRef] [Green Version]
- Leaney, J.C.; Nguyen, V.; Miranda, E.; Barnett, Y.; Ahmad, K.; Wong, S.; Lawlor, M. Bruch’s Membrane Opening Minimum Rim Width Provides Objective Differentiation between Glaucoma and Nonglaucomatous Optic Neuropathies. Am. J. Ophthalmol. 2020, 218, 164–172. [Google Scholar] [CrossRef] [PubMed]


| Control (n = 73) | ERM (n = 88) | p-Value | |
|---|---|---|---|
| Mean Age (y ± SD) | 71.65 (±5.84) | 72.82 (±5.37) | 0.190 |
| Axial length (mm ± SD) | 23.69 (±0.66) | 23.75 (±0.79) | 0.583 |
| BMO-area (mm2 ± SD) | 1.88 (±0.28) | 1.84 (±0.31) | 0.378 |
| Sex (male:female) | 39:34 | 50:38 | - |
| Eye (right:left) | 40:33 | 41:47 | - |
| LensStatus (Phakic:Pseudophakic) | 62:38 | 56:44 | - |
| p-RNFL at 3.5 mm | p-RNFL at 4.1 mm | p-RNFL at 4.7 mm | |||||||
|---|---|---|---|---|---|---|---|---|---|
| Control Group | ERM Group | p-Value | Control Group | ERM Group | p-Value | Control Group | ERM Group | p-Value | |
| Global | 95.68 ± 9.94 | 101.67 ± 10.76 | <0.001 | 82.49 ± 8.66 | 91.26 ± 9.98 | <0.001 | 72.88 ± 7.44 | 83.39 ± 9.43 | <0.001 |
| Temporal | 67.88 ± 10.46 | 108.67 ± 98.13 | <0.001 | 61.32 ± 9.69 | 94.73 ± 20.71 | <0.001 | 56.10 ±8.47 | 95.14 ± 24.39 | <0.001 |
| Superior Temporal | 126.22 ± 19.49 | 128.94 ± 21.68 | 0.40 | 114.68 ± 16.80 | 117.54 ± 18.75 | 0.31 | 104.81 ± 14.01 | 107.86 ± 18.26 | 0.23 |
| Superior Nasal | 108.27 ± 22.71 | 103.26 ± 19.95 | 0.14 | 87.55 ± 17.41 | 88.18 ± 17.52 | 0.82 | 72.14 ± 16.43 | 74.31 ± 15.68 | 0.40 |
| Nasal | 79.60 ± 10.96 | 79.10 ± 12.62 | 0.79 | 66.71 ± 9.65 | 68.69 ± 11.40 | 0.23 | 58.40 ± 7.46 | 60.49 ± 9.41 | 0.12 |
| Inferior Nasal | 112.99 ± 23.10 | 101.02 ± 17.81 | <0.001 | 90.22 ± 18.42 | 82.55 ± 14.66 | <0.001 | 73.73 ± 15.45 | 69.61 ± 12.58 | 0.07 |
| Inferior Temporal | 142.36 ± 19.81 | 139.31 ± 19.22 | 0.33 | 128.86 ± 16.53 | 126.52 ± 18.23 | 0.38 | 117.11 ± 15.19 | 113.28 ± 17.64 | 0.14 |
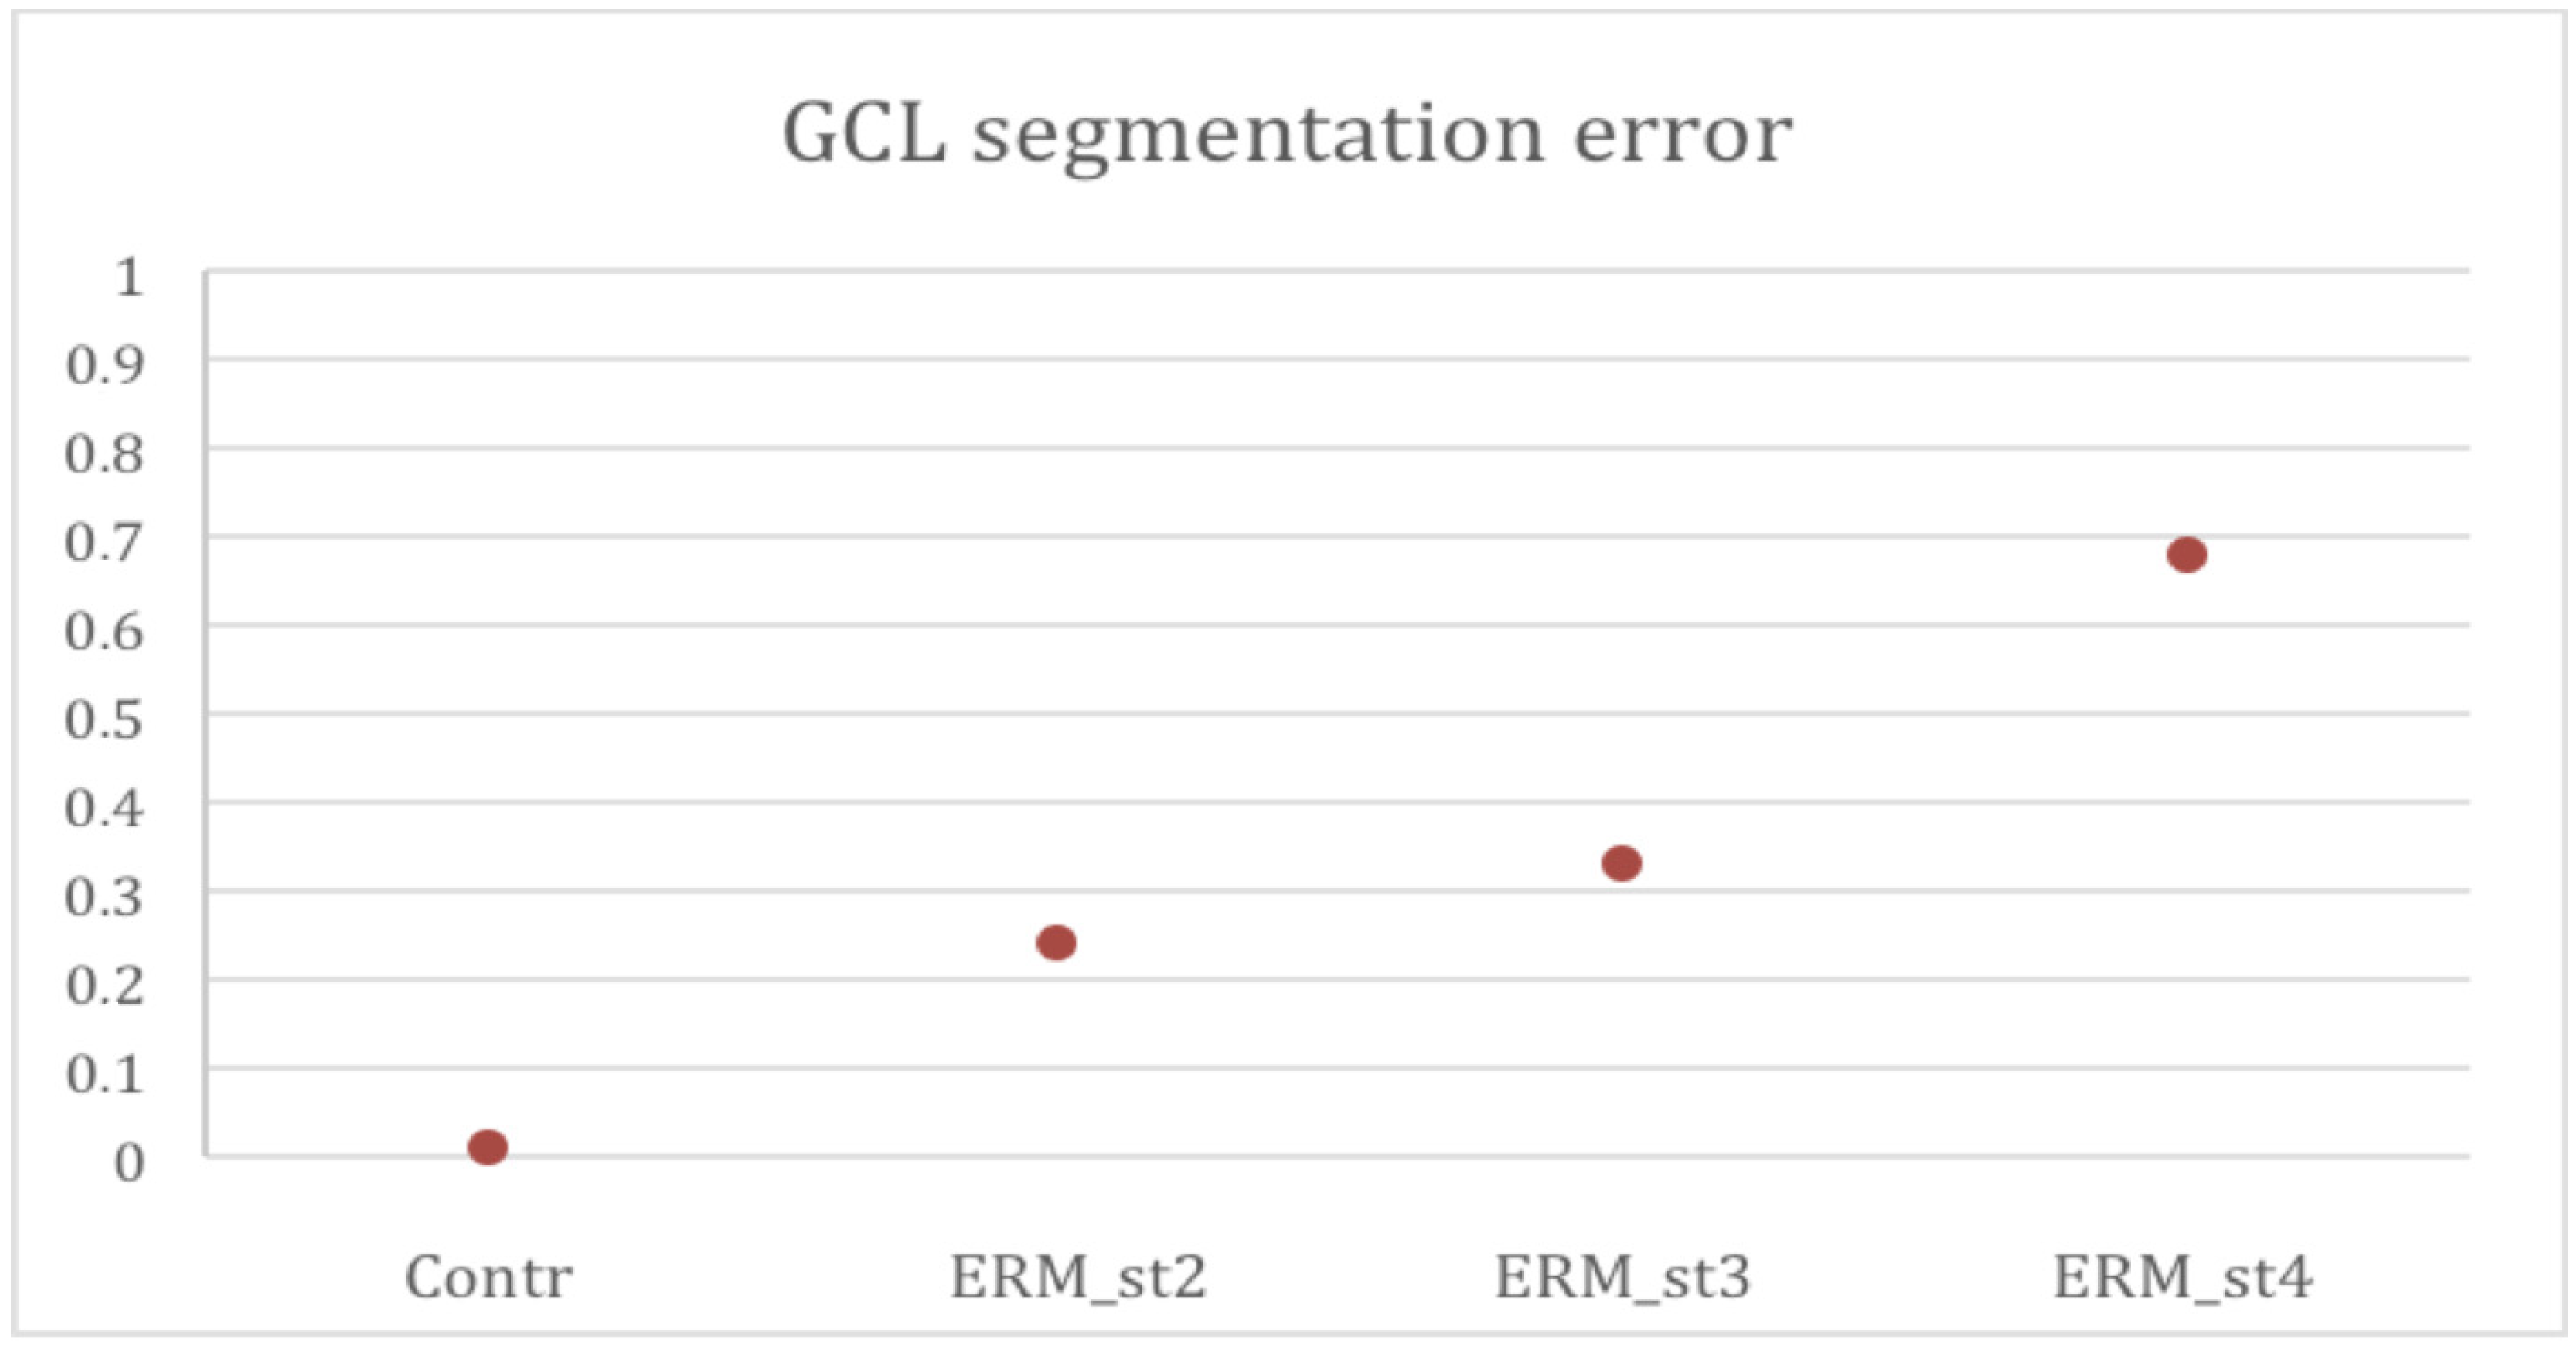
| Group | Automatic Segmentation Error (%±SD) |
|---|---|
| Control Group | 0.01 ± 0.02 |
| ERM Group overall | 0.30 ± 0.21 |
| ERM stage 2 | 0.24 ± 0.17 |
| ERM stage 3 | 0.33 ± 0.21 |
| ERM stage 4 | 0.68 ± 0.22 |
| Sector | Control Group | ERM Group | p-Value |
|---|---|---|---|
| Central | 14.37 ± 3.70 | 51.18 ± 12.56 | <0.001 |
| Inner Temporal | 46.53 ± 5.23 | 64.00 ± 11.11 | <0.001 |
| Inner Superior | 50.89 ± 4.29 | 59.40 ± 6.59 | <0.001 |
| Inner Nasal | 49.44 ± 5.31 | 62.23 ± 6.89 | <0.001 |
| Inner Inferior | 50.64 ± 4.99 | 59.23 ± 7.34 | <0.001 |
| Outer Temporal | 33.60 ± 4.56 | 41.40 ± 8.57 | <0.001 |
| Outer Superior | 32.85 ± 4.26 | 37.08 ± 6.17 | <0.001 |
| Outer Nasal | 35.88 ± 3.58 | 37.58 ± 4.36 | 0.014 |
| Outer Inferior | 31.14 ± 3.06 | 34.83 ± 6.10 | <0.001 |
| Total Volume | 1.03 ± 0.10 | 1.23 ± 0.15 | <0.001 |
| Sector | Control Group | ERM Group | p-Value |
|---|---|---|---|
| Global | 304.49 ± 51.00 | 302.47 ± 48.62 | 0.80 |
| Temporal | 216.40 ± 41.67 | 209.16 ± 41.23 | 0.27 |
| Superior Temporal | 287.71 ± 59.02 | 285.49 ± 62.65 | 0.82 |
| Superior Nasal | 339.26 ± 68.69 | 336.76 ± 63.79 | 0.81 |
| Nasal | 341.69 ± 65.49 | 332.81 ± 62.01 | 0.38 |
| Inferior Nasal | 370.74 ± 77.42 | 371.68 ± 69.61 | 0.94 |
| Inferior Temporal | 312.02 ± 58.97 | 325.91 ± 52.92 | 0.12 |
Publisher’s Note: MDPI stays neutral with regard to jurisdictional claims in published maps and institutional affiliations. |
© 2021 by the authors. Licensee MDPI, Basel, Switzerland. This article is an open access article distributed under the terms and conditions of the Creative Commons Attribution (CC BY) license (https://creativecommons.org/licenses/by/4.0/).
Share and Cite
Pastore, M.R.; Merli, R.; Dell’Aquila, C.; Belfanti, L.; Franzon, M.; Cirigliano, G.; De Giacinto, C.; Giglio, R.; Tognetto, D. Impact of Epiretinal Membrane on Optical Coherence Tomography Tools Used for Monitoring Glaucoma. Diagnostics 2021, 11, 2203. https://doi.org/10.3390/diagnostics11122203
Pastore MR, Merli R, Dell’Aquila C, Belfanti L, Franzon M, Cirigliano G, De Giacinto C, Giglio R, Tognetto D. Impact of Epiretinal Membrane on Optical Coherence Tomography Tools Used for Monitoring Glaucoma. Diagnostics. 2021; 11(12):2203. https://doi.org/10.3390/diagnostics11122203
Chicago/Turabian StylePastore, Marco Rocco, Riccardo Merli, Carmen Dell’Aquila, Lorenzo Belfanti, Marco Franzon, Gabriella Cirigliano, Chiara De Giacinto, Rosa Giglio, and Daniele Tognetto. 2021. "Impact of Epiretinal Membrane on Optical Coherence Tomography Tools Used for Monitoring Glaucoma" Diagnostics 11, no. 12: 2203. https://doi.org/10.3390/diagnostics11122203
APA StylePastore, M. R., Merli, R., Dell’Aquila, C., Belfanti, L., Franzon, M., Cirigliano, G., De Giacinto, C., Giglio, R., & Tognetto, D. (2021). Impact of Epiretinal Membrane on Optical Coherence Tomography Tools Used for Monitoring Glaucoma. Diagnostics, 11(12), 2203. https://doi.org/10.3390/diagnostics11122203