
Identifying Peripheral Neuropathy in Colour Fundus Photographs Based on Deep Learning


Abstract
:1. Introduction
2. Materials and Methods
2.1. Assessment of Diabetic Neuropathy (DN)
2.2. Assessment of Diabetic Retinopathy (DR)
2.3. Data Analysis
2.3.1. Dataset Splits
2.3.2. Dataset Processing
2.4. Training
2.4.1. Algorithm Evaluation
2.4.2. Demographic Analysis
3. Results
Model Performance
4. Discussion
Author Contributions
Funding
Institutional Review Board Statement
Informed Consent Statement
Data Availability Statement
Acknowledgments
Conflicts of Interest
References
- International Diabetes Federation. IDF Diabetes Atlas. Brussels, 8th ed. Available online: http://www.diabetesatlas.org (accessed on 20 August 2020).
- World Health Organization. Global Report on Diabetes. Available online: https://apps.who.int/iris/bitstream/handle/10665/204871/9789241565257_eng.pdf (accessed on 18 August 2020).
- Sinharay, K.; Paul, U.K.; Bhattacharyya, A.K.; Pal, S.K. Prevalence of Diabetic Foot Ulcers in Newly Diagnosed Diabetes Mellitus Patients. J. Indian Med. Assoc. 2012, 110, 608–611. [Google Scholar] [PubMed]
- Crawford, F.; Nicolson, D.J.; Amanna, A.E.; Martin, A.; Gupta, S.; Leese, G.P.; Heggie, R.; Chappell, F.M.; McIntosh, H.H. Preventing Foot Ulceration in Diabetes: Systematic Review and Meta-Analyses of RCT Data. Diabetologia 2020, 63, 49–64. [Google Scholar] [CrossRef] [Green Version]
- Apelqvist, J.; Larsson, J. What Is the Most Effective Way to Reduce Incidence of Amputation in the Diabetic Foot? Diabetes Metab. Res. Rev. 2000, 16 (Suppl. 1), S75–S83. [Google Scholar] [CrossRef]
- Martin, C.L.; Waberski, B.H.; Pop-Busui, R.; Cleary, P.A.; Catton, S.; Albers, J.W.; Feldman, E.L.; Herman, W.H.; DCCT/EDIC Research Group. Vibration Perception Threshold as a Measure of Distal Symmetrical Peripheral Neuropathy in Type 1 Diabetes: Results from the DCCT/EDIC Study. Diabetes Care 2010, 33, 2635–2641. [Google Scholar] [CrossRef] [Green Version]
- Raman, R.; Gupta, A.; Krishna, S.; Kulothungan, V.; Sharma, T. Prevalence and Risk Factors for Diabetic Microvascular Complications in Newly Diagnosed Type II Diabetes Mellitus. Sankara Nethralaya Diabetic Retinopathy Epidemiology and Molecular Genetic Study (SN-DREAMS, Report 27). J. Diabetes Complicat. 2012, 26, 123–128. [Google Scholar] [CrossRef]
- Shahidi, A.M.; Sampson, G.P.; Pritchard, N.; Edwards, K.; Vagenas, D.; Russell, A.W.; Malik, R.A.; Efron, N. Retinal Nerve Fibre Layer Thinning Associated with Diabetic Peripheral Neuropathy. Diabet. Med. 2012, 29, e106–e111. [Google Scholar] [CrossRef]
- Gulshan, V.; Peng, L.; Coram, M.; Stumpe, M.C.; Wu, D.; Narayanaswamy, A.; Venugopalan, S.; Widner, K.; Madams, T.; Cuadros, J.; et al. Development and Validation of a Deep Learning Algorithm for Detection of Diabetic Retinopathy in Retinal Fundus Photographs. JAMA 2016, 316, 2402–2410. [Google Scholar] [CrossRef]
- Poplin, R.; Varadarajan, A.V.; Blumer, K.; Liu, Y.; McConnell, M.V.; Corrado, G.S.; Peng, L.; Webster, D.R. Prediction of Cardiovascular Risk Factors from Retinal Fundus Photographs via Deep Learning. Nat. Biomed. Eng. 2018, 2, 158–164. [Google Scholar] [CrossRef]
- Sabanayagam, C.; Xu, D.; Ting, D.S.W.; Nusinovici, S.; Banu, R.; Hamzah, H.; Lim, C.; Tham, Y.-C.; Cheung, C.Y.; Tai, E.S.; et al. A Deep Learning Algorithm to Detect Chronic Kidney Disease from Retinal Photographs in Community-Based Populations. Lancet Digit. Health 2020, 2, e295–e302. [Google Scholar] [CrossRef]
- Raman, R.; Rani, P.K.; Reddi Rachepalle, S.; Gnanamoorthy, P.; Uthra, S.; Kumaramanickavel, G.; Sharma, T. Prevalence of Diabetic Retinopathy in India: Sankara Nethralaya Diabetic Retinopathy Epidemiology and Molecular Genetics Study Report 2. Ophthalmology 2009, 116, 311–318. [Google Scholar] [CrossRef]
- Klein, R.; Klein, B.E.; Magli, Y.L.; Brothers, R.J.; Meuer, S.M.; Moss, S.E.; Davis, M.D. An Alternative Method of Grading Diabetic Retinopathy. Ophthalmology 1986, 93, 1183–1187. [Google Scholar] [CrossRef]
- Szegedy, C.; Vanhoucke, V.; Ioffe, S.; Shlens, J.; Wojna, Z. Rethinking the Inception Architecture for Computer Vision. arXiv 2015, arXiv:1512.00567. [Google Scholar]
- Iandola, F.N.; Han, S.; Moskewicz, M.W.; Ashraf, K.; Dally, W.J.; Keutzer, K. SqueezeNet: AlexNet-Level Accuracy with 50x Fewer Parameters and <0.5MB Model Size. [cs]. arXiv 2016, arXiv:1602.07360. [Google Scholar]
- Huang, G.; Liu, Z.; van der Maaten, L.; Weinberger, K.Q. Densely Connected Convolutional Networks. [cs]. arXiv 2018, arXiv:1608.06993. [Google Scholar]
- Kingma, D.P.; Ba, J. Adam: A Method for Stochastic Optimization. [cs]. arXiv 2017, arXiv:1412.6980. [Google Scholar]
- Kiefer, J.; Wolfowitz, J. Stochastic Estimation of the Maximum of a Regression Function. Ann. Math. Stat. 1952, 23, 462–466. [Google Scholar] [CrossRef]
- Nair, V.; Hinton, G.E. Rectified linear units improve restricted boltzmann machines. In Proceedings of the 27th International Conference on International Conference on Machine Learning (ICML’10); Omnipress: Madison, WI, USA, 2010; pp. 807–814. [Google Scholar]
- Neriyanuri, S.; Pardhan, S.; Gella, L.; Pal, S.S.; Ganesan, S.; Sharma, T.; Raman, R. Retinal Sensitivity Changes Associated with Diabetic Neuropathy in the Absence of Diabetic Retinopathy. Br. J. Ophthalmol. 2017, 101, 1174–1178. [Google Scholar] [CrossRef] [PubMed]
- Srinivasan, S.; Raman, R.; Kulothungan, V.; Pal, S.S.; Roy, R.; Ganesan, S.; Sharma, T. Four-Year Incident Neuropathy and Its Risk Factors in Subjects with Type 2 Diabetes. J. Assoc. Physicians India 2019, 67, 34–37. [Google Scholar] [PubMed]


| Phase | Name | Description | Patients * | Images * |
|---|---|---|---|---|
| Training | trA | all images (patients both with and without DR) | 1081 | 17,028 |
| trDR+ | only images of patients with DR | 93 | 1503 | |
| trDR− | only images of patients without DR | 988 | 15,525 | |
| Testing | tsA | all images (patients both with and without DR) | 121 | 1892 |
| tsDR+ | only images of patients with DR | 11 | 165 | |
| tsDR− | only images of patients without DR | 110 | 1727 | |
| {trA} ∩ {tsA} = {Ø}; {trA} ∪ {tsA} = {A} {trDR+} ∩ {trDR−} = {Ø}; {trDR+} ∪ {trDR−} = {trA} {tsDR+} ∩ {tsDR−} = {Ø}; {tsDR+} ∪ {tsDR−} = {tsA} | ||||
| Hyper-Parameter | Values | Number of Values |
|---|---|---|
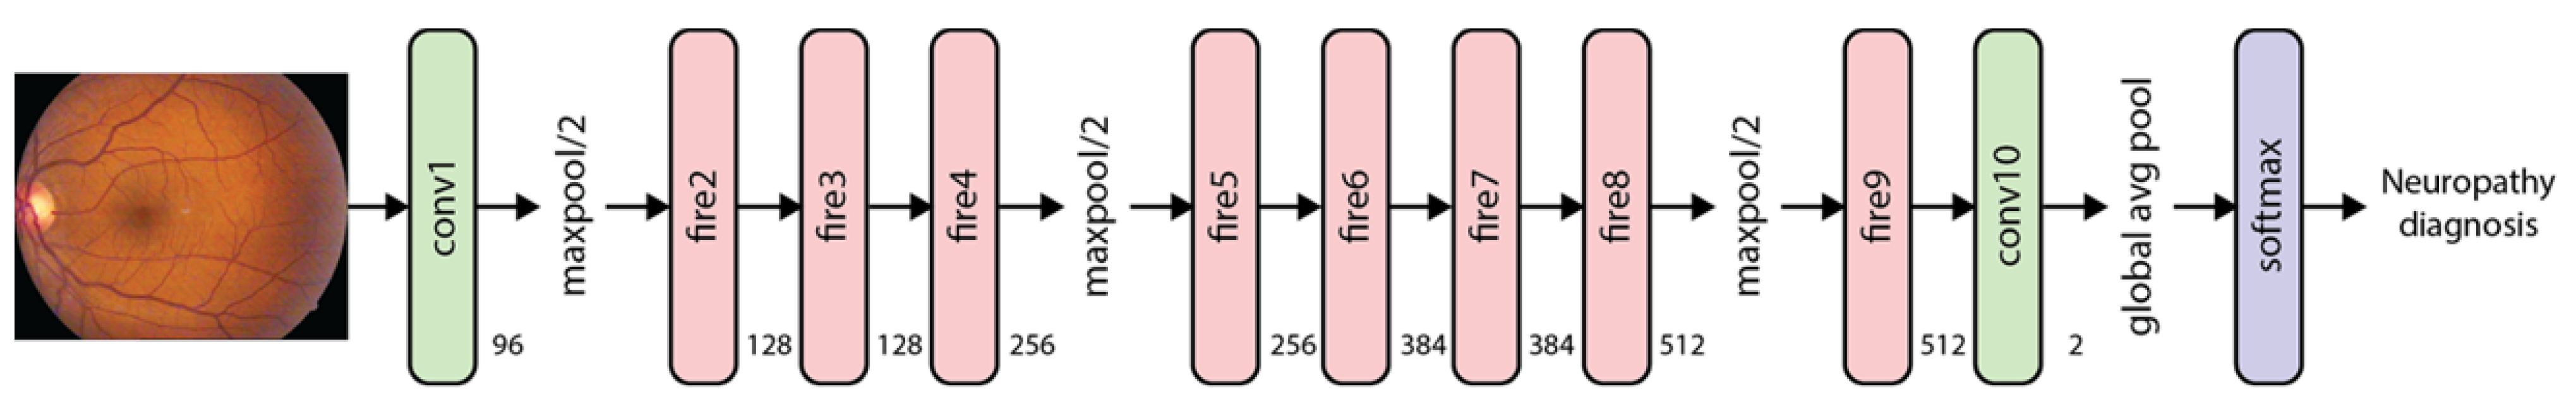
| Architecture | {Inception, Squeezenet, Densenet} | 3 |
| Optimiser | {SGD, Adam} | 2 |
| Learning rate | [10 × 10−6, 10 × 10−2] | 10 |
| Momentum | {0.95, 0.99} | 2 |
| Dropout | {0.3, 0.5, 0.7} | 3 |
| Class rebalancing | {weighted loss, weighted sampling} | 2 |
| Total number of combinations/models | 720 | |
| Models | Trained on: | Performance (AUC) on: | |
|---|---|---|---|
| Phase 1 | All models (see Table 2) | Training set, split 1 | Validation set, split 1 |
| Phase 2 | Best model from Phase 1 | Training set, all splits | Test set (average AUC) |
| Disease State | No Diabetic Retinopathy/Neuropathy | Diabetic Retinopathy | Diabetic Neuropathy | Combined | ||
|---|---|---|---|---|---|---|
| Variables | n = 1101 | n = 189 | n = 276 | n = 43 | p Value | |
| Age | 55.71 (10.214) | 56.04 (10.057) | 57.55 (10.059) | 57.046 (10.127) | 0.074 | |
| Gender(m/f) | 568/533 | 99/90 | 150/126 | 23/20 | 0.916 | |
| Duration of diabetes(in years) | 3.75 (5.11) | 9.364 (6.20) | 7.756 (6.14) | 11.205 (6.166) | 0.00 | |
| Hba1c | 7.90 (2.43) | 9.475 (2.22) | 8.424 (2.21) | 9.323 (2.229) | 0.00 | |
| BMI range(mean) | 14–44 (25.89) | 15.41–51.95 (24.19) | 14.82–39.73 (25.03) | 16.65–33.75 (24.455) | 0.001 | |
| Lipid Profile | ||||||
| Serum Cholesterol mmol/L | 4.80 (1.05) | 4.862 (1.16) | 4.919 (0.965) | 5.11 (1.021) | 0.094 | |
| Serum TGL cholesterol mmol/L | 1.75 (1.151) | 1.748 (1.006) | 1.719 (1.12) | 1.877 (0.918) | 0.271 | |
| Serum HDL cholesterol mmol/L | 0.99 (0.254) | 1.046 (0.274) | 1.066 (0.262) | 1.054 (0.202) | 0.00 | |
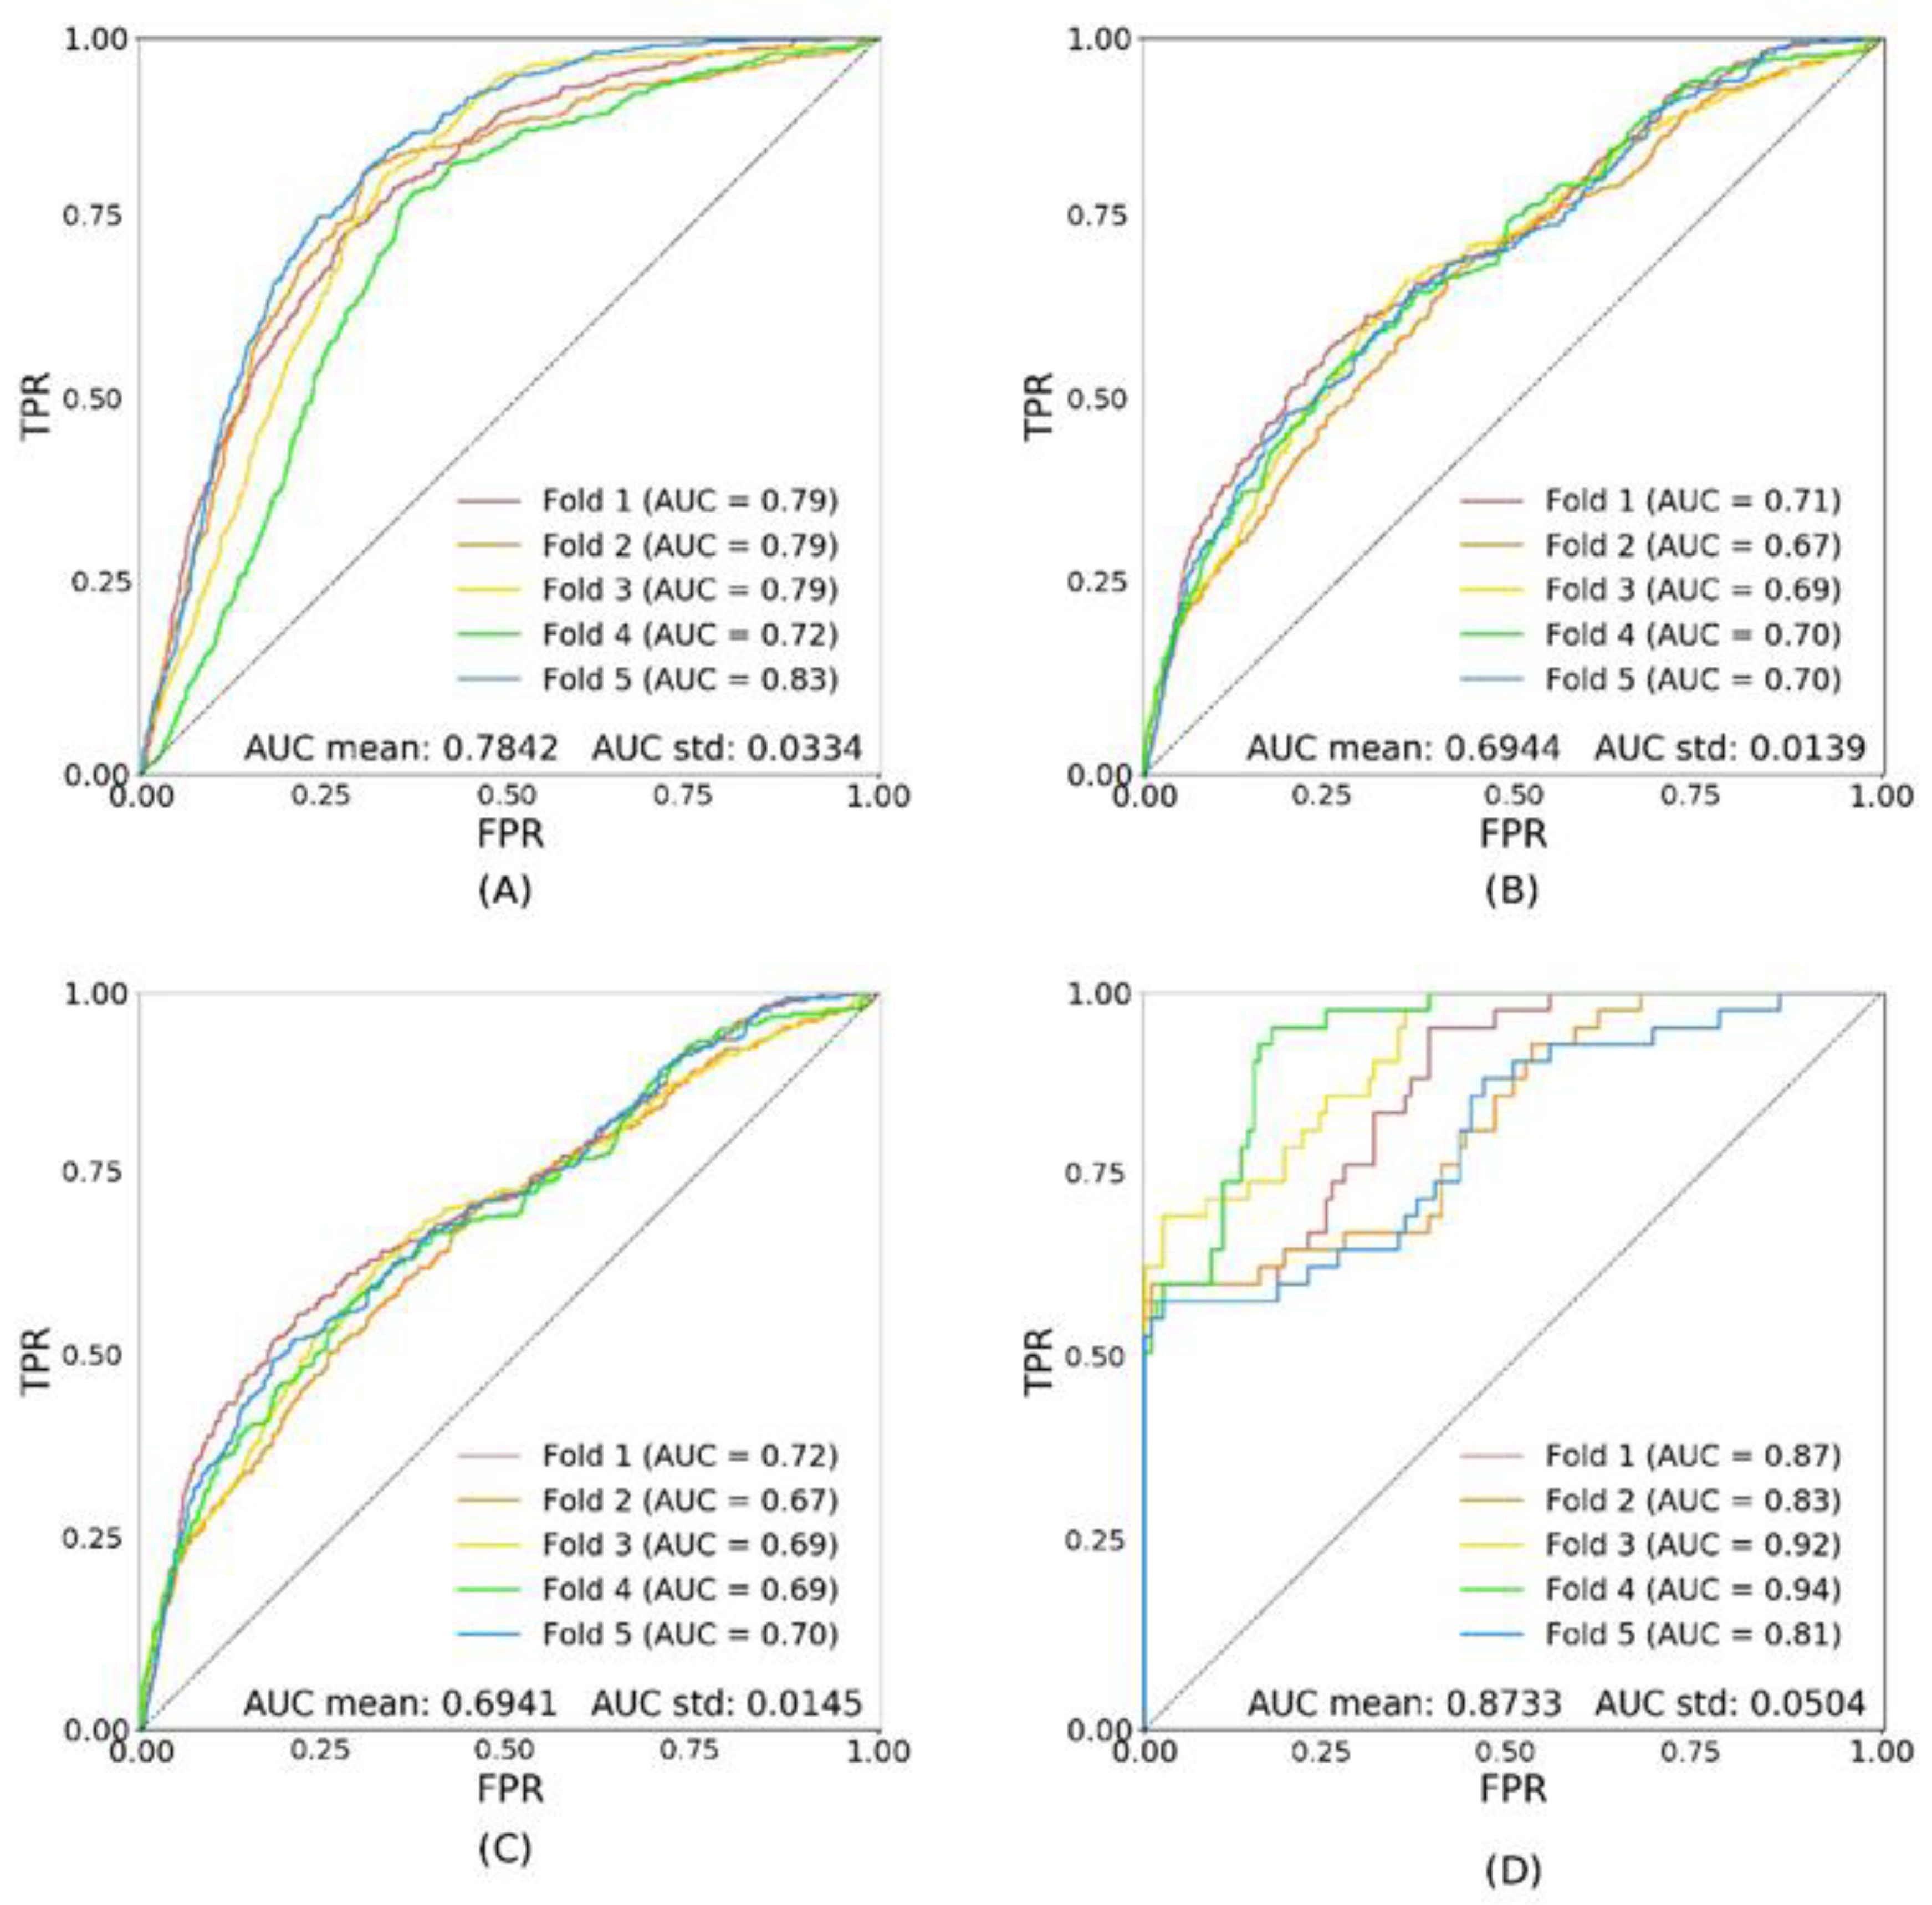
| val | tsA | tsDR− | tsDR+ | |
|---|---|---|---|---|
| trA | 0.8013 ± 0.0257 | 0.7097 ± 0.0031 | 0.7105 ± 0.0032 | 0.8673 ± 0.0088 |
| trDR− | 0.7842 ± 0.0334 | 0.6944 ± 0.0139 | 0.6941 ± 0.0145 | 0.8733± 0.0504 |
| trDR+ | 0.6878 ± 0.0945 | 0.5993 ± 0.0410 | 0.5981 ± 0.0485 | 0.6805 ± 0.0587 |
Publisher’s Note: MDPI stays neutral with regard to jurisdictional claims in published maps and institutional affiliations. |
© 2021 by the authors. Licensee MDPI, Basel, Switzerland. This article is an open access article distributed under the terms and conditions of the Creative Commons Attribution (CC BY) license (https://creativecommons.org/licenses/by/4.0/).
Share and Cite
Cervera, D.R.; Smith, L.; Diaz-Santana, L.; Kumar, M.; Raman, R.; Sivaprasad, S. Identifying Peripheral Neuropathy in Colour Fundus Photographs Based on Deep Learning. Diagnostics 2021, 11, 1943. https://doi.org/10.3390/diagnostics11111943
Cervera DR, Smith L, Diaz-Santana L, Kumar M, Raman R, Sivaprasad S. Identifying Peripheral Neuropathy in Colour Fundus Photographs Based on Deep Learning. Diagnostics. 2021; 11(11):1943. https://doi.org/10.3390/diagnostics11111943
Chicago/Turabian StyleCervera, Diego R., Luke Smith, Luis Diaz-Santana, Meenakshi Kumar, Rajiv Raman, and Sobha Sivaprasad. 2021. "Identifying Peripheral Neuropathy in Colour Fundus Photographs Based on Deep Learning" Diagnostics 11, no. 11: 1943. https://doi.org/10.3390/diagnostics11111943
APA StyleCervera, D. R., Smith, L., Diaz-Santana, L., Kumar, M., Raman, R., & Sivaprasad, S. (2021). Identifying Peripheral Neuropathy in Colour Fundus Photographs Based on Deep Learning. Diagnostics, 11(11), 1943. https://doi.org/10.3390/diagnostics11111943