
Before and after Endovascular Aortic Repair in the Same Patients with Aortic Dissection: A Cohort Study of Four-Dimensional Phase-Contrast Magnetic Resonance Imaging

 , , , and
Abstract
:1. Introduction
2. Materials and Methods
2.1. Patients
2.2. MRI Methods
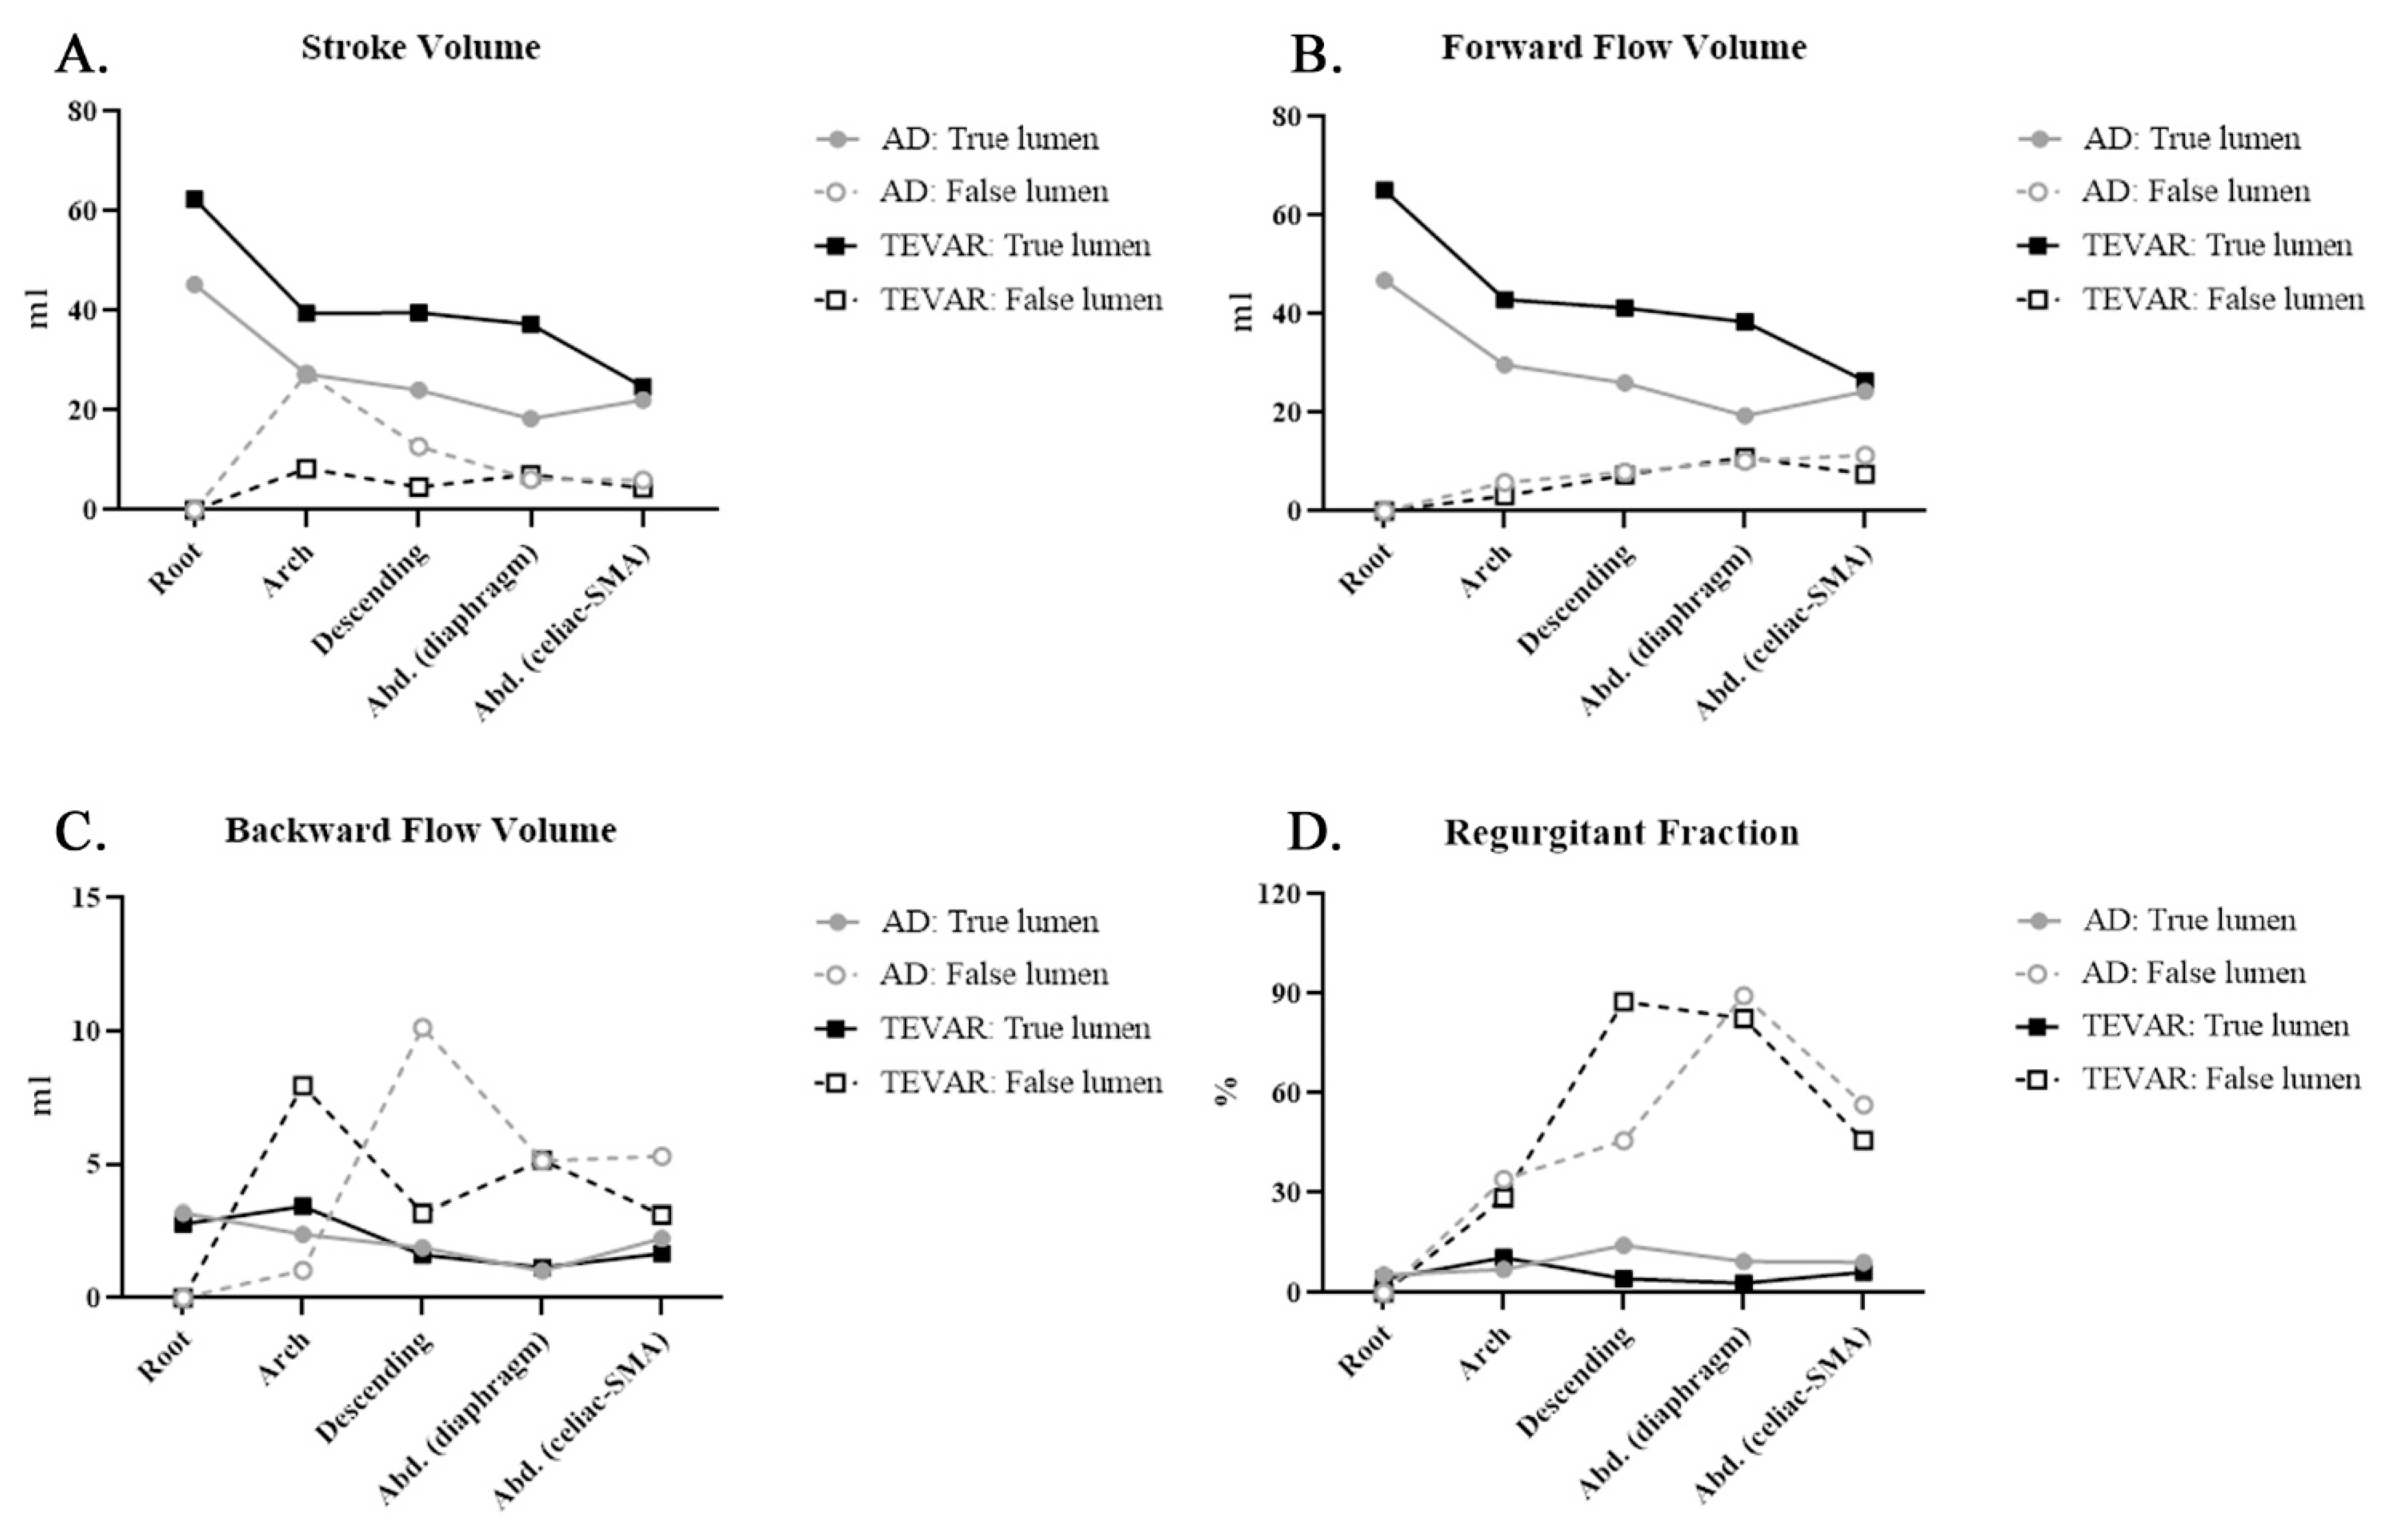
- Stroke volume, mL;The net volume of blood that passes through the contour of ROI during one cardiac cycle.
- Forward flow volume, mL;The volume of blood that passes through the contour of ROI in the positive direction (toward head direction) during one cardiac cycle.
- Backward flow volume, mL;The volume of blood that passes through the contour of ROI in the negative direction (toward foot direction) during one cardiac cycle.
- Regurgitant fraction, %;The fraction of the minor flow to the main flow that passes through the contour of ROI, automatically defined by the computer.
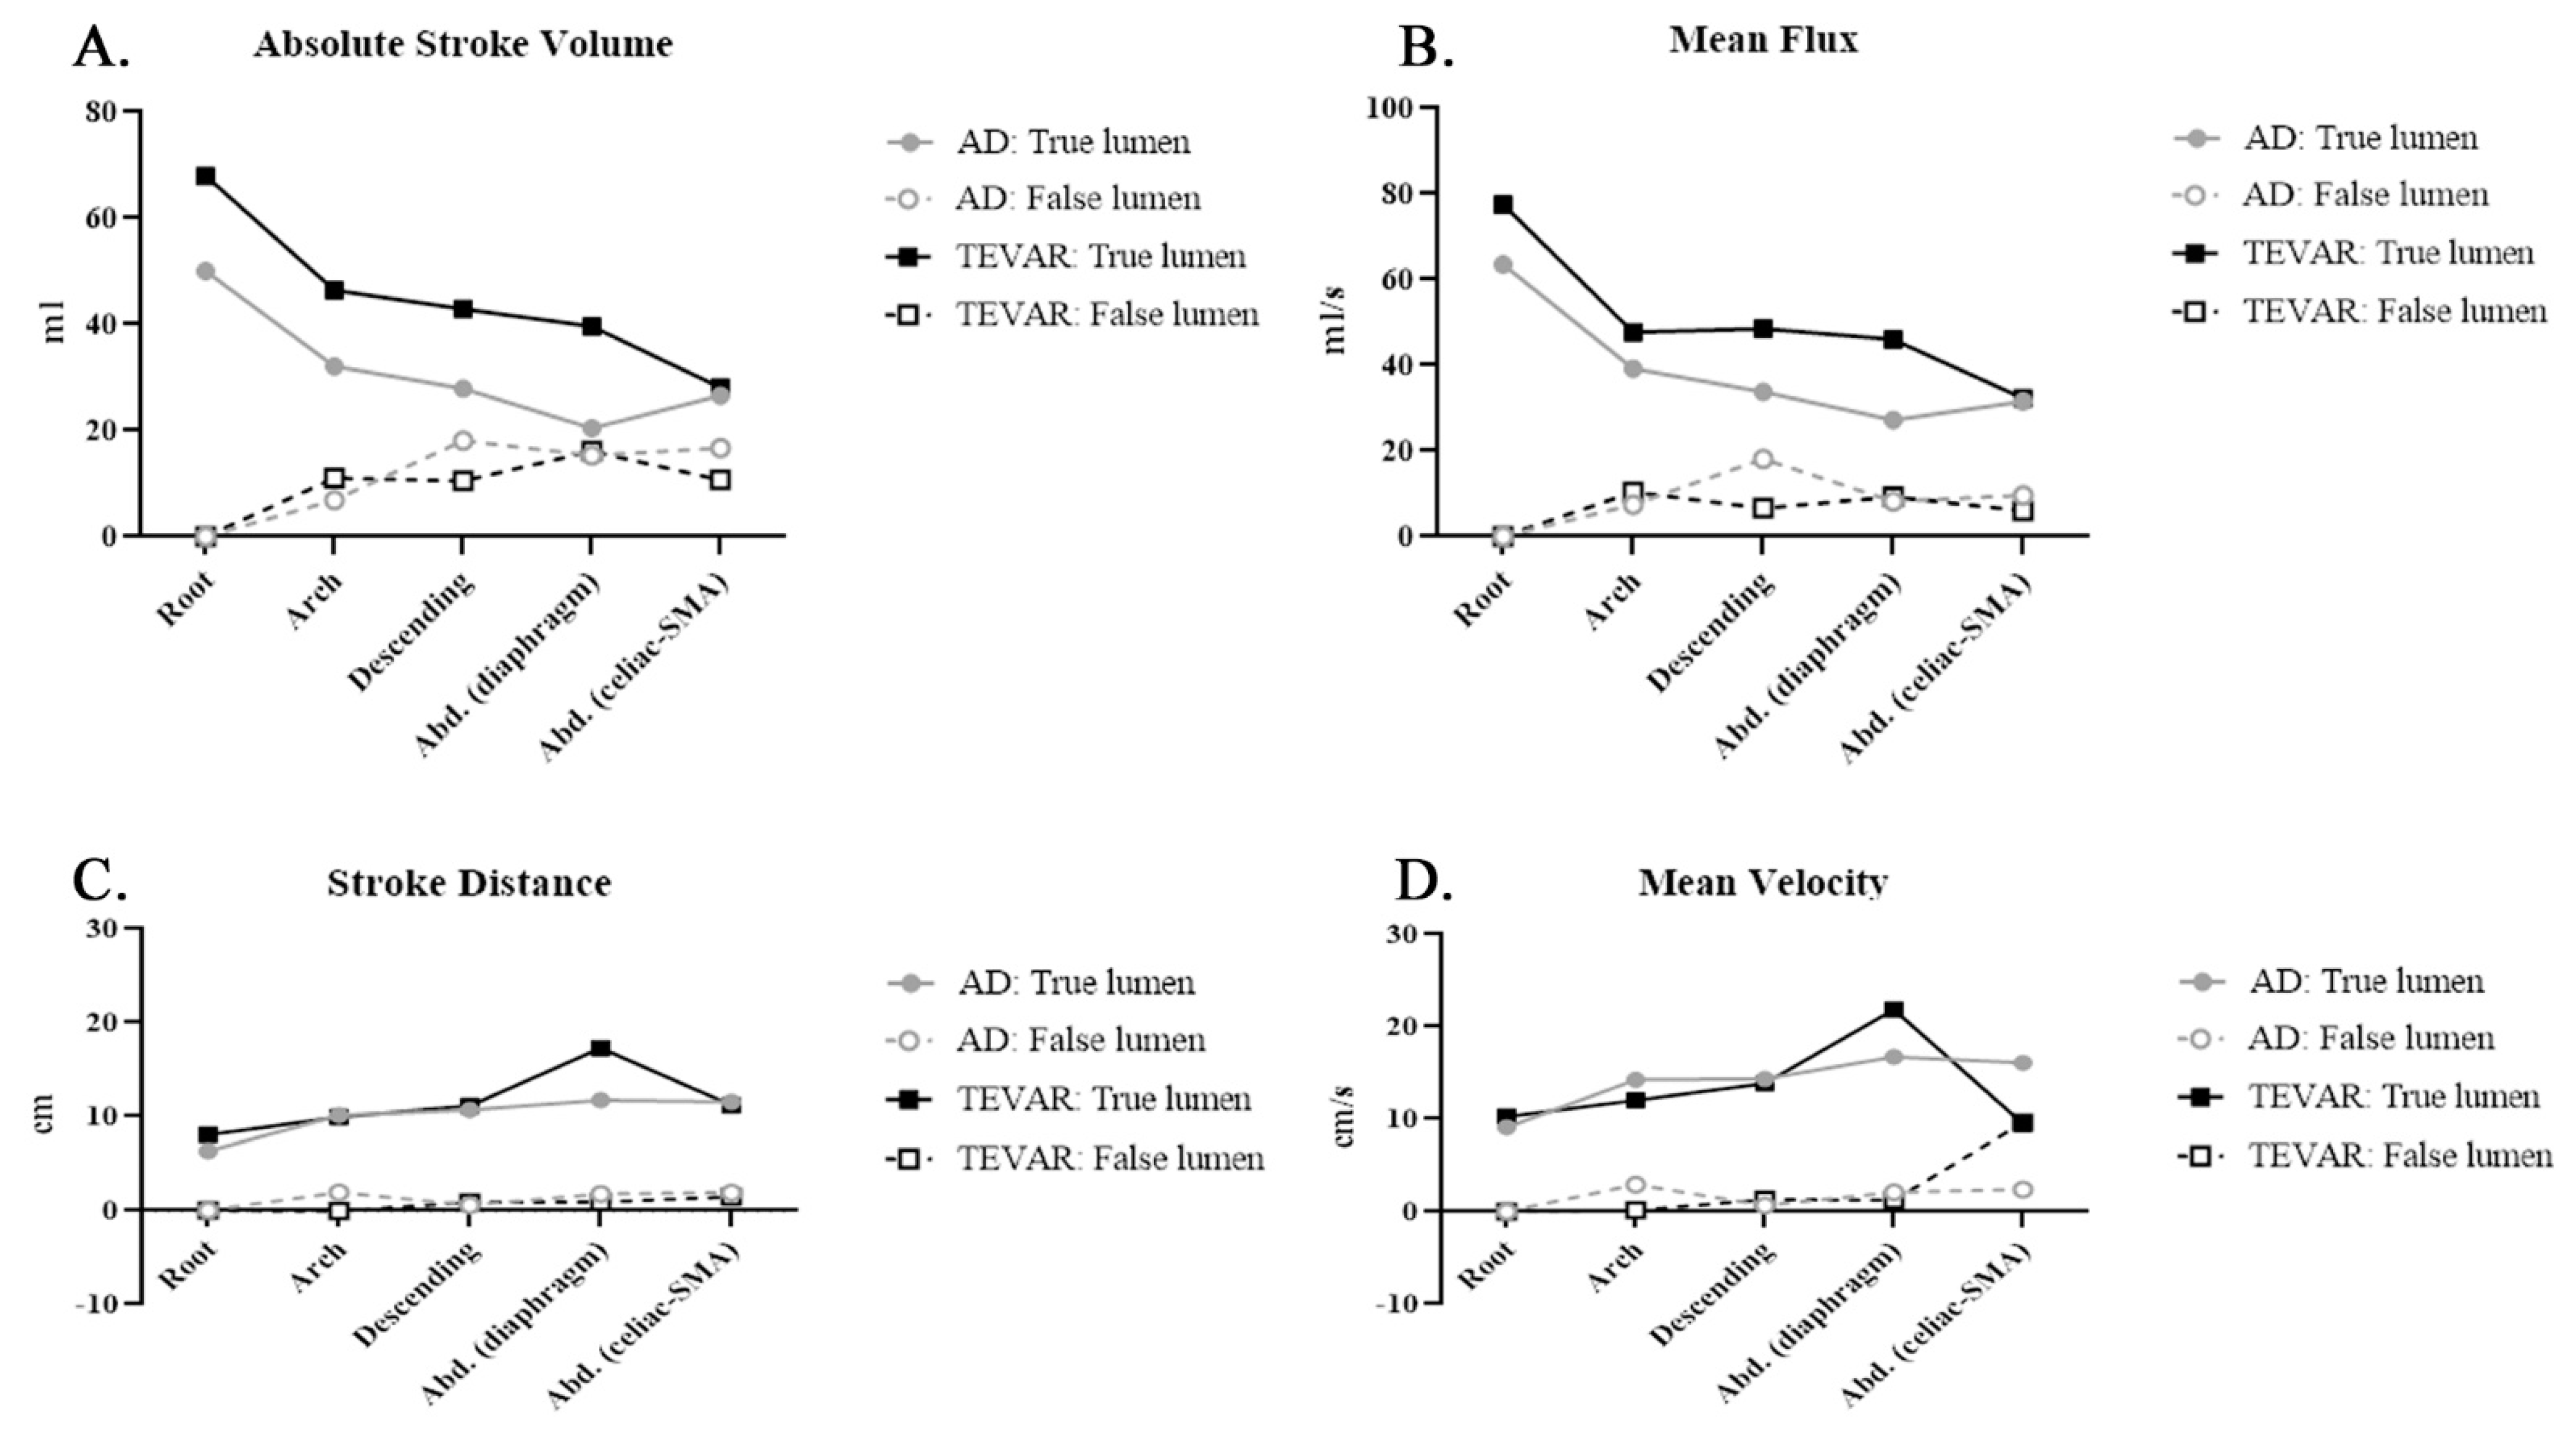
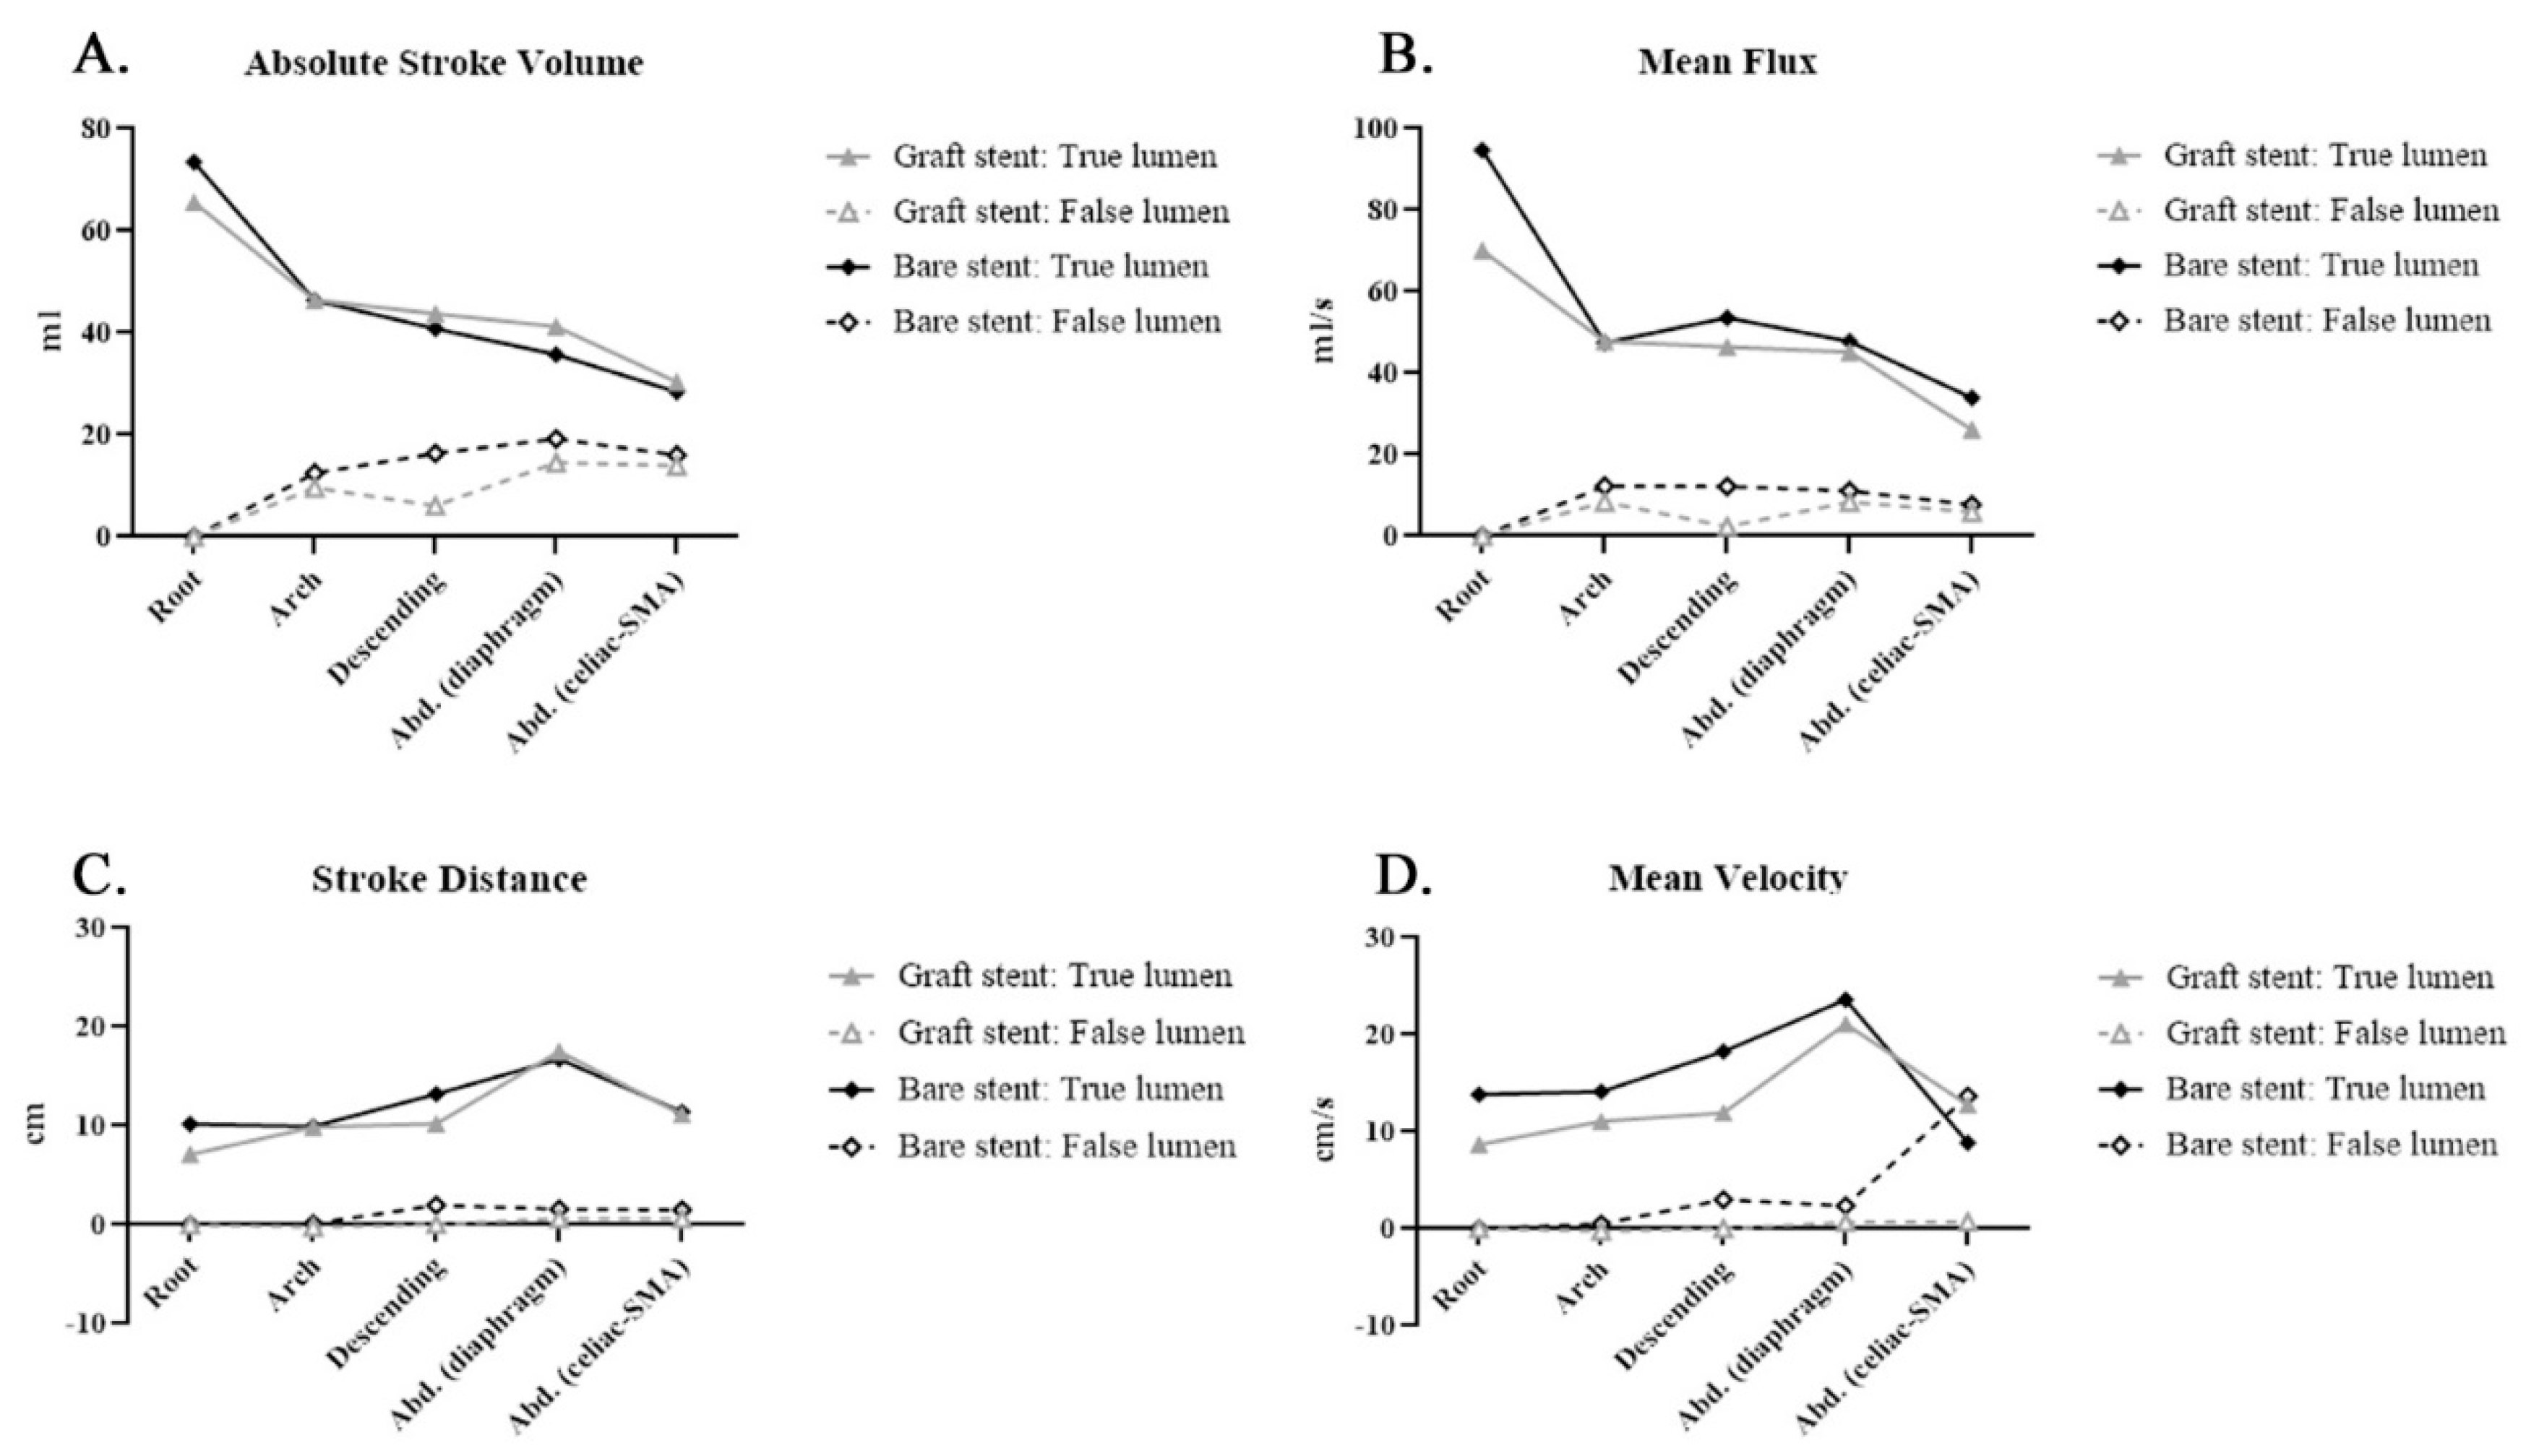
- Absolute stroke volume, mL;The absolute value of forwarding flow volume plus the absolute value of backward flow volume.
- Mean flux, mL/s;Stroke amount x heartbeat/60 (one cardiac cycle).
- Stroke distance, cm;The net distance that blood proceeds in the vessel during one cardiac cycle.
- Mean velocity, cm/s.Stroke distance x heartbeat/60 (one cardiac cycle).
2.3. Statistical Analysis
3. Results
4. Discussion
Study Limitations
5. Conclusions
Supplementary Materials
Author Contributions
Funding
Institutional Review Board Statement
Informed Consent Statement
Data Availability Statement
Conflicts of Interest
Abbreviations
| 4D PC-MRI | Four-dimensional phase-contrast magnetic resonance imaging |
| AD | aortic dissection |
| ASV | absolute stroke volume |
| BFV | backward flow volume |
| CE-MRA | contrast-enhanced magnetic resonance angiogram |
| CTA | computed tomographic aortography |
| FFV | forward flow volume |
| GBCA | gadolinium-based contrast agents |
| MF | mean flux |
| MRI | magnetic resonance imaging |
| MV | mean velocity |
| NSA | number of signals averaged |
| QFlow | quantitative phase-contrast flow measurement |
| RF | regurgitant fraction |
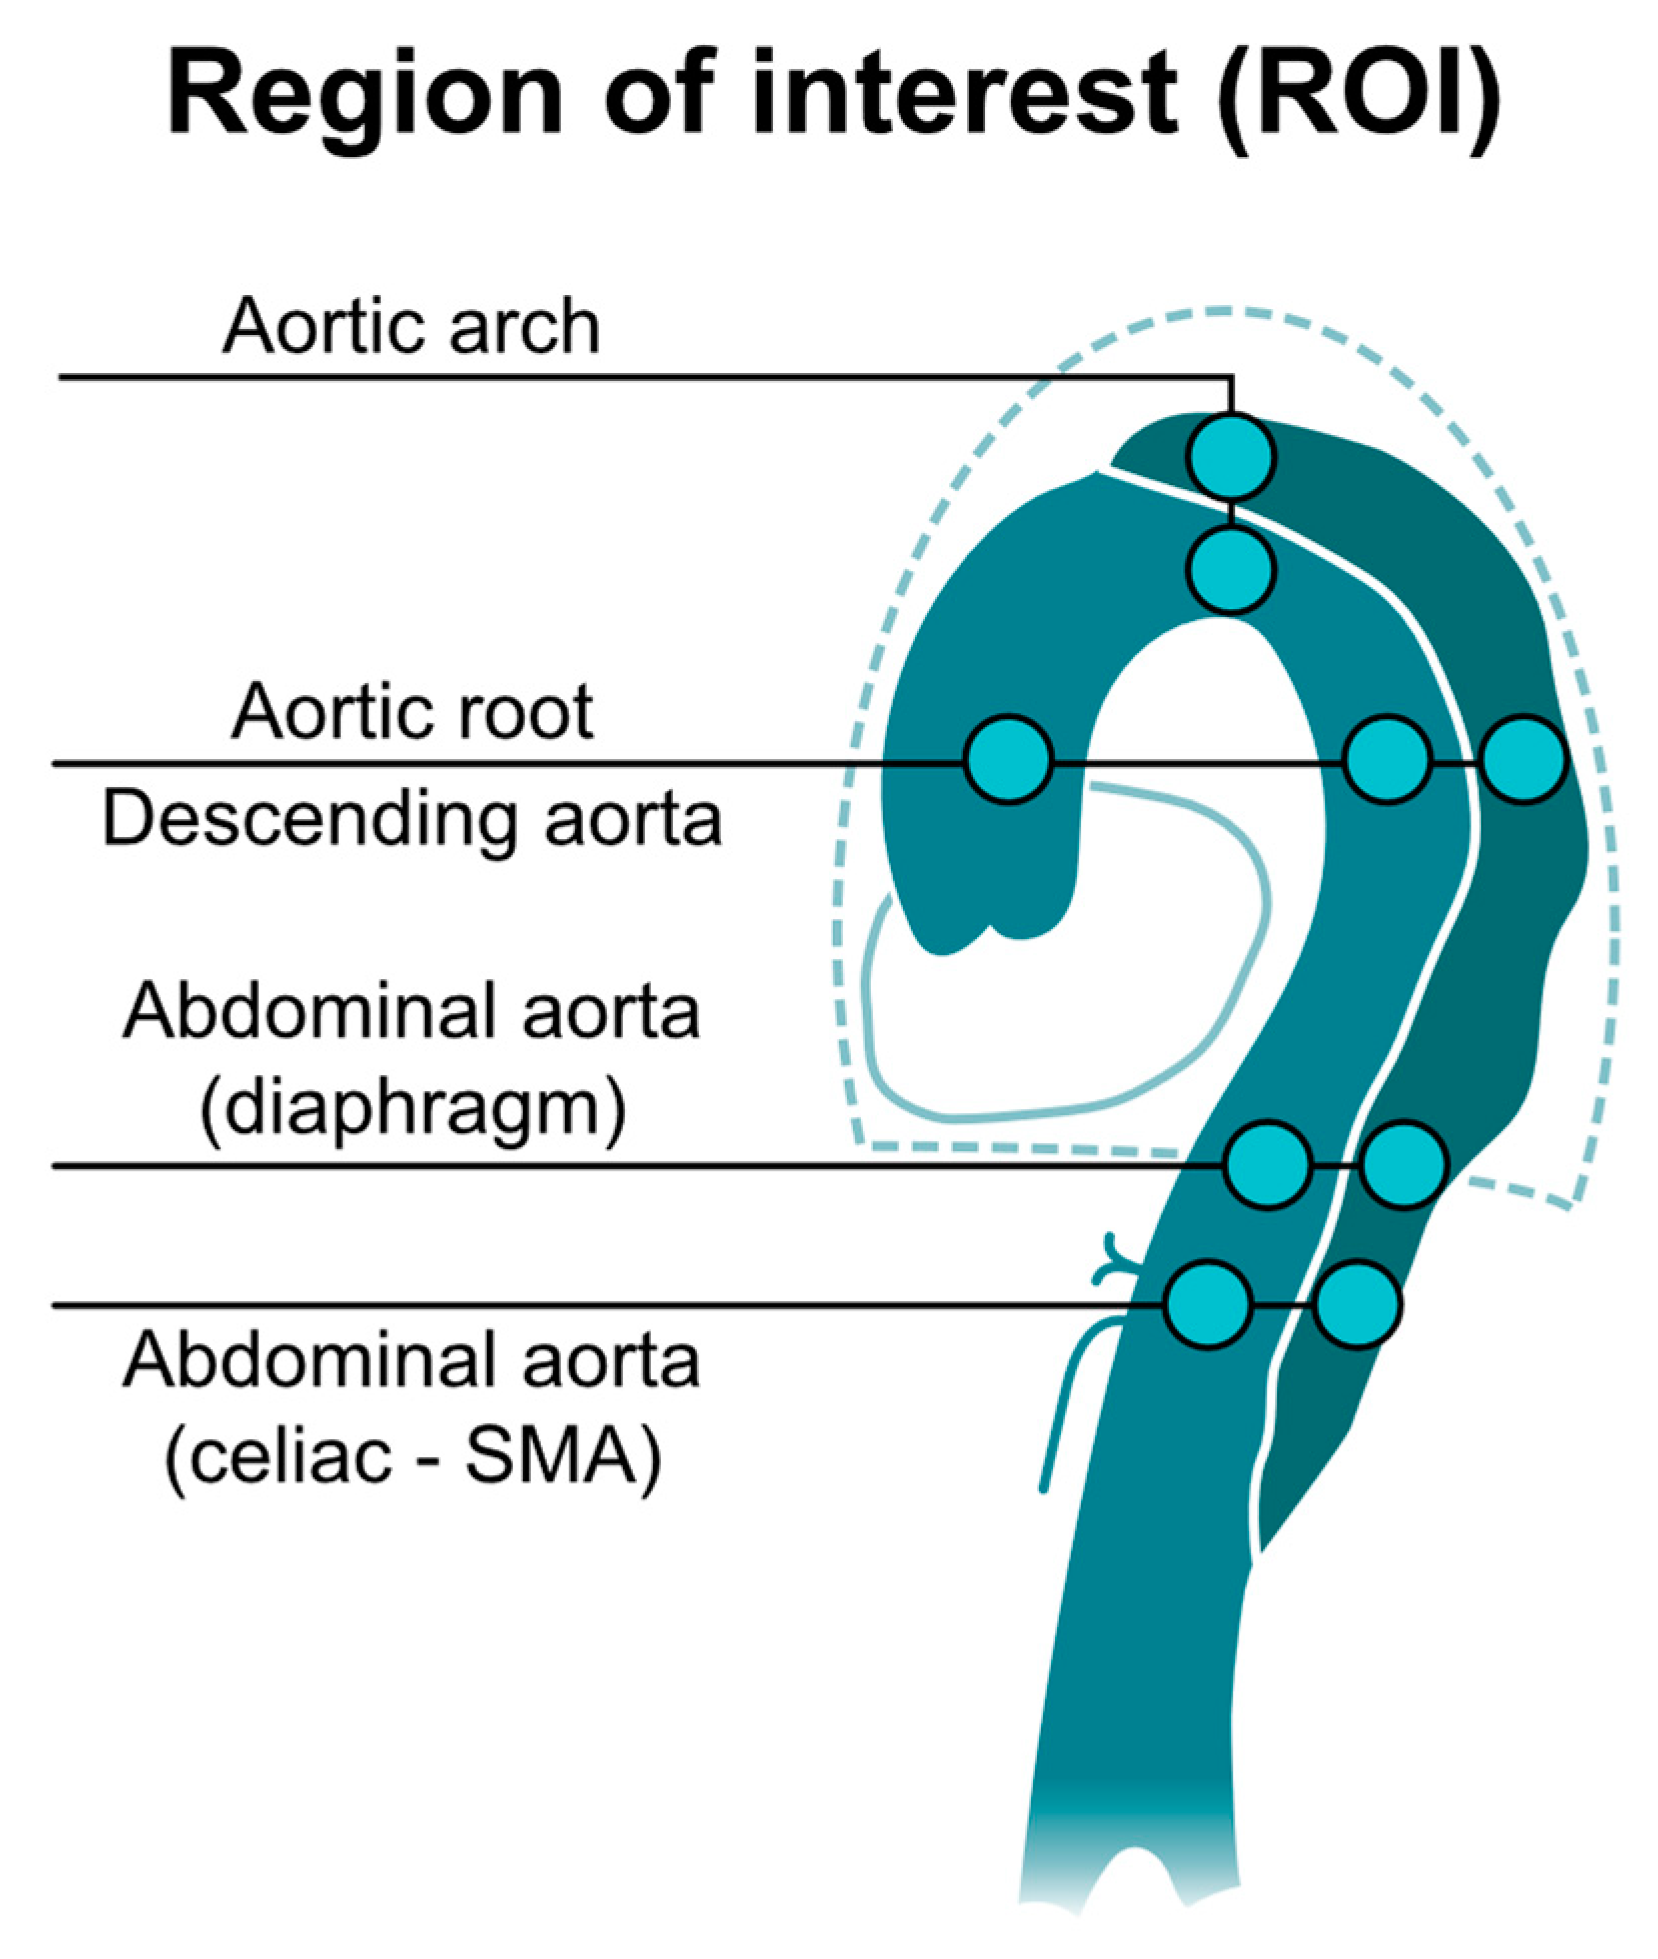
| ROI | region of interest |
| TEVAR | thoracic endovascular aortic repair |
| TE | echo time |
| TFE | turbo field echo |
| TR | repetition time |
| SD | stroke distance |
| SMA | superior mesenteric artery |
| SV | stroke volume |
References
- Lansman, S.L.; Saunders, P.C.; Malekan, R.; Spielvogel, D. Acute aortic syndrome. J. Thorac. Cardiovasc. Surg. 2010, 140, S92–S97. [Google Scholar] [CrossRef] [PubMed] [Green Version]
- Eggebrecht, H.; Plicht, B.; Kahlert, P.; Erbel, R. Intramural Hematoma and Penetrating Ulcers: Indications to Endovascular Treatment. Eur. J. Vasc. Endovasc. Surg. 2009, 38, 659–665. [Google Scholar] [CrossRef] [PubMed] [Green Version]
- Carpenter, S.W.; Kodolitsch, Y.V.; Debus, E.S.; Wipper, S.; Tsilimparis, N.; Larena-Avellaneda, A.; Diener, H.; Kölbel, T. Acute aortic syndromes: Definition, prognosis and treatment options. J. Cardiovasc. Surg. (Torino) 2014, 55, 133–144. [Google Scholar]
- Bossone, E.; LaBounty, T.M.; Eagle, K.A. Acute aortic syndromes: Diagnosis and management, an update. Eur. Hear. J. 2018, 39, 739–749d. [Google Scholar] [CrossRef]
- Higashigaito, K.; Sailer, A.M.; van Kuijk, S.M.; Willemink, M.J.; Hahn, L.D.; Hastie, T.J.; Miller, D.C.; Fischbein, M.P.; Fleischmann, D. Aortic growth and development of partial false lumen thrombosis are associated with late adverse events in type B aortic dissection. J. Thorac. Cardiovasc. Surg. 2021, 161, 1184–1190.e2. [Google Scholar] [CrossRef] [PubMed]
- Cerná, M.; Köcher, M.; Thomas, R.P. Acute aorta, overview of acute CT findings and endovascular treatment options. Biomed. Pap. 2017, 161, 14–23. [Google Scholar] [CrossRef] [Green Version]
- Valente, T.; Rossi, G.; Lassandro, F.; Rea, G.; Marino, M.; Muto, M.; Molino, A.; Scaglione, M. MDCT evaluation of acute aortic syndrome (AAS). Br. J. Radiol. 2016, 89, 20150825. [Google Scholar] [CrossRef] [Green Version]
- DI Eusanio, M.; Russo, V.; Buttazzi, K.; Lovato, L.; Di Bartolomeo, R.; Fattori, R. Endovascular approach for acute aortic syndrome. J. Cardiovasc. Surg. 2010, 51, 305–312. [Google Scholar]
- Smith, A.D.; Schoenhagen, P. CT imaging for acute aortic syndrome. Clevel. Clin. J. Med. 2008, 75, 7–9. [Google Scholar] [CrossRef]
- Schieda, N.; Blaichman, J.I.; Costa, A.F.; Glikstein, R.; Hurrell, C.; James, M.; Maralani, P.J.; Shabana, W.; Tang, A.; Tsampalieros, A.; et al. Gadolinium-Based Contrast Agents in Kidney Disease: A Comprehensive Review and Clinical Practice Guideline Issued by the Canadian Association of Radiologists. Can. J. Kidney Heal. Dis. 2018, 5. [Google Scholar] [CrossRef]
- Khawaja, A.Z.; Cassidy, D.B.; Al Shakarchi, J.; McGrogan, D.G.; Inston, N.G.; Jones, R.G. Revisiting the risks of MRI with Gadolinium based contrast agents—Review of literature and guidelines. Insights Imaging 2015, 6, 553–558. [Google Scholar] [CrossRef] [Green Version]
- Karamitsos, T.D.; Karvounis, H. Magnetic resonance imaging is a safe technique in patients with prosthetic heart valves and coronary stents. Hell. J. Cardiol. 2019, 60, 38–39. [Google Scholar] [CrossRef]
- Baikoussis, N.G.; Apostolakis, E.; Papakonstantinou, N.A.; Sarantitis, I.; Dougenis, D. Safety of Magnetic Resonance Imaging in Patients With Implanted Cardiac Prostheses and Metallic Cardiovascular Electronic Devices. Ann. Thorac. Surg. 2011, 91, 2006–2011. [Google Scholar] [CrossRef]
- Markl, M.; Harloff, A.; Bley, T.A.; Zaitsev, M.; Jung, B.; Weigang, E.; Langer, M.; Hennig, J.; Frydrychowicz, A. Time-resolved 3D MR velocity mapping at 3T: Improved navigator-gated assessment of vascular anatomy and blood flow. J. Magn. Reson. Imaging 2007, 25, 824–831. [Google Scholar] [CrossRef]
- Stalder, A.; Russe, M.; Frydrychowicz, A.; Bock, J.; Hennig, J.; Markl, M. Quantitative 2D and 3D phase contrast MRI: Optimized analysis of blood flow and vessel wall parameters. Magn. Reson. Med. 2008, 60, 1218–1231. [Google Scholar] [CrossRef]
- Chen, C.-W.; Tseng, Y.-H.; Wong, M.; Lin, Y.-H.; Yang, T.-Y.; Hsu, Y.-C.; Lin, B.-S.; Huang, Y.-K. Using Non-Contrast MRA to Discriminate between Obstructive and Nonobstructive Venous Diseases of the Legs. Diagnostics 2021, 11, 1392. [Google Scholar] [CrossRef]
- Chen, C.-W.; Tseng, Y.-H.; Lin, C.-C.; Kao, C.-C.; Wong, M.Y.; Ting, H.; Huang, Y.-K. Aortic dissection assessment by 4D phase-contrast MRI with hemodynamic parameters: The impact of stent type. Quant. Imaging Med. Surg. 2021, 11, 490–501. [Google Scholar] [CrossRef]
- Chen, C.-W.; Tseng, Y.-H.; Fang, Y.-F.; Wong, M.; Lin, Y.-H.; Huang, Y.-K. Superficial Venous Reflux Intervention Guided by Triggered Angiography Non-Contrast-Enhanced Sequence Magnetic Resonance Imaging: Different QFlow Pattern from Health Controls. J. Pers. Med. 2021, 11, 751. [Google Scholar] [CrossRef]
- Tawfik, A.M.; Elsorogy, L.; Abdelghaffar, R.; Naby, A.A.; Elmenshawi, I. Phase-Contrast MRI CSF Flow Measurements for the Diagnosis of Normal-Pressure Hydrocephalus: Observer Agreement of Velocity Versus Volume Parameters. Am. J. Roentgenol. 2017, 208, 838–843. [Google Scholar] [CrossRef]
- Von Spiczak, J.; Crelier, G.; Giese, D.; Kozerke, S.; Maintz, D.; Bunck, A.C. Quantitative Analysis of Vortical Blood Flow in the Thoracic Aorta Using 4D Phase Contrast MRI. PLoS ONE 2015, 10, e0139025. [Google Scholar] [CrossRef] [Green Version]
- Tsai, T.T.; Schlicht, M.S.; Khanafer, K.; Bull, J.L.; Valassis, D.T.; Williams, D.M.; Berguer, R.; Eagle, K.A. Tear size and location impacts false lumen pressure in an ex vivo model of chronic type B aortic dissection. J. Vasc. Surg. 2008, 47, 844–851. [Google Scholar] [CrossRef] [Green Version]
- Rudenick, P.A.; Bijnens, B.; García-Dorado, D.; Evangelista, A. An in vitro phantom study on the influence of tear size and configuration on the hemodynamics of the lumina in chronic type B aortic dissections. J. Vasc. Surg. 2013, 57, 464–474.e5. [Google Scholar] [CrossRef] [Green Version]
- Cheng, Z.; Riga, C.; Chan, J.; Hamady, M.; Wood, N.B.; Cheshire, N.J.; Xu, Y.; Gibbs, R.G. Initial findings and potential applicability of computational simulation of the aorta in acute type B dissection. J. Vasc. Surg. 2013, 57, 35S–43S. [Google Scholar] [CrossRef] [Green Version]
- Qing, K.-X.; Chan, Y.-C.; Ting, A.; Cheng, S. Persistent Intraluminal Pressure After Endovascular Stent Grafting for Type B Aortic Dissection. Eur. J. Vasc. Endovasc. Surg. 2016, 51, 656–663. [Google Scholar] [CrossRef] [Green Version]
- Dillon-Murphy, D.; Noorani, A.; Nordsletten, D.; Figueroa, C.A. Multi-modality image-based computational analysis of haemodynamics in aortic dissection. Biomech. Model. Mechanobiol. 2016, 15, 857–876. [Google Scholar] [CrossRef] [Green Version]
- Rudenick, P.A.; Segers, P.; Pineda, V.; Cuéllar, H.; Garcia-Dorado, D.; Evangelista, A.; Bijnens, B.H. False Lumen Flow Patterns and their Relation with Morphological and Biomechanical Characteristics of Chronic Aortic Dissections. Computational Model Compared with Magnetic Resonance Imaging Measurements. PLoS ONE 2017, 12, e0170888. [Google Scholar] [CrossRef] [Green Version]
- François, C.J.; Markl, M.; Schiebler, M.; Niespodzany, E.; Landgraf, B.R.; Schlensak, C.; Frydrychowicz, A. Four-dimensional, flow-sensitive magnetic resonance imaging of blood flow patterns in thoracic aortic dissections. J. Thorac. Cardiovasc. Surg. 2013, 145, 1359–1366. [Google Scholar] [CrossRef] [Green Version]
- Clough, R.E.; Waltham, M.; Giese, D.; Taylor, P.R.; Schaeffter, T. A new imaging method for assessment of aortic dissection using four-dimensional phase contrast magnetic resonance imaging. J. Vasc. Surg. 2012, 55, 914–923. [Google Scholar] [CrossRef] [PubMed] [Green Version]
- Castañer, E.; Andreu, M.; Gallardo, X.; Mata, J.M.; Cabezuelo, M.Á.; Pallardó, Y. CT in Nontraumatic Acute Thoracic Aortic Disease: Typical and Atypical Features and Complications. Radiographics 2003, 23, S93–S110. [Google Scholar] [CrossRef] [Green Version]
- Thoongsuwan, N.; Stern, E.J. Chest CT scanning for clinical suspected thoracic aortic dissection: Beware the alternate diagnosis. Emerg. Radiol. 2002, 9, 257–261. [Google Scholar] [CrossRef]
- Yoo, S.M.; Lee, H.Y.; White, C.S. MDCT Evaluation of Acute Aortic Syndrome. Radiol. Clin. N. Am. 2010, 48, 67–83. [Google Scholar] [CrossRef] [PubMed]
- McMahon, M.A.; Squirrell, C.A. Multidetector CT of Aortic Dissection: A Pictorial Review. Radiographics 2010, 30, 445–460. [Google Scholar] [CrossRef]
- Hasebroock, K.M.; Serkova, N.J. Toxicity of MRI and CT contrast agents. Expert Opin. Drug Metab. Toxicol. 2009, 5, 403–416. [Google Scholar] [CrossRef] [PubMed]
- Sun, J.; Zhang, Q.; Hu, D.; Shen, Y.; Yang, H.; Chen, C.; Zhou, Z.; Peng, Y. Feasibility study of using one-tenth mSv radiation dose in young children chest CT with 80 kVp and model-based iterative reconstruction. Sci. Rep. 2019, 9, 12481–12487. [Google Scholar] [CrossRef]
- Kataria, B.; Althén, J.N.; Smedby, Ö.; Persson, A.; Sökjer, H.; Sandborg, M. Image quality and pathology assessment in CT Urography: When is the low-dose series sufficient? BMC Med Imaging 2019, 19, 64. [Google Scholar] [CrossRef] [PubMed]
- Carriero, A.; Magarelli, N.; Padovano, F.; Baratto, M.; Fossaceca, R.; Bonomo, L. Magnetic resonance angiography of the origins of the supraaortic arteries: Comparison of single and double volume acquisition 3D time of flight. J. Neuroradiol. 1996, 23, 62–68. [Google Scholar] [PubMed]
- Yucel, E.K.; Kaufman, J.A.; Geller, S.C.; Waltman, A.C. Atherosclerotic occlusive disease of the lower extremity: Prospective evaluation with two-dimensional time-of-flight MR angiography. Radiology 1993, 187, 637–641. [Google Scholar] [CrossRef] [PubMed]
- Clough, R.E.; Hussain, T.; Uribe, S.; Greil, G.F.; Razavi, R.; Taylor, P.R.; Schaeffter, T.; Waltham, M. A new method for quantification of false lumen thrombosis in aortic dissection using magnetic resonance imaging and a blood pool contrast agent. J. Vasc. Surg. 2011, 54, 1251–1258. [Google Scholar] [CrossRef]
- Sträter, A.; Huber, A.; Rudolph, J.; Berndt, M.; Rasper, M.; Rummeny, E.J.; Nadjiri, J. 4D-Flow MRI: Technique and Applications. RöFo-Fortschr. Geb. Röntgenstrahlen Bildgeb. Verfahr. 2018, 190, 1025–1035. [Google Scholar] [CrossRef] [Green Version]
- Liu, D.; Fan, Z.; Li, Y.; Zhang, N.; Sun, Z.; An, J.; Stalder, A.F.; Greiser, A.; Liu, J. Quantitative Study of Abdominal Blood Flow Patterns in Patients with Aortic Dissection by 4-Dimensional Flow MRI. Sci. Rep. 2018, 8, 9111. [Google Scholar] [CrossRef]
- Takei, Y.; Itatani, K.; Miyazaki, S.; Shibasaki, I.; Fukuda, H. Four-dimensional flow magnetic resonance imaging analysis before and after thoracic endovascular aortic repair of chronic type B aortic dissection. Interact. Cardiovasc. Thorac. Surg. 2018, 28, 413–420. [Google Scholar] [CrossRef] [PubMed]
- Juffermans, J.F.; Westenberg, J.J.; Boogaard, P.J.; Roest, A.A.; van Assen, H.C.; van der Palen, R.L.; Lamb, H.J. Reproducibility of Aorta Segmentation on 4D Flow MRI in Healthy Volunteers. J. Magn. Reson. Imaging 2021, 53, 1268–1279. [Google Scholar] [CrossRef]
- Wentland, A.L. Editorial for Reproducibility of Aorta Segmentation on 4D Flow MRI in Healthy Volunteers. J. Magn. Reson. Imaging 2021, 53, 1280–1281. [Google Scholar] [CrossRef] [PubMed]
- Marlevi, D.; Sotelo, J.A.; Grogan-Kaylor, R.; Ahmed, Y.; Uribe, S.; Patel, H.J.; Edelman, E.R.; Nordsletten, D.A.; Burris, N.S. False lumen pressure estimation in type B aortic dissection using 4D flow cardiovascular magnetic resonance: Comparisons with aortic growth. J. Cardiovasc. Magn. Reson. 2021, 23, 51. [Google Scholar] [CrossRef]
- Burris, N.S.; Patel, H.J.; Hope, M.D. Retrograde flow in the false lumen: Marker of a false lumen under stress? J. Thorac. Cardiovasc. Surg. 2019, 157, 488–491. [Google Scholar] [CrossRef]
- Burris, N.S.; Nordsletten, D.A.; Sotelo, J.A.; Grogan-Kaylor, R.; Houben, I.B.; Figueroa, C.A.; Uribe, S.; Patel, H.J. False lumen ejection fraction predicts growth in type B aortic dissection: Preliminary results. Eur. J. Cardio-Thorac. Surg. 2020, 57, 896–903. [Google Scholar] [CrossRef]


| Age | Sex | Comorbidities | Aortic Disease | Aortic Surgery before This Intervention | Why Intervention | Stent Type | EVAR and Adjuvant Procedure | |
|---|---|---|---|---|---|---|---|---|
| 1 | 52 | M | HTN, PKD | Type B aortic dissection with dilation | No | Aneurysmal change | Gore TAG | No |
| 2 | 56 | M | HTN | Aortic arch dissecting aneurysms | Total arch replacement with branches graft and intraoperative TEVAR. | Aneurysmal change | Gore TAG | No |
| 3 | 50 | M | HTN DM PKD | Type B aortic dissection | Femo-femoral bypass | Aneurysmal change | Gore TAG | Carotid to carotid bypass |
| 4 | 38 | M | HTN renal stone spine surgery | Type B aortic dissection | TEVAR for type B aortic dissection | Severe back pain due to aortic dissection | Gore TAG | No |
| 5 | 51 | M | HTN, CVA | Type B aortic dissection | No | Aneurysmal change of aorta | Gore TAG | No |
| 6 | 76 | M | HTN, GBS | Aortic-dissecting aneurysm | Ascending aortic replacement for acute type A aortic dissection | Aneurysmal change | Gore TAG | Left carotid arterial preservation with chimney procedure by 10 mm Viahbamnn cover stent |
| 7 | 46 | M | HTN, CAD, COPD, CRF | Aortic-dissecting aneurysm | Total arch replacement with branches graft and intraoperative TEVAR. | Severe back pain due to aortic dissection | Gore TAG | No |
| 8 | 53 | M | HTN | Acute Type A aortic dissection | Hemiarch replacement with innominate artery replantation for acute type A aortic dissection | Post-op malperfusion with ischemic bowel | Cook Zenith® dissection endovascular stents | No |
| 9 | 52 | M | HTN | Acute Type A aortic dissection | Ascending aortic replacement for acute type A aortic dissection | Post-op malperfusion with ischemic bowel | Cook Zenith® dissection endovascular stents | SMA by Gore Viahbann 7 mm/5 cm |
| 10 | 39 | M | HTN | Acute Type A aortic dissection | Ascending aortic replacement for acute type A aortic dissection | Post-op malperfusion with ischemic bowel and ileus | Cook Zenith® dissection endovascular stents | No |
| QFlow | Segment | True Lumen | False Lumen | ||||
|---|---|---|---|---|---|---|---|
| AD | TEVAR | p-Value | AD | TEVAR | p-Value | ||
| SV | Root | 45.28 ± 23.89 | 62.41 ± 22.08 | 0.122 | |||
| Arch | 27.32 ± 12.38 | 39.51 ± 22.87 | 0.206 | 27.32 ± 12.38 | 8.35 ± 7.50 | 0.981 | |
| Descending | 24.13 ± 13.79 | 39.64 ± 13.73 | 0.52 | 12.76 ± 18.02 | 4.66 ± 5.27 | 0.676 | |
| Abdominal (diaphragm) | 18.35 ± 15.52 | 37.3 ± 13.84 | 0.79 | 6.16 ± 8.35 | 7.18 ± 5.98 | 0.834 | |
| Abdominal (celiac-SMA) | 22.07 ± 5.48 | 24.78 ± 11.41 | 0.079 | 6.06 ± 5.00 | 4.44 ± 3.29 | 0.072 | |
| FFV | Root | 46.85 ± 25.96 | 65.2 ± 22.18 | 0.1 | |||
| Arch | 29.72 ± 13.44 | 42.96 ± 20.57 | 0.173 | 5.86 ± 5.07 | 3.09 ± 4.31 | 0.012 * | |
| Descending | 26.02 ± 12.42 | 41.27 ± 13.38 | 0.425 | 7.99 ± 5.60 | 7.35 ± 6.96 | 0.052 | |
| Abdominal (diaphragm) | 19.38 ± 15.40 | 38.46 ± 13.89 | 0.81 | 10.15 ± 10.40 | 10.95 ± 7.05 | 0.504 | |
| Abdominal (celiac-SMA) | 24.32 ± 5.39 | 26.46 ± 12.13 | 0.047 * | 11.37 ± 8.77 | 7.56 ± 5.10 | 0.256 | |
| BFV | Root | 3.2 ± 2.92 | 2.79 ± 3.82 | 0.007 * | |||
| Arch | 2.39 ± 2.22 | 3.45 ± 5.35 | 0.724 | 1.05 ± 0.99 | 7.96 ± 8.17 | 0.355 | |
| Descending | 1.89 ± 2.36 | 1.62 ± 2.53 | 0.535 | 10.14 ± 18.95 | 3.18 ± 1.49 | 0.935 | |
| Abdominal (diaphragm) | 1.02 ± 1.24 | 1.16 ± 1.74 | 0.299 | 5.14 ± 4.42 | 5.16 ± 2.76 | 0.743 | |
| Abdominal (celiac-SMA) | 2.25 ± 2.65 | 1.67 ± 1.16 | 0.735 | 5.31 ± 4.19 | 3.12 ± 2.06 | 0.717 | |
| RF | Root | 5.45 ± 4.71 | 4.2 ± 5.25 | 0.231 | |||
| Arch | 7.01 ± 6.37 | 10.67 ± 17.85 | 0.522 | 34.07 ± 34.80 | 28.53 ± 33.34 | 0.718 | |
| Descending | 14.4 ± 30.40 | 4.21 ± 6.45 | 0.839 | 45.70 ±40.15 | 87.64 ± 72.95 | 0.22 | |
| Abdominal (diaphragm) | 9.45 ± 14.41 | 2.96 ± 4.41 | 0.883 | 89.47 ± 59.37 | 82.52 ± 81.14 | 0.200 | |
| Abdominal (celiac-SMA) | 9.3 ± 10.79 | 6.25 ± 5.23 | 0.355 | 56.58± 24.59 | 45.75 ± 12.93 | 0.607 | |
| ASV | Root | 50.05 ± 25.82 | 67.99 ± 22.93 | 0.068 | |||
| Arch | 32.11 ± 14.76 | 46.41 ± 19.50 | 0.162 | 6.92 ± 4.70 | 11.05 ± 7.69 | 0.811 | |
| Descending | 27.92 ± 11.37 | 42.89 ± 13.49 | 0.324 | 18.11 ± 16.52 | 10.53 ± 8.27 | 0.946 | |
| Abdominal (diaphragm) | 20.4 ± 15.37 | 39.61 ± 14.14 | 0.85 | 15.29 ± 13.09 | 16.12 ± 7.64 | 0.175 | |
| Abdominal (celiac-SMA) | 26.57 ± 6.49 | 28.13 ± 12.92 | 0.182 | 16.68 ± 12.81 | 10.68 ± 7.05 | 0.395 | |
| MF | Root | 63.53 ± 39.03 | 77.55 ± 28.39 | 0.057 | |||
| Arch | 39.22 ± 25.08 | 47.71 ± 26.12 | 0.147 | 7.49 ± 8.41 | 10.34 ± 9.13 | 0.906 | |
| Descending | 33.79 ± 24.18 | 48.58 ± 15.58 | 0.32 | 18.1 ± 26.16 | 6.59 ± 8.09 | 0.75 | |
| Abdominal (diaphragm) | 27.21 ± 28.77 | 46.02 ± 15.62 | 0.797 | 8.21 ± 10.08 | 9.28 ± 7.75 | 0.707 | |
| Abdominal (celiac-SMA) | 31.54 ± 9.91 | 32.31 ± 13.94 | 0.205 | 9.62 ± 9.81 | 6.02 ± 5.06 | 0.093 | |
| SD | Root | 6.33 ± 6.62 | 8.05 ± 2.39 | 0.05 | |||
| Arch | 10.11 ± 3.51 | 9.91 ± 4.16 | 0.18 | 1.95 ± 3.03 | −0.06 ± 2.84 | 0.132 | |
| Descending | 10.68 ± 5.46 | 11.12 ± 3.42 | 0.018 * | 0.59 ± 3.81 | 0.87 ± 1.52 | 0.366 | |
| Abdominal (diaphragm) | 11.72 ± 6.22 | 17.29 ± 4.41 | 0.613 | 1.78 ± 4.32 | 0.93 ± 1.32 | 0.404 | |
| Abdominal (celiac-SMA) | 11.54 ± 5.70 | 11.18 ± 3.98 | 0.015 * | 1.91 ± 1.59 | 1.48 ± 1.01 | 0.007 * | |
| MV | Root | 9.08 ± 8.92 | 10.24 ± 3.63 | 0.033 * | |||
| Arch | 14.26 ± 6.80 | 12.02 ± 5.65 | 0.073 | 2.94 ± 4.48 | 0.14 ± 3.79 | 0.098 | |
| Descending | 14.37 ± 7.24 | 13.84 ± 5.04 | 0.007 * | 0.67 ± 5.36 | 1.3 ± 2.32 | 0.326 | |
| Abdominal (diaphragm) | 16.08 ± 10.83 | 21.86± 6.30 | 0.371 | 2.1 ± 4.61 | 1.25 ± 1.8.4 | 0.704 | |
| Abdominal (celiac-SMA) | 16.09 ± 8.02 | 9.49 ± 4.25 | 0.109 | 2.4 ± 2.18 | 9.63 ± 14.5 | 0.349 | |
| QFlow | Segment | True Lumen | False Lumen | ||||
|---|---|---|---|---|---|---|---|
| Graft Stent | Bare Stent | p-Value | Graft Stent | Bare Stent | p-Value | ||
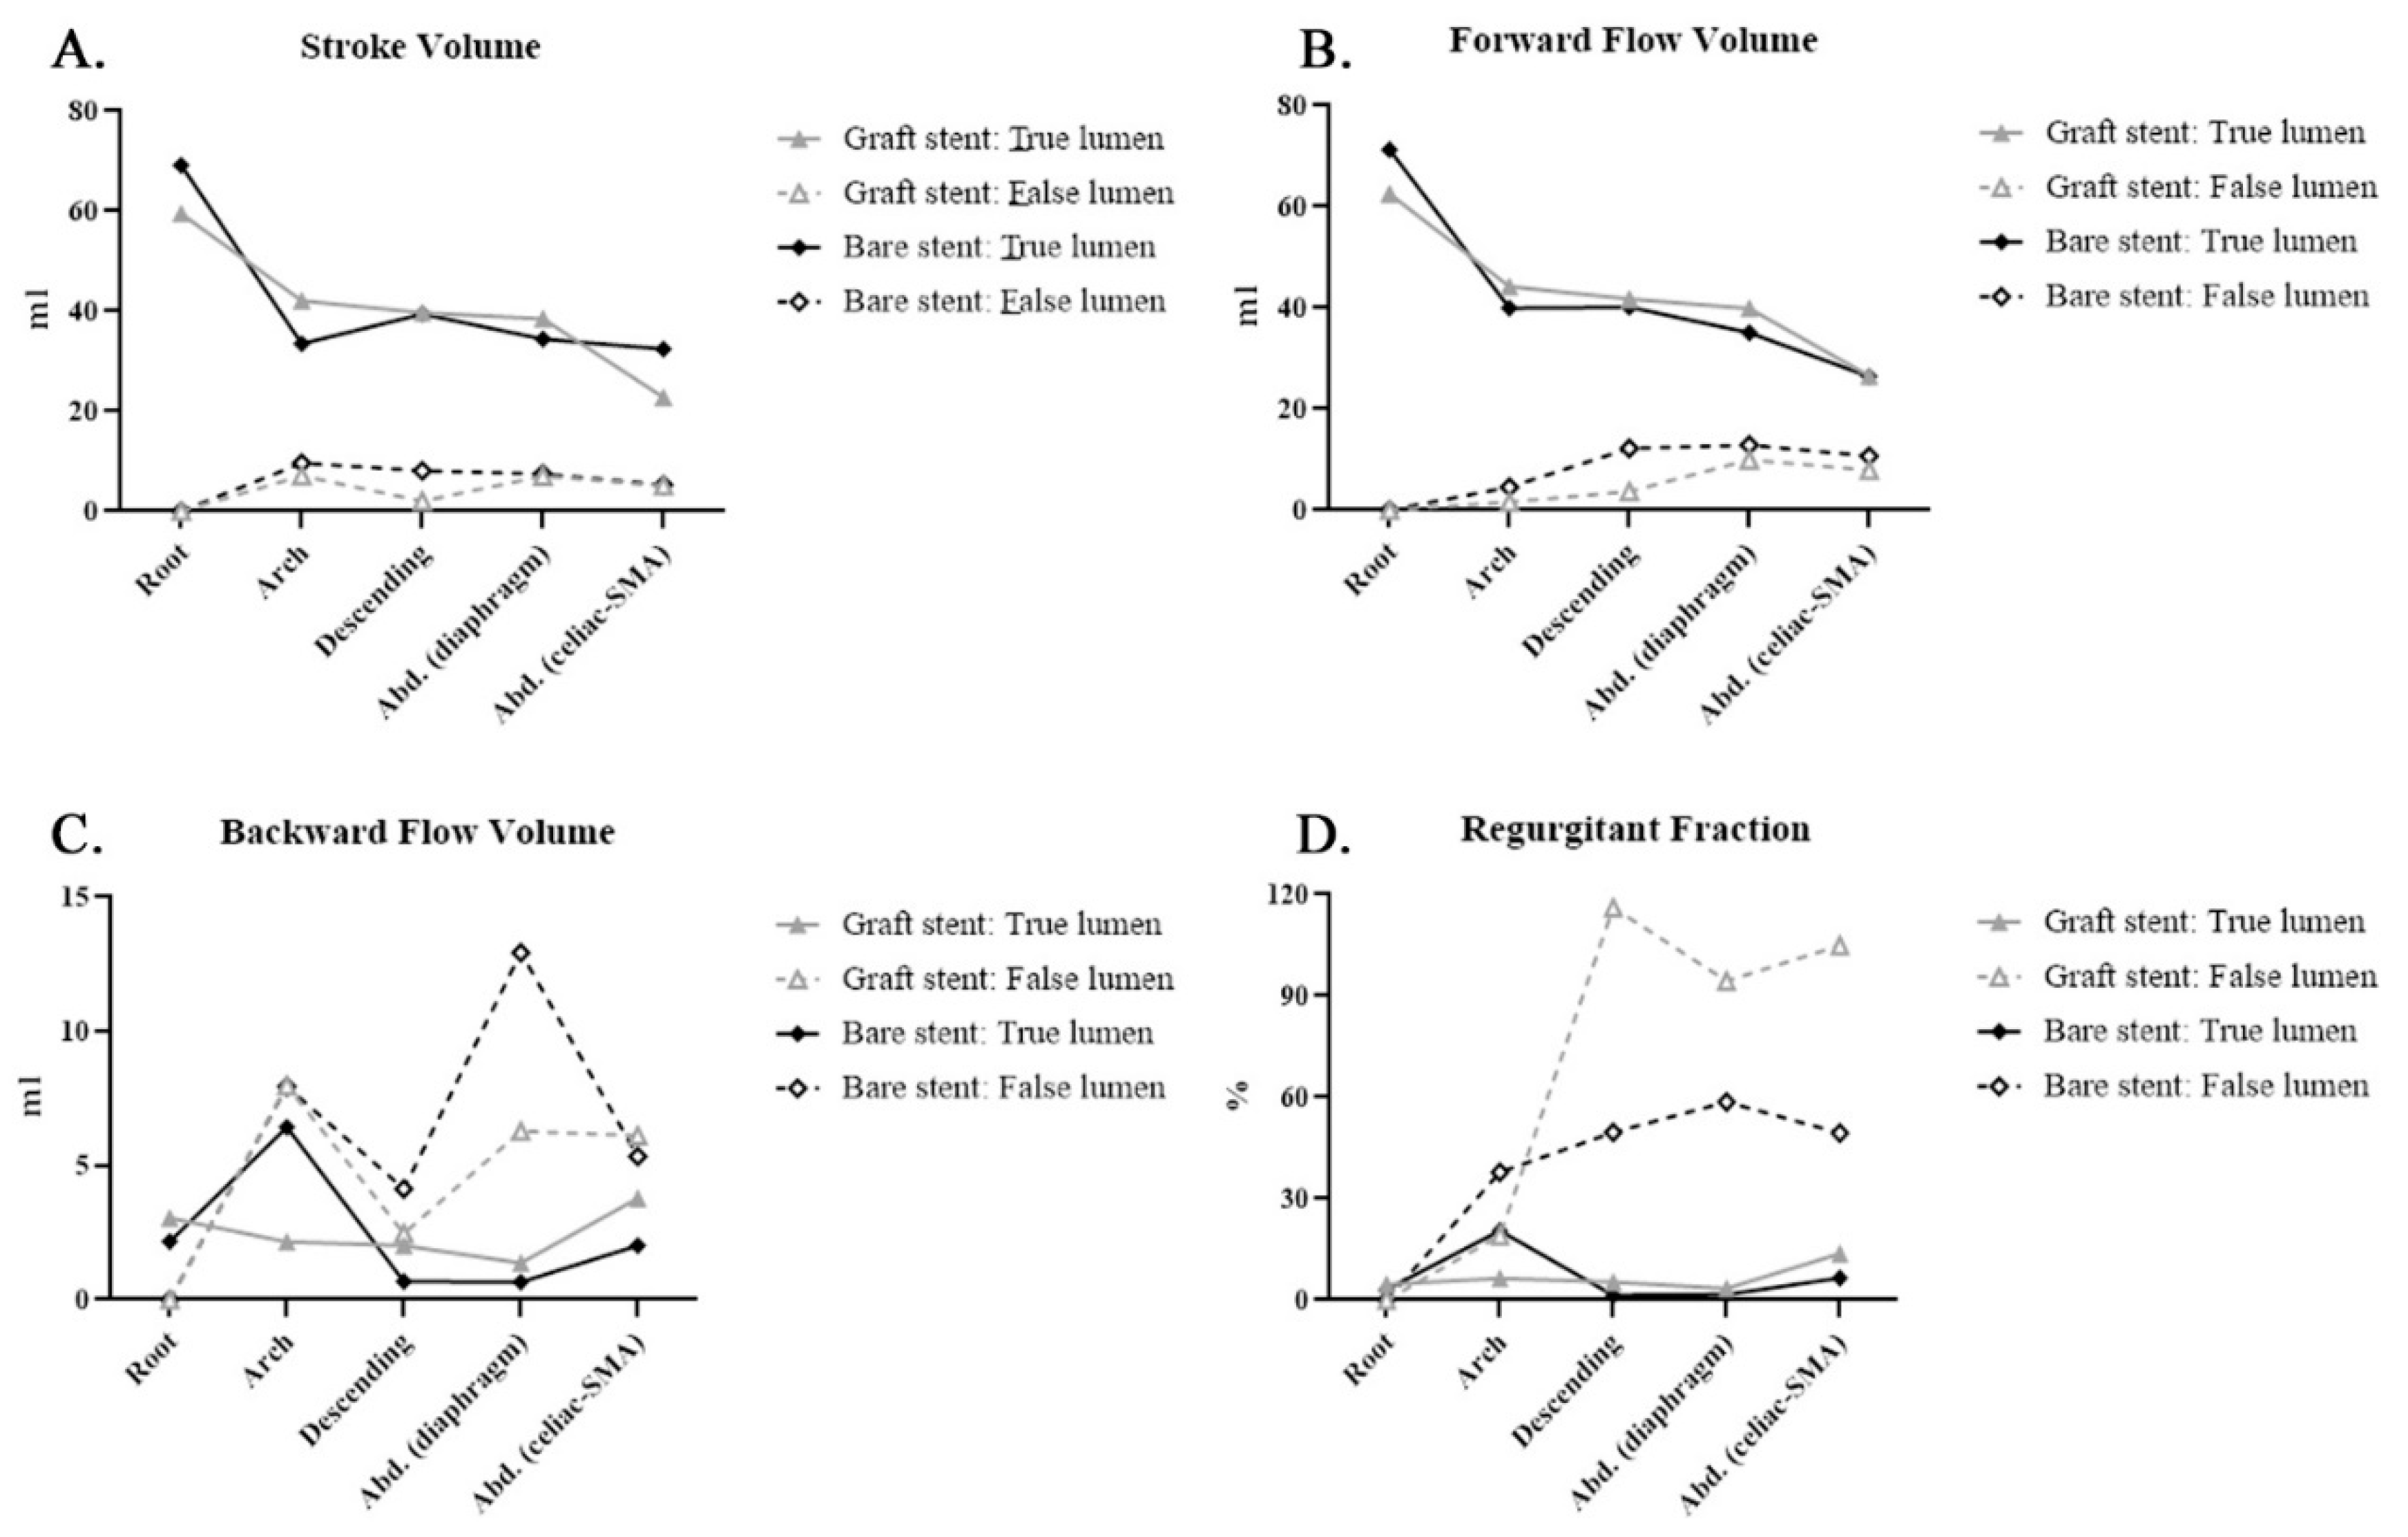
| SV | Root | 59.51 ± 26.03 | 69.17 ± 7.9 | 0.558 | |||
| Arch | 42.08 ± 24.54 | 33.51 ± 21.65 | 0.617 | 7.1 ± 6.5 | 9.61 ± 9.68 | 0.728 | |
| Descending | 39.72 ± 15.83 | 39.46 ± 9.87 | 0.98 | 2.06 ± 1.74 | 8.13 ± 6.87 | 0.263 | |
| Abdominal (diaphragm) | 38.52 ± 16.54 | 34.46 ± 4.88 | 0.696 | 7.03 ± 6.74 | 7.5 ± 5.4 | 0.919 | |
| Abdominal (celiac-SMA) | 22.78 ± 7.62 | 32.4 ± 9.14 | 0.784 | 5.13 ± 4.75 | 5.3 ± 2.25 | 0.965 | |
| FFV | Root | 62.56 ± 26.34 | 71.33 ± 7.23 | 0.597 | |||
| Arch | 44.25 ± 23.49 | 39. 95± 15.09 | 0.782 | 1.62 ± 1.10 | 4.55 ± 6.25 | 0.504 | |
| Descending | 41.75 ± 15.22 | 40.14 ± 10.39 | 0.874 | 3.67 ± 3.40 | 12.26 ± 7.84 | 0.107 | |
| Abdominal (diaphragm) | 39.90 ± 16.47 | 35.11 ± 5.51 | 0.646 | 9.95 ± 8.34 | 12.94 ± 4.00 | 0.585 | |
| Abdominal (celiac-SMA) | 26.56 ± 8.10 | 26.43 ± 10.35 | 0.984 | 7.88 ± 5.65 | 10.67± 0.68 | 0.533 | |
| BFV | Root | 3.05 ± 4.61 | 2.16 ± 1.04 | 0.757 | |||
| Arch | 2.16 ± 2.53 | 6.44 ± 9.52 | 0.271 | 7.98 ± 8.15 | 7.94 ± 10.02 | 0.996 | |
| Descending | 2.02 ± 2.91 | 0.68 ± 1.18 | 0.457 | 2.47 ± 1.36 | 4.13 ± 1.22 | 0.158 | |
| Abdominal (diaphragm) | 1.37 ± 1.98 | 0.65 ± 1.37 | 0.581 | 6.28 ± 2.91 | 12.93 ± 4.00 | 0.472 | |
| Abdominal (celiac-SMA) | 3.78 ± 3.15 | 2.02 ± 2.15 | 0.419 | 6.12 ± 4.61 | 5.35 ± 2.93 | 0.837 | |
| RF | Root | 4.66 ± 6.29 | 3.12 ± 1.72 | 0.697 | |||
| Arch | 6.46 ± 8.36 | 20.51 ± 31.88 | 0.526 | 19.17 ± 13.49 | 37.89 ± 48.32 | 0.553 | |
| Descending | 5.37 ± 7.40 | 1.49 ±2.57 | 0.415 | 116.13 ± 84.54 | 49.66 ± 38.14 | 0.268 | |
| Abdominal (diaphragm) | 3.5 ± 5.02 | 1.68 ± 2.91 | 0.581 | 94.47± 95.14 | 58.62 ± 49.22 | 0.568 | |
| Abdominal (celiac-SMA) | 13.78 ± 11.27 | 6.58 ± 7.27 | 0.354 | 104.93 ±75.65 | 49.46 ± 24.38 | 0.368 | |
| ASV | Root | 65.62 ± 27.43 | 73.51 ± 6.66 | 0.647 | |||
| Arch | 46.41 ± 22.68 | 46.38 ± 12.95 | 0.999 | 9.61 ± 8.82 | 12.49 ± 7.98 | 0.697 | |
| Descending | 43.77 ± 15.16 | 40.83 ± 11.02 | 0.772 | 6.13 ± 4.91 | 16.4 ± 8.88 | 0.104 | |
| Abdominal (diaphragm) | 41.25 ± 16.61 | 35.78 ±6.29 | 0.604 | 14.57 ± 9.17 | 19.22 ± 1.26 | 0.273 | |
| Abdominal (celiac-SMA) | 30.35 ±9.63 | 28.45 ± 11.85 | 0.802 | 13.40 ± 7.46 | 16.02 ±3.61 | 0.734 | |
| MF | Root | 70.16 ± 30.83 | 94.8 ± 11.79 | 0.228 | |||
| Arch | 47.83 ± 25.74 | 47.43 ± 32.9 | 0.984 | 8.39 ± 7.93 | 12.28 ± 11.58 | 0.657 | |
| Descending | 46.43 ± 17.35 | 53.6 ± 11.63 | 0.537 | 2.41 ± 2.10 | 12.18 ± 10.39 | 0.234 | |
| Abdominal (diaphragm) | 45.24 ± 18.75 | 47.83 ± 6.04 | 0.826 | 8.35 ± 8.08 | 11.14 ± 8.33 | 0.643 | |
| Abdominal (celiac-SMA) | 26.1 ± 8.20 | 33.98 ± 12.62 | 0.287 | 5.94 ± 5.70 | 7.7 ± 4.60 | 0.711 | |
| SD | Root | 7.13 ± 2.02 | 10.19 ± 1.87 | 0.056 | |||
| Arch | 9.89 ± 3.61 | 9.94 ± 6.22 | 0.987 | −0.23 ± 0.58 | 0.1 ± 4.44 | 0.907 | |
| Descending | 10.22 ± 3.75 | 13.2 ± 1.04 | 0.226 | 0.04 ± 0.42 | 1.98 ± 1.85 | 0.089 | |
| Abdominal (diaphragm) | 17.53 ± 5.17 | 16.74 ± 2.52 | 0.811 | 0.61 ± 1.24 | 1.58 ± 1.50 | 0.328 | |
| Abdominal (celiac-SMA) | 11.15 ± 2.84 | 11.42 ± 4.53 | 0.916 | 0.61 ± 2.00 | 1.52 ± 0.90 | 0.571 | |
| MV | Root | 8.68 ± 3.11 | 13.86 ± 1.38 | 0.027 * | |||
| Arch | 11.1 ± 3.86 | 14.16 ± 9.43 | 0.464 | −0.22 ± 0.74 | 0.5 ± 5.91 | 0.843 | |
| Descending | 11.94 ± 4.48 | 18.28 ± 3.44 | 0.062 | 0.03 ± 0.5 | 3 ± 2.87 | 0.090 | |
| Abdominal (diaphragm) | 21.12 ± 6.74 | 23.6 ± 6.02 | 0.599 | 0.68 ± 1.52 | 2.39 ± 2.22 | 0.208 | |
| Abdominal (celiac-SMA) | 12.78 ± 3.07 | 8.89 ± 4.75 | 0.173 | 0.71 ± 2.35 | 13.7 ± 17.88 | 0.081 | |
Publisher’s Note: MDPI stays neutral with regard to jurisdictional claims in published maps and institutional affiliations. |
© 2021 by the authors. Licensee MDPI, Basel, Switzerland. This article is an open access article distributed under the terms and conditions of the Creative Commons Attribution (CC BY) license (https://creativecommons.org/licenses/by/4.0/).
Share and Cite
Chen, C.-W.; Fang, Y.-F.; Tseng, Y.-H.; Wong, M.Y.; Lin, Y.-H.; Hsu, Y.-C.; Lin, B.-S.; Huang, Y.-K. Before and after Endovascular Aortic Repair in the Same Patients with Aortic Dissection: A Cohort Study of Four-Dimensional Phase-Contrast Magnetic Resonance Imaging. Diagnostics 2021, 11, 1912. https://doi.org/10.3390/diagnostics11101912
Chen C-W, Fang Y-F, Tseng Y-H, Wong MY, Lin Y-H, Hsu Y-C, Lin B-S, Huang Y-K. Before and after Endovascular Aortic Repair in the Same Patients with Aortic Dissection: A Cohort Study of Four-Dimensional Phase-Contrast Magnetic Resonance Imaging. Diagnostics. 2021; 11(10):1912. https://doi.org/10.3390/diagnostics11101912
Chicago/Turabian StyleChen, Chien-Wei, Yueh-Fu Fang, Yuan-Hsi Tseng, Min Yi Wong, Yu-Hui Lin, Yin-Chen Hsu, Bor-Shyh Lin, and Yao-Kuang Huang. 2021. "Before and after Endovascular Aortic Repair in the Same Patients with Aortic Dissection: A Cohort Study of Four-Dimensional Phase-Contrast Magnetic Resonance Imaging" Diagnostics 11, no. 10: 1912. https://doi.org/10.3390/diagnostics11101912
APA StyleChen, C.-W., Fang, Y.-F., Tseng, Y.-H., Wong, M. Y., Lin, Y.-H., Hsu, Y.-C., Lin, B.-S., & Huang, Y.-K. (2021). Before and after Endovascular Aortic Repair in the Same Patients with Aortic Dissection: A Cohort Study of Four-Dimensional Phase-Contrast Magnetic Resonance Imaging. Diagnostics, 11(10), 1912. https://doi.org/10.3390/diagnostics11101912