Bringing Data Analytics to the Design of Optimized Diagnostic Networks in Low- and Middle-Income Countries: Process, Terms and Definitions

 , , , , and
Abstract
1. Diagnostics: An Essential Health Systems Component
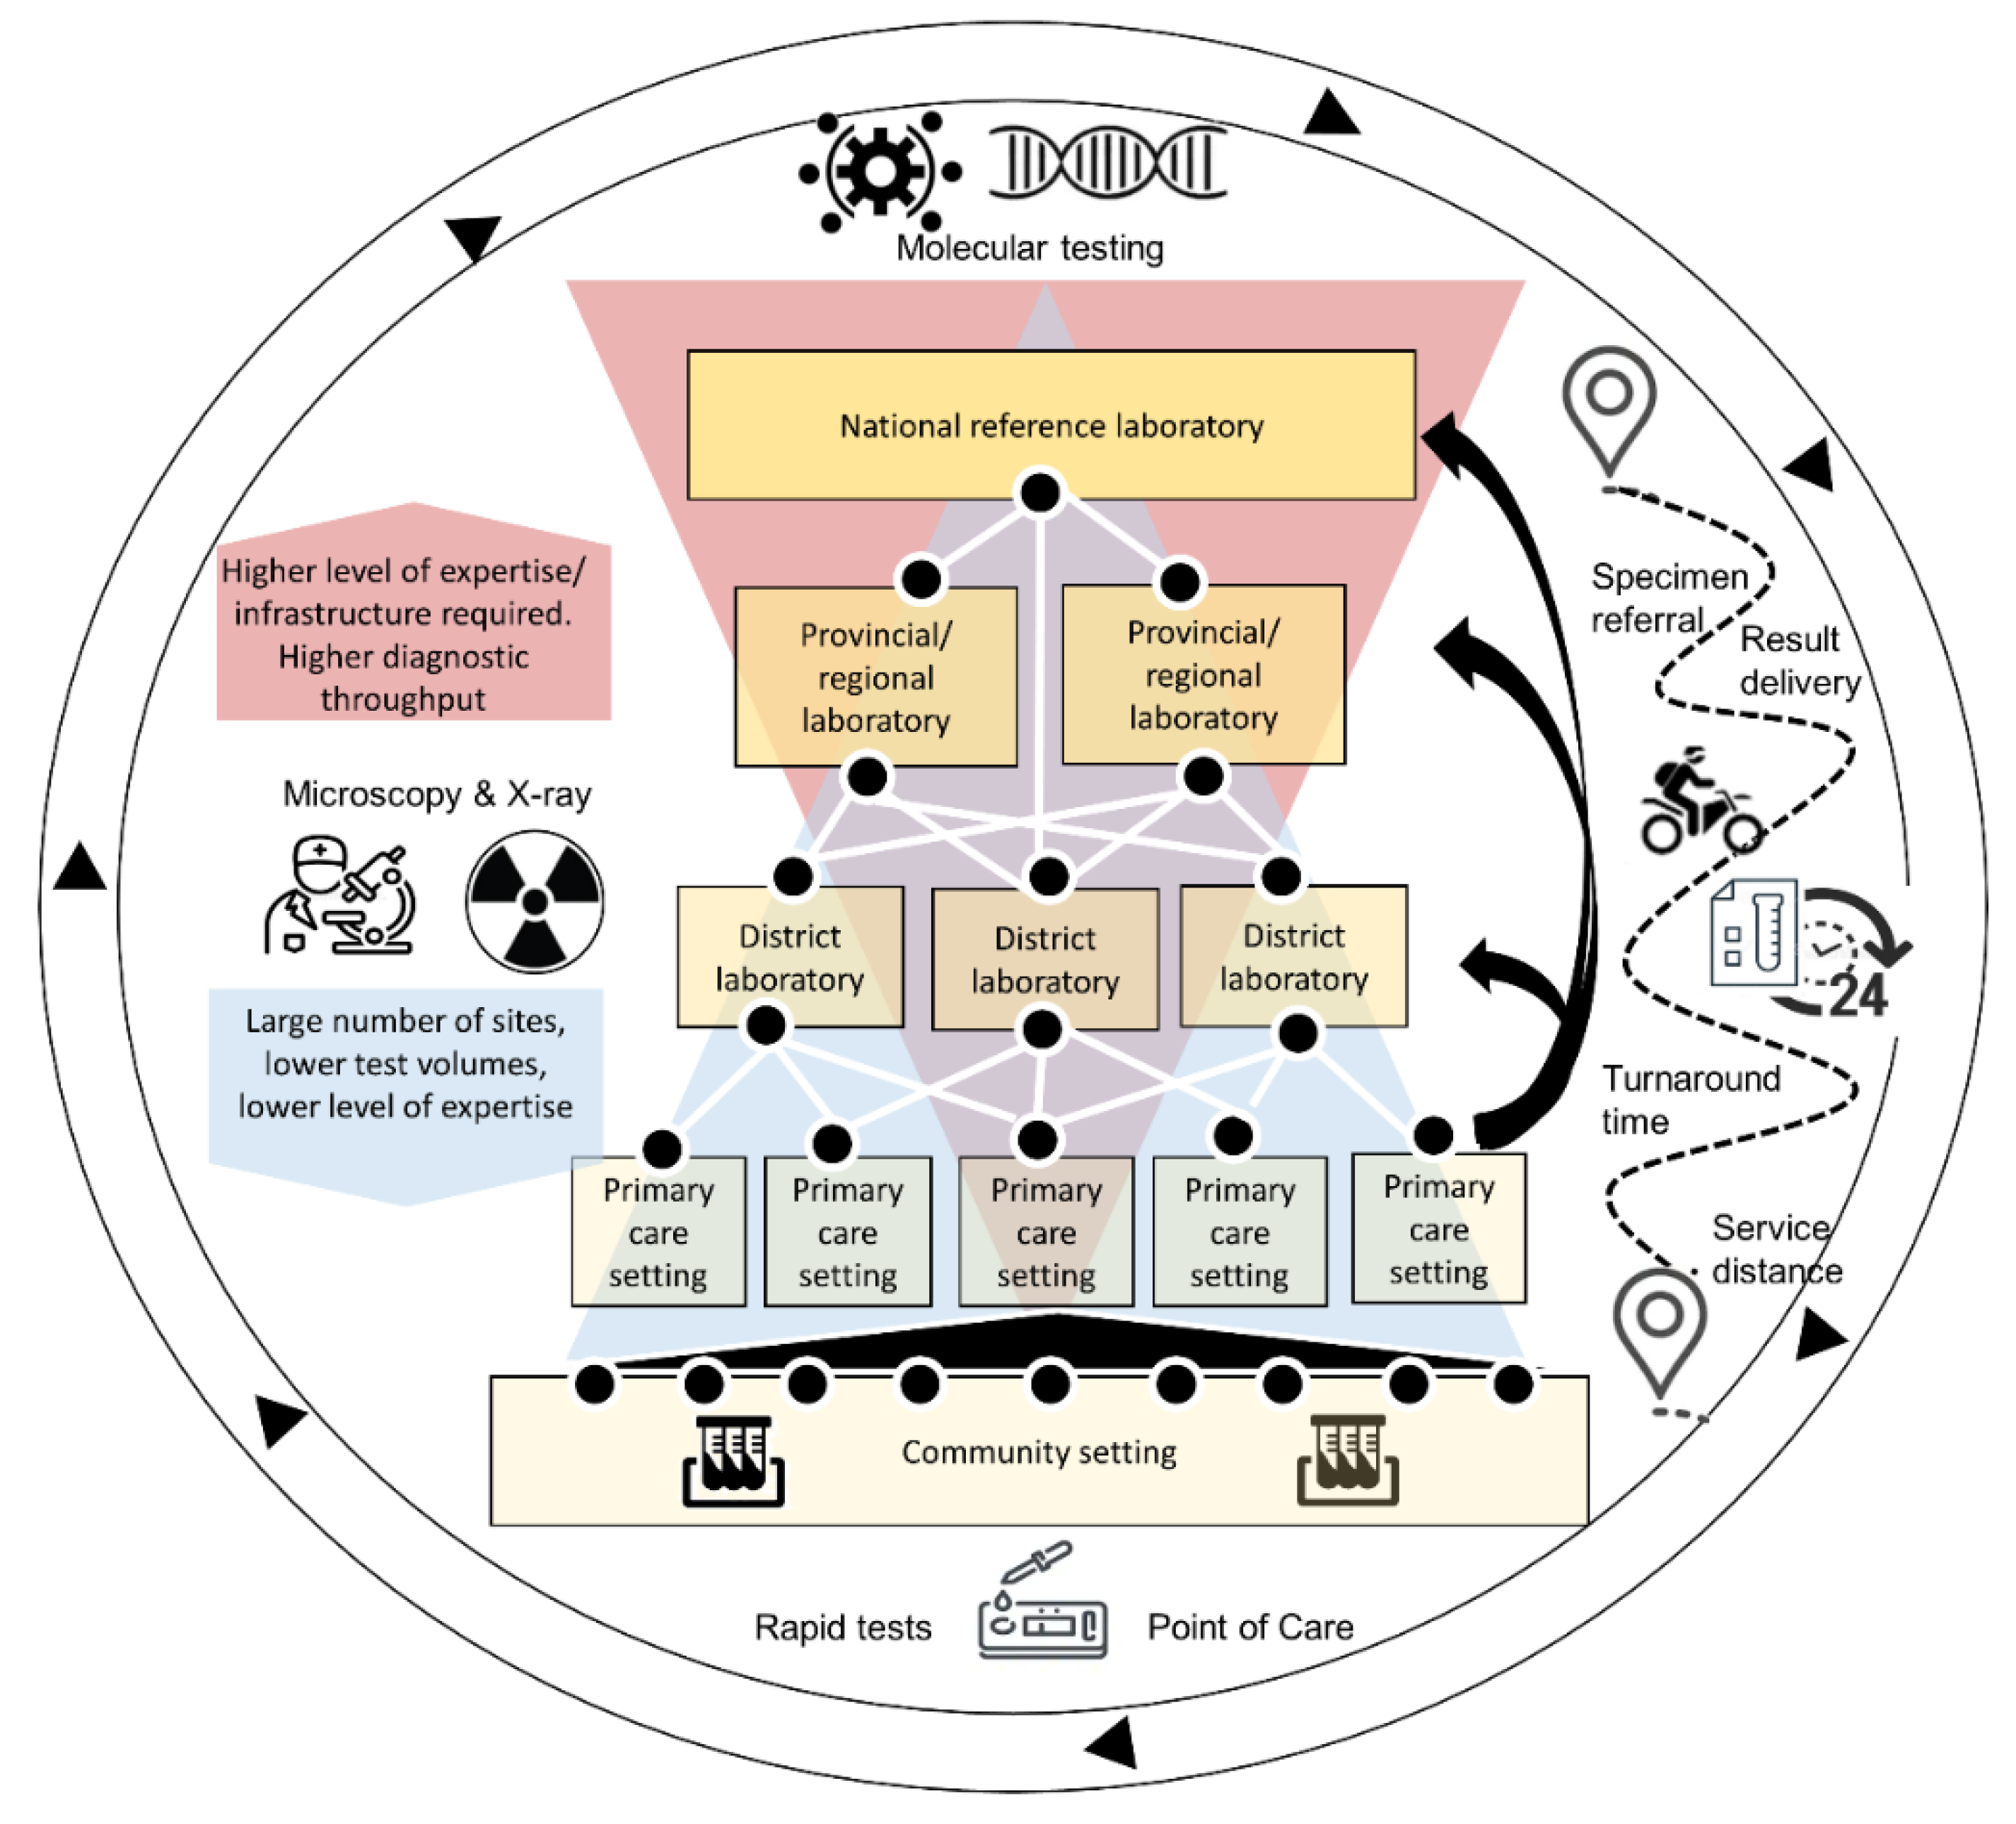
2. The Importance of Diagnostic Networks
3. Diagnostic Network Optimization
3.1. Geographic Mapping and Creation of the Current State Network Model
3.2. Scenario Development
3.3. Measuring Success of Diagnostic Network Optimization
- Effectiveness: An effective diagnostic network should ensure that essential diagnostics are available, accessible, return results within clinically relevant turnaround times, and are of high quality. These are intermediate outcomes; final health outcomes in terms of the impact of a diagnostic network on public health and disease surveillance are not measured here.
- Efficiency: Efficiency of the diagnostic network can be measured in several ways: (1) cost outcomes: the ratio of financial resources consumed (testing costs incurred) and the output (number of tests completed) to determine a cost per test completed, and/or the cost per correct test result returned to the patient; (2) Device utilization: how efficiently a device is operated, measured as the average number of tests conducted on a piece of laboratory equipment divided by the maximum number of tests that can be conducted on that piece of laboratory equipment across a specified time period. Higher device utilization and testing integration frequently result in a lower cost per test [21]. The focus is on overall efficiency of the entire network and not individual devices.
- Adaptability: Adaptability measures the ability of a diagnostic network to meet current testing demands (effectiveness) and to adjust to changing needs within the diagnostic network, whether as a result of the addition of a disease program or specimen type, introduction of new technology, or a disease outbreak [14]. Both the Ebola outbreak of 2014/2015 and the current SARS-CoV-2 pandemic have highlighted the need to ensure that robust integrated systems and platforms are in place to enable an effective public health response. Adaptability is more difficult to measure as it includes factors not reflected in the diagnostic network (for example, leadership). A proxy for adaptability would be to assess the extent to which volumes of currently supported diagnostic tests were impacted by the changing needs within the diagnostic network (e.g., disease outbreak) or how quickly new technology can be adopted and successfully deployed within the network. DNO is a key process to be used to stress-test the diagnostic network to determine how well it can withstand shocks (for example, where underutilized devices can be relocated, or where spare capacity or integrated testing can be leveraged), or how best to adopt new technology.
4. Conclusions
Author Contributions
Funding
Institutional Review Board Statement
Informed Consent Statement
Data Availability Statement
Conflicts of Interest
References
- Access to Diagnostics—Fondation Mérieux USA. Available online: https://www.fondation-merieuxusa.org/access-to-diagnostics (accessed on 22 October 2020).
- The Lewin Group; Wolcott, J.; Schwartz, A.; Goodman, C. Laboratory Medicine: A National Status Report. 2008. Available online: https://www.cdc.gov/labbestpractices/pdfs/2007-status-report-laboratory_medicine_-_a_national_status_report_from_the_lewin_group_updated_2008-9.pdf (accessed on 23 October 2020).
- World Health Organization. Second WHO Model List of Essential In Vitro Diagnostics. Who/Mvp/Emp/201905. 2019. Available online: https://www.ghdonline.org/uploads/EDL_ExecutiveSummary_15may.pdf (accessed on 23 October 2020).
- World Health Organization (WHO). International Health Regulations (2005) Third Edition. 2016. Available online: https://www.who.int/publications/i/item/9789241580496 (accessed on 23 October 2020).
- Petti, C.A.; Polage, C.R.; Quinn, T.C.; Ronald, A.R.; Sande, M.A. Laboratory medicine in Africa: A barrier to effective health care. Clin. Infect. Dis. 2006, 377–382. [Google Scholar] [CrossRef] [PubMed]
- Nkengasong, J.N.; Yao, K.; Onyebujoh, P. Laboratory medicine in low-income and middle-income countries: Progress and challenges. Lancet 2018, 1873–1875. [Google Scholar] [CrossRef]
- Alemnji, G.; Peter, T.; Vojnov, L.; Alexander, H.; Zeh, C.; Cohn, J.; Watts, D.H.; de Lussigny, S. Building and Sustaining Optimized Diagnostic Networks to Scale-up HIV Viral Load and Early Infant Diagnosis. J. Acquir. Immune. Defic. Syndr. 2020, 84, S56–S62. [Google Scholar] [CrossRef]
- Best, M.; Sakande, J. Practical recommendations for strengthening national and regional laboratory networks in Africa in the Global Health Security era. Afr. J.Lab. Med. 2016, 5, 1–10. [Google Scholar] [CrossRef] [PubMed]
- US Centers for Disease Control and Prevention. Consultation on Technical and Operational Recommendations for Clinical Laboratory Testing Harmonization and Standardization. Available online: https://www.who.int/healthsystems/round9_9.pdf (accessed on 23 October 2020).
- World Health Organisation. The Maputo Declaration on Strengthening of Laboratory Systems. Available online: https://www.who.int/diagnostics_laboratory/procurement/Maputo-Declaration_2008_2.pdf?ua=1 (accessed on 23 October 2020).
- African Society for Laboratory Medicine. Freetown Declaration—African Society for Laboratory Medicine. Available online: https://aslm.org/what-we-do/freetown-declaration/ (accessed on 16 October 2020).
- Ondoa, P.; Ndlovu, N.; Keita, M.-S.; Massinga-Loembe, M.; Kebede, Y.; Odhiambo, C.; Mekonen, T.; Ashenafi, A.; Kebede, A.; Nkengasong, J. Preparing national tiered laboratory systems and networks to advance diagnostics in Africa and meet the continent’s health agenda: Insights into priority areas for improvement. Afr. J.Lab. Med. 2020, 9, 1–10. [Google Scholar] [CrossRef] [PubMed]
- World Health Organization (WHO). Manual for Procurement of Diagnostics and Related Laboratory Items and Equipment. 2013. Available online: http://www.who.int/about/licensing/copyright_form/en/index.html (accessed on 23 October 2020).
- Piatek, A. Tuberculosis Diagnostic Networks: Moving Beyond the Laboratory to End Tuberculosis in Africa. Available online: https://ajlmonline.org/index.php/ajlm/article/view/608/785 (accessed on 2 November 2020).
- Cairncross, S.; Periès, H.; Cutts, F. Vertical health programmes. Lancet 1997, 349, S20–S21. [Google Scholar] [CrossRef]
- World Health Organization (WHO). Molecular diagnostics Integration Global Meeting Report; WHO: Geneva, Switzerland; Available online: https://apps.who.int/iris/handle/10665/331708 (accessed on 23 October 2020).
- The World Health Organisation. Everybody Business: Strengthening Health Systems to Improve Health Outcomes: WHO’s Framework for Action; WHO: Geneva, Switzerland, 2007. [Google Scholar]
- Evans, D.B.; Hsu, J.; Boerma, T. Universal Health Coverage and Universal Access. Bulletin of the World Health Organization; WHO: Geneva, Switzerland, 2013. [Google Scholar]
- Hawkins, R.C. Laboratory Turnaround Time Robert. Clin. Biochem. Rev. 2018, 28, 179–194. [Google Scholar]
- Albert, H.; Purcell, R.; Wang, Y.Y.; Kao, K.; Mareka, M.; Katz, Z.; Llang Maama, B.; Mots’oane, T. Designing an optimized diagnostic network to improve access to TB diagnosis and treatment in Lesotho. PLoS ONE 2020, 15, e0233620. [Google Scholar] [CrossRef] [PubMed]
- Girdwood, S.J.; Nichols, B.E.; Moyo, C.; Crompton, T.; Chimhamhiwa, D.; Rosen, S. Optimizing viral load testing access for the last mile: Geospatial cost model for point of care instrument placement. PLoS ONE 2019, 14, e0221586. [Google Scholar] [CrossRef] [PubMed]
- Nichols, B.E.; Girdwood, S.J.; Crompton, T.; Stewart-Isherwood, L.; Berrie, L.; Chimhamhiwa, D.; Moyo, C.; Kuehnle, J.; Stevens, W.; Rosen, S. Impact of a borderless sample transport network for scaling up viral load monitoring: Results of a geospatial optimization model for Zambia. J. Int. AIDS Soc. 2018, 12, e25206. [Google Scholar] [CrossRef] [PubMed]
- Kiyaga, C.; Sendagire, H.; Joseph, E.; McConnell, I.; Grosz, J.; Narayan, V.; Esiru, G.; Elyanu, P.; Akol, Z.; Kirungi, W.; et al. Uganda’s new national laboratory sample transport system: A successful model for improving access to diagnostic services for early infant HIV diagnosis and other programs. PLoS ONE 2013, 8, e78609. [Google Scholar] [CrossRef] [PubMed]
- Nichols, B.E.; Girdwood, S.J.; Shibemba, A.; Sikota, S.; Gill, C.J.; Mwananyanda, L.; Noble, L.; Isherwood-Stewart, L.; Scott, L.; Carmona, S.; et al. Cost and Impact of Dried Blood Spot Versus Plasma Separation Card for Scale-up of Viral Load Testing in Resource-limited Settings. Clin. Infect. Dis. 2020, 70, 1014–1020. [Google Scholar] [CrossRef] [PubMed]
- Wang, Z.; Yan, R.; Hollister, K.; Xing, R. A Relative Comparison of Leading Supply Chain Management Software Packages. Int. J. Inf. Syst. Supply Chain Manag. 2009, 2, 81–96. [Google Scholar] [CrossRef][Green Version]
- Glencross, D.K.; Coetzee, L.M.; Cassim, N. An Integrated Tiered Service Delivery Model (ITSDM) Based on Local CD4 Testing Demands Can Improve Turn-Around Times and Save Costs whilst Ensuring Accessible and Scalable CD4 Services across a National Programme. PLoS ONE 2014, 9, e114727. [Google Scholar] [CrossRef] [PubMed]
- Nichols, B.E.; Girdwood, S.J.; Crompton, T.; Stewart-Isherwood, L.; Berrie, L.; Chimhamhiwa, D.; Moyo, C.; Kuehnle, J.; Stevens, W.S.; Rosen, S.; et al. Monitoring viral load for the last mile: What will it cost? J. Int. AIDS Soc. 2019, 22, e25337. [Google Scholar] [CrossRef] [PubMed]
- Ogoro, J. Designing Optimal Integrated Sample Referral Systems in Kenya. The 50th Union World Conference on Lung Health, Hyderabad, India. Available online: https://www.finddx.org/wp-content/uploads/2019/12/04-Dx-network-optimization_SRS-Kenya_JeremiahOgoro_Union_31OCT19.pdf (accessed on 23 October 2020).
- Ogoro, J. Diagnostic Network Optimization as Part of a Data-Driven National Strategic Planning Process in Kenya. The 50th Union World Conference on Lung Health, Hyderabad, India. Available online: https://www.finddx.org/wp-content/uploads/2019/12/02-DX-network-optimization_Kenya_JeremiahOgoro_Union_31OCT19.pdf (accessed on 23 October 2020).
- Sistoso, E.V. Placing Diagnostic Devices for Impact: Experience of the Philippines. The 50th Union World Conference on Lung Health, Hyderabad, India. Available online: https://www.finddx.org/wp-content/uploads/2019/12/03-Placing-Diagnostic-Devices-for-Impact_Philippines_EddieSistoso_Union_31OCT19.pdf (accessed on 23 October 2020).
- Llamasoft: Supply Chain Guru. Llamasoft Inc. Available online: https://llamasoft.com (accessed on 23 October 2020).
- PEPFAR Zambia Country Operational Plan 2019 Strategic Direction Summary; PEPFAR: Washington, DC, USA, 2019.
- Girdwood, S.J.; Crompton, T.; Sharma, M.; Dorward, J.; Garrett, N.; Drain, P.K.; Stevens, W.S.; Nichols, B.E. Cost-effectiveness of adoption strategies for point of care HIV viral load monitoring in South Africa. EClinical Med. 2020, 28, 100607. [Google Scholar] [CrossRef] [PubMed]
- Girdwood, S.J.; Crompton, T.; Olsen, F.; Sejake, P.; Cassim, N.; Diallo, K. Delaying courier specimen collection time improves patient access to viral load testing. In Proceedings of the International AIDS Conference, Virtual, 6–10 July 2020. [Google Scholar]
- Llamasoft: OptiDx. Llamasoft Inc, FIND, GHSC-PSM. Available online: finddx.org/access/dx-network/opt/ (accessed on 23 October 2020).
- Purcell, R.; Albert, H.; Building an Open Access Software Tool to Allow Countries to Design Patient-Centered and Cost-Effective Diagnostic Networks. Global Health Supply Chain Summit. Available online: https://slideplayer.com/slide/17812219/ (accessed on 23 October 2020).
- Albert, H. Networks for Optimized Diagnosis to End TB: What Is It and What Can It Do? The 50th Union World Conference on Lung Health, Hyderabad, India. Available online: www.finddx.org (accessed on 23 October 2020).


| Term | Specific Definition as Related to Diagnostics Network Optimization |
|---|---|
| Tiered laboratory network | An integrated system of laboratories organized in tiers aligned with the public health delivery system of the country. The tiers are determined by their test menus and functions, and a specimen referral network ensures tests are performed at the most appropriate level of the tiered system. |
| Diagnostic network | “Diagnostic” and “laboratory” are often used interchangeably with “network” but “diagnostic network” includes all testing sites and instruments within a laboratory network as well as testing sites and instruments that fall outside a laboratory setting—e.g., rapid diagnostic- and point-of-care tests, which can be delivered in community and clinic settings. It allows for inclusion of non-laboratory testing that is part of diagnostics process, i.e., screening, radiology, etc. The role of the specimen referral network is elevated. |
| Specimen referral network | An interconnected group of specimen referral systems, which comprise all components and processes required for patient specimens to be tested at a location that differs from where the specimen was collected. |
| Diagnostic network design | Uses location data, testing demand and capacity and referral linkage data on collection points and testing facilities to build a model of the current state/baseline of the network and then using that to help identify gaps and opportunities and improve the network to achieve desired objectives i.e., improved access or reduced cost. |
| Diagnostic network optimization (DNO) | Optimization maximizes or minimizes an objective, by changing the variables under control subject to certain constraints. In the context of diagnostic networks, it is a computerized analytical process that designs a single diagnostic network based on objectives (minimizing costs, maximizing access, minimizing turnaround time) and variables (transport, device placement) within given constraints (capacity, costs); the best setting of variables that meets the objectives. Excluded from the definition are other analyses or interventions aimed at strengthening laboratory systems that do not incorporate these aspects. |
| Constraints | Limits placed on variables in the process of optimization. In DNO, constraints could include capping the total number of instruments, number of testing sites, actual equipment capacity, total costs, or ability to refer samples across administrative boundaries within a country. |
| Route optimization | Route optimization is the process of determining the most efficient route. It is more complex than simply finding the shortest path between two points. It needs to include all relevant factors such as the number and location of all the required stops on the route. This is why route optimization is mostly performed by computer algorithms that can quickly narrow down the options. Route optimization software can quickly test multiple ‘what-if’ scenarios to help fleets review the costs of different route options and resource availability, but within a given set of constraints. This is also known as vehicle route optimization. |
| Collection points | The physical location where specimens are collected from an individual requiring a diagnostic test. These may also be referred to as referring facilities or spokes. |
| Hubs | The physical location where specimens may be pooled after leaving the collection point. The hub may offer certain testing onsite or may only serve as an intermediate pooling and processing point (i.e., for centrifuging) for specimens before they reach the testing facility. Hubs may also offer quality checks and documentation points for specimens. |
| Testing facilities | The physical location where the specimens are processed. If the diagnostic test is offered onsite, then this could be the same physical location as the collection site. If testing occurs offsite, then this would be the physical location of the laboratory. |
| Baseline or Current state | Current status of the diagnostic network, including current levels of accessibility, turnaround times, interconnectedness, collection points, and testing facilities. It is a fixed point of reference that is used for comparison purposes. |
| Mapping | Refers to the geospatial mapping of the location data for collection points and testing facilities supplemented by other diagnostic network data, namely testing demand, testing capacity and referral linkages between locations; however, importantly, mapping is not synonymous with “network optimization.” |
| Scenarios | Scenarios are potential changes that can be made to the baseline or current state and are created through a subjective exercise to discuss “What if” (in terms of inputs or variables such as capacity or demand) and decide which to explore; this process is informed by the baseline situation (including mapping, spatial analysis, costs). |
| Scenario analysis | The process or technique of testing potential changes to the system to consider the potential outcomes and implications of a change to assist or improve decision making. This answers the question of “what if” and allows for comparison with the baseline or current state. |
| Vertical systems or programs | A vertical system or program only focuses on one disease or one area. For example, a vertical specimen referral system would only refer specimens for one disease program (such as for HIV, or for TB). The primary advantage of a vertical system is that the needs of an individual disease program is prioritized. The primary disadvantage is potential inefficiencies introduced by having multiple vertical systems serving one disease each [15]. |
| Integrated systems or programs | An integrated system or program focuses on multiple diseases or areas. Integration can happen at multiple levels of the health system or in different areas. For example, a specimen referral system that serves primary health facilities and connects them to district level may carry more than one specimen-type for more than one disease area (this will also depend on the co-location of pickup and delivery points). Integration must be done to ensure the goals and needs for all programs are met and optimization for one program does not negatively impact other programs. Another type of integration is for testing (see testing integration). |
| Testing integration | Testing integration or multiplexing uses the same technology (also known as polyvalent testing platforms or multianalyte analyzers) for several assays and/or across diseases. It can lead to more efficient and cost-effective testing services. Further, diagnostic integration can help to simplify and streamline other systems, such as specimen referral, human resources and quality assurance [16]. |
| Coverage | Health service coverage is defined as the extent to which target populations receive health interventions. For diagnostic services coverage, this relates to geographic coverage as well as targeted coverage of key populations such as people living with HIV (PLHIV), children, miners, other vulnerable populations, etc [17]. |
| Availability | Availability is a component of physical access—in order for a service to be accessible, it must first be available. Availability is centered around testing (which requires capacity and capability) and referral systems (the tests available either onsite or via a referral system) [18]. |
| Access | The focus of ‘access’ for DNO is on physical accessibility of diagnostics, and what proportion of individuals can access a diagnostic if required within a given health system. |
| Turnaround time | The time elapsed between collection of a specimen from a client and return of the results to the facility or client, and, in some cases, to the time of clinical intervention based on that result. If these data are unavailable, other intermediary turnaround times are used, e.g., testing turnaround time. In DNO, turnaround time refers to the time that the specimen is picked up to the time that the result is returned to the requesting facility [19]. |
| Efficiency | Efficiency concerns the relationship between resource inputs (e.g., costs) and intermediate or final health outcomes. There are two areas of efficiency for DNO: (1) cost outcomes—the ratio of financial resources consumed (total cost of the diagnostic network) to the health outcome (the valued health system output that is created by the cost input—for example, number of correct tests results returned within a time period, etc.)) and (2) equipment utilization. Efficiency must be balanced with access and other effectiveness measures such as turnaround time. |
| Maximum equipment testing capacity | Maximum capacity, or theoretical capacity, does not take the actual testing environment into consideration—it is the manufacturer’s calculation of the instrument capacity. This may be used as the denominator in the utilization calculation. |
| Actual equipment testing capacity | Actual available equipment capacity takes into consideration human resource availability and capacity, site conditions, and thus it is usually less than theoretical maximum capacity. It may be used as the denominator in the utilization calculation. |
| Utilization | The level of usage of equipment within a set time window compared to the maximum theoretical device testing capacity and/or actual available device testing capacity within the same period, e.g., actual number of tests conducted as a proportion of the total number of tests that could have been conducted on a particular device. |
| Equity | Equity in health refers to fairness in the distribution of healthcare resources and outcomes amongst population groups defined socially, economically, demographically or geographically. As it relates to DNO, equity is a measure of the distribution and fairness of geographical access. Equity considerations are a competing dimension to efficiency considerations which can be explicitly examined through DNO. For example, whilst it might not be cost-effective to provide diagnostic access to certain hard-to-reach populations, it might be important if decision-makers value equity. |
| Quality | This refers to the quality of the diagnostic services in terms of the probability that the test result is accurate and reproducible and is a broader concept compared to external quality assessment. Quality starts with selecting and procuring the right tests produced under good manufacturing practice, validated as appropriate for the population and settings of intended use. Next, it is a function of the specimen type and collection, transport, and whether testing is done by trained and competent staff, as well as the level of quality-assurance (both internal and external, including proficiency testing) during all steps of the process. |
| Adaptability | Adaptability measures the ability of a diagnostic network to adjust to changing needs within the diagnostic network, whether as a result of an addition of a disease program, new technology, specimen type or disease outbreak. |
Publisher’s Note: MDPI stays neutral with regard to jurisdictional claims in published maps and institutional affiliations. |
© 2020 by the authors. Licensee MDPI, Basel, Switzerland. This article is an open access article distributed under the terms and conditions of the Creative Commons Attribution (CC BY) license (http://creativecommons.org/licenses/by/4.0/).
Share and Cite
Nichols, K.; Girdwood, S.J.; Inglis, A.; Ondoa, P.; Sy, K.T.L.; Benade, M.; Tusiime, A.B.; Kao, K.; Carmona, S.; Albert, H.; et al. Bringing Data Analytics to the Design of Optimized Diagnostic Networks in Low- and Middle-Income Countries: Process, Terms and Definitions. Diagnostics 2021, 11, 22. https://doi.org/10.3390/diagnostics11010022
Nichols K, Girdwood SJ, Inglis A, Ondoa P, Sy KTL, Benade M, Tusiime AB, Kao K, Carmona S, Albert H, et al. Bringing Data Analytics to the Design of Optimized Diagnostic Networks in Low- and Middle-Income Countries: Process, Terms and Definitions. Diagnostics. 2021; 11(1):22. https://doi.org/10.3390/diagnostics11010022
Chicago/Turabian StyleNichols, Kameko, Sarah J. Girdwood, Andrew Inglis, Pascale Ondoa, Karla Therese L. Sy, Mariet Benade, Aloysius Bingi Tusiime, Kekeletso Kao, Sergio Carmona, Heidi Albert, and et al. 2021. "Bringing Data Analytics to the Design of Optimized Diagnostic Networks in Low- and Middle-Income Countries: Process, Terms and Definitions" Diagnostics 11, no. 1: 22. https://doi.org/10.3390/diagnostics11010022
APA StyleNichols, K., Girdwood, S. J., Inglis, A., Ondoa, P., Sy, K. T. L., Benade, M., Tusiime, A. B., Kao, K., Carmona, S., Albert, H., & Nichols, B. E. (2021). Bringing Data Analytics to the Design of Optimized Diagnostic Networks in Low- and Middle-Income Countries: Process, Terms and Definitions. Diagnostics, 11(1), 22. https://doi.org/10.3390/diagnostics11010022