Deep Learning-Based Segmentation to Establish East Asian Normative Volumes Using Multisite Structural MRI
Abstract
1. Introduction
2. Materials and Methods
2.1. Data Description
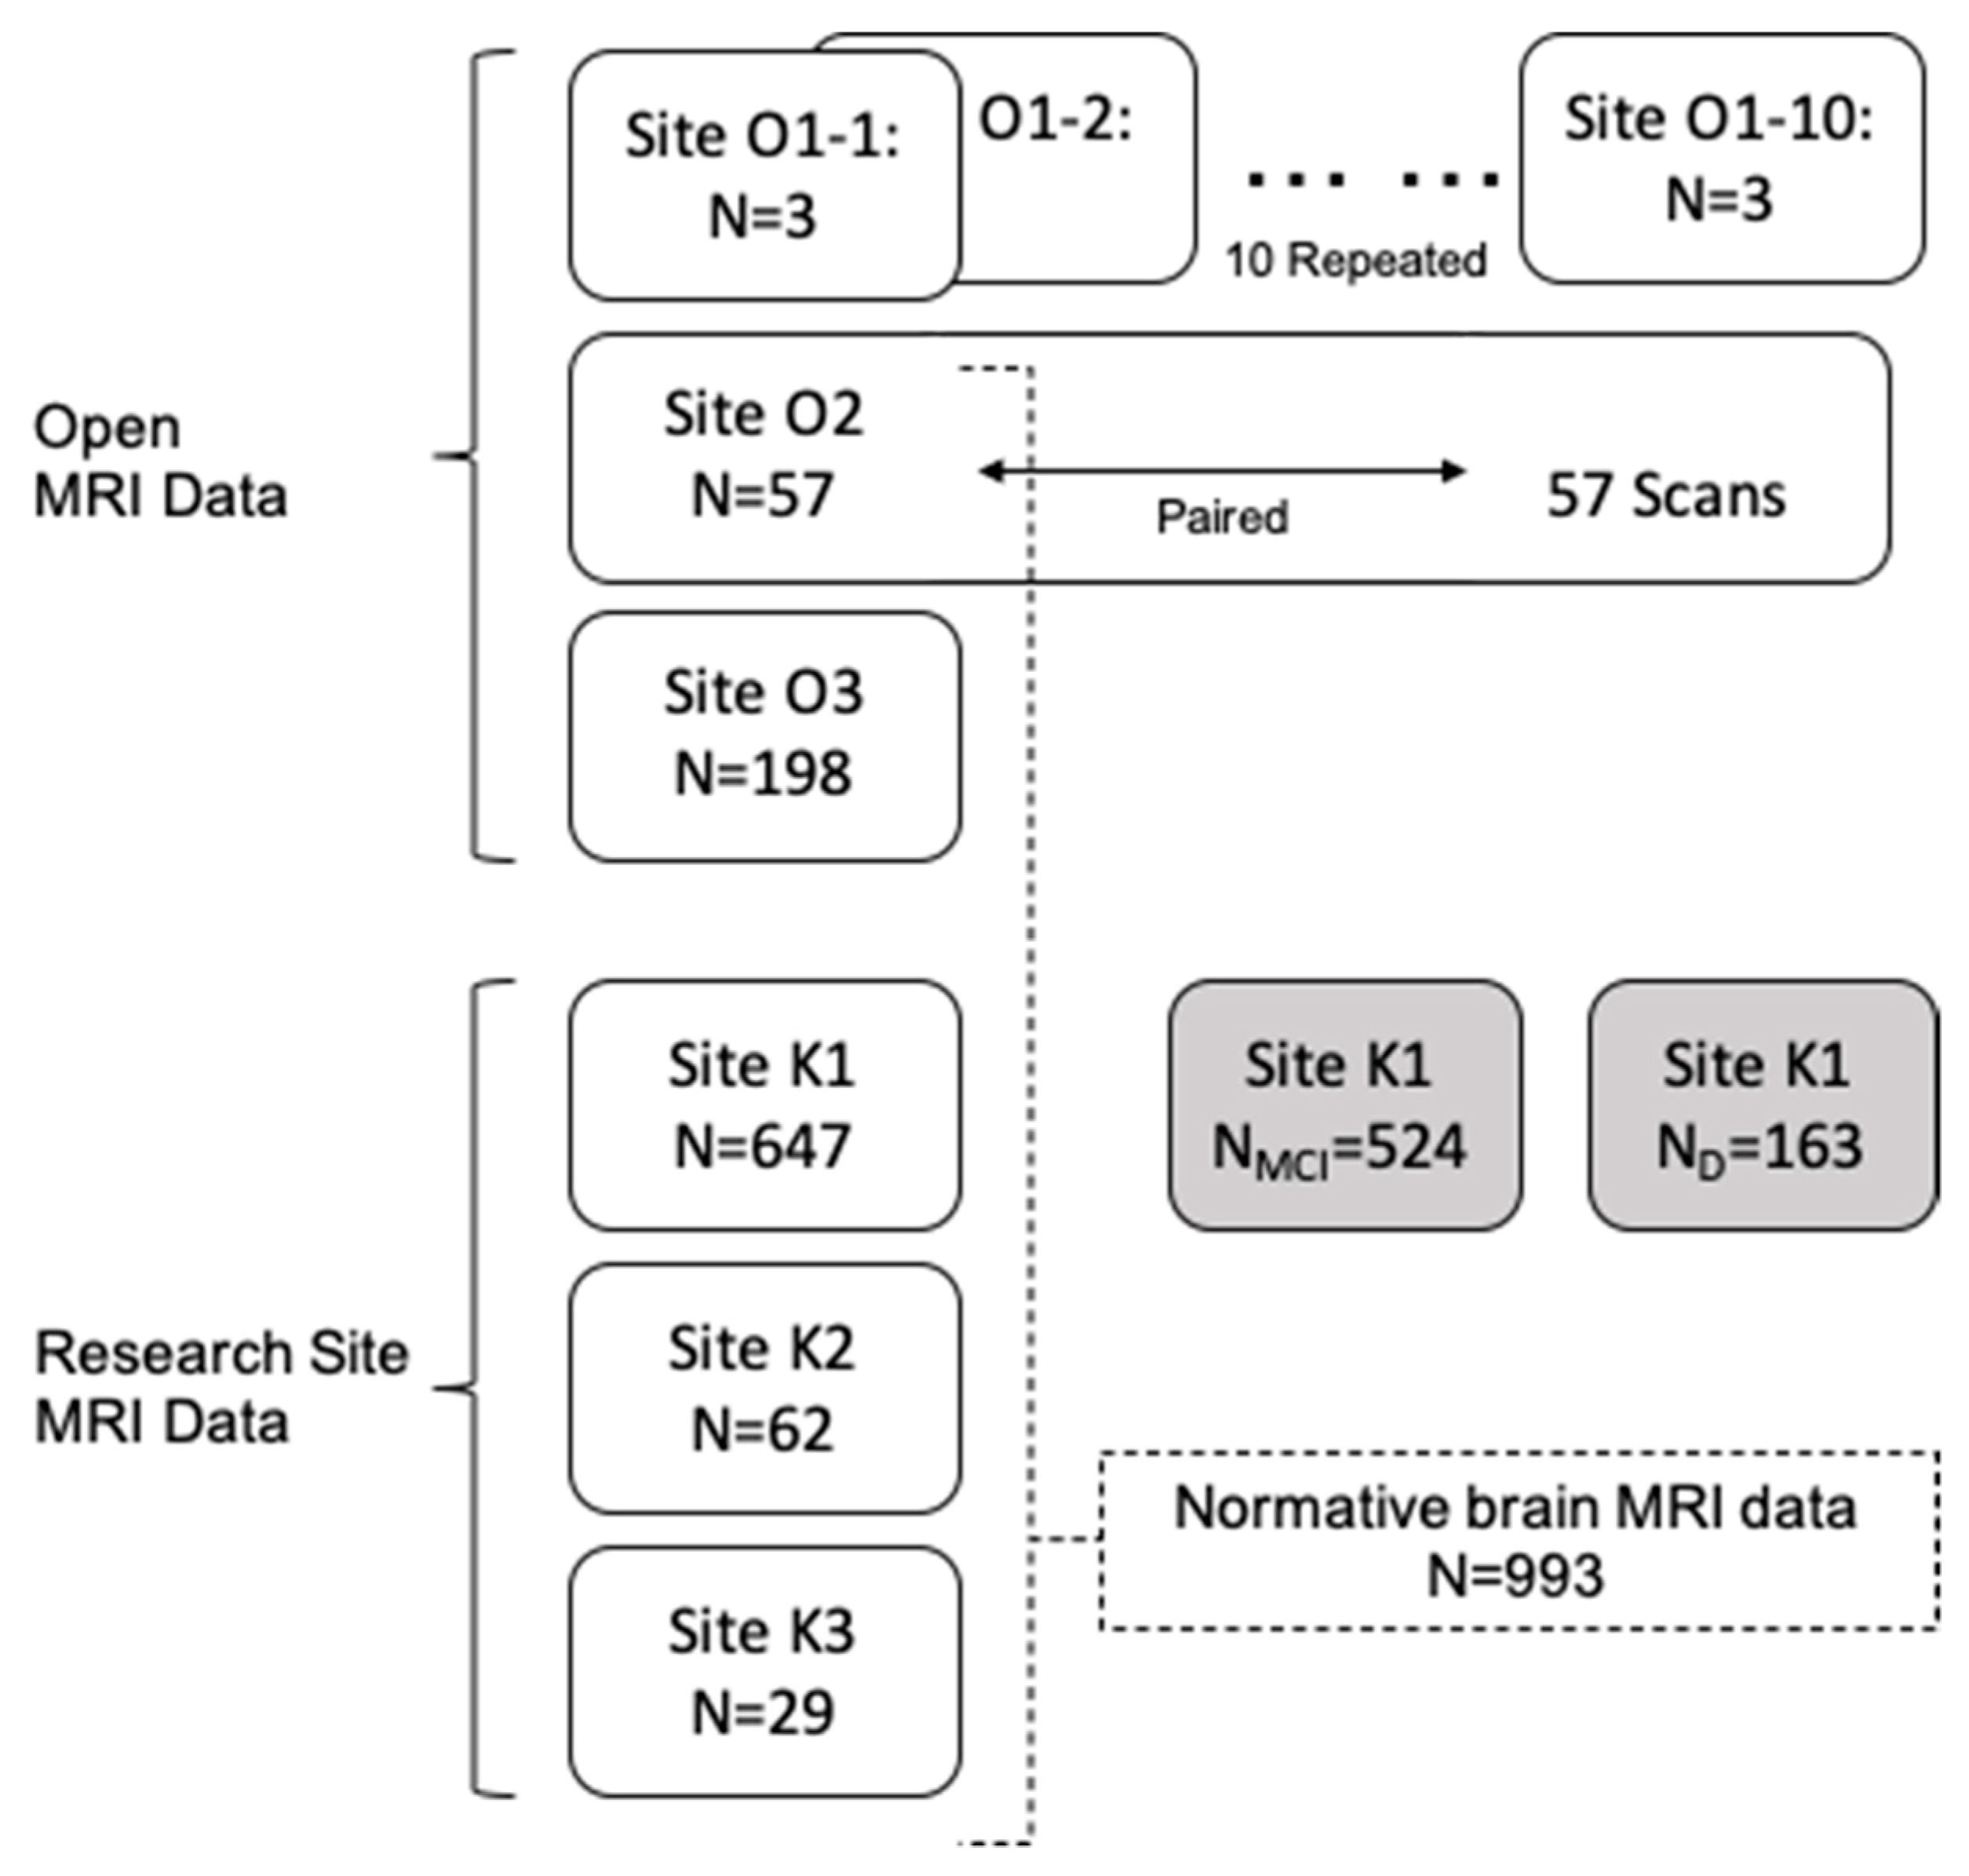
2.1.1. Open MRI Data O1: Multicenter Dataset
2.1.2. Open MRI Data O2: Repeated Measure Dataset
2.1.3. Open MRI Data O3: Chinese Normative Data
2.1.4. Research Site Data Sets in Korea
2.2. Brain MRI Segmentation
2.2.1. Preprocessing
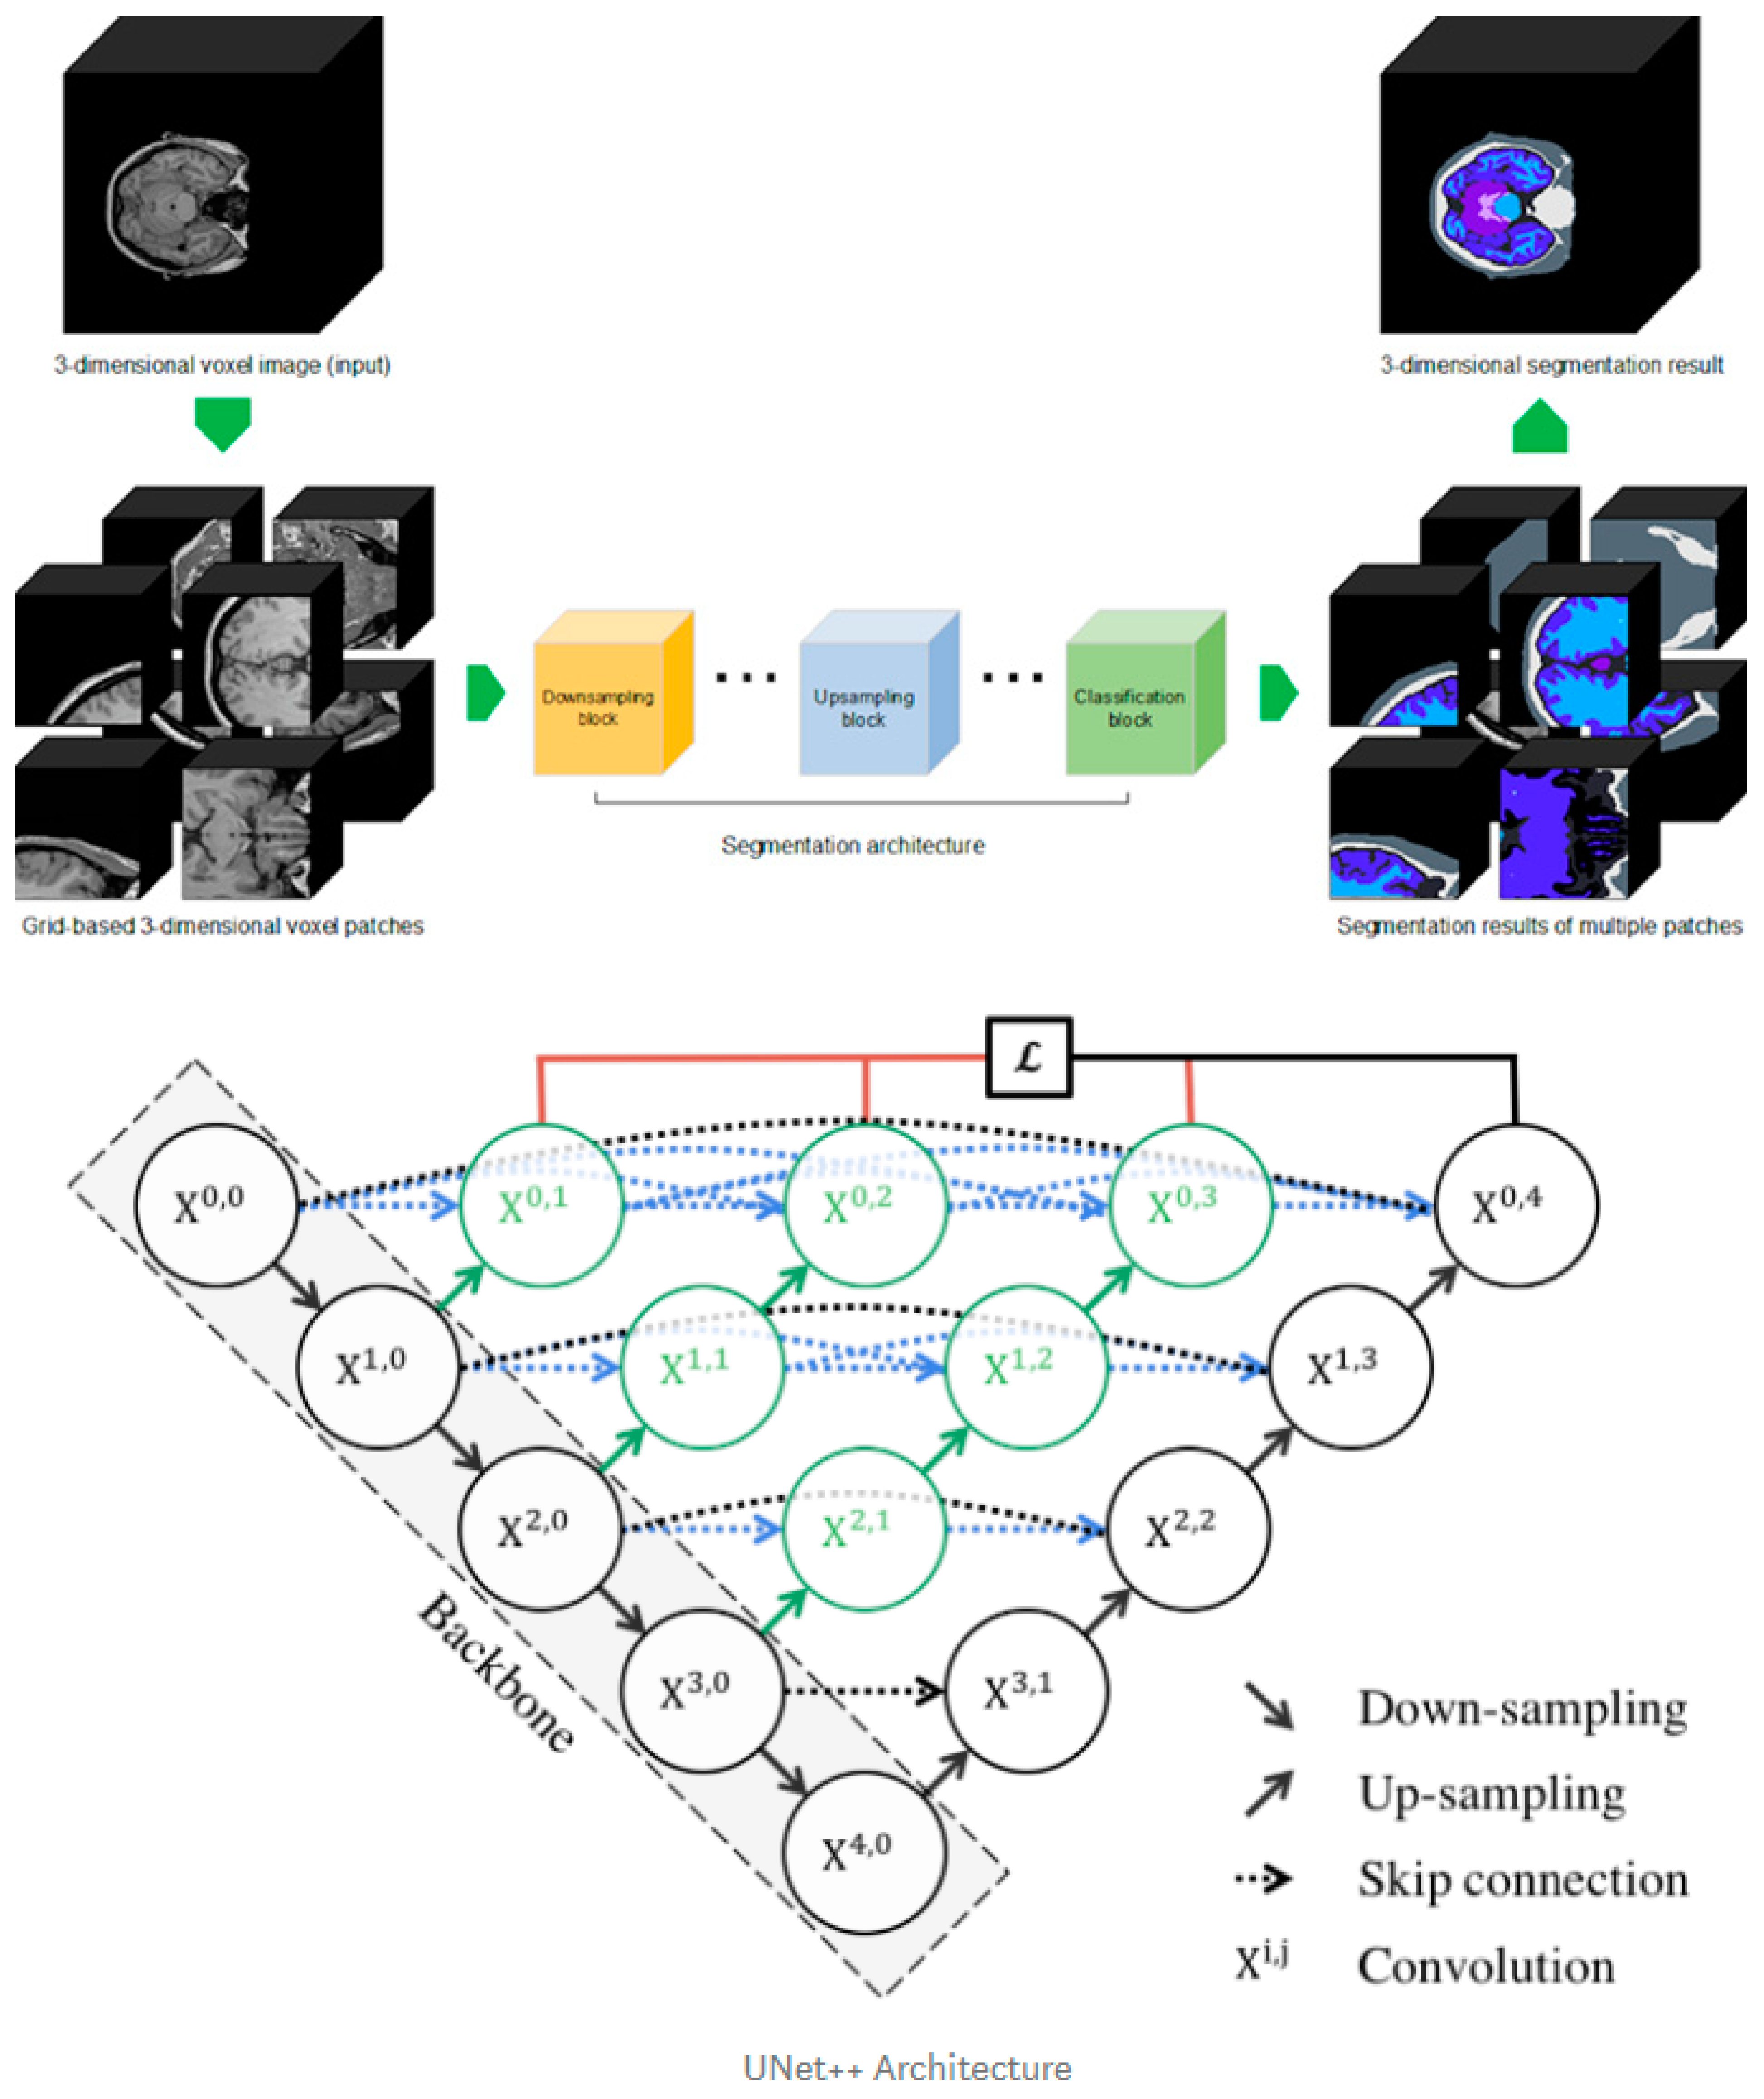
2.2.2. Deep Learning Segmentation
2.2.3. Postprocessing
2.3. Statistical Analysis
3. Results
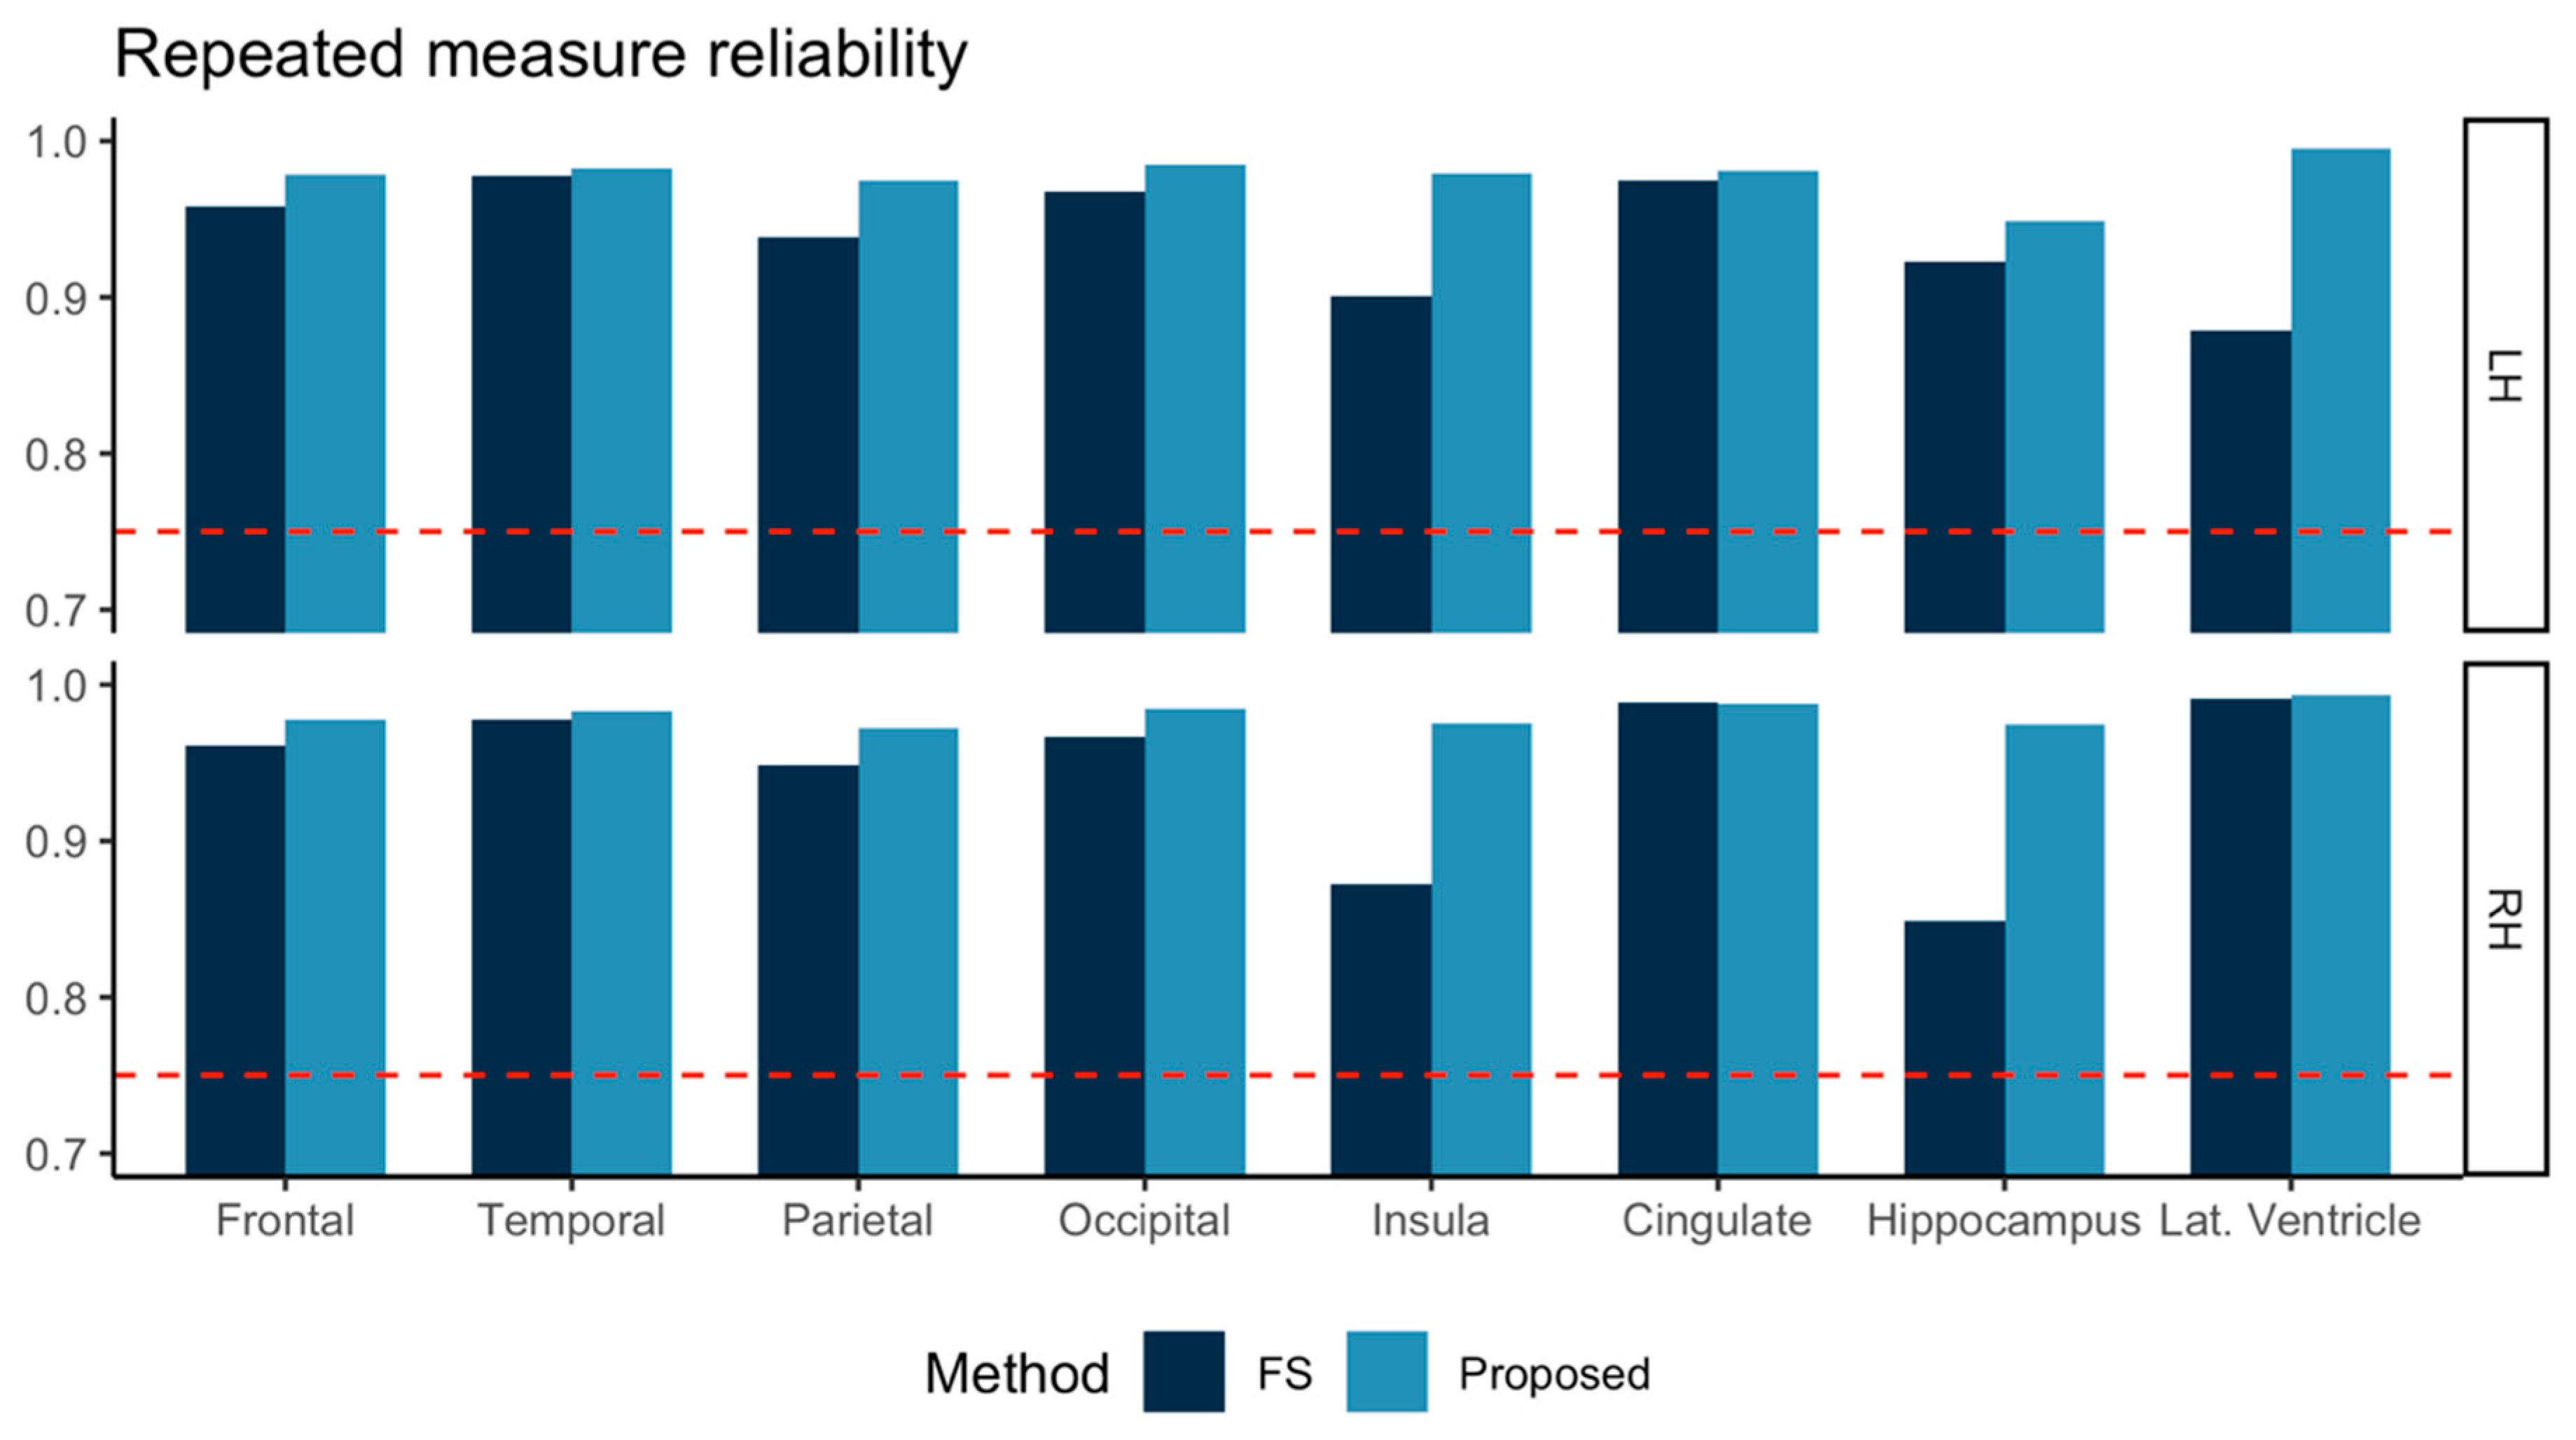
3.1. Repeated Measure Consistency
3.2. Multicenter Reliability
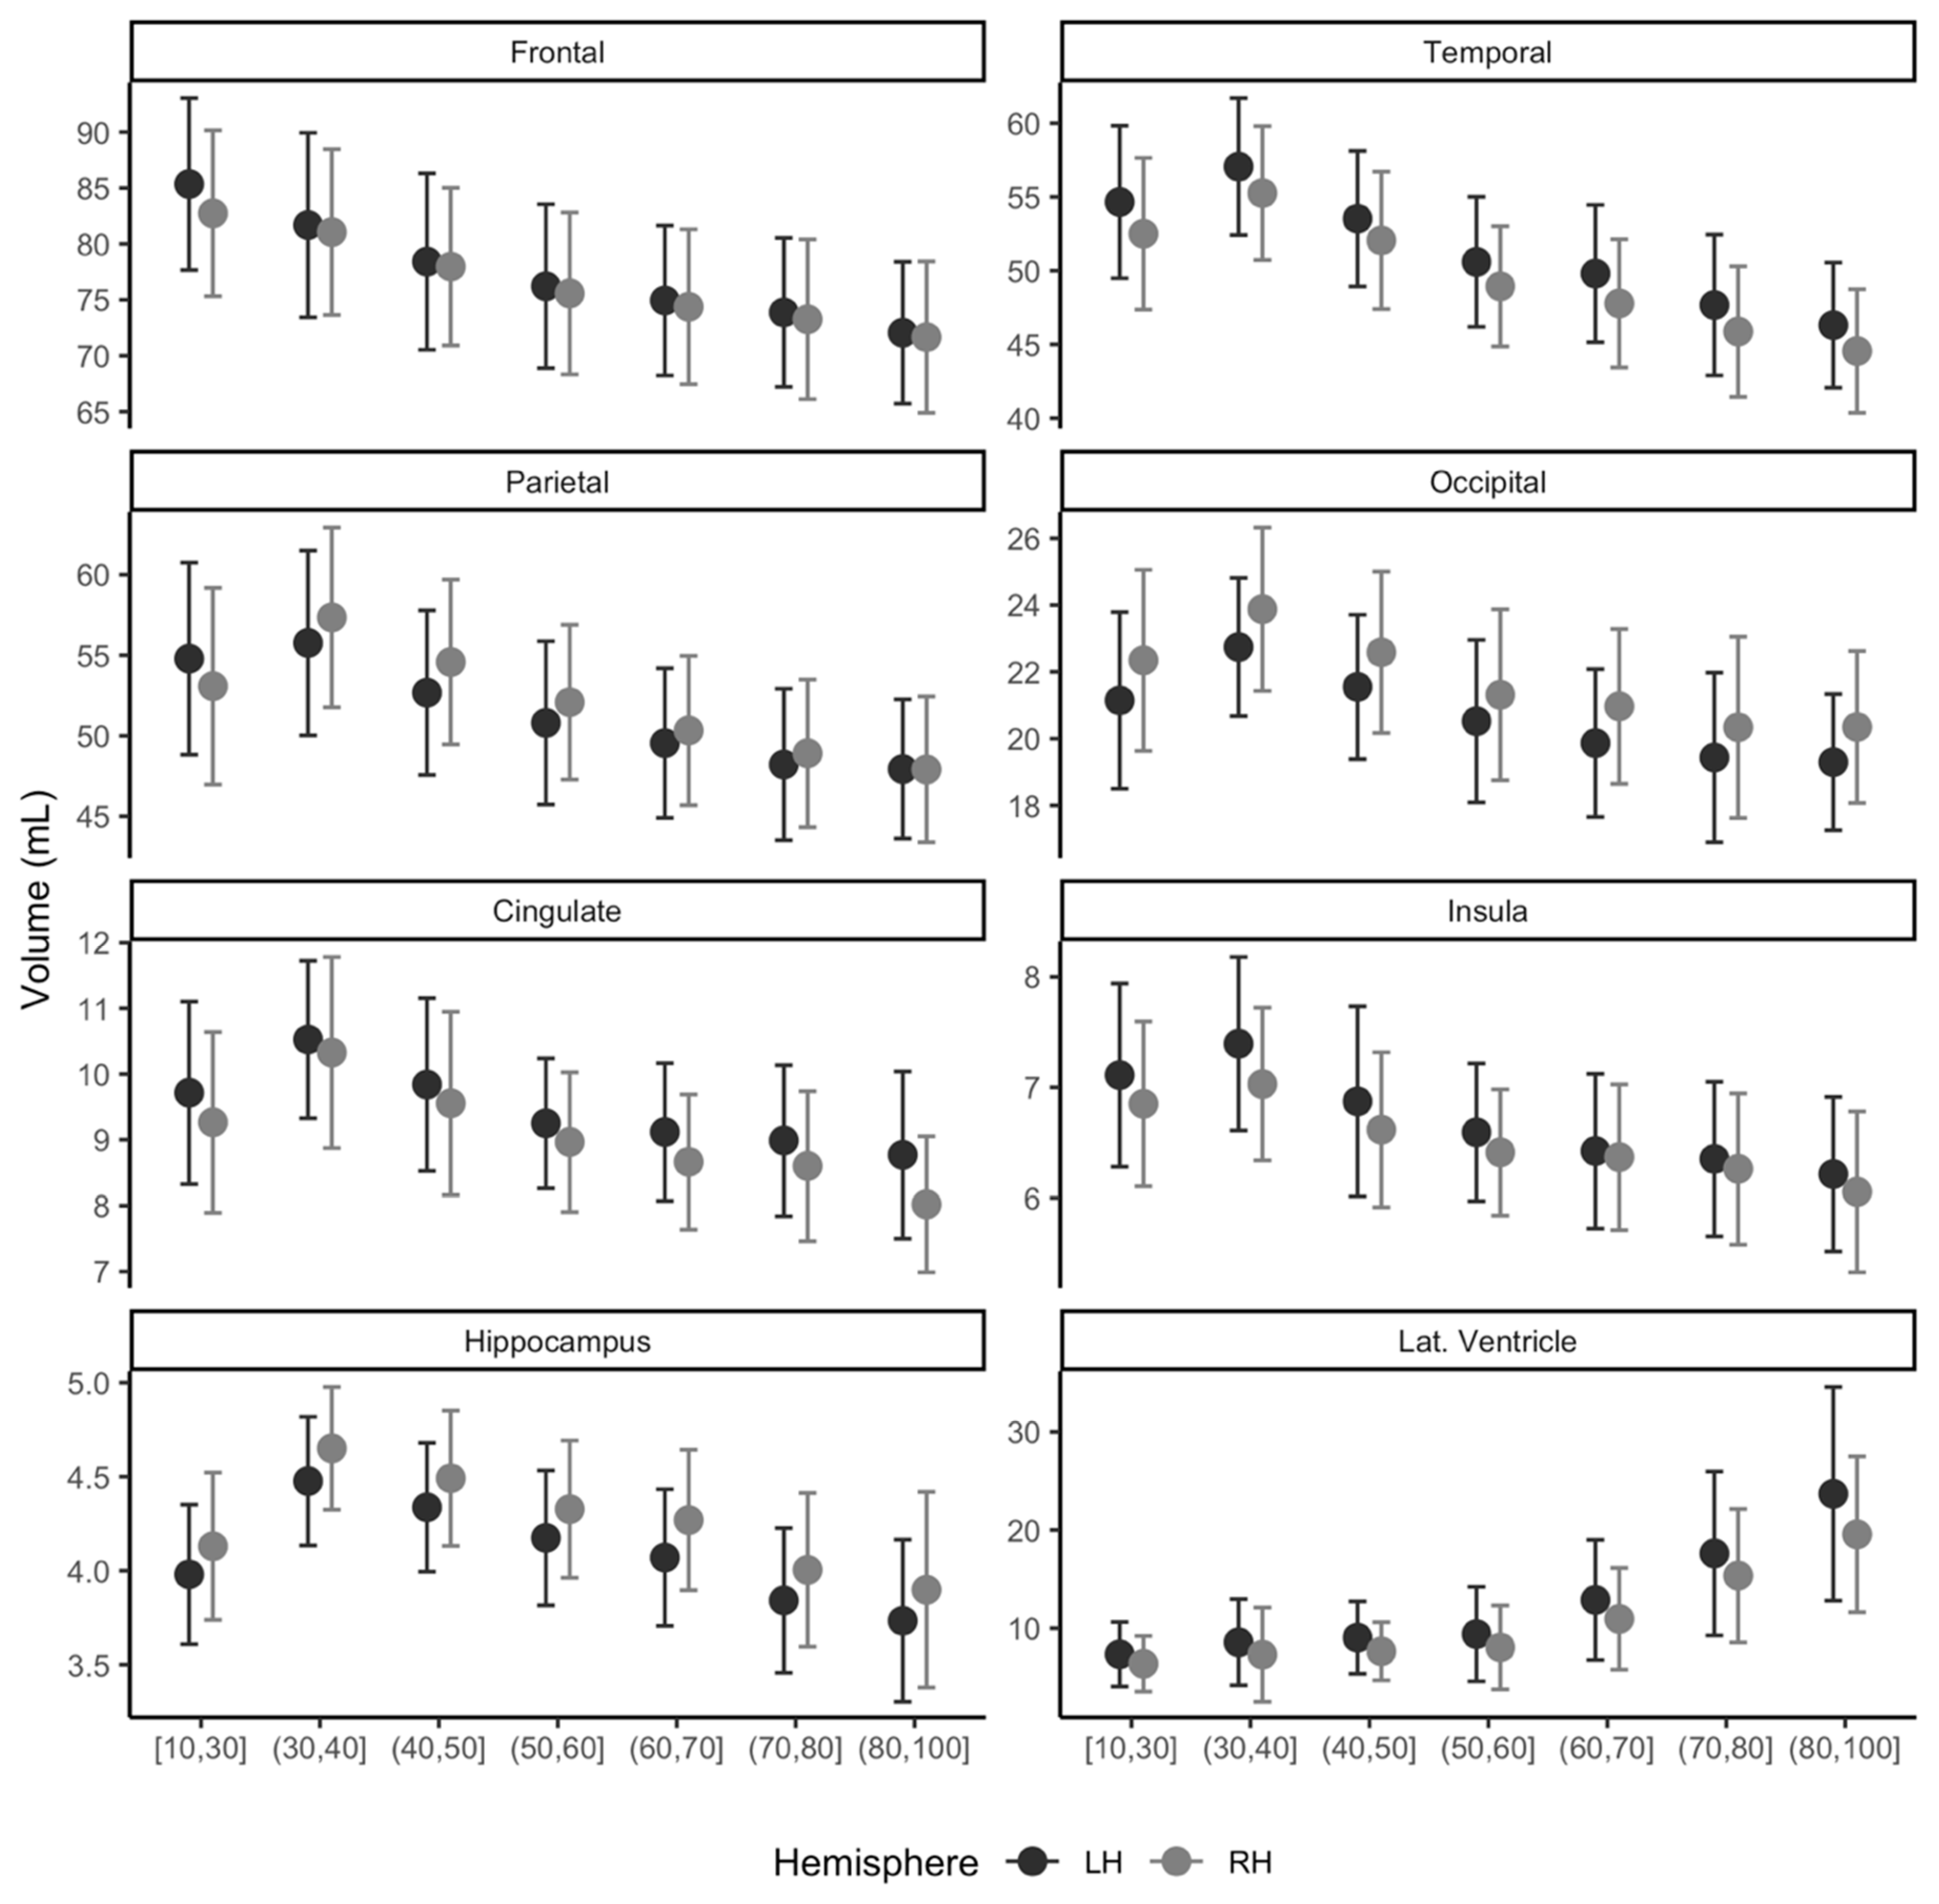
3.3. Normative Distribution for Adults Ages between 19 and 96 Years
3.4. Usage of Normative Modeling: Differences of MCI and Dementia in Volumes
3.5. Usage of Normative Modeling: Group Differences in Volumes within Age Subgroups
4. Discussion
5. Conclusions
Supplementary Materials
Author Contributions
Funding
Institutional Review Board Statement
Informed Consent Statement
Data Availability Statement
Conflicts of Interest
References
- O’Connor, P.J. Normative data: Their definition, interpretation, and importance for primary care physicians. Fam. Med. 1990, 22, 307–311. [Google Scholar] [PubMed]
- Brewer, J.B. Fully-automated volumetric MRI with normative ranges: Translation to clinical practice. Behav. Neurol. 2009, 21, 21–28. [Google Scholar] [CrossRef] [PubMed]
- Courchesne, E.; Chisum, H.J.; Townsend, J.; Cowles, A.; Covington, J.; Egaas, B.; Harwood, M.; Hinds, S.; Press, G.A. Normal Brain Development and Aging: Quantitative Analysis at in Vivo MR Imaging in Healthy Volunteers. Radiology 2000, 216, 672–682. [Google Scholar] [CrossRef] [PubMed]
- Ball, W.S.; Byars, A.W.; Schapiro, M.; Bommer, W.; Carr, A.; German, A.; Dunn, S.; Rivkin, M.J.; Waber, D.; Mulkern, R.; et al. Total and regional brain volumes in a population-based normative sample from 4 to 18 years: The NIH MRI study of normal brain development. Cereb. Cortex 2012, 22, 1–12. [Google Scholar]
- Potvin, O.; Mouiha, A.; Dieumegarde, L.; Duchesne, S. Normative data for subcortical regional volumes over the lifetime of the adult human brain. Neuroimage 2016, 137, 9–20. [Google Scholar] [CrossRef]
- Choi, Y.Y.; Lee, J.J.; Choi, K.Y.; Seo, E.H.; Choo, I.L.H.; Lee, K.H.; Klaus, F. The Aging Slopes of Brain Structures Vary by Ethnicity and Sex: Evidence From a Large Magnetic Resonance Imaging Dataset From a Single Scanner of Cognitively Healthy Elderly People in Korea. Front. Aging Neurosci. 2020, 12, 1–11. [Google Scholar]
- Kim, R.E.; Yun, C.-H.; Thomas, R.J.; Oh, J.; Johnson, H.J.; Kim, S.; Lee, S.; Seo, H.S.; Shin, C. Lifestyle-dependent Brain Change: A Longitudinal Cohort MRI Study. Neurobiol. Aging 2018, 69, 48–57. [Google Scholar] [CrossRef]
- Tong, Q.; He, H.; Gong, T.; Li, C.; Liang, P.; Qian, T.; Sun, Y.; Ding, Q.; Li, K.; Zhong, J. Multicenter dataset of multi-shell diffusion MRI in healthy traveling adults with identical settings. Sci. Data 2020, 7, 1–7. [Google Scholar] [CrossRef]
- Lin, Q.; Dai, Z.; Xia, M.; Han, Z.; Huang, R.; Gong, G.; Liu, C.; Bi, Y.; He, Y. A connectivity-based test-retest dataset of multi-modal magnetic resonance imaging in young healthy adults. Sci. Data 2015, 2, 150056. [Google Scholar] [CrossRef]
- Biswal, B.B.; Mennes, M.; Zuo, X.N.; Gohel, S.; Kelly, C.; Smith, S.M.; Beckmann, C.F.; Adelstein, J.S.; Buckner, R.L.; Colcombe, S.; et al. Toward discovery science of human brain function. Proc. Natl. Acad. Sci. USA 2010, 107, 4734–4739. [Google Scholar] [CrossRef]
- Kang, D.W.; Choi, W.H.; Jung, W.S.; Um, Y.H.; Lee, C.U.; Lim, H.K. Impact of Amyloid Burden on Regional Functional Synchronization in the Cognitively Normal Older Adults. Sci. Rep. 2017, 7, 3–11. [Google Scholar] [CrossRef] [PubMed]
- Nyúl, L.G.; Udupa, J.K.; Zhang, X. New variants of a method of MRI scale standardization. IEEE Trans. Med. Imaging 2000, 19, 143–150. [Google Scholar] [CrossRef] [PubMed]
- Gibson, E.; Li, W.; Sudre, C.; Fidon, L.; Shakir, D.I.; Wang, G.; Eaton-Rosen, Z.; Gray, R.; Doel, T.; Hu, Y.; et al. NiftyNet: A deep-learning platform for medical imaging. Comput. Methods Programs Biomed. 2018, 158, 113–122. [Google Scholar] [CrossRef] [PubMed]
- Samet, H.; Tamminen, M.K. Efficient Component Labeling of Images of Arbitrary Dimension Represented by Linear Bintrees. IEEE Trans. Pattern Anal. Mach. Intell. 1988, 10, 579–586. [Google Scholar] [CrossRef]
- Shrout, P.E.; Fleiss, J.L. Intraclass correlations: Uses in assessing rater reliability. Psychol. Bull. 1979, 86, 420–428. [Google Scholar] [CrossRef] [PubMed]
- Jovicich, J.; Czanner, S.; Han, X.; Salat, D.; van der Kouwe, A.; Quinn, B.; Pacheco, J.; Albert, M.; Killiany, R.; Blacker, D.; et al. MRI-derived measurements of human subcortical, ventricular and intracranial brain volumes: Reliability effects of scan sessions, acquisition sequences, data analyses, scanner upgrade, scanner vendors and field strengths. Neuroimage 2009, 46, 177–192. [Google Scholar] [CrossRef]
- Ge, Y.; Grossman, R.I.; Babb, J.S.; Rabin, M.L.; Mannon, L.J.; Kolson, D.L. Age-related total gray matter and white matter changes in normal adult brain. Part I: Volumetric MR imaging analysis. AJNR. Am. J. Neuroradiol. 2002, 23, 1327–1333. [Google Scholar]
- Fotenos, A.F.; Snyder, A.Z.; Girton, L.E.; Morris, J.C.; Buckner, R.L. Normative estimates of cross-sectional and longitudinal brain volume decline in aging and AD. Neurology 2005, 64, 1032–1039. [Google Scholar] [CrossRef]
- Fotenos, A.F.; Mintun, M.A.; Snyder, A.Z.; Morris, J.C.; Buckner, R.L. Brain Volume Decline in Aging. Arch. Neurol. 2008, 65, 113–120. [Google Scholar] [CrossRef]
- Sigurdsson, S.; Aspelund, T.; Forsberg, L.; Fredriksson, J.; Kjartansson, O.; Oskarsdottir, B.; Jonsson, P.V.; Eiriksdottir, G.; Harris, T.B.; Zijdenbos, A.; et al. Brain tissue volumes in the general population of the elderly The AGES-Reykjavik Study. Neuroimage 2011, 59, 3862–3870. [Google Scholar] [CrossRef]
- Long, X.; Liao, W.; Jiang, C.; Liang, D.; Qiu, B.; Zhang, L. Healthy aging: An automatic analysis of global and regional morphological alterations of human brain. Acad. Radiol. 2012, 19, 785–793. [Google Scholar] [CrossRef] [PubMed]
- Pini, L.; Pievani, M.; Bocchetta, M.; Altomare, D.; Bosco, P.; Cavedo, E.; Galluzzi, S.; Marizzoni, M.; Frisoni, G.B. Brain atrophy in Alzheimer’s Disease and aging. Ageing Res. Rev. 2016, 30, 25–48. [Google Scholar] [CrossRef] [PubMed]
- Fjell, A.M.; Walhovd, K.B.; Fennema-Notestine, C.; McEvoy, L.K.; Hagler, D.J.; Holland, D.; Brewer, J.B.; Dale, A.M. One year brain atrophy evident in healthy aging. J. Neurosci. 2010, 9, 19–22. [Google Scholar] [CrossRef] [PubMed]
- Lehmann, M.; Rohrer, J.D.; Clarkson, M.J.; Ridgway, G.R.; Scahill, R.I.; Modat, M.; Warren, J.D.; Ourselin, S.; Barnes, J.; Rossor, M.N.; et al. Reduced cortical thickness in the posterior cingulate gyrus is characteristic of both typical and atypical alzheimer’s disease. J. Alzheimer’s Dis. 2010, 20, 587–598. [Google Scholar] [CrossRef] [PubMed]


| Cognitive Normal n = 992 | MCI n = 524 | Dementia n = 163 | p | |||
|---|---|---|---|---|---|---|
| Age, years | 51.4 ± 20.9 | 75.2 ± 8.2 | 78.9 ± 8.4 | <0.001 | ||
| CDR | 0.0 ± 0.0 | 0.5 ± 0.0 | 1.3 ± 0.6 | <0.001 | ||
| CDR Sum of box | 0.1 ± 0.3 | 1.8 ± 1.2 | 7.2 ± 3.5 | <0.001 | ||
| Female, % (n) | 64.1 (636) | 67.7 (354) | 70.6 (115) | |||
| Education, years | 12.1 ± 4.2 | 9.5 ± 5.2 | 8.5 ± 5.6 | <0.001 | ||
| ICV, mL | 1519.3 ± 136.5 | 1487.9 ± 132.5 | 1476.5 ± 137.3 | <0.001 | ||
| Cognitive normal across centers | ||||||
| Site K1 | Site K2 | Site K3 | Site O3 | Site O2 | ||
| n = 647 | n = 62 | n = 29 | n = 198 | n = 57 | ||
| Age, years | 61.4 (13.8) | 62.8 (7.2) | 64.0 (8.2) | 21.2 (1.8) | 23.1 (2.3) | |
| Age, min-max | 18–96 | 51–82 | 49–78 | 18–26 | 19–30 | |
| Female, % (n) | 65.8% (426) | 75.8% (47) | 34.5% (10) | 61.6% (122) | 65.8% (30) | |
| Education, years | 12.1 (4.4) | 10.9 (4.3) | 11.4 (4) | 14.0 (0.0) | ||
| ICV, mL | 1501.9 (131.5) | 1470.6 (113.9) | 1500.7 (130.4) | 1571.4 (135.9) | 1598.0 (142.2) | |
| All Age Groups | ||||
|---|---|---|---|---|
| MCI, mL | p† | Dementia, mL | p† | |
| Frontal L | −0.93 0.30 | 0.002 | −3.21 0.43 | <0.001 |
| R | −1.15 0.30 | <0.001 | −3.25 0.44 | <0.001 |
| Temporal L | −2.18 0.21 | <0.001 | −5.03 0.31 | <0.001 |
| R | −2.44 0.22 | <0.001 | −4.76 0.32 | <0.001 |
| Parietal L | −1.23 0.21 | <0.001 | −2.74 0.31 | <0.001 |
| R | −1.60 0.22 | <0.001 | −3.37 0.32 | <0.001 |
| Occipital L | −0.33 0.13 | 0.009 | −1.00 0.18 | <0.001 |
| R | −0.42 0.13 | 0.001 | −1.01 0.18 | <0.001 |
| Insula L | −0.15 0.03 | <0.001 | −0.36 0.05 | <0.001 |
| R | −0.22 0.03 | <0.001 | −0.51 0.05 | <0.001 |
| Cingulate L | −0.30 0.06 | <0.001 | −0.68 0.08 | <0.001 |
| R | −0.41 0.06 | <0.001 | −0.74 0.09 | <0.001 |
| Hippocampus L | −0.37 0.02 | <0.001 | −0.66 0.04 | <0.001 |
| R | −0.39 0.03 | <0.001 | −0.65 0.04 | <0.001 |
| Lateral ventricle L | 5.68 0.52 | <0.001 | 9.63 0.76 | <0.001 |
| R | 5.12 0.45 | <0.001 | 8.87 0.66 | <0.001 |
| Age 71–80 | p† | Age 81–100 | p† | |||||
|---|---|---|---|---|---|---|---|---|
| MCI | p† | Dementia | MCI | p† | Dementia | |||
| Frontal L | −1.52 ± 0.45 | 0.001 | −3.84 ± 0.64 | <0.001 | −1.64 ± 0.81 | 0.043 | −3.59 ± 0.87 | <0.001 |
| R | −1.61 ± 0.47 | 0.001 | −3.41 ± 0.68 | <0.001 | −1.82 ± 0.79 | 0.023 | −3.50 ± 0.86 | <0.001 |
| Temporal L | −1.51 ± 0.34 | <0.001 | −4.14 ± 0.49 | <0.001 | −2.26 ± 0.64 | 0.001 | −4.21 ± 0.69 | <0.001 |
| R | −1.79 ± 0.36 | <0.001 | −4.30 ± 0.52 | <0.001 | −2.63 ± 0.64 | <0.001 | −3.80 ± 0.69 | <0.001 |
| Parietal L | −0.61 ± 0.31 | 0.047 | −2.16 ± 0.44 | <0.001 | −1.62 ± 0.63 | 0.011 | −2.84 ± 0.68 | <0.001 |
| R | −0.75 ± 0.31 | 0.015 | −2.41 ± 0.44 | <0.001 | −1.45 ± 0.54 | 0.008 | −2.36 ± 0.59 | <0.001 |
| Occipital L | −0.03 ± 0.20 | 0.867 | −0.60 ± 0.29 | 0.040 | −0.40 ± 0.34 | 0.238 | −0.88 ± 0.36 | 0.016 |
| R | −0.12 ± 0.19 | 0.532 | −0.72 ± 0.28 | 0.009 | −0.40 ± 0.32 | 0.213 | −0.83 ± 0.34 | 0.017 |
| Insula L | −0.30 ± 0.09 | 0.002 | −0.78 ± 0.14 | <0.001 | −0.28 ± 0.16 | 0.077 | −0.46 ± 0.17 | 0.008 |
| R | −0.44 ± 0.10 | <0.001 | −0.85 ± 0.14 | <0.001 | −0.31 ± 0.18 | 0.082 | −0.48 ± 0.19 | 0.015 |
| Cingulate L | −0.20 ± 0.05 | <0.001 | −0.47 ± 0.08 | <0.001 | −0.16 ± 0.10 | 0.120 | −0.25 ± 0.11 | 0.023 |
| R | −0.22 ± 0.05 | <0.001 | −0.52 ± 0.08 | <0.001 | −0.23 ± 0.10 | 0.023 | −0.44 ± 0.11 | <0.001 |
| Hippocampus L | −0.30 ± 0.04 | <0.001 | −0.57 ± 0.06 | <0.001 | −0.34 ± 0.07 | <0.001 | −0.50 ± 0.08 | <0.001 |
| R | −0.28 ± 0.05 | <0.001 | −0.53 ± 0.07 | <0.001 | −0.36 ± 0.08 | <0.001 | −0.45 ± 0.08 | <0.001 |
| Lateral ventricle L | 4.84 ± 1.01 | <0.001 | 10.45 ± 1.44 | <0.001 | 5.00 ± 1.90 | 0.009 | 6.05 ± 2.04 | 0.003 |
| R | 4.14 ± 0.87 | <0.001 | 8.39 ± 1.25 | <0.001 | 6.37 ± 1.67 | <0.001 | 7.51 ± 1.80 | <0.001 |
Publisher’s Note: MDPI stays neutral with regard to jurisdictional claims in published maps and institutional affiliations. |
© 2020 by the authors. Licensee MDPI, Basel, Switzerland. This article is an open access article distributed under the terms and conditions of the Creative Commons Attribution (CC BY) license (http://creativecommons.org/licenses/by/4.0/).
Share and Cite
Kim, R.E.Y.; Lee, M.; Kang, D.W.; Wang, S.-M.; Kim, N.-Y.; Lee, M.K.; Lim, H.K.; Kim, D. Deep Learning-Based Segmentation to Establish East Asian Normative Volumes Using Multisite Structural MRI. Diagnostics 2021, 11, 13. https://doi.org/10.3390/diagnostics11010013
Kim REY, Lee M, Kang DW, Wang S-M, Kim N-Y, Lee MK, Lim HK, Kim D. Deep Learning-Based Segmentation to Establish East Asian Normative Volumes Using Multisite Structural MRI. Diagnostics. 2021; 11(1):13. https://doi.org/10.3390/diagnostics11010013
Chicago/Turabian StyleKim, Regina E. Y., Minho Lee, Dong Woo Kang, Sheng-Min Wang, Nak-Young Kim, Min Kyoung Lee, Hyun Kook Lim, and Donghyeon Kim. 2021. "Deep Learning-Based Segmentation to Establish East Asian Normative Volumes Using Multisite Structural MRI" Diagnostics 11, no. 1: 13. https://doi.org/10.3390/diagnostics11010013
APA StyleKim, R. E. Y., Lee, M., Kang, D. W., Wang, S.-M., Kim, N.-Y., Lee, M. K., Lim, H. K., & Kim, D. (2021). Deep Learning-Based Segmentation to Establish East Asian Normative Volumes Using Multisite Structural MRI. Diagnostics, 11(1), 13. https://doi.org/10.3390/diagnostics11010013


