Article

Anthropometric Measurements and Frailty in Patients with Liver Diseases

1
Department of Internal Medicine, Division of Gastroenterology and Hepatology, Hyogo College of Medicine, Nishinomiya, Hyogo 663-8501, Japan
2
Center for Clinical Research and Education, Hyogo College of Medicine, Nishinomiya, Hyogo 663-8501, Japan
3
Kano General Hospital, Osaka, Osaka 531-0041, Japan
*
Author to whom correspondence should be addressed.
These authors contributed equally to this work.
Diagnostics 2020, 10(6), 433; https://doi.org/10.3390/diagnostics10060433
Submission received: 12 June 2020 / Revised: 23 June 2020 / Accepted: 23 June 2020 / Published: 25 June 2020
(This article belongs to the Special Issue Skeletal Muscle Diagnostics and Managements)

Abstract

:
There have been scarce data regarding the relationship between frailty and anthropometry measurements (AMs) in patients with chronic liver diseases (CLDs). We aimed to elucidate the influence of AMs on frailty in CLDs (median age = 66 years, 183 men and 192 women). AMs included arm circumference, triceps skinfold thickness, calf circumference (CC), waist circumference, and body mass index. Frailty assessment was done by using five phenotypes (body weight loss, exhaustion, decreased muscle strength, slow walking speed, and low physical activity). Robust (frailty point 0), prefrail (frailty point 1 or 2), and frailty (frailty point 3 or more) were observed in 63 (34.4%), 98 (53.6%), and 22 (12.0%) of males, respectively, and 63 (32.8%), 101 (52.6%), and 28 (14.6%) of females, respectively. In receiver operating characteristics (ROC) curve analyses for the presence of frailty, CC had the highest area under the ROC (AUC) both in male (AUC = 0.693, cutoff point = 33.7 cm) and female (AUC = 0.734, cutoff point = 33.4 cm) participants. In the multivariate analysis associated with frailty, for the male participants, only the presence of liver cirrhosis (p = 0.0433) was identified to be significant, while among the female participants, serum albumin (p = 0.0444) and CC (p = 0.0010) were identified to be significant. In conclusion, CC can be helpful for predicting frailty, especially in female CLD patients.

1. Introduction

Frailty is a concept globally used in geriatrics and is defined as a condition of increased vulnerability to endogenous and/or exogenous stressors associated with physiological decline, and it precedes disability in human life [1,2,3,4]. Originally, this concept was put forward in order to pick up aged individuals with a high risk of adverse health-related consequences, falls, disabilities, dependencies, and mortality [1,2,3]. Recently, frailty has been increasingly recognized in scientific medical reports, including in chronic liver diseases (CLDs) where it can be found in nearly half of patients with liver cirrhosis (LC) [5,6,7,8]. Frailty is considered to be reversible, with promising data supporting rehabilitation and lifestyle interventional programs [9,10,11]. Understanding how frailty is related to adverse outcomes requires looking at frailty as a systemic disorder as well as sarcopenia assessed by muscle mass decrease and muscle strength decline [8,12,13]. However, frailty and sarcopenia can occur with different prevalence, with variable impacts on outcomes in patients on waiting lists for liver transplantation [14].
Body composition analysis is an essential part of the assessment of nutritional status and can provide prognostically helpful insights and an opportunity to monitor the influences of nutrition-associated disease progression and nutritional interventions [15]. Anthropometric measurements (AMs) are convenient and non-invasive to evaluate body composition and thus, they are suitable for nutritional evaluation in daily clinical practice [15,16,17,18]. Arm circumference (AC) and calf circumference (CC) are primarily used to calculate muscle mass, and body mass index (BMI), triceps skinfold thickness (TSF), and waist circumference (WC) are primarily used to calculate fat mass [15]. Of those parameters, CC is recommended for its use in the revised Asian Working Group for Sarcopenia (AWGS) guidelines for the purpose of facilitating earlier identification of sarcopenic individuals [19]. In the revised AWGS guidelines, 34 cm in men and 33 cm in women are the cutoff points in CC for sarcopenia [19].
However, to the best of our knowledge, there have been scarce data regarding the relationship between frailty and AMs in patients with CLDs [20]. The aim of the study was to elucidate the influence of AMs on frailty in patients with CLDs.

2. Patients and Methods

2.1. Patients

This was a retrospective observational and cross-sectional study. A total of 375 CLD subjects with both frailty and AMs evaluable visited our hospital between July 2015 and April 2020, who were subjected to this analysis. Patients with large ascites who could suffer from a walking speed (WS) decline were not included in this study. LC was determined as reported elsewhere [21,22,23,24,25]. AMs included AC (cm), TSF (mm), CC (cm), WC (cm), and BMI (kg/m2). Frailty assessment was done as reported elsewhere [25]. Briefly, using 5 phenotypes proposed by Fried et al. (i.e., body weight (BW) loss without intention, exhaustion, muscle strength decline (grip strength (GS): <26 kg in men and <18 kg in women), slow walking speed (WS, <1.0 m/s), and low physical activity (being unable to do little exercise)), patients with 3 or more phenotypes were defined as frail, while patients with 1 or 2 phenotypes were defined as prefrail and those with no phenotype as robust [25,26,27]. GS and WS were calculated as reported elsewhere [25,28]. In our hospital, AMs have been done by an expert nutrition therapist after full explanation of the need and implication of AMs to patients. Measurement of AC, CC, TSF, and WC were based on Japanese anthropometric reference data 2001.
We examined the impact of AMs on frailty in male and female CLD patients in a retrospective manner. The institutional review board in Hyogo college of medicine hospital approved the research protocol (approval no. 3469, date of approval: 27 March 2020) and the 1975 Declaration of Helsinki was rigorously adhered to secure the rights of the patients. An opt out method was employed for the purpose of obtaining informed consent from the patients.

2.2. Statistical Considerations

All statistical analyses were done using the JMP 14 software (SAS Institute Inc., Cary, NC, USA). In the analysis of numerical variables, Mann-Whitney U-test or Student’s t-test, Kruskal-Wallis test, or analysis of variance (ANOVA) was employed to assess group characteristics when appropriate. In the analysis of categorical variables, percentages were compared using the chi-squared test or Fisher’s exact test, as applicable. Receiver operating characteristic curve (ROC) analysis and area under the ROC (AUC) data were shown along with the corresponding optimal cutoff point, sensitivity, and specificity. Quantitative data were expressed as medians with interquartile range (IQR). Significant parameters in the univariate analysis were subject to the multivariate logistic regression analysis to select candidate parameters. The statistical significance level was set at p < 0.05.

3. Results

3.1. Baseline Features

Baseline features of the study cohort (n = 183 in male (median (IQR) age = 66 (53, 72) years) and n = 192 in female (median (IQR) age = 66 (55, 72.8) years); p = 0.6237) were presented in Table 1. LC was identified at baseline in 72 cases (39.3%) in male participants and 58 cases (30.2%) in female participants (p = 0.0660). Hepatitis C virus accounted for 39.3% in male participants (72/183) and 55.2% (106/192) in female participants. In terms of albumin-bilirubin (ALBI) grade, ALBI grade 1 was in the majority, both in male (125/183, 68.3%) and female (155/192, 80.7%) participants. In male participants, frailty patients had a significantly higher age (p = 0.0126), lower serum albumin levels (p < 0.0001), and a higher proportion of LC (p = 0.0003) than prefrail or robust patients. Similarly, in female participants, patients had a significantly higher age (p = 0.0146), lower serum albumin levels (p = 0.0010), and a higher proportion of LC (p = 0.0001) than prefrail or robust patients.
The median (IQR) WS in male and female participants were 1.28 (1.08, 1.44) m/s and 1.32 (1.16, 1.47) (p = 0.4618), respectively. Twenty-eight male patients (15.3%) and 27 female patients (14.1%) had a WS decrease (i.e., <1.0 m/s). The median (IQR) GS in male and female participants were 33.3 (28.0, 39.0) kg and 21.0 (17.7, 24.5) kg. Thirty-five male patients (19.1%) and 50 female patients (26.0%) had a GS decrease (i.e., <26 kg in male and <18 kg in female). Eighty-two male patients (44.8%) and 92 female patients (47.9%) reported exhaustion. Fourteen male patients (7.7%) and 11 female patients (5.7%) reported BW loss. Fifty-one male patients (27.9%) and 44 female patients (22.9%) reported low physical activity. The frailty point ranged from 0 to 4 (median point = 1) in male and 0 to 5 (median point = 1) in female participants. Robust (frailty point 0), prefrail (frailty point 1 or 2), and frailty (frailty point 3 or more) were observed in 63 (34.4%), 98 (53.6%), and 22 (12.0%) in male participants, respectively, and 63 (32.8%), 101 (52.6%), and 28 (14.6%) in female participants, respectively.
In terms of AMs, the median (IQR) AC (cm), TSF (cm), WC (cm), CC (cm), and BMI (kg/m2) in male vs. female were: 28 (26, 30) cm vs. 28 (25, 30.8) cm in AC (p = 0.1688), 12 (9, 16) mm vs. 20 (15, 27) mm in TSF (p < 0.0001), 36.9 (34.4, 39.2) cm vs. 34.8 (32.7, 37.4) cm in CC (p < 0.0001), 89.5 (83.5, 97.0) cm vs. 85.8 (80, 92.5) cm in WC (p < 0.0001), and 23.2 (21.4, 25.9) kg/m2 vs. 22.3 (20.1, 25.5) kg/m2 (p = 0.0136) in BMI.

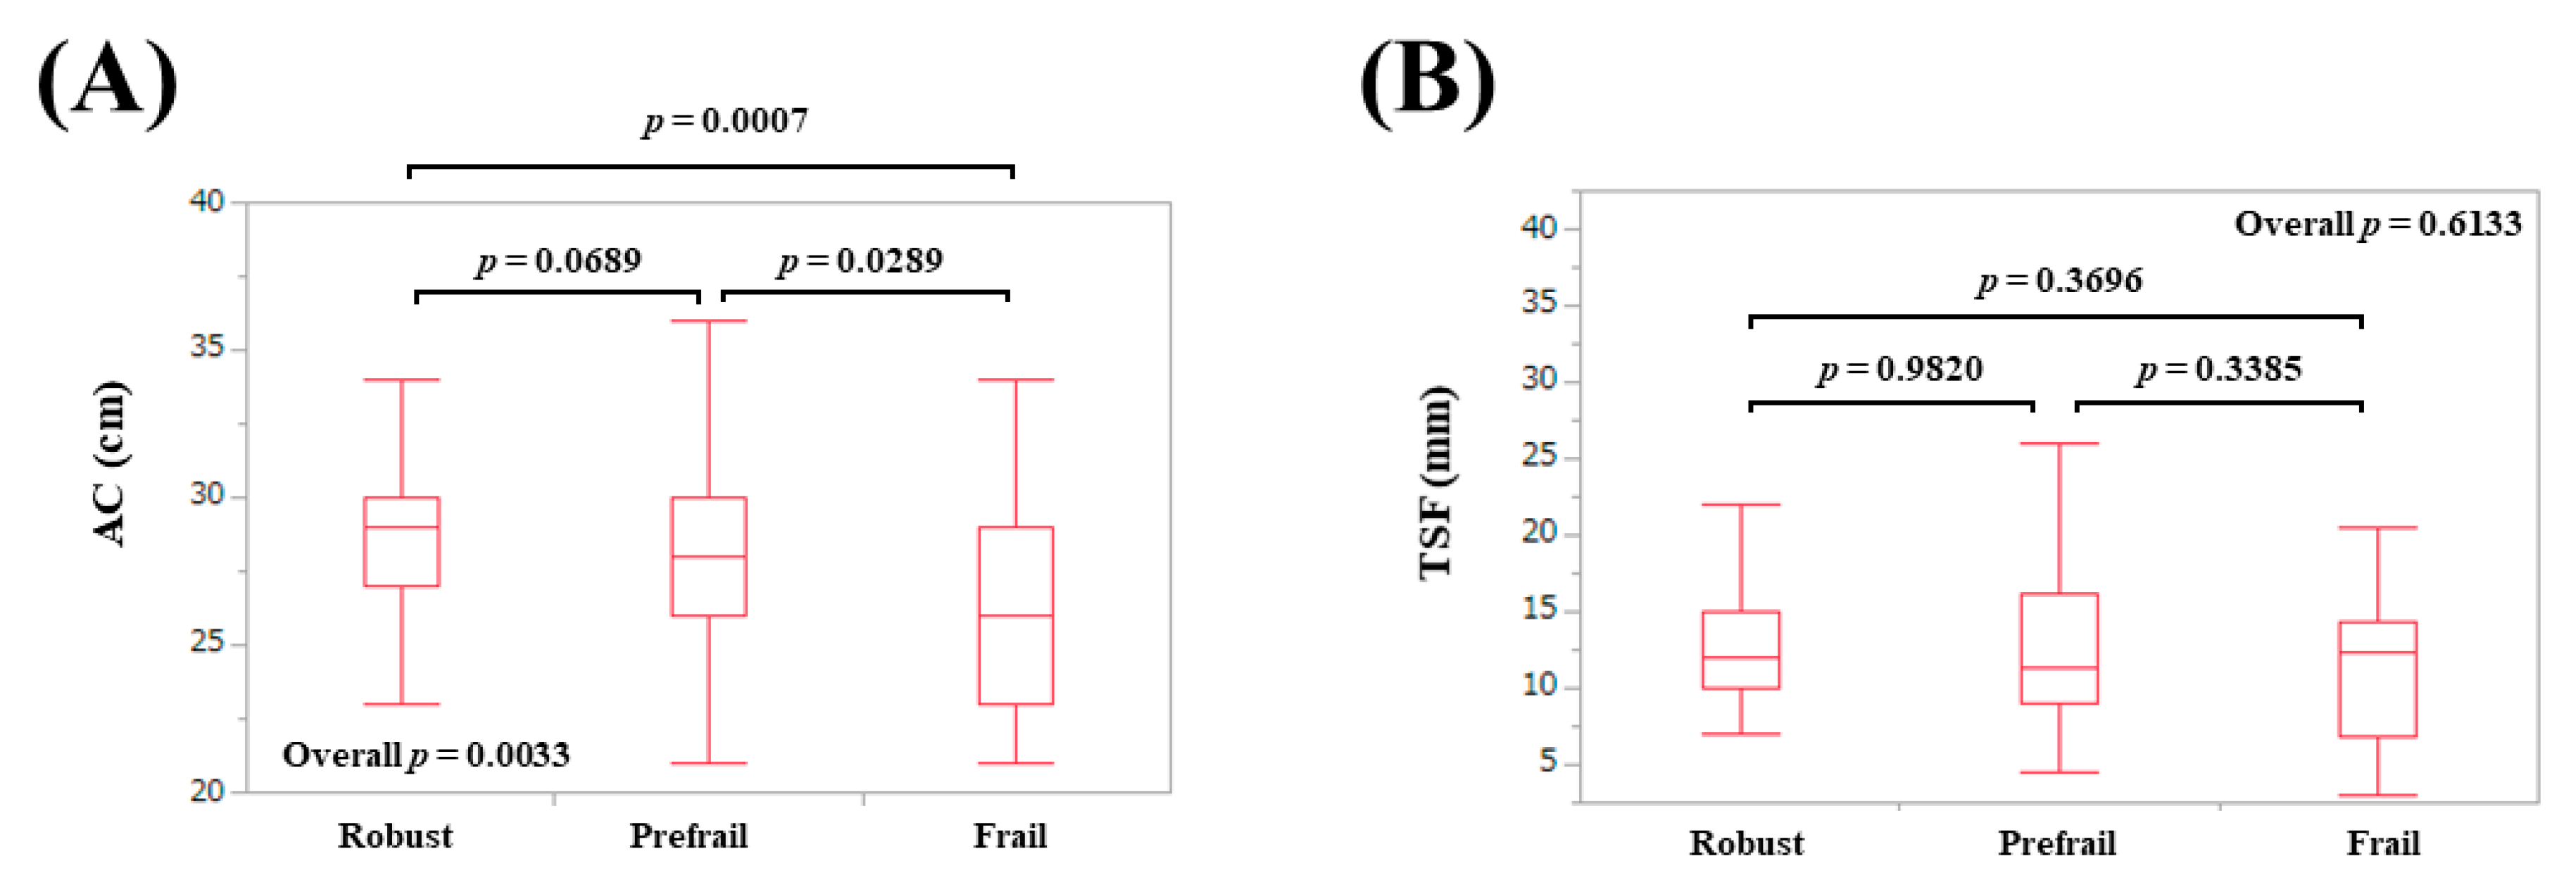
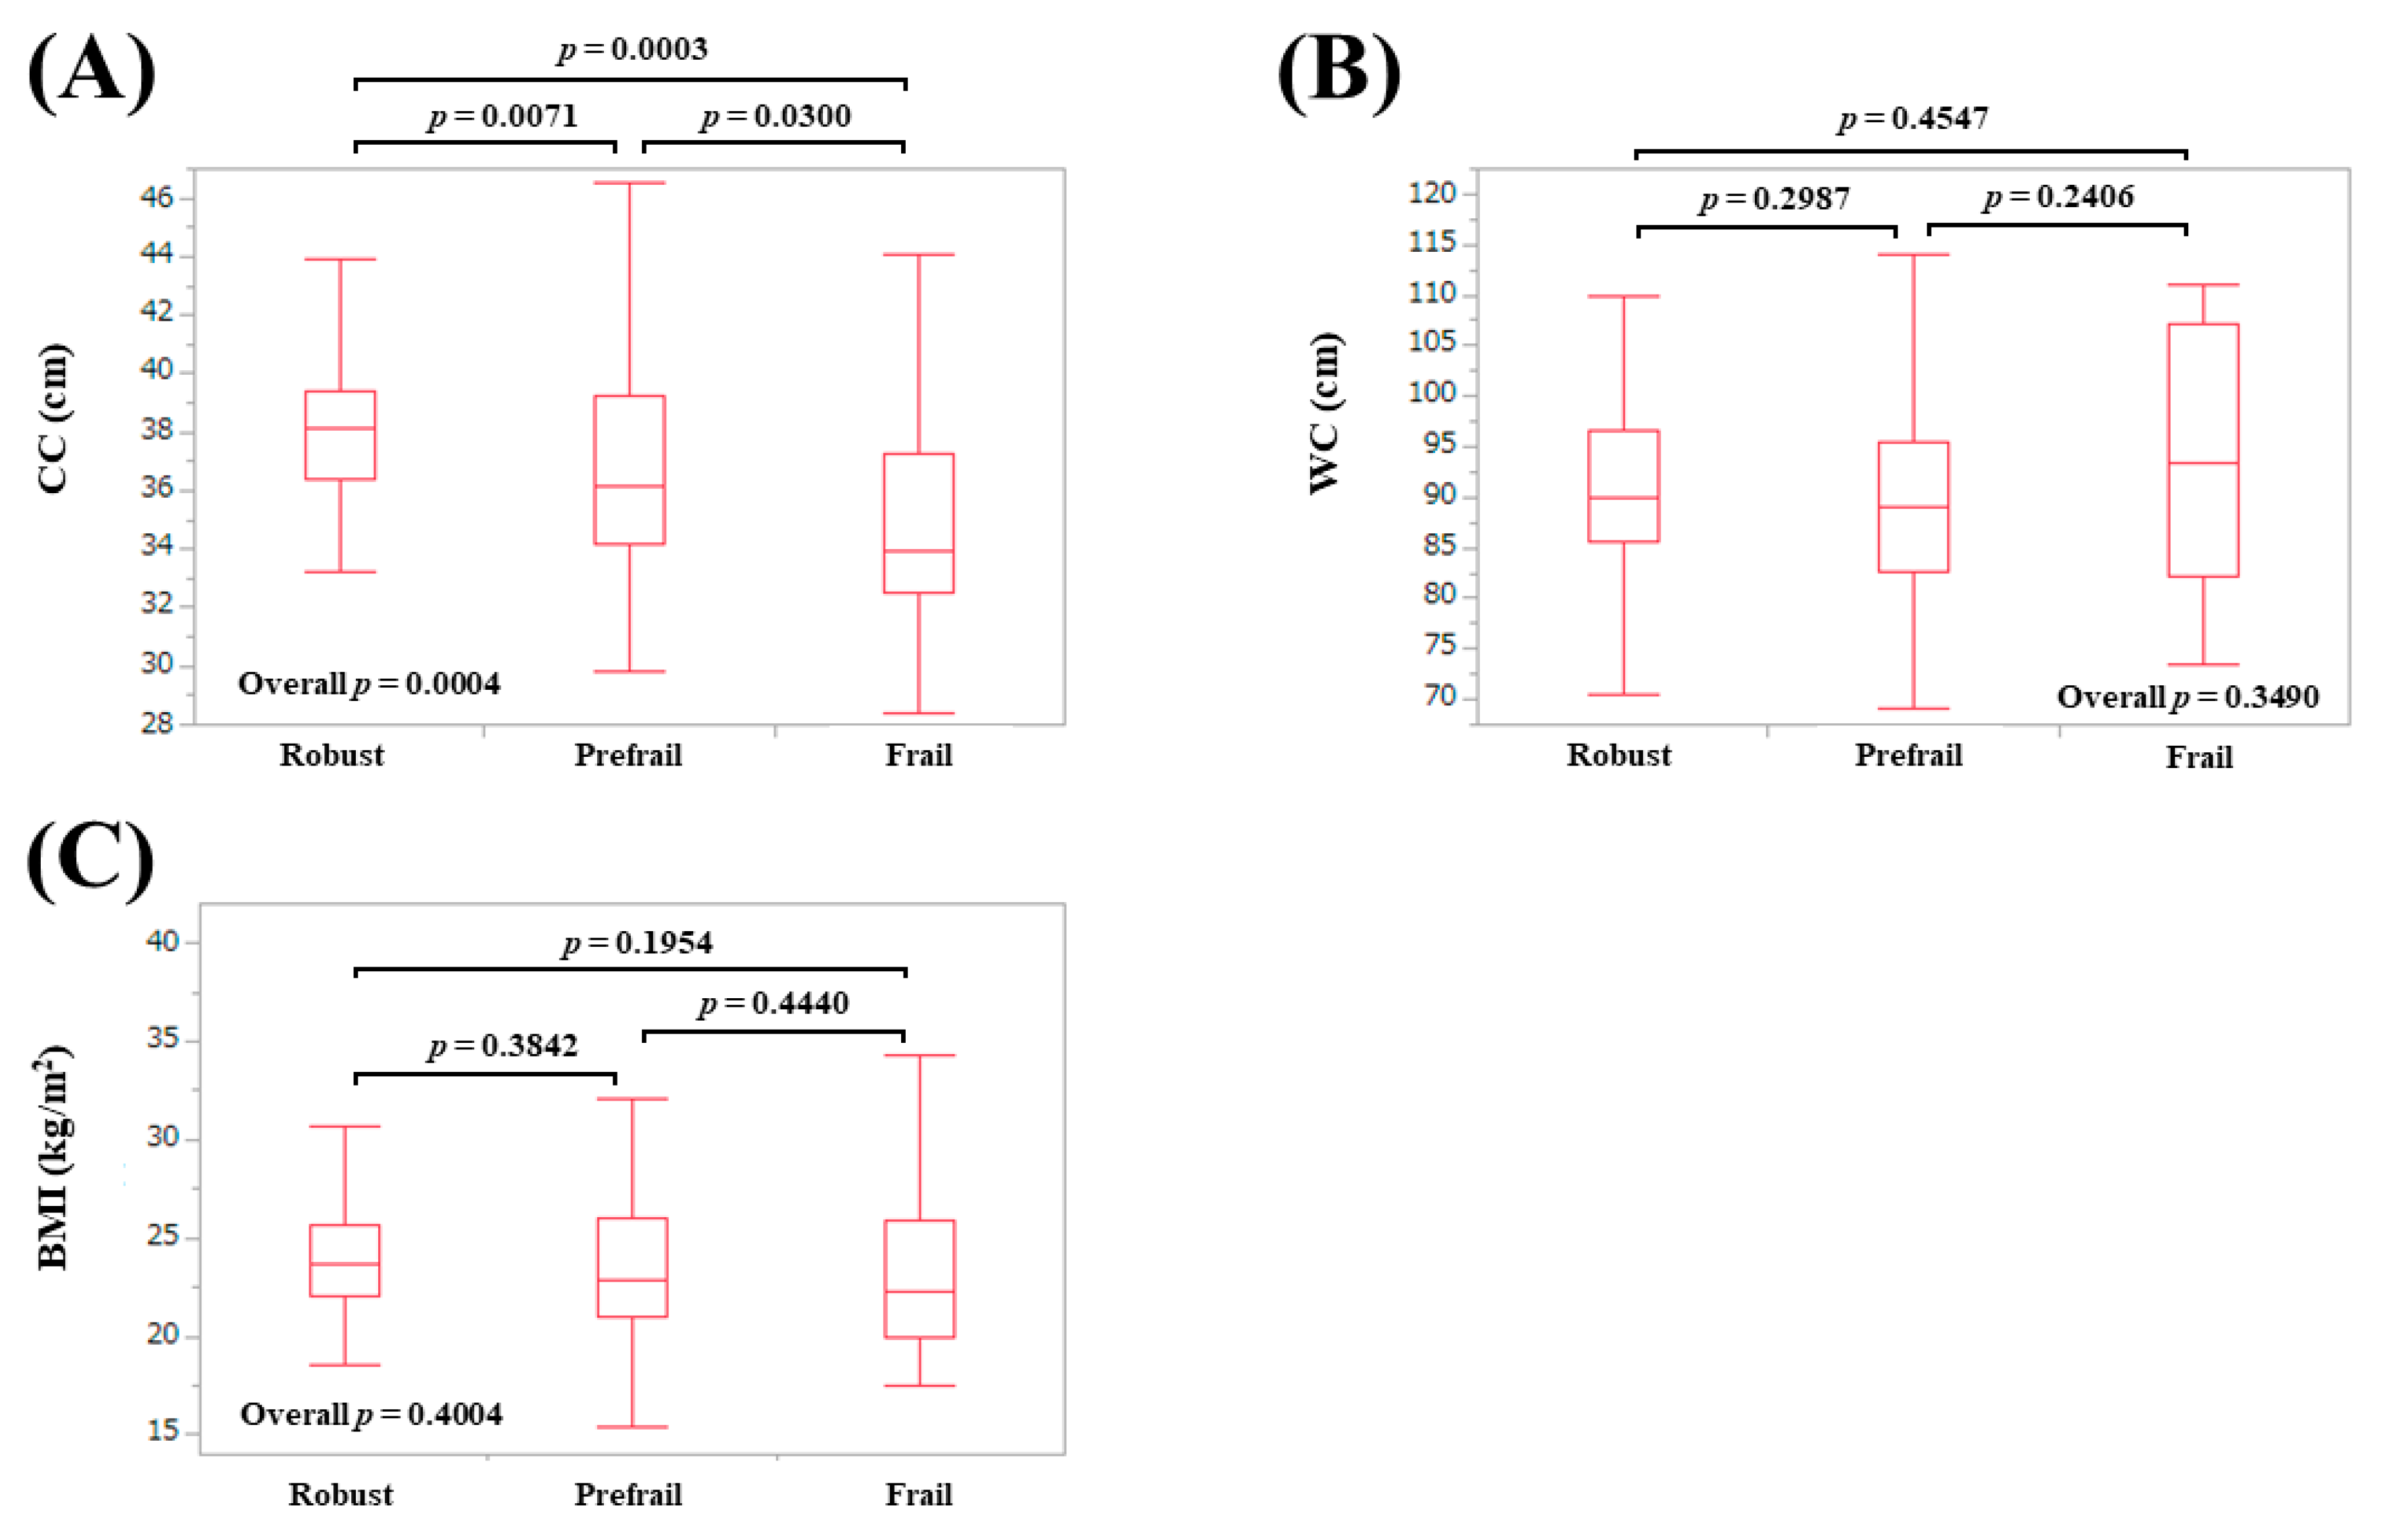
3.2. AMs According to Frailty Status in Males

The median (IQR) AC in patients defined as robust, prefrail, and frail were: 29 (27, 30) cm in robust, 28 (26, 30) cm in prefrail, and 26 (23, 29) cm in frail (overall p = 0.0033) (Figure 1A). The median (IQR) TSF in patients defined as robust, prefrail, and frail were: 12 (10, 15) mm in robust, 11.25 (9, 16.1) mm in prefrail, and 12.3 (6.9, 14.3) mm in frail (overall p = 0.6133) (Figure 1B). The median (IQR) CC in patients defined as robust, prefrail, and frail were: 38.1 (36.4, 39.4) cm in robust, 36.2 (34.2, 39.25) cm in prefrail, and 34.0 (32.5, 37.3) cm in frail (overall p = 0.0004) (Figure 2A). The median (IQR) WC in patients defined as robust, prefrail, and frail were: 90 (85.5, 96.5) cm in robust, 89 (82.7, 95.5) cm in prefrail, and 93.4 (82.3, 107.3) cm in frail (overall p = 0.3490) (Figure 2B). The median (IQR) BMI in patients defined as robust, prefrail, and frail were: 23.7 (22, 25.7) kg/m2 in robust, 22.9 (21.0, 26) kg/m2 in prefrail, and 22.3 (20.0, 26.0) kg/m2 in frail (overall p = 0.4004) (Figure 2C).

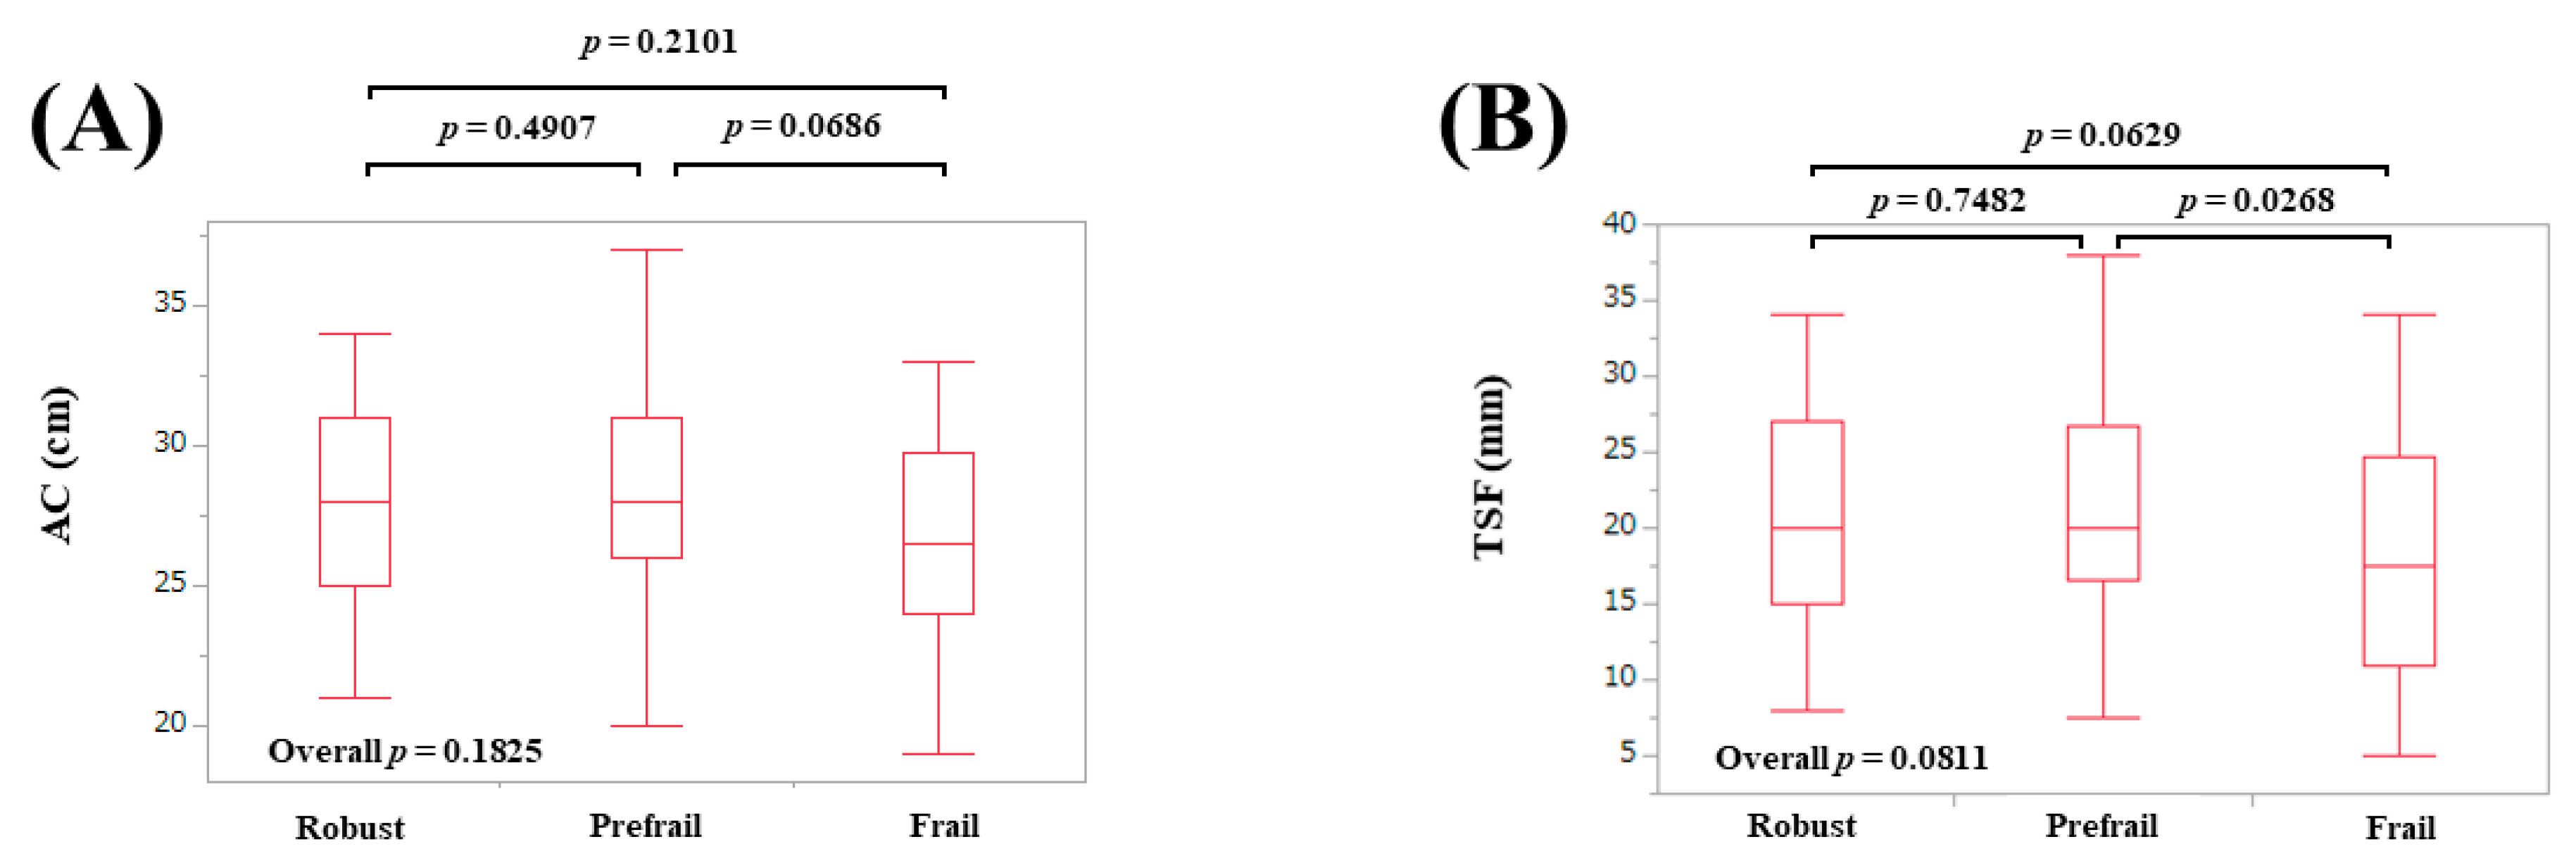
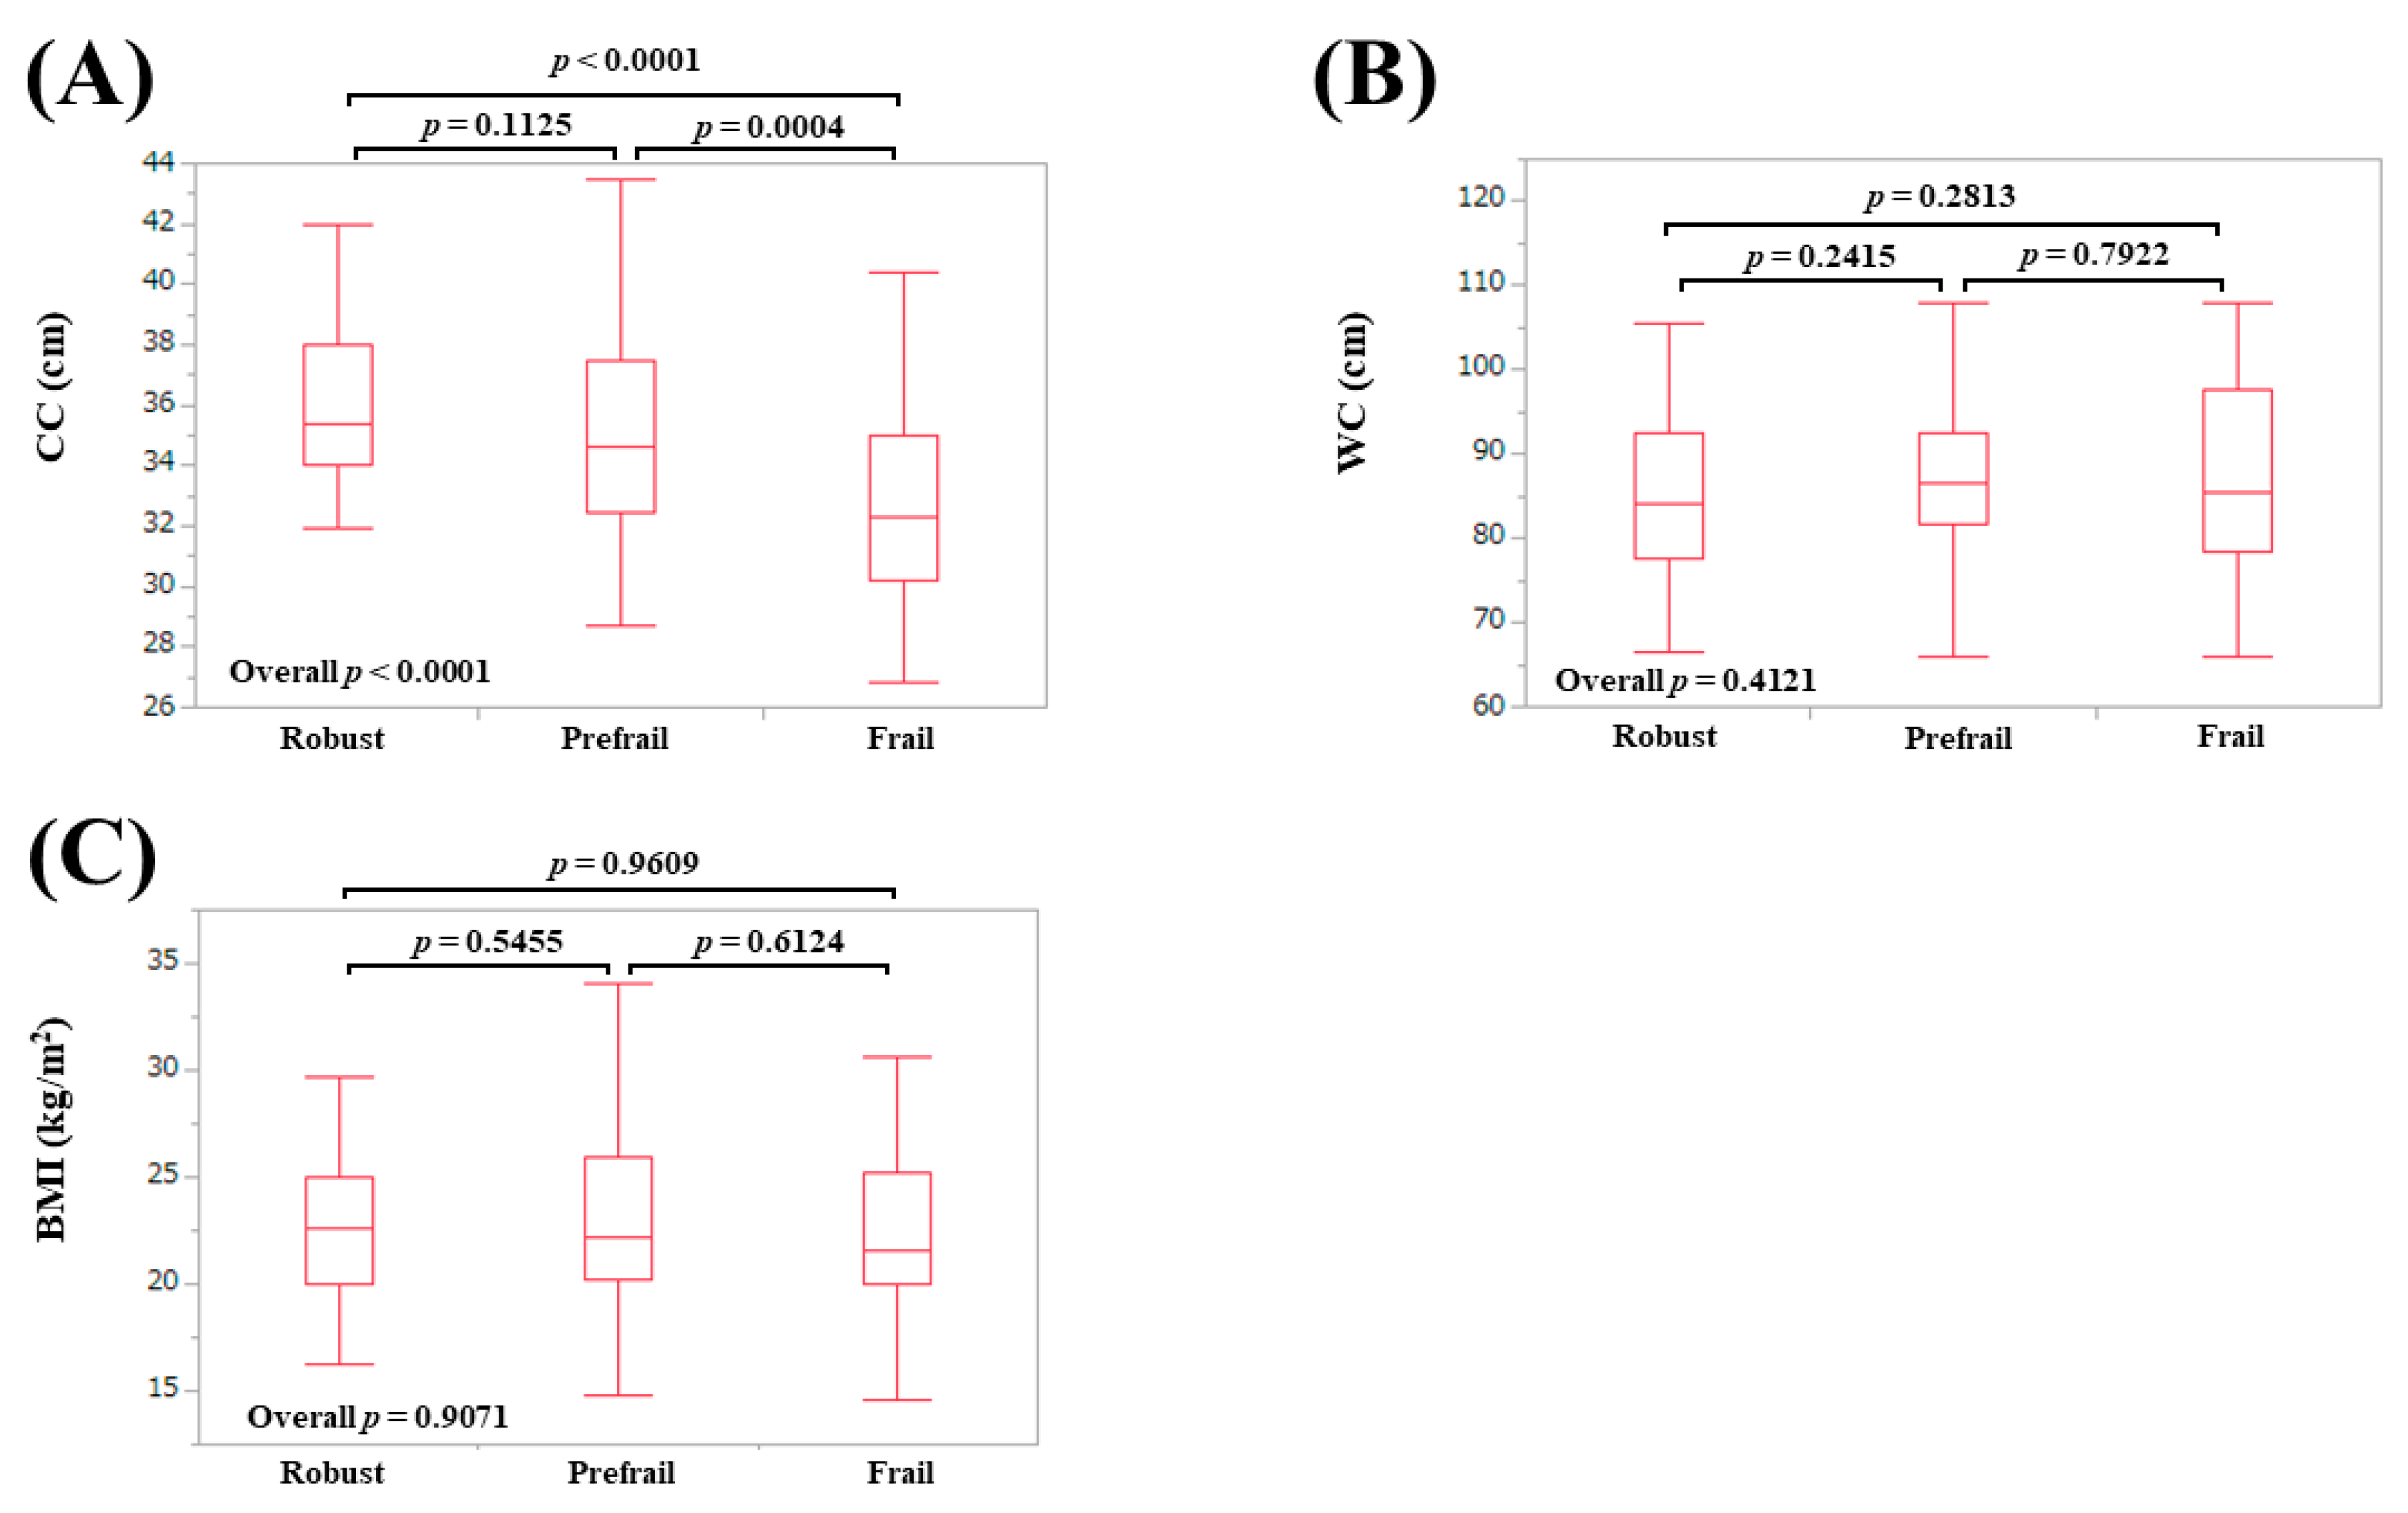
3.3. AMs According to Frailty Status in Females

The median (IQR) AC in patients defined as robust, prefrail, and frail were: 28 (25, 31) cm in robust, 28 (26, 31) cm in prefrail, and 26.5 (24, 29.75) cm in frail (overall p = 0.1825) (Figure 3A). The median (IQR) TSF in patients defined as robust, prefrail, and frail were: 20 (15, 27) mm in robust, 20 (16.5, 26.8) mm in prefrail, and 17.5 (11, 24.8) mm in frail (overall p = 0.0811) (Figure 3B). The median (IQR) CC in patients defined as robust, prefrail, and frail were: 35.4 (34, 38) cm in robust, 34.6 (32.5, 37.5) cm in prefrail, and 32.3 (30.2, 35) cm in frail (overall p < 0.0001) (Figure 4A). The median (IQR) WC in patients defined as robust, prefrail, and frail were: 84 (77.5, 92.4) cm in robust, 86.5 (81.8, 92.5) cm in prefrail, and 85.5 (78.6, 97.5) cm in frail (overall p = 0.4121) (Figure 4B). The median (IQR) BMI in patients defined as robust, prefrail, and frail were: 22.6 (20, 25) kg/m2 in robust, 22.2 (20.3, 26.0) kg/m2 in prefrail, and 21.6 (20.0, 25.3) kg/m2 in frail (overall p = 0.9071) (Figure 4C).

3.4. AMs According to Frailty Phenotypes in Males

For the male participants, the values of AC (p = 0.010) and CC (p = 0.0339) in patients with a decrease in WS were significantly lower than those in each counterpart (Table 2). The values of AC (p < 0.0001), CC (p < 0.0001), and BMI (p = 0.0037) in patients with a decrease in GS were significantly lower than those in each counterpart (Table 2). The values of AC (p = 0.0278) and CC (p = 0.0225) in patients with physical activity decrease were significantly lower than those in each counterpart (Table 2). No significant differences of 5 AMs between the two groups were found in terms of fatigue and BW loss.

3.5. AMs According to Frailty Phenotypes in Females

In female participants, the values of TSF (p = 0.0247) and CC (p = 0.0002) in patients with a decrease in WS were significantly lower than those in each counterpart (Table 3). The value of CC (p = 0.0002) in patients with GS decrease was significantly lower than that in the counterpart (Table 3). No significant differences of 5 AMs between the two groups were found in terms of fatigue, BW loss, and physical activity.

3.6. ROC Analysis for the Presence of Frailty in Males

ROC analysis for the presence of frailty in male participants revealed that CC had the highest AUC (AUC = 0.693), followed by AC (AUC = 0.676) among 5 AMs (Table 4). Corresponding cutoff value, sensitivity, and specificity are shown in Table 4.

3.7. ROC Analysis for the Presence of Frailty in Females

ROC analysis for the presence of frailty in female participants revealed that CC had the highest AUC (AUC = 0.734), followed by TSF (AUC = 0.62) among 5 AMs (Table 4). Corresponding cutoff value, sensitivity, and specificity are shown in Table 4.

3.8. Univariate and Multivariate Analyses of Factors Linked to Frailty in Males

In male participants, in the univariate analysis, age (p = 0.0126), presence of LC (p = 0.0003), serum albumin level (p < 0.0001), AC (p = 0.0038), and CC (p = 0.0056) were observed to be significant factors associated with the presence of frailty (Table 5). In the multivariate analysis for the five factors, only presence of LC (p = 0.0433) was identified to be a significant factor linked to the presence of frailty (Table 5). Corresponding odds ratio (OR) and confidence interval (CI) are shown in Table 5.

3.9. Univariate and Multivariate Analyses of Factors Linked to Frailty in Females

In female participants, in the univariate analysis, age (p = 0.0188), presence of LC (p = 0.0003), serum albumin level (p = 0.0010), AC (p = 0.0491), TSF (p = 0.0263), and CC (p < 0.0001) were observed to be significant factors associated with the presence of frailty (Table 5). In the multivariate analysis for the six factors, serum albumin (p = 0.0444) and CC (p = 0.0010) were identified to be significant factors linked to the presence of frailty (Table 5). Corresponding OR and CI are shown in Table 5.

4. Discussion

Japan is aging at an unprecedented speed and it will continue to age in the future. The same can apply to Japanese CLD patients [29,30]. As mentioned earlier, AMs are convenient and non-invasive to evaluate body composition [15,16,17,18]. How to use convenient markers in practice is of importance clinically. However, scarce data have provided a description of AMs and frailty in patients with CLDs [20]. In our data, AC and CC were well stratified according to the frailty status in male and CC in female participants. In ROC analyses, CC had the highest AUC for frailty both in male (AUC = 0.693) and in female (AUC = 0.734) participants among five AMs. In the multivariate analysis, CC was an independent factor for frailty in female participants. Considering this, our results denoted that CC can be a useful AM for frailty in CLDs. Regarding sarcopenia surveillance, the revised AWGS guidelines propose separate algorithms for community vs. hospital settings [19]. In community settings, assessment of muscle mass is not required for the diagnosis of sarcopenia in the revised AWGS guidelines. In both community and hospital settings, first screening for possible sarcopenia using CC or a questionnaire is recommended. CC appears to be helpful for the assessment of both sarcopenia and frailty. In addition, one should note that CC value decreases, even in the prefrail stage. On the other hand, in the multivariate analyses, the presence of LC in male participants and serum albumin levels in female participants were significant factors for frailty. Disease specific frailty in CLDs should be taken into account. Several reports have suggested that hepatic decompensation is associated with a significantly elevated risk of frailty and frailty is linked to a significantly elevated number and duration of hospital admissions for LC-related complications [8,31,32,33]. In our male non-LC patients (n = 111), frailty was found in 5 patients (4.5%) and prefrailty was found in 57 patients (51.4%), while in our female non-LC patients (n = 134), frailty was found in 11 patients (8.2%) and prefrailty was found in 70 patients (52.2%). One should also keep in mind that non-LC status does not deny the possibility of frailty.
The cutoff values of CC for sarcopenia in the revised AWGS guidelines are 34 cm in males and 33 cm in females, while in our ROC analysis for frailty, the optimal cutoff values of CC were 33.7 cm in males and 33.4 cm in females, which are almost identical to AWGS data [19,34]. Sarcopenia indicates physical frailty and sarcopenia forms the basis of frailty [2,35]. Sarcopenia itself causes lower limb muscle strength, falls, slow WS, and thus, decrease in physical activity can be induced. These all contribute to the development of frailty. Coincidence of cutoff values of CC between AWGS data and our data is not so surprising. Sarcopenia and frailty are unique, inter-related, and multi-dimensional issues in CLDs [6]. Rolland et al. reported that female presenting with a CC <31 cm were three times more likely to have difficulties in moving [36]. In our cohort, there were 21 female patients (10.9%) with a CC <31 cm. Of these, robustness was found in one patient, prefrailty in 11, and frailty in 9, which may support the usefulness of CC as a screening tool for frailty in female CLD patients. Fatigue and BW loss (phenotypes for frailty) did not correlate with AMs, both in male and female participants, in our data. As expected, AMs can correlate with physical function.
BMI and WC were not significant factors linked to frailty, both in male and female participants, in our analysis. A close correlation between higher abdominal obesity and frailty in males has been reported [37]. Another study reported that being overweight was significantly associated with prefrailty and obesity was associated with prefrailty and frailty in females [38]. The reasons for these discrepancies between their data and our data are unclear and further studies regarding the impact of obesity on frailty in CLDs is necessary. AC means the sum of arm muscle circumference and TSF [15]. Thus, both muscle mass and fat mass can affect AC value. This may be linked to our findings that AC was not a significant factor in the multivariate analysis, both for male and female participants, although it was significant in the univariate analysis, both for male and female participants.
Several limitations associated with the study must be mentioned. Firstly, this observational study had a retrospective and cross-sectional nature, with subjects from a single hospital. Secondly, our data included population data from CLD patients in Japan; thus, additional studies on subjects from other parts of the world are needed to confirm and expand or adapt our results for each population. Thirdly, patients with large ascites who could suffer from a WS decline were not included in this study, therefore this possibly creates bias. Finally, due to the cross-sectional nature of our study, the causal relationship between AMs and frailty is unclear. Interpretation with caution to our study data is required. Our study results nevertheless implied that AMs and frailty in CLDs are closely correlated, especially in CC. In conclusion, CC can be helpful for predicting frailty, especially in female CLD patients.

Author Contributions

Data curation, H.N., K.Y., H.E., N.I., N.A., T.K., and T.N.; formal analysis, H.N.; supervision, S.N. and H.I.; writing—original draft, H.N. and K.Y.; writing—review and editing, H.E. All authors have read and agreed to the published version of the manuscript.

Funding

This research received no external funding.

Acknowledgments

The authors would like to thank Yasuko Higuchi in our hospital for the anthropometry measurement. This work was partly granted by Hyogo Innovative Challenge, Hyogo college of medicine, Japan.

Conflicts of Interest

The authors declare no conflict of interest.

Abbreviations

CLDchronic liver disease
LCliver cirrhosis
AManthropometric measurement
ACarm circumference
CCcalf circumference
BMIbody mass index
TSFtriceps skinfold thickness
WCwaist circumference
AWGSAsian Working Group for Sarcopenia
BWbody weight
GSgrip strength
WSwalking speed
ROCreceiver operating characteristic curve
AUCarea under the receiver operating characteristic curve
IQRinterquartile range
ALBIalbumin-bilirubin
ORodds ratio
CIconfidence interval

References

  1. Ribeiro, A.R.; Howlett, S.E.; Fernandes, A. Frailty-A promising concept to evaluate disease vulnerability. Mech. Ageing Dev. 2020, 187, 111217. [Google Scholar] [CrossRef]
  2. Satake, S.; Arai, H. Implications of frailty screening in clinical practice. Curr. Opin. Clin. Nutr. Metab. Care 2017, 20, 4–10. [Google Scholar] [CrossRef]
  3. Sewo Sampaio, P.Y.; Sampaio, R.A.; Yamada, M.; Arai, H. Systematic review of the Kihon Checklist: Is it a reliable assessment of frailty? Geriatr. Gerontol. Int. 2016, 16, 893–902. [Google Scholar] [CrossRef] [PubMed]
  4. Di Sabatino, A.; Lenti, M.V.; Cammalleri, L.; Corazza, G.R.; Pilotto, A. Frailty and the Gut. Dig. Liver Dis. 2018, 50, 533–541. [Google Scholar] [CrossRef]
  5. Williams, F.R.; Berzigotti, A.; Lord, J.M.; Lai, J.C.; Armstrong, M.J. Review Article: Impact of Exercise on Physical Frailty in Patients with Chronic Liver Disease. Aliment. Pharmacol. Ther. 2019, 50, 988–1000. [Google Scholar] [CrossRef]
  6. Bunchorntavakul, C.; Reddy, K.R. Review Article: Malnutrition/Sarcopenia and Frailty in Patients with Cirrhosis. Aliment. Pharmacol. Ther. 2020, 51, 64–77. [Google Scholar] [CrossRef] [Green Version]
  7. Wang, C.W.; Lebsack, A.; Chau, S.; Lai, J.C. The Range and Reproducibility of the Liver Frailty Index. Liver Transplant. 2019, 25, 841–847. [Google Scholar] [CrossRef]
  8. Laube, R.; Wang, H.; Park, L.; Heyman, J.K.; Vidot, H.; Majumdar, A.; Strasser, S.I.; McCaughan, G.W.; Liu, K. Frailty in Advanced Liver Disease. Liver Int. 2018, 38, 2117–2128. [Google Scholar] [CrossRef] [Green Version]
  9. Cameron, I.D.; Kurrle, S.E. Frailty and Rehabilitation. Interdiscip. Top. Gerontol. Geriatr. 2015, 41, 137–150. [Google Scholar] [PubMed]
  10. Vigorito, C.; Abreu, A.; Ambrosetti, M.; Belardinelli, R.; Corrà, U.; Cupples, M.; Davos, C.H.; Hoefer, S.; Iliou, M.C.; Schmid, J.P.; et al. Frailty and Cardiac Rehabilitation: A Call to Action from the EAPC Cardiac Rehabilitation Section. Eur. J. Prev. Cardiol. 2017, 24, 577–590. [Google Scholar] [CrossRef] [Green Version]
  11. Arjunan, A.; Peel, N.M.; Hubbard, R.E. Feasibility and validity of frailty measurement in geriatric rehabilitation. Australas. J. Ageing 2018, 37, 144–146. [Google Scholar] [CrossRef] [PubMed]
  12. Lai, J.C.; Covinsky, K.E.; McCulloch, C.E.; Feng, S. The Liver Frailty Index Improves Mortality Prediction of the Subjective Clinician Assessment in Patients with Cirrhosis. Am. J. Gastroenterol. 2018, 113, 235–242. [Google Scholar] [CrossRef] [PubMed]
  13. Bhanji, R.A.; Montano-Loza, A.J.; Watt, K.D. Sarcopenia in Cirrhosis: Looking beyond the skeletal muscle loss to see the systemic disease. Hepatology 2019, 70, 2193–2203. [Google Scholar] [CrossRef] [PubMed]
  14. Bhanji, R.A.; Narayanan, P.; Moynagh, M.R.; Takahashi, N.; Angirekula, M.; Kennedy, C.C.; Mara, K.C.; Dierkhising, R.A.; Watt, K.D. Differing Impact of Sarcopenia and Frailty in Nonalcoholic Steatohepatitis and Alcoholic Liver Disease. Liver Transpl. 2019, 25, 14–24. [Google Scholar] [CrossRef] [PubMed]
  15. Madden, A.M.; Smith, S. Body composition and morphological assessment of nutritional status in adults: A review of anthropometric variables. J. Hum. Nutr. Diet. 2016, 29, 7–25. [Google Scholar] [CrossRef]
  16. Tur, J.A.; Bibiloni, M.D.M. Anthropometry, Body Composition and Resting Energy Expenditure in Human. Nutrients 2019, 14, 1891. [Google Scholar] [CrossRef] [PubMed] [Green Version]
  17. Diana, A.S.; John, A.D.; Catarina, N.M.; Paulo, M.R.; Cláudia, S.M.; David, B.A.; Luís, B.S.; Analiza, M.S. Reference values for body composition and anthropometric measurements in athletes. PLoS ONE 2014, 9, e97846. [Google Scholar]
  18. Utkualp, N.; Ercan, I. Anthropometric Measurements Usage in Medical Sciences. Biomed. Res. Int. 2015, 2015, 404261. [Google Scholar] [CrossRef] [Green Version]
  19. Liang-Kung, C.; Jean, W.; Prasert, A.; Tung-Wai, A.; Ming-Yueh, C.; Katsuya, I.; Hak, C.J.; Lin, K.; Miji, K.; Sunyoung, K.; et al. Asian Working Group for Sarcopenia: 2019 Consensus Update on Sarcopenia Diagnosis and Treatment. J. Am. Med. Dir. Assoc. 2020, 21, 300–307. [Google Scholar]
  20. Federico, A.; Caprio, G.G.; Dalise, A.M.; Barbieri, M.; Dallio, M.; Loguercio, C.; Paolisso, G.; Rizzo, M.R. Cirrhosis and Frailty Assessment in Elderly Patients: A Paradoxical Result. Medicine 2020, 99, e18501. [Google Scholar] [CrossRef]
  21. Hiroshi, F.; Hidetsugu, S.; Yoshiyuki, U.; Hirofumi, U.; Katsutoshi, O.; Isao, S.; Akitaka, S.; Masataka, S.; Sumiko, N.; Makoto, S.; et al. Evidence-based clinical practice guidelines for liver cirrhosis 2015. J. Gastroenterol. 2016, 51, 629–650. [Google Scholar]
  22. Lurie, Y.; Webb, M.; Cytter-Kuint, R.; Shteingart, S.; Lederkremer, G.Z. Non-invasive diagnosis of liver fibrosis and cirrhosis. World J. Gastroenterol. 2015, 21, 11567–11583. [Google Scholar] [CrossRef]
  23. Jean-Pierre, Z.; Nathalie, S.; Jérôme, G.; Adeline, P.; Elie-Serge, Z.; Tarik, A.; Renée-Claude, B.; Jean-Luc, B.; Dominique, G.; Jean-Charles, R.; et al. Comparison of nine blood tests and transient elastography for liver fibrosis in chronic hepatitis C: The ANRS HCEP-23 study. J. Hepatol. 2012, 56, 55–62. [Google Scholar]
  24. Romanelli, R.G.; Stasi, C. Recent Advancements in Diagnosis and Therapy of Liver Cirrhosis. Curr. Drug Targets 2016, 17, 1804–1817. [Google Scholar] [CrossRef]
  25. Nishikawa, H.; Yoh, K.; Enomoto, H.; Iwata, Y.; Sakai, Y.; Kishino, K.; Shimono, Y.; Ikeda, N.; Takashima, T.; Aizawa, N.; et al. Health-Related Quality of Life and Frailty in Chronic Liver Diseases. Life 2020, 10, 76. [Google Scholar] [CrossRef]
  26. Satake, S.; Arai, H. Chapter 1 Frailty: Definition, diagnosis, epidemiology. Geriatr. Gerontol. Int. 2020, 20, 7–13. [Google Scholar] [CrossRef]
  27. Fried, L.P.; Tangen, C.M.; Walston, J.; Newman, A.B.; Hirsch, C.; Gottdiener, J.; Seeman, T.; Tracy, R.; Kop, W.J.; Burke, G.; et al. Frailty in older adults: Evidence for a phenotype. J. Gerontol. A Biol. Sci. Med. Sci. 2001, 56, M146–M156. [Google Scholar] [CrossRef] [PubMed]
  28. Nishikawa, H.; Shiraki, M.; Hiramatsu, A.; Moriya, K.; Hino, K.; Nishiguchi, S. Japan Society of Hepatology guidelines for sarcopenia in liver disease (1st edition): Recommendation from the working group for creation of sarcopenia assessment criteria. Hepatol. Res. 2016, 46, 951–963. [Google Scholar] [CrossRef] [PubMed]
  29. Enomoto, H.; Ueno, Y.; Hiasa, Y.; Nishikawa, H.; Hige, S.; Takikawa, Y.; Taniai, M.; Ishikawa, T.; Yasui, K.; Takaki, A.; et al. Transition in the Etiology of Liver Cirrhosis in Japan: A Nationwide Survey. J. Gastroenterol. 2020, 55, 353–362. [Google Scholar] [CrossRef] [PubMed] [Green Version]
  30. Osaki, Y.; Nishikawa, H. Treatment for Hepatocellular Carcinoma in Japan Over the Last Three Decades: Our Experience and Published Work Review. Hepatol. Res. 2015, 45, 59–74. [Google Scholar] [CrossRef] [Green Version]
  31. Puneeta, T.; Navdeep, T.; Lesley, T.; Laura, Z.; Tahira, S.; Michelle, C.; Mang, M.; Robert, J.B.; Saumya, J.; Kelly, W.B.; et al. A rapid bedside screen to predict unplanned hospitalisation and death in outpatients with cirrhosis: A prospective evaluation of the clinical frailty score. Am. J. Gastroenterol. 2016, 111, 1759–1767. [Google Scholar]
  32. Sinclair, M.; Poltavskiy, E.; Dodge, J.; Lai, J. Frailty is independently associated with increased hospitalisation days in patients on the liver transplant waitlist. World J. Gastroenterol. 2017, 23, 899–905. [Google Scholar] [CrossRef] [PubMed]
  33. Lai, J.; Feng, S.; Terrault, N.; Lizaola, B.; Hayssen, H.; Covinsky, K. Frailty predicts waitlist mortality in liver transplant canddiates. Am. J. Transplant. 2014, 14, 1870–1879. [Google Scholar] [CrossRef] [PubMed]
  34. Ryoko, K.; Haruka, M.; Kiyoshi, S.; Noriko, T.; Susumu, S.; Izumi, T.; Mitsuru, H.; Motohiko, M. Calf circumference as a surrogate marker of muscle mass for diagnosing sarcopenia in Japanese men and women. Geriatr. Gerontol. Int. 2015, 15, 969–976. [Google Scholar]
  35. Nishikawa, H.; Yoh, K.; Enomoto, H.; Iwata, Y.; Sakai, Y.; Kishino, K.; Shimono, Y.; Ikeda, N.; Takashima, T.; Aizawa, N.; et al. Serum Zinc Level Is Associated with Frailty in Chronic Liver Diseases. J. Clin. Med. 2020, 9, 1570. [Google Scholar] [CrossRef] [PubMed]
  36. Rolland, Y.; Lauwers-Cances, V.; Cournot, M.; Nourhashémi, F.; Reynish, W.; Rivière, D.; Vellas, B.; Grandjean, H. Sarcopenia, calf circumference, and physical function of elderly women: Across-sectional study. J. Am. Geriatr. Soc. 2003, 51, 1120–1124. [Google Scholar] [CrossRef]
  37. Hawkins, K.L.; Zhang, L.; Ng, D.K.; Althoff, K.N.; Palella, F.J., Jr.; Kingsley, L.A.; Jacobson, L.P.; Margolick, J.B.; Lake, J.E.; Brown, T.T.; et al. Abdominal Obesity, Sarcopenia, and Osteoporosis Are Associated with Frailty in Men Living with and Without HIV. AIDS 2018, 32, 1257–1266. [Google Scholar] [CrossRef]
  38. Blaum, C.S.; Xue, Q.L.; Michelon, E.; Semba, R.D.; Fried, L.P. The Association Between Obesity and the Frailty Syndrome in Older Women: The Women’s Health and Aging Studies. J. Am. Geriatr. Soc. 2005, 53, 927–934. [Google Scholar] [CrossRef]
Figure 1. Anthropometry measurements according to frailty status in male participants. (A) Arm circumference; (B) Triceps skinfold thickness.
Diagnostics 10 00433 g001
Figure 2. Anthropometry measurements according to frailty status in male participants. (A) Calf circumference; (B) Waist circumference; (C) Body mass index.
Diagnostics 10 00433 g002
Figure 3. Anthropometry measurements according to frailty status in female participants. (A) Arm circumference; (B) Triceps skinfold thickness.
Diagnostics 10 00433 g003
Figure 4. Anthropometry measurements according to frailty status in female participants. (A) Calf circumference; (B) Waist circumference; (C) Body mass index.
Diagnostics 10 00433 g004
Table 1. Baseline characteristics (n = 375).
VariablesMale (n = 183)Female (n = 192)p Value
Age (years)66 (53, 72)66 (55, 72.8)0.6237
BMI (kg/m2)23.2 (21.4, 25.9)22.3 (20.1, 25.5)0.0136
Etiologies, HBV/HCV/others45/72/6622/106/640.0008
Presence of LC, yes/no72/11158/1340.0660
Total bilirubin (mg/dL)0.9 (0.6, 1.2)0.8 (0.6, 1.0)0.7926
Serum albumin (g/dL)4.2 (3.9, 4.5)4.3 (4.0, 4.5)0.1711
ALBI score−2.86 (−3.1, −2.48)−2.91 (−3.15, −2.68)0.0920
ALBI grade, 1/2/3125/54/4155/33/40.0177
Prothrombin time (%)90.5 (77.9, 100.4)93.1 (83.8, 100.1)0.0424
Platelet count (× 104/mm3)16.5 (11.2, 21.4)18.1 (13.7, 22.9)0.0130
AST (IU/L)26 (20, 36)24 (19, 31.8)0.2402
ALT (IU/L)24 (16, 39)17 (13, 26)0.0456
GS (kg)33.3 (28.0, 39.0)21.0 (17.7, 24.5)<0.0001
WS (m/s)1.28 (1.08, 1.44)1.32 (1.16, 1.47)0.4618
Presence of frailty, yes/no22/16128/1640.5439
Arm circumference (cm)28 (26, 30)28 (25, 30.8)0.1688
Triceps skin fold thickness (mm)12 (9, 16)20 (15, 27)<0.0001
Calf circumference (cm)36.9 (34.4, 39.2)34.8 (32.7, 37.4)<0.0001
Waist circumference (cm)89.5 (83.5, 97.0)85.8 (80, 92.5)<0.0001
Data are expressed as a number or median value (interquartile range). BMI, body mass index; HBV, hepatitis B virus; HCV, hepatitis C virus; LC, liver cirrhosis; ALBI, albumin-bilirubin; AST, aspartate aminotransferase; ALT, alanine aminotransferase; GS, grip strength; WS, walking speed.
Table 2. Anthropometric measurements according to the frailty phenotypes in male participants.
WS DecreaseWS Non-Decreasep Value
AC27 (23.5, 29)28 (27, 30)0.0100
TSF1.25 (0.91, 1.58)1.15 (0.9, 1.6)0.6785
CC34.7 (32.9, 38.6)37.1 (34.7, 39.4)0.0339
WC89.9 (81.6, 102.2)89.5 (84, 96.5)0.5781
BMI22.2 (19.9, 25.8)23.5 (21.6, 25.9)0.2859
GS DecreaseGS Non-Decreasep Value
AC26 (25, 28)29 (27, 30.8)<0.0001
TSF1.15 (0.85, 1.5)1.2 (0.91, 1.6)0.3758
CC34.2 (32.9, 36.1)37.7 (35.5, 39.6)<0.0001
WC89 (80.6, 96)90 (84.2, 97.4)0.2324
BMI21.8 (19.8, 24.6)23.7 (21.7, 26)0.0037
Fatigue, YesFatigue, Nop Value
AC28 (26, 30)28 (27, 30)0.1255
TSF1.2 (0.9, 1.6)1.2 (0.93, 1.6)0.7026
CC36.1 (33.8, 39.2)37.6 (34.7, 39.3)0.1705
WC89.1 (82.7, 97.8)89.8 (84.3, 96.3)0.5509
BMI22.8 (20.6, 25.9)23.6 (21.8, 25.7)0.3683
BW Loss, YesBW Loss, Nop Value
AC27 (23, 29.8)29 (27, 30)0.1929
TSF0.8 (0.65, 1.38)1.2 (0.95, 1.6)0.2430
CC34.5 (32.1, 40.9)37.4 (35.5, 39.4)0.1738
WC89 (82.8, 102.9)89.5 (84, 96.5)0.8760
BMI21.0 (19.2, 26.3)23.5 (21.7, 25.7)0.1974
PA Decline, YesPA Decline, Nop Value
AC28 (26, 30)28.5 (27, 30)0.0278
TSF1.1 (0.89, 1.6)1.2 (0.95, 1.6)0.2382
CC36.0 (33.8, 39.1)37.4 (35, 39.4)0.0224
WC92 (82.1, 100.9)89 (84, 96.4)0.5377
BMI23.5 (21.7, 25.8)23.5 (21.6, 25.9)0.3143
Data are shown as median value (interquartile range). AC, arm circumference; TSF, triceps skinfold thickness; CC, calf circumference; WC, waist circumference; BMI, body mass index; WS, walking speed; GS, grip strength; BW, body weight; PA, physical activity.
Table 3. Anthropometric measurements according to the frailty phenotypes in female participants.
WS DecreaseWS Non-Decreasep Value
AC27 (25, 29)28 (25, 31)0.0704
TSF1.7 (1.2, 2.4)2.0 (1.6, 2.7)0.0247
CC32.4 (30.8, 34.4)35.1 (33.2, 37.5)0.0002
WC85 (80, 92.5)85.9 (80.2, 92.7)0.8582
BMI22.4 (20.1, 23.8)22.2 (20.1, 25.9)0.3477
GS DecreaseGS Non-Decreasep Value
AC27 (25, 29.3)28 (25, 31)0.0536
TSF2.0 (1.35, 2.6)2.0 (1.6, 2.7)0.2259
CC33.3 (31.1, 35.8)35.1 (33.5, 37.8)0.0002
WC86 (79.8, 92.1)85.5 (80. 93.5)0.9234
BMI21.7 (20.1, 24.7)22.7 (20, 25.8)0.6682
Fatigue, YesFatigue, Nop Value
AC27 (25, 31)28 (26, 30)0.5815
TSF1.95 (1.4, 2.8)2.1 (1.7, 2.6)0.2723
CC34.5 (31.8, 37.4)35.0 (33.5, 37.4)0.0718
WC86 (78.7, 94)85.3 (81.1, 92.3)0.7912
BMI21.7 (19.8, 26.1)22.7 (20.4, 24.8)0.7081
BW Loss, YesBW Loss, Nop Value
AC27 (24, 29)28 (25, 31)0.2554
TSF1.8 (1.2, 2.15)2.0 (1.5, 2.7)0.0920
CC33.1 (31.4, 35.1)34.9 (32.9, 37.5)0.0637
WC89.5 (78, 95)85.7 (80, 92.5)0.6643
BMI23 (20.5, 25.8)22.2 (20, 25.5)0.9613
PA Decline, YesPA Decline, Nop Value
AC27.5 (26, 31)28 (25, 30)0.4672
TSF2.15 (1.53, 2.89)2.0 (1.5, 2.6)0.4689
CC34.6 (32.0, 35.9)34.9 (33.0, 37.9)0.1211
WC88 (83.1, 93.3)85 (78.5, 92.4)0.1304
BMI22.9 (20.2, 25.6)22.2 (20, 25.4)0.5102
Data are shown as median value (interquartile range). AC, arm circumference; TSF, triceps skinfold thickness; CC, calf circumference; WC, waist circumference; BMI, body mass index; WS, walking speed; GS, grip strength; BW, body weight; PA, physical activity.
Table 4. ROC analysis for the presence of frailty in male and female participants.
MaleAUCCutoffSensitivitySpecificity
AC0.67626.4 cm0.5460.764
TSF0.5657 mm0.2730.913
CC0.69333.7 cm0.5000.663
WC0.57095.2 cm0.5000.733
BMI0.57521.4 kg/m20.5000.776
FemaleAUCCutoffSensitivitySpecificity
AC0.59927.6 cm0.6790.512
TSF0.62012 mm0.3570.884
CC0.73433.4 cm0.7140.750
WC0.52898.4 cm0.2500.908
BMI0.52521.6 kg/m20.5360.579
AUC, area under the receiver operating characteristics curve; AC, arm circumference; TSF, triceps skinfold thickness; CC, calf circumference; WC, waist circumference; BMI, body mass index.
Table 5. Multivariate analyses of factors linked to frailty in male and female participants.
MaleUnivariateMultivariate Analysis
p ValueOR95% CIp Value
Age0.01260.9890.943–1.0370.6389
BMI0.3000---
Presence of LC0.00030.2810.082–0.9620.0433
Total bilirubin0.9262---
Serum albumin<0.00012.0820.781–5.5530.1428
Prothrombin time0.3345---
Platelet count0.0669---
AST0.6275---
ALT0.9838---
Arm circumference0.00381.0220.766–1.3620.8835
Triceps skin fold thickness0.3222---
Calf circumference0.00561.1290.867–1.4700.3675
Waist circumference0.2073---
FemaleUnivariateMultivariate Analysis
pValueOR95% CIpValue
Age0.01880.9870.947–1.0300.5514
BMI0.7283---
Presence of LC0.00030.4620.157–1.3610.1615
Total bilirubin0.8808---
Serum albumin0.00102.6170.998–6.8640.0444
Prothrombin time0.4101---
Platelet count0.3379---
AST0.1093---
ALT0.5371---
Arm circumference0.04911.1860.869–1.6200.2793
Triceps skin fold thickness0.02631.0040.883–1.1410.9539
Calf circumference<0.00011.5241.172–1.9830.0010
Waist circumference0.528---
BMI, body mass index; LC, liver cirrhosis; AST, aspartate aminotransferase; ALT, alanine aminotransferase; OR, odds ratio; CI, confidence interval.

