Upstroke Time as a Novel Predictor of Mortality in Patients with Chronic Kidney Disease

 , , ,
, , ,
Abstract
1. Introduction
2. Materials and Methods
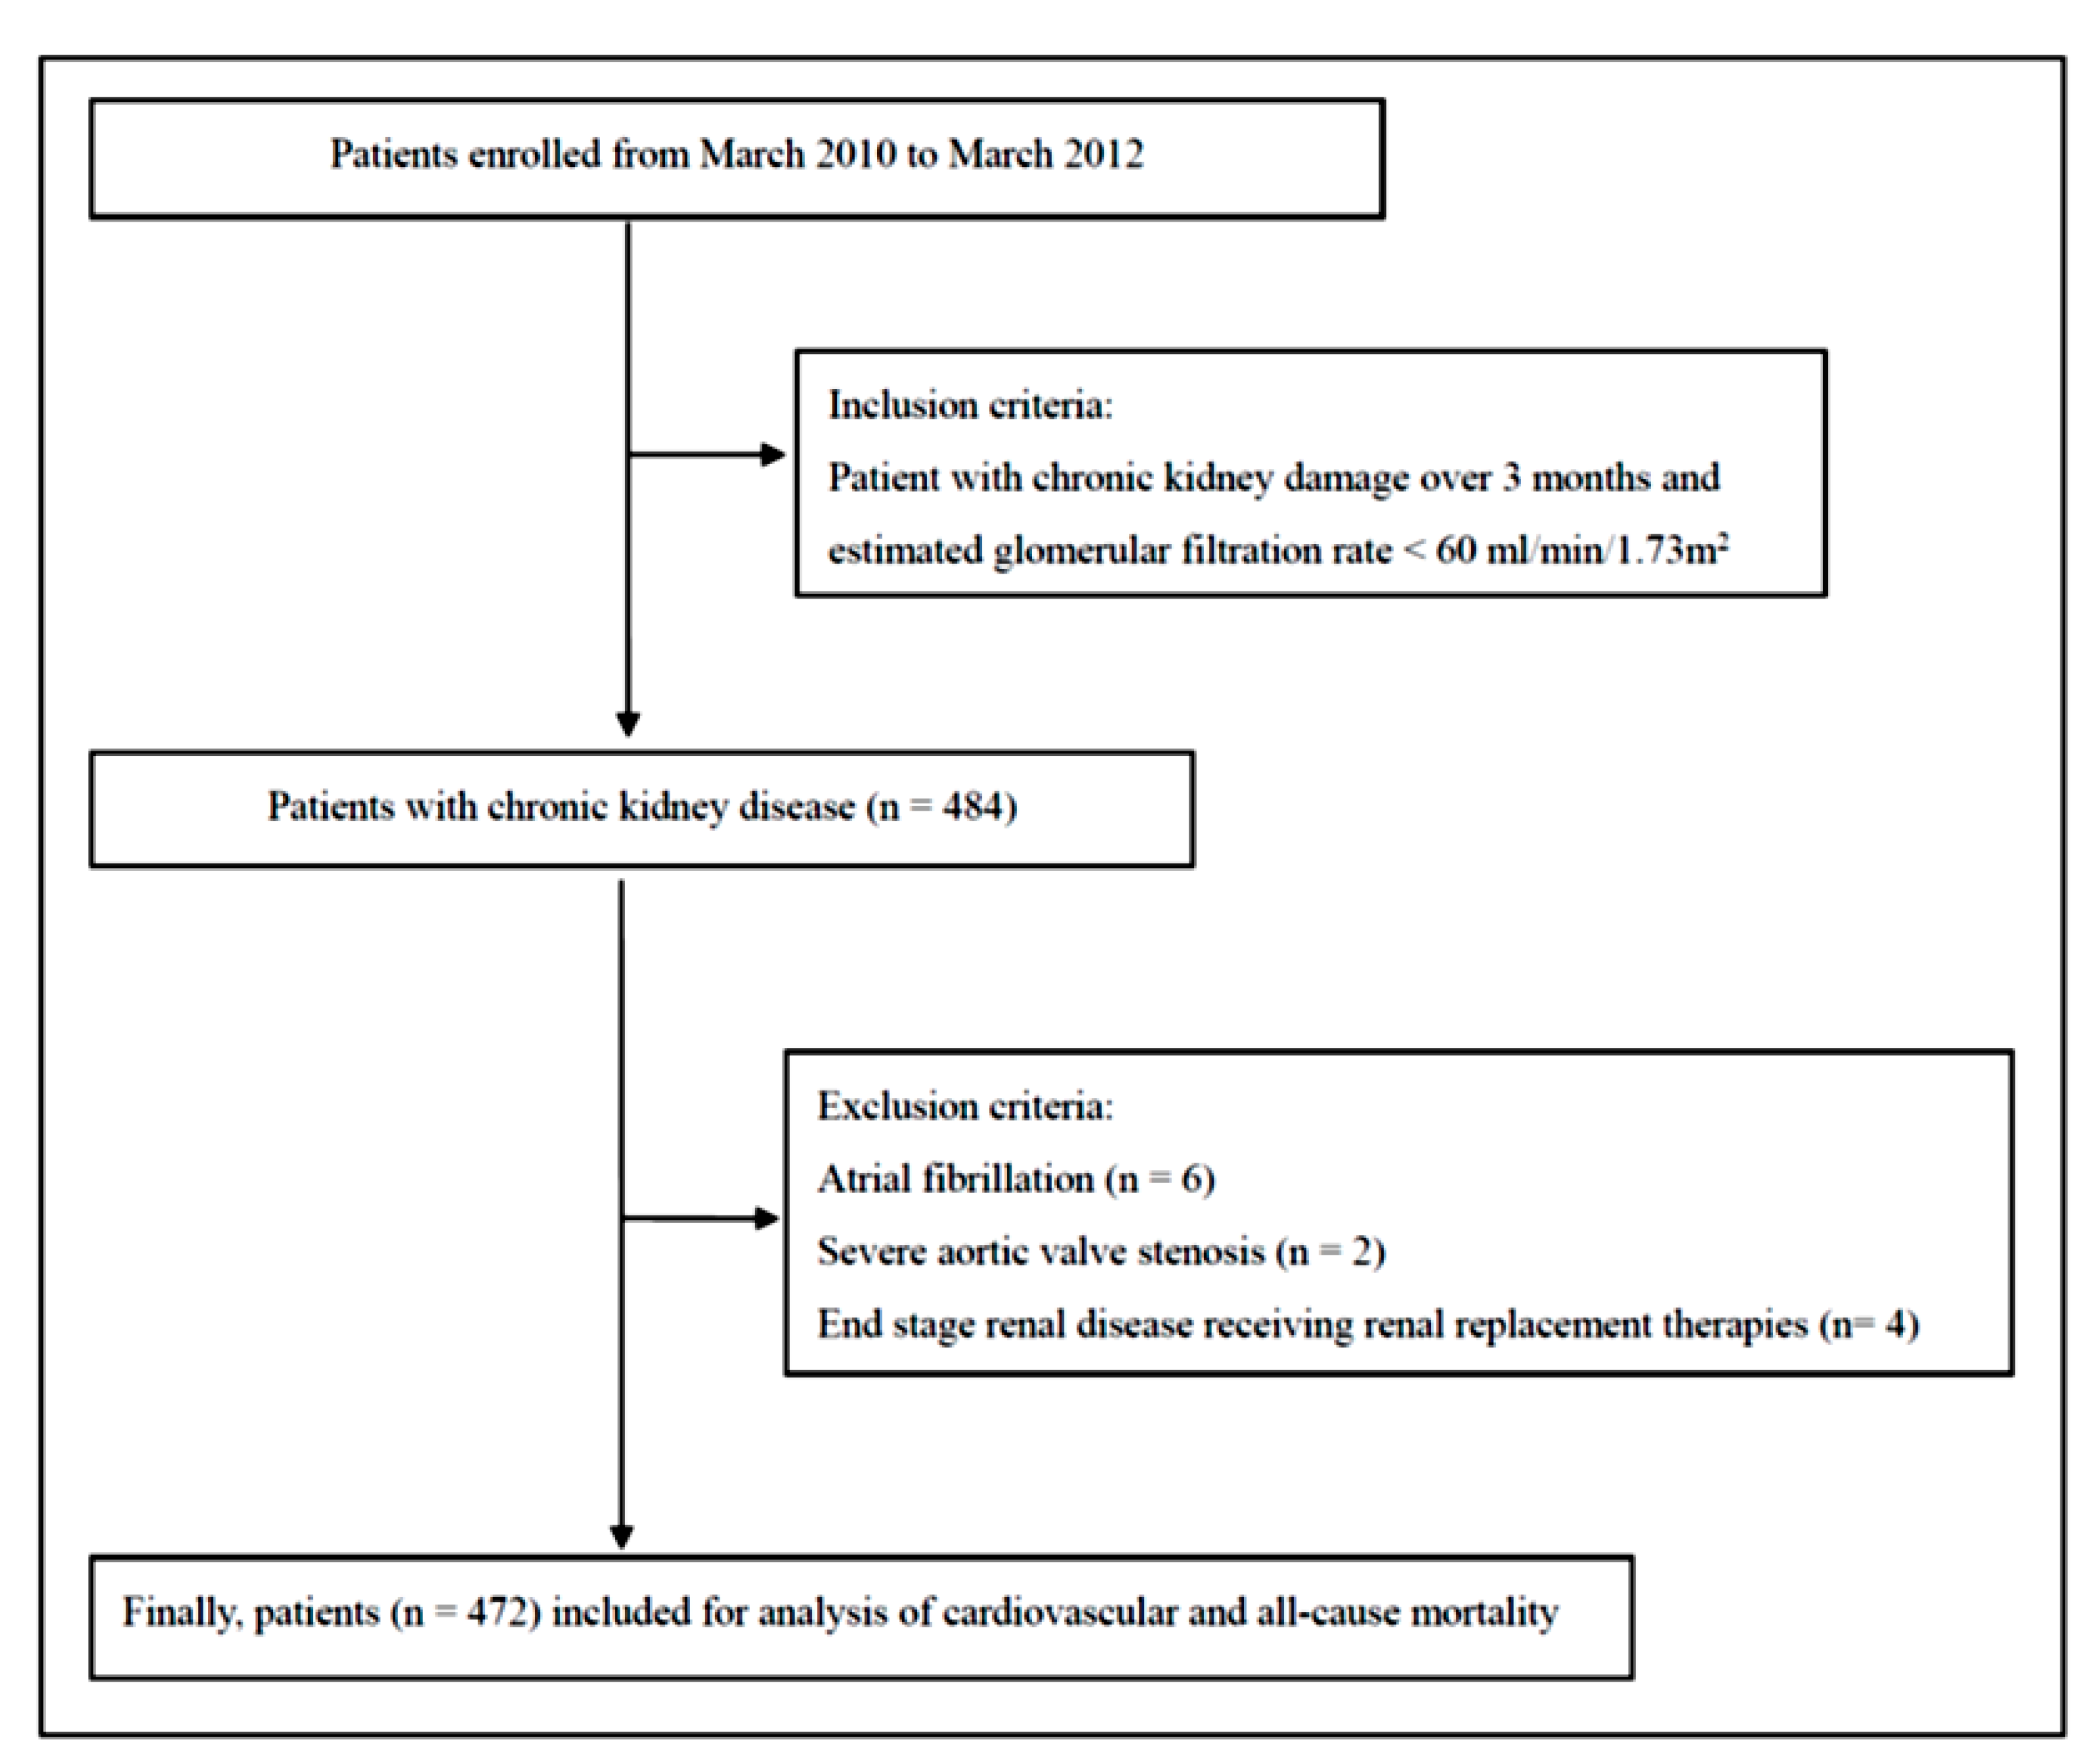
2.1. Study Subjects and Design
2.2. Ethics Statement
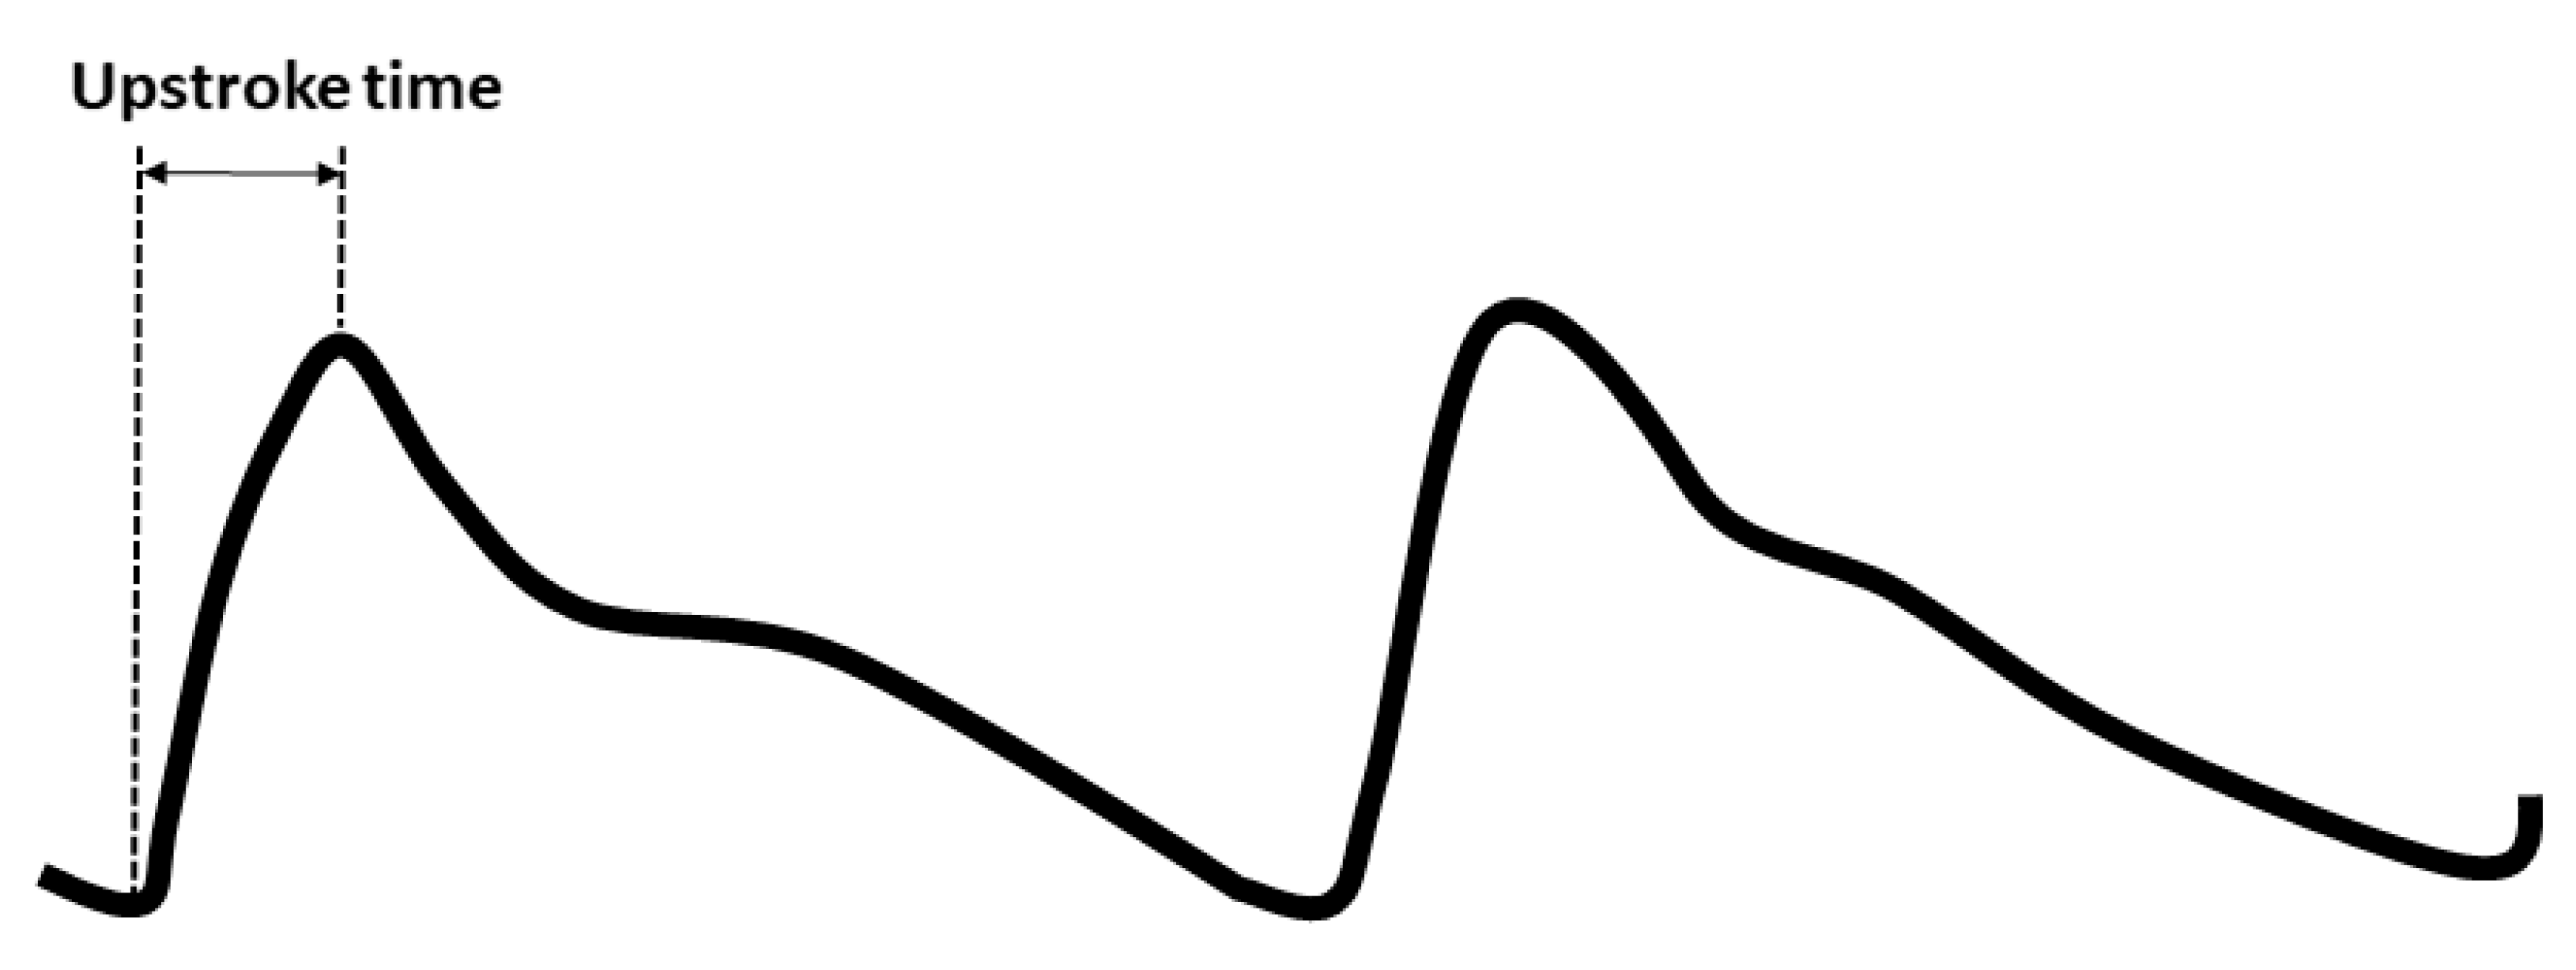
2.3. Blood Pressure, baPWV, and UT Measurements
2.4. Collection of Clinical Characteristics, Medical, and Laboratory Data
2.5. Definition of Cardiovascular and All-Cause Mortality
2.6. Statistical Analysis
3. Results
3.1. Baseline Characteristics in All Participants
3.2. Major Predictors of All-Cause and Cardiovascular Mortality in Study Patients
4. Discussion
5. Study Limitations
6. Conclusions
Author Contributions
Funding
Acknowledgments
Conflicts of Interest
Abbreviations
| ACEI | angiotensin converting enzyme inhibitor |
| ARB | angiotensin II receptor blocker |
| baPWV | brachial-ankle pulse wave velocity |
| CI | confidence interval |
| eGFR | estimated glomerular filtration rate |
| HR | hazard ratio |
| UT | upstroke time |
References
- Briet, M.; Boutouyrie, P.; Laurent, S.; London, G.M. Arterial stiffness and pulse pressure in ckd and esrd. Kidney Int. 2012, 82, 388–400. [Google Scholar] [CrossRef] [PubMed]
- Tripepi, G.; Mattace Raso, F.; Sijbrands, E.; Seck, M.S.; Maas, R.; Boger, R.; Witteman, J.; Rapisarda, F.; Malatino, L.; Mallamaci, F.; et al. Inflammation and asymmetric dimethylarginine for predicting death and cardiovascular events in esrd patients. Clin. J. Am. Soc. Nephrol. 2011, 6, 1714–1721. [Google Scholar] [CrossRef] [PubMed]
- Abd ElHafeez, S.; Tripepi, G.; Stancanelli, B.; Dounousi, E.; Malatino, L.; Mallamaci, F.; Zoccali, C. Norepinephrine, left ventricular disorders and volume excess in esrd. J. Nephrol. 2015, 28, 729–737. [Google Scholar] [CrossRef] [PubMed]
- Zoccali, C.; Mallamaci, F.; Parlongo, S.; Cutrupi, S.; Benedetto, F.A.; Tripepi, G.; Bonanno, G.; Rapisarda, F.; Fatuzzo, P.; Seminara, G.; et al. Plasma norepinephrine predicts survival and incident cardiovascular events in patients with end-stage renal disease. Circulation 2002, 105, 1354–1359. [Google Scholar] [CrossRef]
- Enia, G.; Mallamaci, F.; Benedetto, F.A.; Panuccio, V.; Parlongo, S.; Cutrupi, S.; Giacone, G.; Cottini, E.; Tripepi, G.; Malatino, L.S.; et al. Long-term capd patients are volume expanded and display more severe left ventricular hypertrophy than haemodialysis patients. Nephrol. Dial. Transplant. 2001, 16, 1459–1464. [Google Scholar] [CrossRef]
- Zoccali, C.; Benedetto, F.A.; Mallamaci, F.; Tripepi, G.; Giacone, G.; Cataliotti, A.; Seminara, G.; Stancanelli, B.; Malatino, L.S.; Investigators, C. Prognostic impact of the indexation of left ventricular mass in patients undergoing dialysis. J. Am. Soc. Nephrol. 2001, 12, 2768–2774. [Google Scholar]
- Zoccali, C.; Benedetto, F.A.; Mallamaci, F.; Tripepi, G.; Giacone, G.; Stancanelli, B.; Cataliotti, A.; Malatino, L.S. Left ventricular mass monitoring in the follow-up of dialysis patients: Prognostic value of left ventricular hypertrophy progression. Kidney Int. 2004, 65, 1492–1498. [Google Scholar] [CrossRef]
- Zoccali, C.; Mallamaci, F.; Maas, R.; Benedetto, F.A.; Tripepi, G.; Malatino, L.S.; Cataliotti, A.; Bellanuova, I.; Boger, R.; Investigators, C. Left ventricular hypertrophy, cardiac remodeling and asymmetric dimethylarginine (adma) in hemodialysis patients. Kidney Int. 2002, 62, 339–345. [Google Scholar] [CrossRef]
- Tripepi, G.; Benedetto, F.A.; Mallamaci, F.; Tripepi, R.; Malatino, L.; Zoccali, C. Left atrial volume monitoring and cardiovascular risk in patients with end-stage renal disease: A prospective cohort study. J. Am. Soc. Nephrol. 2007, 18, 1316–1322. [Google Scholar] [CrossRef]
- Tripepi, G.; Mattace-Raso, F.; Mallamaci, F.; Benedetto, F.A.; Witteman, J.; Malatino, L.; Zoccali, C. Biomarkers of left atrial volume: A longitudinal study in patients with end-stage renal disease. Hypertension 2009, 54, 818–824. [Google Scholar] [CrossRef]
- Zoccali, C.; Mallamaci, F.; Tripepi, G.; Benedetto, F.A.; Cutrupi, S.; Parlongo, S.; Malatino, L.S.; Bonanno, G.; Seminara, G.; Rapisarda, F.; et al. Adiponectin, metabolic risk factors, and cardiovascular events among patients with end-stage renal disease. J. Am. Soc. Nephrol. 2002, 13, 134–141. [Google Scholar] [PubMed]
- Testa, A.; Mallamaci, F.; Benedetto, F.A.; Pisano, A.; Tripepi, G.; Malatino, L.; Thadhani, R.; Zoccali, C. Vitamin d receptor (vdr) gene polymorphism is associated with left ventricular (lv) mass and predicts left ventricular hypertrophy (lvh) progression in end-stage renal disease (esrd) patients. J. Bone Miner. Res. 2010, 25, 313–319. [Google Scholar] [CrossRef] [PubMed]
- Mallamaci, F.; Tripepi, G.; Cutrupi, S.; Malatino, L.S.; Zoccali, C. Prognostic value of combined use of biomarkers of inflammation, endothelial dysfunction, and myocardiopathy in patients with esrd. Kidney Int. 2005, 67, 2330–2337. [Google Scholar] [CrossRef] [PubMed]
- Zoccali, C.; Bode-Boger, S.; Mallamaci, F.; Benedetto, F.; Tripepi, G.; Malatino, L.; Cataliotti, A.; Bellanuova, I.; Fermo, I.; Frolich, J.; et al. Plasma concentration of asymmetrical dimethylarginine and mortality in patients with end-stage renal disease: A prospective study. Lancet 2001, 358, 2113–2117. [Google Scholar] [CrossRef]
- Mallamaci, F.; Tripepi, G.; Maas, R.; Malatino, L.; Boger, R.; Zoccali, C. Analysis of the relationship between norepinephrine and asymmetric dimethyl arginine levels among patients with end-stage renal disease. J. Am. Soc. Nephrol. 2004, 15, 435–441. [Google Scholar] [CrossRef] [PubMed]
- Zoccali, C.; Kramer, A.; Jager, K.J. Chronic kidney disease and end-stage renal disease-a review produced to contribute to the report ‘the status of health in the european union: Towards a healthier europe’. NDT Plus 2010, 3, 213–224. [Google Scholar] [CrossRef]
- Fraser, S.D.; Roderick, P.J.; May, C.R.; McIntyre, N.; McIntyre, C.; Fluck, R.J.; Shardlow, A.; Taal, M.W. The burden of comorbidity in people with chronic kidney disease stage 3: A cohort study. BMC Nephrol. 2015, 16, 193. [Google Scholar] [CrossRef]
- Chen, S.C.; Chang, J.M.; Tsai, Y.C.; Tsai, J.C.; Su, H.M.; Hwang, S.J.; Chen, H.C. Association of interleg bp difference with overall and cardiovascular mortality in hemodialysis. Clin. J. Am. Soc. Nephrol. CJASN 2012, 7, 1646–1653. [Google Scholar] [CrossRef]
- Tonelli, M.; Wiebe, N.; Culleton, B.; House, A.; Rabbat, C.; Fok, M.; McAlister, F.; Garg, A.X. Chronic kidney disease and mortality risk: A systematic review. J. Am. Soc. Nephrol. 2006, 17, 2034–2047. [Google Scholar] [CrossRef]
- Chen, S.C.; Huang, J.C.; Su, H.M.; Chiu, Y.W.; Chang, J.M.; Hwang, S.J.; Chen, H.C. Prognostic cardiovascular markers in chronic kidney disease. Kidney Blood Press. Res. 2018, 43, 1388–1407. [Google Scholar] [CrossRef]
- Su, H.M.; Lin, T.H.; Hsu, P.C.; Chu, C.Y.; Lee, W.H.; Chen, S.C.; Lee, C.S.; Voon, W.C.; Lai, W.T.; Sheu, S.H. Abnormally low and high ankle-brachial indices are independently associated with increased left ventricular mass index in chronic kidney disease. PLoS ONE 2012, 7, e44732. [Google Scholar] [CrossRef] [PubMed]
- Zoccali, C.; Mallamaci, F.; Benedetto, F.A.; Tripepi, G.; Parlongo, S.; Cataliotti, A.; Cutrupi, S.; Giacone, G.; Bellanuova, I.; Cottini, E.; et al. Cardiac natriuretic peptides are related to left ventricular mass and function and predict mortality in dialysis patients. J. Am. Soc. Nephrol. 2001, 12, 1508–1515. [Google Scholar] [PubMed]
- Mallamaci, F.; Zoccali, C.; Tripepi, G.; Benedetto, F.A.; Parlongo, S.; Cataliotti, A.; Cutrupi, S.; Giacone, G.; Bellanuova, I.; Stancanelli, B.; et al. Diagnostic potential of cardiac natriuretic peptides in dialysis patients. Kidney Int. 2001, 59, 1559–1566. [Google Scholar] [CrossRef] [PubMed]
- Cataliotti, A.; Malatino, L.S.; Jougasaki, M.; Zoccali, C.; Castellino, P.; Giacone, G.; Bellanuova, I.; Tripepi, R.; Seminara, G.; Parlongo, S.; et al. Circulating natriuretic peptide concentrations in patients with end-stage renal disease: Role of brain natriuretic peptide as a biomarker for ventricular remodeling. Mayo Clin. Proc. 2001, 76, 1111–1119. [Google Scholar] [CrossRef]
- Stancanelli, B.; Malatino, L.S.; Malaponte, G.; Noto, P.; Giuffre, E.; Caruso, A.; Gagliano, C.; Zoccolo, A.M.; Puccia, G.; Castellino, P. Pulse pressure is an independent predictor of aortic stiffness in patients with mild to moderate chronic kidney disease. Kidney Blood Press. Res. 2007, 30, 283–288. [Google Scholar] [CrossRef]
- Zoccali, C.; Tripepi, G.; Mallamaci, F. Dissecting inflammation in esrd: Do cytokines and c-reactive protein have a complementary prognostic value for mortality in dialysis patients? J. Am. Soc. Nephrol. 2006, 17, S169–S173. [Google Scholar] [CrossRef]
- Mallamaci, F.; Benedetto, F.A.; Tripepi, G.; Cutrupi, S.; Pizzini, P.; Stancanelli, B.; Seminara, G.; Bonanno, G.; Rapisarda, F.; Fatuzzo, P.; et al. Vascular endothelial growth factor, left ventricular dysfunction and mortality in hemodialysis patients. J. Hypertens. 2008, 26, 1875–1882. [Google Scholar] [CrossRef]
- Zoccali, C.; Benedetto, F.A.; Maas, R.; Mallamaci, F.; Tripepi, G.; Malatino, L.S.; Boger, R.; Investigators, C. Asymmetric dimethylarginine, c-reactive protein, and carotid intima-media thickness in end-stage renal disease. J. Am. Soc. Nephrol. 2002, 13, 490–496. [Google Scholar]
- Chen, S.C.; Chang, J.M.; Liu, W.C.; Tsai, Y.C.; Tsai, J.C.; Hsu, P.C.; Lin, T.H.; Lin, M.Y.; Su, H.M.; Hwang, S.J.; et al. Brachial-ankle pulse wave velocity and rate of renal function decline and mortality in chronic kidney disease. Clin. J. Am. Soc. Nephrol. 2011, 6, 724–732. [Google Scholar] [CrossRef]
- Yu, S.; Lu, Y.; Xiong, J.; Teliewubai, J.; Chi, C.; Ji, H.; Zhou, Y.; Fan, X.; Zhang, J.; Blacher, J.; et al. Comparison of ankle-brachial index and upstroke time in association with target organ damage: The northern shanghai study. J. Am. Soc. Hypertens. 2018, 12, 703–713. [Google Scholar] [CrossRef]
- Kiuchi, S.; Hisatake, S.; Watanabe, I.; Toda, M.; Kabuki, T.; Oka, T.; Dobashi, S.; Ikeda, T. Pulse pressure and upstroke time are useful parameters for the diagnosis of peripheral artery disease in patients with normal ankle brachial index. Cardiol Res. 2016, 7, 161–166. [Google Scholar] [CrossRef] [PubMed]
- Sheng, C.S.; Li, Y.; Huang, Q.F.; Kang, Y.Y.; Li, F.K.; Wang, J.G. Pulse waves in the lower extremities as a diagnostic tool of peripheral arterial disease and predictor of mortality in elderly chinese. Hypertension 2016, 67, 527–534. [Google Scholar] [CrossRef] [PubMed]
- Levey, A.S.; Coresh, J.; Bolton, K.; Culleton, B.; Harvey, K.S.; Ikizler, T.A.; Johnson, C.A.; Kausz, A.; Kimmel, P.L.; Kusek, J.; et al. K/doqi clinical practice guidelines for chronic kidney disease: Evaluation, classification, and stratification. Am. J. Kidney Dis. 2002, 39, S1–S266. [Google Scholar]
- Boiteau, G.M.; Bourassa, M.G.; Allenstein, B.J. Upstroke time ratio. A new concept in differentiating valvular and subvalvular aortic stenosis. Am. J. Cardiol. 1963, 11, 319–326. [Google Scholar] [CrossRef]
- Chen, S.C.; Lee, W.H.; Hsu, P.C.; Lin, M.Y.; Lee, C.S.; Lin, T.H.; Voon, W.C.; Lai, W.T.; Sheu, S.H.; Su, H.M. Association of brachial-ankle pulse wave velocity with cardiovascular events in atrial fibrillation. Am. J. Hypertens. 2016, 29, 348–356. [Google Scholar] [CrossRef]
- Lee, W.H.; Hsu, P.C.; Chu, C.Y.; Chen, S.C.; Lee, H.H.; Chen, Y.C.; Lee, M.K.; Lee, C.S.; Yen, H.W.; Lin, T.H.; et al. Association of renal systolic time intervals with brachial-ankle pulse wave velocity. Int. J. Med. Sci. 2018, 15, 1235–1240. [Google Scholar] [CrossRef]
- Chang, L.H.; Hwu, C.M.; Chu, C.H.; Won, J.G.S.; Chen, H.S.; Lin, L.Y. Upstroke time per cardiac cycle is associated with cardiovascular prognosis in type 2 diabetes. Endocr. Pract. 2019, 25, 1109–1116. [Google Scholar] [CrossRef]
- Su, H.M.; Lin, T.H.; Hsu, P.C.; Lee, W.H.; Chu, C.Y.; Chen, S.C.; Lee, C.S.; Voon, W.C.; Lai, W.T.; Sheu, S.H. Association of bilateral brachial-ankle pulse wave velocity difference with peripheral vascular disease and left ventricular mass index. PLoS ONE 2014, 9, e88331. [Google Scholar] [CrossRef]
- Szeto, C.C.; Chow, K.M.; Woo, K.S.; Chook, P.; Ching-Ha Kwan, B.; Leung, C.B.; Kam-Tao Li, P. Carotid intima media thickness predicts cardiovascular diseases in chinese predialysis patients with chronic kidney disease. J. Am. Soc. Nephrol. 2007, 18, 1966–1972. [Google Scholar] [CrossRef]
- Zanoli, L.; Lentini, P.; Briet, M.; Castellino, P.; House, A.A.; London, G.M.; Malatino, L.; McCullough, P.A.; Mikhailidis, D.P.; Boutouyrie, P. Arterial stiffness in the heart disease of ckd. J. Am. Soc. Nephrol. 2019, 30, 918–928. [Google Scholar] [CrossRef]
- Chen, J.; Budoff, M.J.; Reilly, M.P.; Yang, W.; Rosas, S.E.; Rahman, M.; Zhang, X.; Roy, J.A.; Lustigova, E.; Nessel, L.; et al. ; et al. Coronary artery calcification and risk of cardiovascular disease and death among patients with chronic kidney disease. JAMA Cardiol. 2017, 2, 635–643. [Google Scholar] [CrossRef] [PubMed]
- Hashimoto, T.; Ichihashi, S.; Iwakoshi, S.; Kichikawa, K. Combination of pulse volume recording (pvr) parameters and ankle-brachial index (abi) improves diagnostic accuracy for peripheral arterial disease compared with abi alone. Hypertens. Res. 2016, 39, 430–434. [Google Scholar] [CrossRef] [PubMed]
- Shoji, T.; Okada, S.; Ohno, Y.; Nakagomi, A.; Kobayashi, Y. High upstroke time of arterial pulse wave is an independent predictor for the presence and severity of coronary artery disease in older population. J. Hypertens. 2017, 35, e99. [Google Scholar] [CrossRef]
- Manolas, J.; Krayenbuehl, H.P. Comparison between apexcardiographic and angiographic indexes of left ventricular performance in patients with aortic incompetence. Circulation 1978, 57, 692–698. [Google Scholar] [CrossRef] [PubMed]
- Colan, S.D.; Borow, K.M.; MacPherson, D.; Sanders, S.P. Use of the indirect axillary pulse tracing for noninvasive determination of ejection time, upstroke time, and left ventricular wall stress throughout ejection in infants and young children. Am. J. Cardiol. 1984, 53, 1154–1158. [Google Scholar] [CrossRef]
- Chen, S.C.; Huang, J.C.; Tsai, Y.C.; Chen, L.I.; Su, H.M.; Chang, J.M.; Chen, H.C. Body mass index, left ventricular mass index and cardiovascular events in chronic kidney disease. Am. J. Med. Sci. 2016, 351, 91–96. [Google Scholar] [CrossRef]
- Di Lullo, L.; Gorini, A.; Russo, D.; Santoboni, A.; Ronco, C. Left ventricular hypertrophy in chronic kidney disease patients: From pathophysiology to treatment. Cardiorenal Med. 2015, 5, 254–266. [Google Scholar] [CrossRef]
- Chen, S.C.; Chang, J.M.; Tsai, Y.C.; Huang, J.C.; Chen, L.I.; Su, H.M.; Hwang, S.J.; Chen, H.C. Ratio of transmitral e-wave velocity to early diastole mitral annulus velocity with cardiovascular and renal outcomes in chronic kidney disease. Nephron. Clin. Pract. 2013, 123, 52–60. [Google Scholar] [CrossRef]
- Su, H.M.; Lin, T.H.; Lee, C.S.; Lee, H.C.; Chu, C.Y.; Hsu, P.C.; Voon, W.C.; Lai, W.T.; Sheu, S.H. Myocardial performance index derived from brachial-ankle pulse wave velocity: A novel and feasible parameter in evaluation of cardiac performance. Am. J. Hypertens. 2009, 22, 871–876. [Google Scholar] [CrossRef]
- Chen, S.C.; Chang, J.M.; Liu, W.C.; Tsai, J.C.; Chen, L.I.; Lin, M.Y.; Hsu, P.C.; Lin, T.H.; Su, H.M.; Hwang, S.J.; et al. Significant correlation between ratio of brachial pre-ejection period to ejection time and left ventricular ejection fraction and mass index in patients with chronic kidney disease. Nephrol. Dial. Transplant. 2011, 26, 1895–1902. [Google Scholar] [CrossRef][Green Version]
- Hsu, P.C.; Lin, T.H.; Lee, C.S.; Chu, C.Y.; Su, H.M.; Voon, W.C.; Lai, W.T.; Sheu, S.H. Impact of a systolic parameter, defined as the ratio of right brachial pre-ejection period to ejection time, on the relationship between brachial-ankle pulse wave velocity and left ventricular diastolic function. Hypertens. Res. 2011, 34, 462–467. [Google Scholar] [CrossRef] [PubMed][Green Version]
- Hsu, P.C.; Tsai, W.C.; Lin, T.H.; Su, H.M.; Voon, W.C.; Lai, W.T.; Sheu, S.H. Association of arterial stiffness and electrocardiography-determined left ventricular hypertrophy with left ventricular diastolic dysfunction. PLoS ONE 2012, 7, e49100. [Google Scholar] [CrossRef] [PubMed]


| Variables | Patients with All-Cause Mortality (n = 183) | Patients Without All-Cause Mortality (n = 289) | p Value * | All Patients (n = 472) | p Value ** |
|---|---|---|---|---|---|
| Age (years) | 72.4 ± 11.4 | 63.3 ± 11.6 | <0.001 | 66.8 ± 12.4 | <0.001 |
| Male gender (%) | 54.6 | 49.1 | 0.243 | 51.3 | |
| Smoking history (%) | 8.2 | 11.3 | 0.303 | 10.1 | |
| Diabetes mellitus (%) | 49.2 | 28.7 | <0.001 | 36.7 | |
| Hypertension (%) | 77.0 | 75.1 | 0.627 | 75.8 | |
| Coronary artery disease (%) | 23.6 | 17.0 | 0.078 | 19.6 | |
| Cerebrovascular disease (%) | 15.1 | 4.0 | <0.001 | 8.1 | |
| Congestive heart failure (%) | 25.2 | 4.4 | <0.001 | 12.0 | |
| Systolic blood pressure (mmHg) | 146 ± 25 | 140 ± 20 | 0.013 | 142 ± 22 | 0.001 |
| Pulse pressure (mmHg) | 69 ± 18 | 61 ± 13 | <0.001 | 78 ± 13 | <0.001 |
| Heart rate (beats/min) | 73 ± 15 | 69 ± 12 | 0.003 | 70 ± 13 | <0.001 |
| Body mass index (kg/m2) | 25.4 ± 4.1 | 26.6 ± 4.0 | 0.001 | 26.1 ± 4.1 | 0.005 |
| Antihypertensive medication | |||||
| ACEI (%) | 12.6 | 8.0 | 0.100 | 9.7 | |
| ARB (%) | 47.5 | 55.0 | 0.113 | 52.1 | |
| β blocker (%) | 42.1 | 45.5 | 0.468 | 44.2 | |
| Calcium channel blocker (%) | 43.7 | 48.8 | 0.282 | 46.8 | |
| Diuretics (%) | 46.7 | 31.0 | 0.001 | 37.1 | |
| Laboratory parameters | |||||
| Fasting glucose (mg/dL) | 125.4 ± 51.0 | 112.4 ± 40.3 | 0.007 | 116.9 ± 44.7 | <0.001 |
| Triglyceride (mg/dL) | 151.5 ± 101.1 | 153.0 ± 102.6 | 0.693 | 152.5 ± 102.0 | <0.001 |
| Total cholesterol (mg/dL) | 183.0 ± 40.7 | 194.1 ± 41.2 | 0.008 | 190.1 ± 41.3 | 0.002 |
| Base line eGFR (mL/min/1.73 m2) | 35.3 ± 15.9 | 45.9 ± 13.4 | <0.001 | 41.8 ± 15.3 | <0.001 |
| eGFR< 30 mL/min/1.73 m2 (%) | 36.1 | 12.1 | <0.001 | 21.4 | |
| baPWV (cm/s) | 2128.1 ± 599.4 | 1776.1 ± 356.5 | <0.001 | 1912.6 ± 496.0 | <0.001 |
| Upstroke time (ms) | 177.4 ± 47.6 | 150.3 ± 28.0 | <0.001 | 160.8 ± 39.1 | <0.001 |
| Variables | Cardiovascular Mortality | All-Cause Mortality | ||
|---|---|---|---|---|
| HR (95% CI) | p Value | HR (95% CI) | p Value | |
| Age (years) | 1.067 (1.040, 1.095) | <0.001 | 1.072 (1.054, 1.090) | <0.001 |
| Gender (male) | 0.863 (0.523, 1.423) | 0.564 | 1.043 (0.760, 1.433) | 0.794 |
| Smoking history | 1.076 (0.463, 2.497) | 0.865 | 0.806 (0.456, 1.422) | 0.456 |
| Diabetes mellitus | 2.292 (1.391, 3.778) | 0.001 | 1.955 (1.422, 2.687) | <0.001 |
| Hypertension | 0.707 (0.415, 1.205) | 0.202 | 1.019 (0.706, 1.471) | 0.919 |
| Coronary artery disease | 2.184 (1.282, 3.721) | 0.004 | 1.307 (0.893, 1.914) | 0.169 |
| Cerebrovascular disease | 3.193 (1.620, 6.297) | 0.001 | 2.757 (1.753, 4.336) | <0.001 |
| Congestive heart failure | 5.050 (2.908, 8.771) | <0.001 | 3.635 (2.487, 5.313) | <0.001 |
| Systolic blood pressure (per 1 mmHg) | 1.007 (0.996, 1.019) | 0.207 | 1.010 (1.002, 1.017) | <0.001 |
| Pulse pressure (per 1 mmHg) | 1.024 (1.008, 1.040) | 0.003 | 1.027 (1.017, 1.037) | <0.001 |
| Heart rate (per 1 beats/min) | 1.023 (1.004, 1.041) | 0.015 | 1.017 (1.005, 1.029) | 0.005 |
| Body mass index (per 1 kg/m2) | 0.912 (0.849, 0.979) | 0.011 | 0.934 (0.893, 0.976) | 0.002 |
| Antihypertensive medication | ||||
| ACEI | 0.753 (0.273, 2.074) | 0.583 | 1.195 (0.701, 2.036) | 0.513 |
| ARB | 1.096 (0.663, 1.810) | 0.721 | 0.835 (0.608, 1.146) | 0.264 |
| β blocker | 1.158 (0.703, 1.905) | 0.565 | 0.962 (0.699, 1.324) | 0.811 |
| Calcium channel blocker | 0.957 (0.581, 1.576) | 0.862 | 0.917 (0.667, 1.260) | 0.593 |
| Diuretics | 1.274 (0.766, 2.117) | 0.350 | 1.670 (1.216, 2.295) | 0.002 |
| Laboratory parameters | ||||
| Fasting glucose (per 1 mg/dL) | 1.007 (1.002, 1.012) | 0.007 | 1.005 (1.001, 1.008) | 0.008 |
| Triglyceride (per 1 mg/dL) | 0.999 (0.996, 1.002) | 0.502 | 0.999 (0.998, 1.001) | 0.597 |
| Total cholesterol (per 1 mg/dL) | 0.994 (0.987, 1.002) | 0.127 | 0.992 (0.998, 0.997) | 0.001 |
| Baseline eGFR (per 1 mL/min/1.73 m2) | 0.979 (0.964, 0.994) | 0.006 | 0.967 (0.958, 0.976) | <0.001 |
| baPWV (per 10 cm/s) | 1.011 (1.007, 1.016) | <0.001 | 1.013 (1.010, 1.016) | <0.001 |
| Upstroke time (per 1 ms) | 1.015 (1.010, 1.020) | <0.001 | 1.014 (1.011, 1.017) | <0.001 |
| Continuous Variables | Variance Inflation Factors in Cardiovascular Mortality Model | Variance Inflation Factors in All-Cause Mortality Model |
|---|---|---|
| Age (years) | 1.925 | 1.925 |
| Systolic blood pressure (mmHg) | 4.927 | 4.927 |
| Pulse pressure (mmHg) | 5.388 | 5.388 |
| Heart rate (beats/min) | 1.349 | 1.349 |
| Body mass index (kg/m2) | 1.099 | 1.099 |
| Fasting glucose (mg/dL) | 1.098 | 1.098 |
| Triglyceride (mg/dL) | 1.115 | 1.115 |
| Total cholesterol (mg/dL) | 1.128 | 1.128 |
| Baseline eGFR (mL/min/1.73 m2) | 1.127 | 1.127 |
| Brachial-ankle pulse wave velocity (per 10 cm/s) | 2.010 | 2.010 |
| Upstroke time (ms) | 1.546 | 1.546 |
| Continuous Variables (After Removing Systolic Blood Pressure) | Variance Inflation Factors in Cardiovascular Mortality Model | Variance Inflation Factors in All-Cause Mortality Model |
|---|---|---|
| Age (years) | 1.560 | 1.560 |
| Pulse pressure (mmHg) | 1.734 | 1.734 |
| Heart rate (beats/min) | 1.312 | 1.312 |
| Body mass index (kg/m2) | 1.094 | 1.094 |
| Fasting glucose (mg/dL) | 1.090 | 1.090 |
| Triglyceride (mg/dL) | 1.115 | 1.115 |
| Total cholesterol (mg/dL) | 1.127 | 1.127 |
| Baseline eGFR (mL/min/1.73 m2) | 1.127 | 1.127 |
| Brachial-ankle pulse wave velocity (per 10 cm/s) | 1.727 | 1.727 |
| Upstroke time (ms) | 1.469 | 1.469 |
| Variables | Cardiovascular Mortality | All-Cause Mortality | ||||||
|---|---|---|---|---|---|---|---|---|
| Model 1 HR (95% CI) | p Value | Model 2 HR (95% CI) | p Value | Model 1 HR (95% CI) | p Value | Model 2 HR (95% CI) | p Value | |
| Age (per 1 year) | 1.081 (1.039, 1.124) | <0.001 | 1.007 (1.035, 1.020) | <0.001 | 1.069 (1.043, 1.094) | <0.001 | 1.070 (1.045, 1.096) | <0.001 |
| Coronary artery disease | 2.433 (1.257, 4.708) | 0.008 | 1.523 (0.755, 3.073) | 0.240 | / | / | ||
| Cerebrovascular disease | 1.863 (0.747, 4.647) | 0.182 | 1.782 (0.709, 4.481) | 0.219 | 2.251 (1.232, 4.113) | 0.008 | 2.235 (1.232, 4.054) | 0.008 |
| Congestive heart failure | 6.776 (3.276, 14.015) | <0.001 | 5.199 (2.546, 10.617) | <0.001 | 3.056 (1.817, 5.138) | <0.001 | 2.291 (1.379, 3.808) | 0.001 |
| Fasting glucose (per 1 mg/dL) | / | / | 1.003 (0.999, 1.007) | 0.151 | 1.003 (0.944, 0.971) | 0.090 | ||
| Baseline eGFR (per 1 mL/min/1.73 m2) | / | / | 0.963 (0.950, 0.977) | <0.001 | 0.957 (0.944, 0.971) | <0.001 | ||
| baPWV (per 10 cm/s) | 1.011 (1.003, 1.019) | 0.008 | / | 1.010 (1.005, 1.015) | <0.001 | / | ||
| Upstroke time (per 1 ms) | / | 1.010 (1.003, 1.017) | 0.007 | / | 1.009 (1.004, 1.013) | <0.001 | ||
© 2020 by the authors. Licensee MDPI, Basel, Switzerland. This article is an open access article distributed under the terms and conditions of the Creative Commons Attribution (CC BY) license (http://creativecommons.org/licenses/by/4.0/).
Share and Cite
Lee, W.-H.; Hsu, P.-C.; Chu, C.-Y.; Chen, S.-C.; Chen, Y.-C.; Lee, M.-K.; Lee, H.-H.; Lee, C.-S.; Yen, H.-W.; Lin, T.-H.; et al. Upstroke Time as a Novel Predictor of Mortality in Patients with Chronic Kidney Disease. Diagnostics 2020, 10, 422. https://doi.org/10.3390/diagnostics10060422
Lee W-H, Hsu P-C, Chu C-Y, Chen S-C, Chen Y-C, Lee M-K, Lee H-H, Lee C-S, Yen H-W, Lin T-H, et al. Upstroke Time as a Novel Predictor of Mortality in Patients with Chronic Kidney Disease. Diagnostics. 2020; 10(6):422. https://doi.org/10.3390/diagnostics10060422
Chicago/Turabian StyleLee, Wen-Hsien, Po-Chao Hsu, Chun-Yuan Chu, Szu-Chia Chen, Ying-Chih Chen, Meng-Kuang Lee, Hung-Hao Lee, Chee-Siong Lee, Hsueh-Wei Yen, Tsung-Hsien Lin, and et al. 2020. "Upstroke Time as a Novel Predictor of Mortality in Patients with Chronic Kidney Disease" Diagnostics 10, no. 6: 422. https://doi.org/10.3390/diagnostics10060422
APA StyleLee, W.-H., Hsu, P.-C., Chu, C.-Y., Chen, S.-C., Chen, Y.-C., Lee, M.-K., Lee, H.-H., Lee, C.-S., Yen, H.-W., Lin, T.-H., Voon, W.-C., Lai, W.-T., Sheu, S.-H., & Su, H.-M. (2020). Upstroke Time as a Novel Predictor of Mortality in Patients with Chronic Kidney Disease. Diagnostics, 10(6), 422. https://doi.org/10.3390/diagnostics10060422