Postmortem Determination of Short-Term Markers of Hyperglycemia for the Purposes of Medicolegal Opinions


Abstract
1. Introduction
2. Experimental
2.1. Study Design, Samples Collection, and Storage
2.2. Chemicals and Reagents
2.3. Sample Preparation
2.3.1. Glucose and Lactate
2.3.2. Acetone
2.3.3. β-hydroxybutyric Acid
2.3.4. 1,5-anhydroglucitol
2.4. Instrumentation
2.4.1. Glucose and Lactate
2.4.2. Acetone
2.4.3. β-hydroxybutyric Acid
2.4.4. 1,5-anhydroglucitol
2.5. Method Development and Validation
2.5.1. Glucose and Lactate
2.5.2. Acetone
2.5.3. β-hydroxybutyric Acid
2.5.4. 1,5-anhydroglucitol
2.6. Statistics
3. Results
3.1. Glucose and Lactate
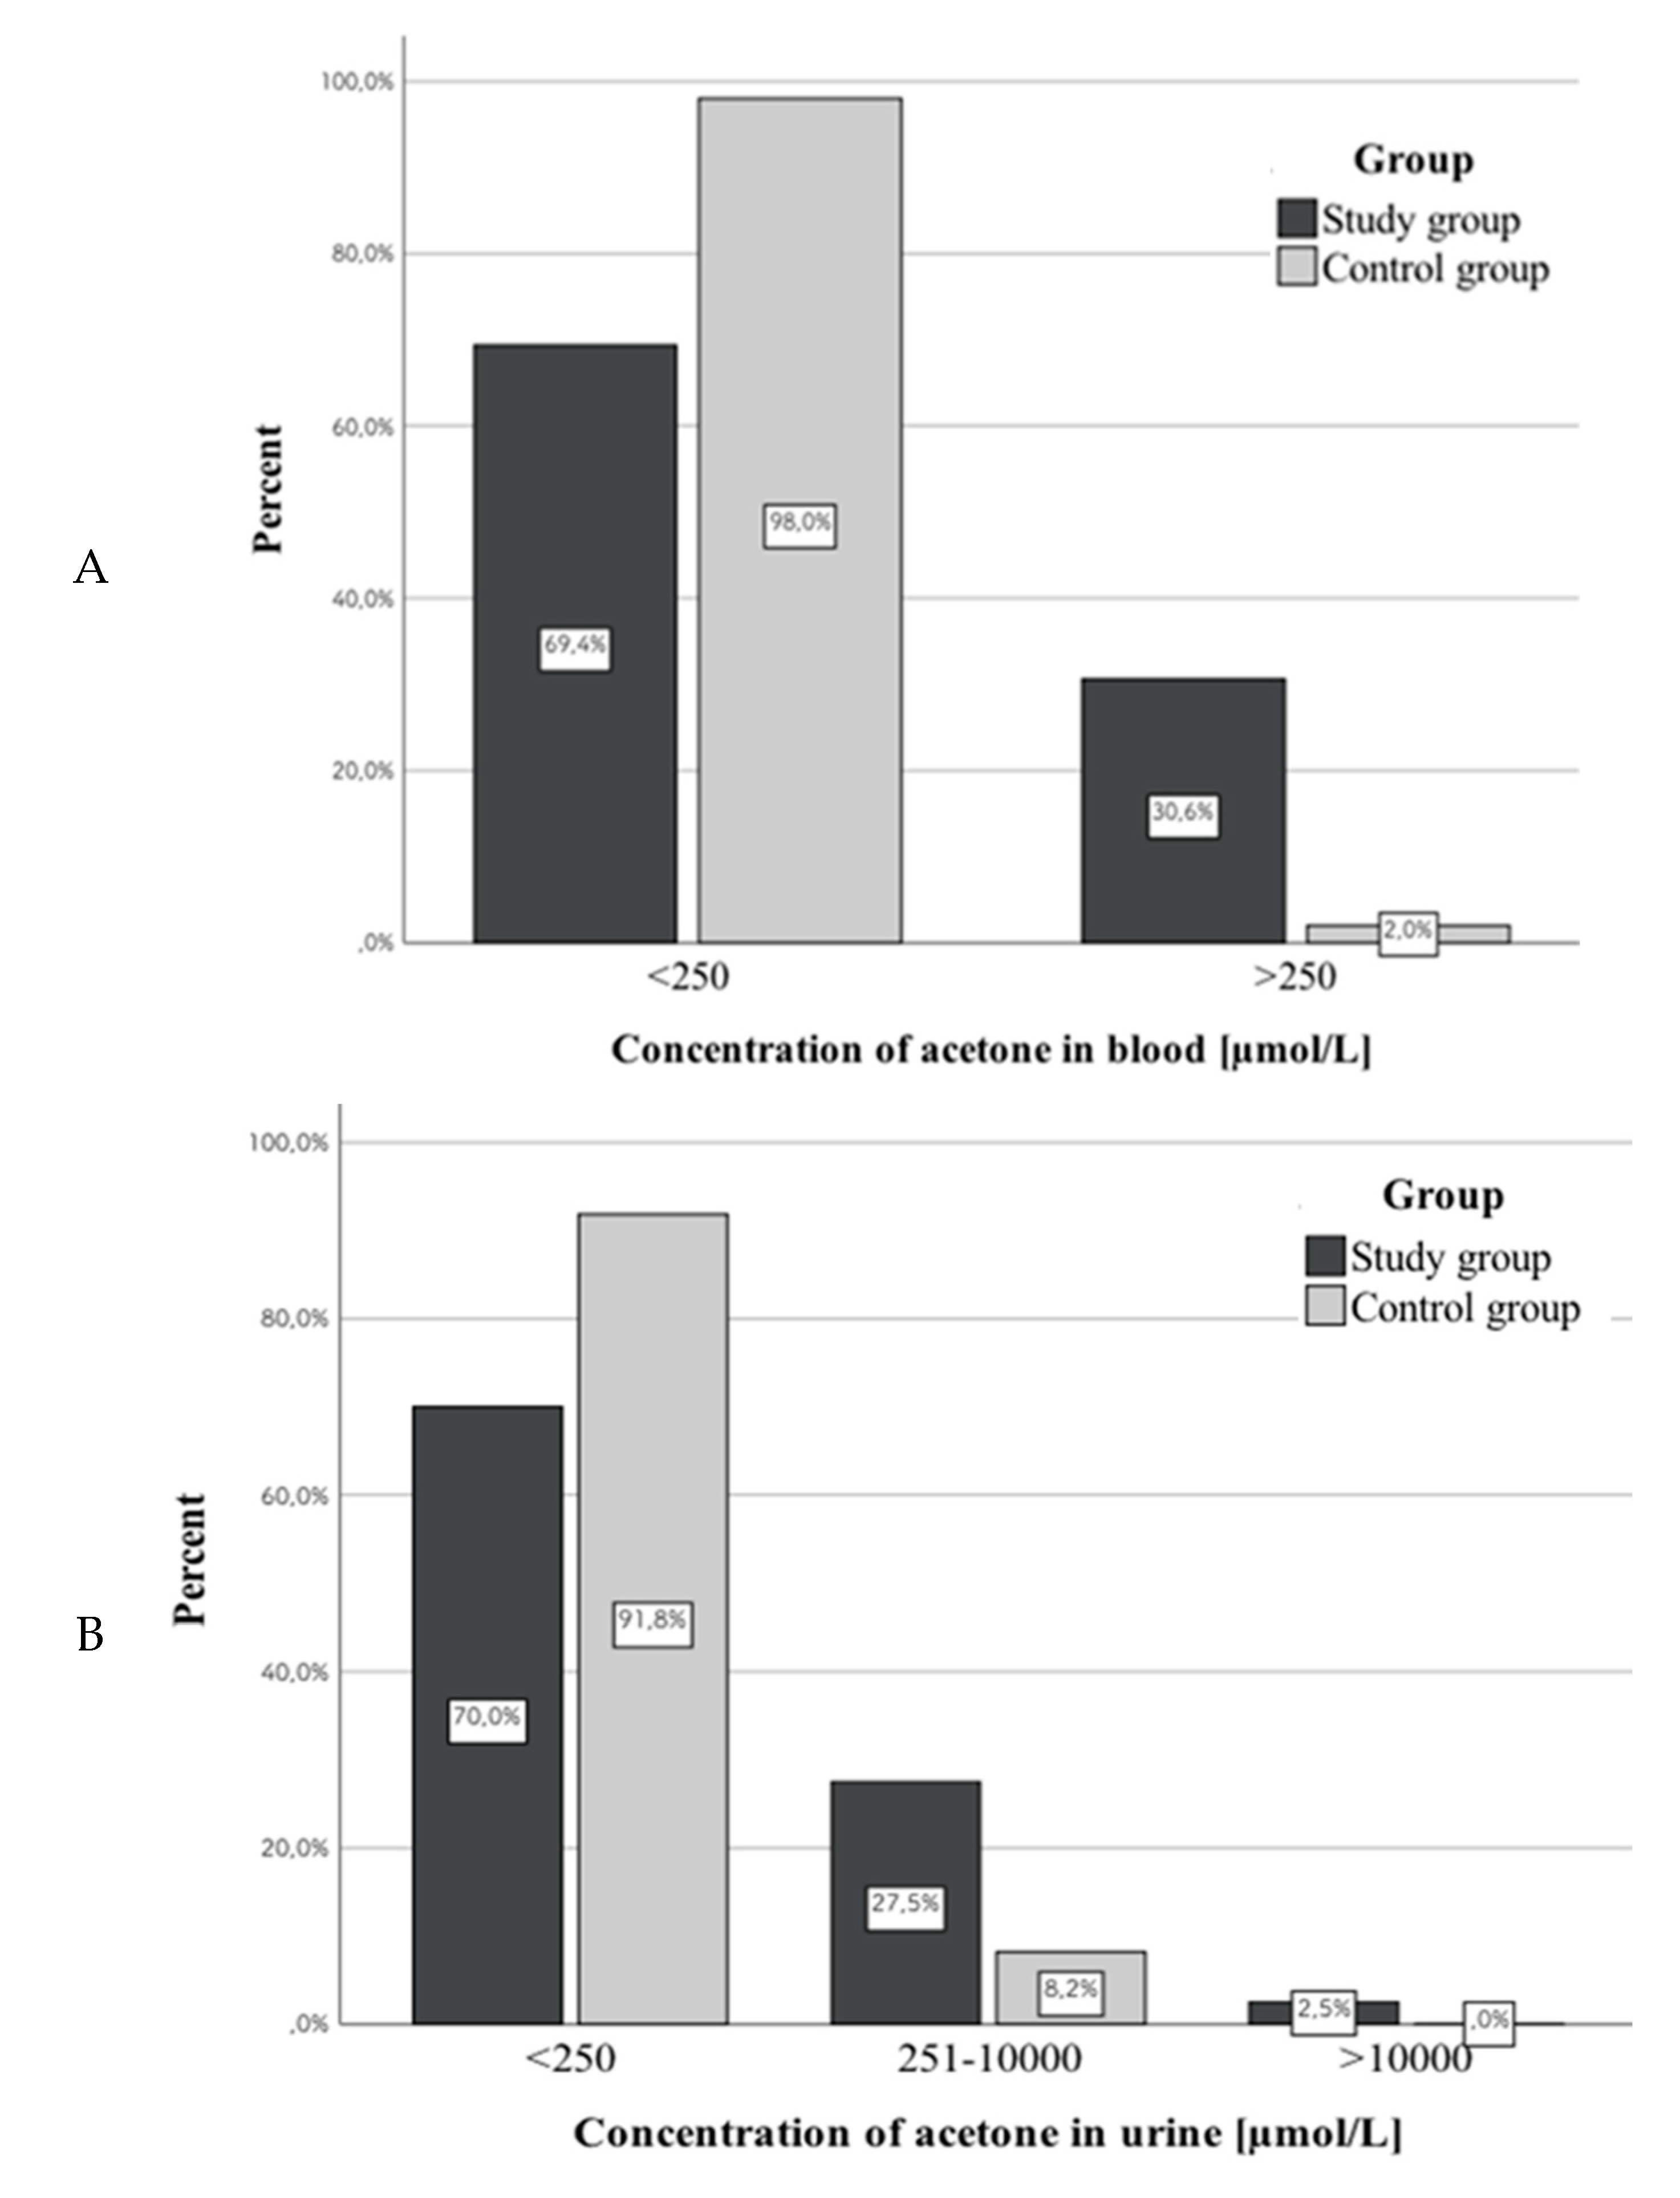
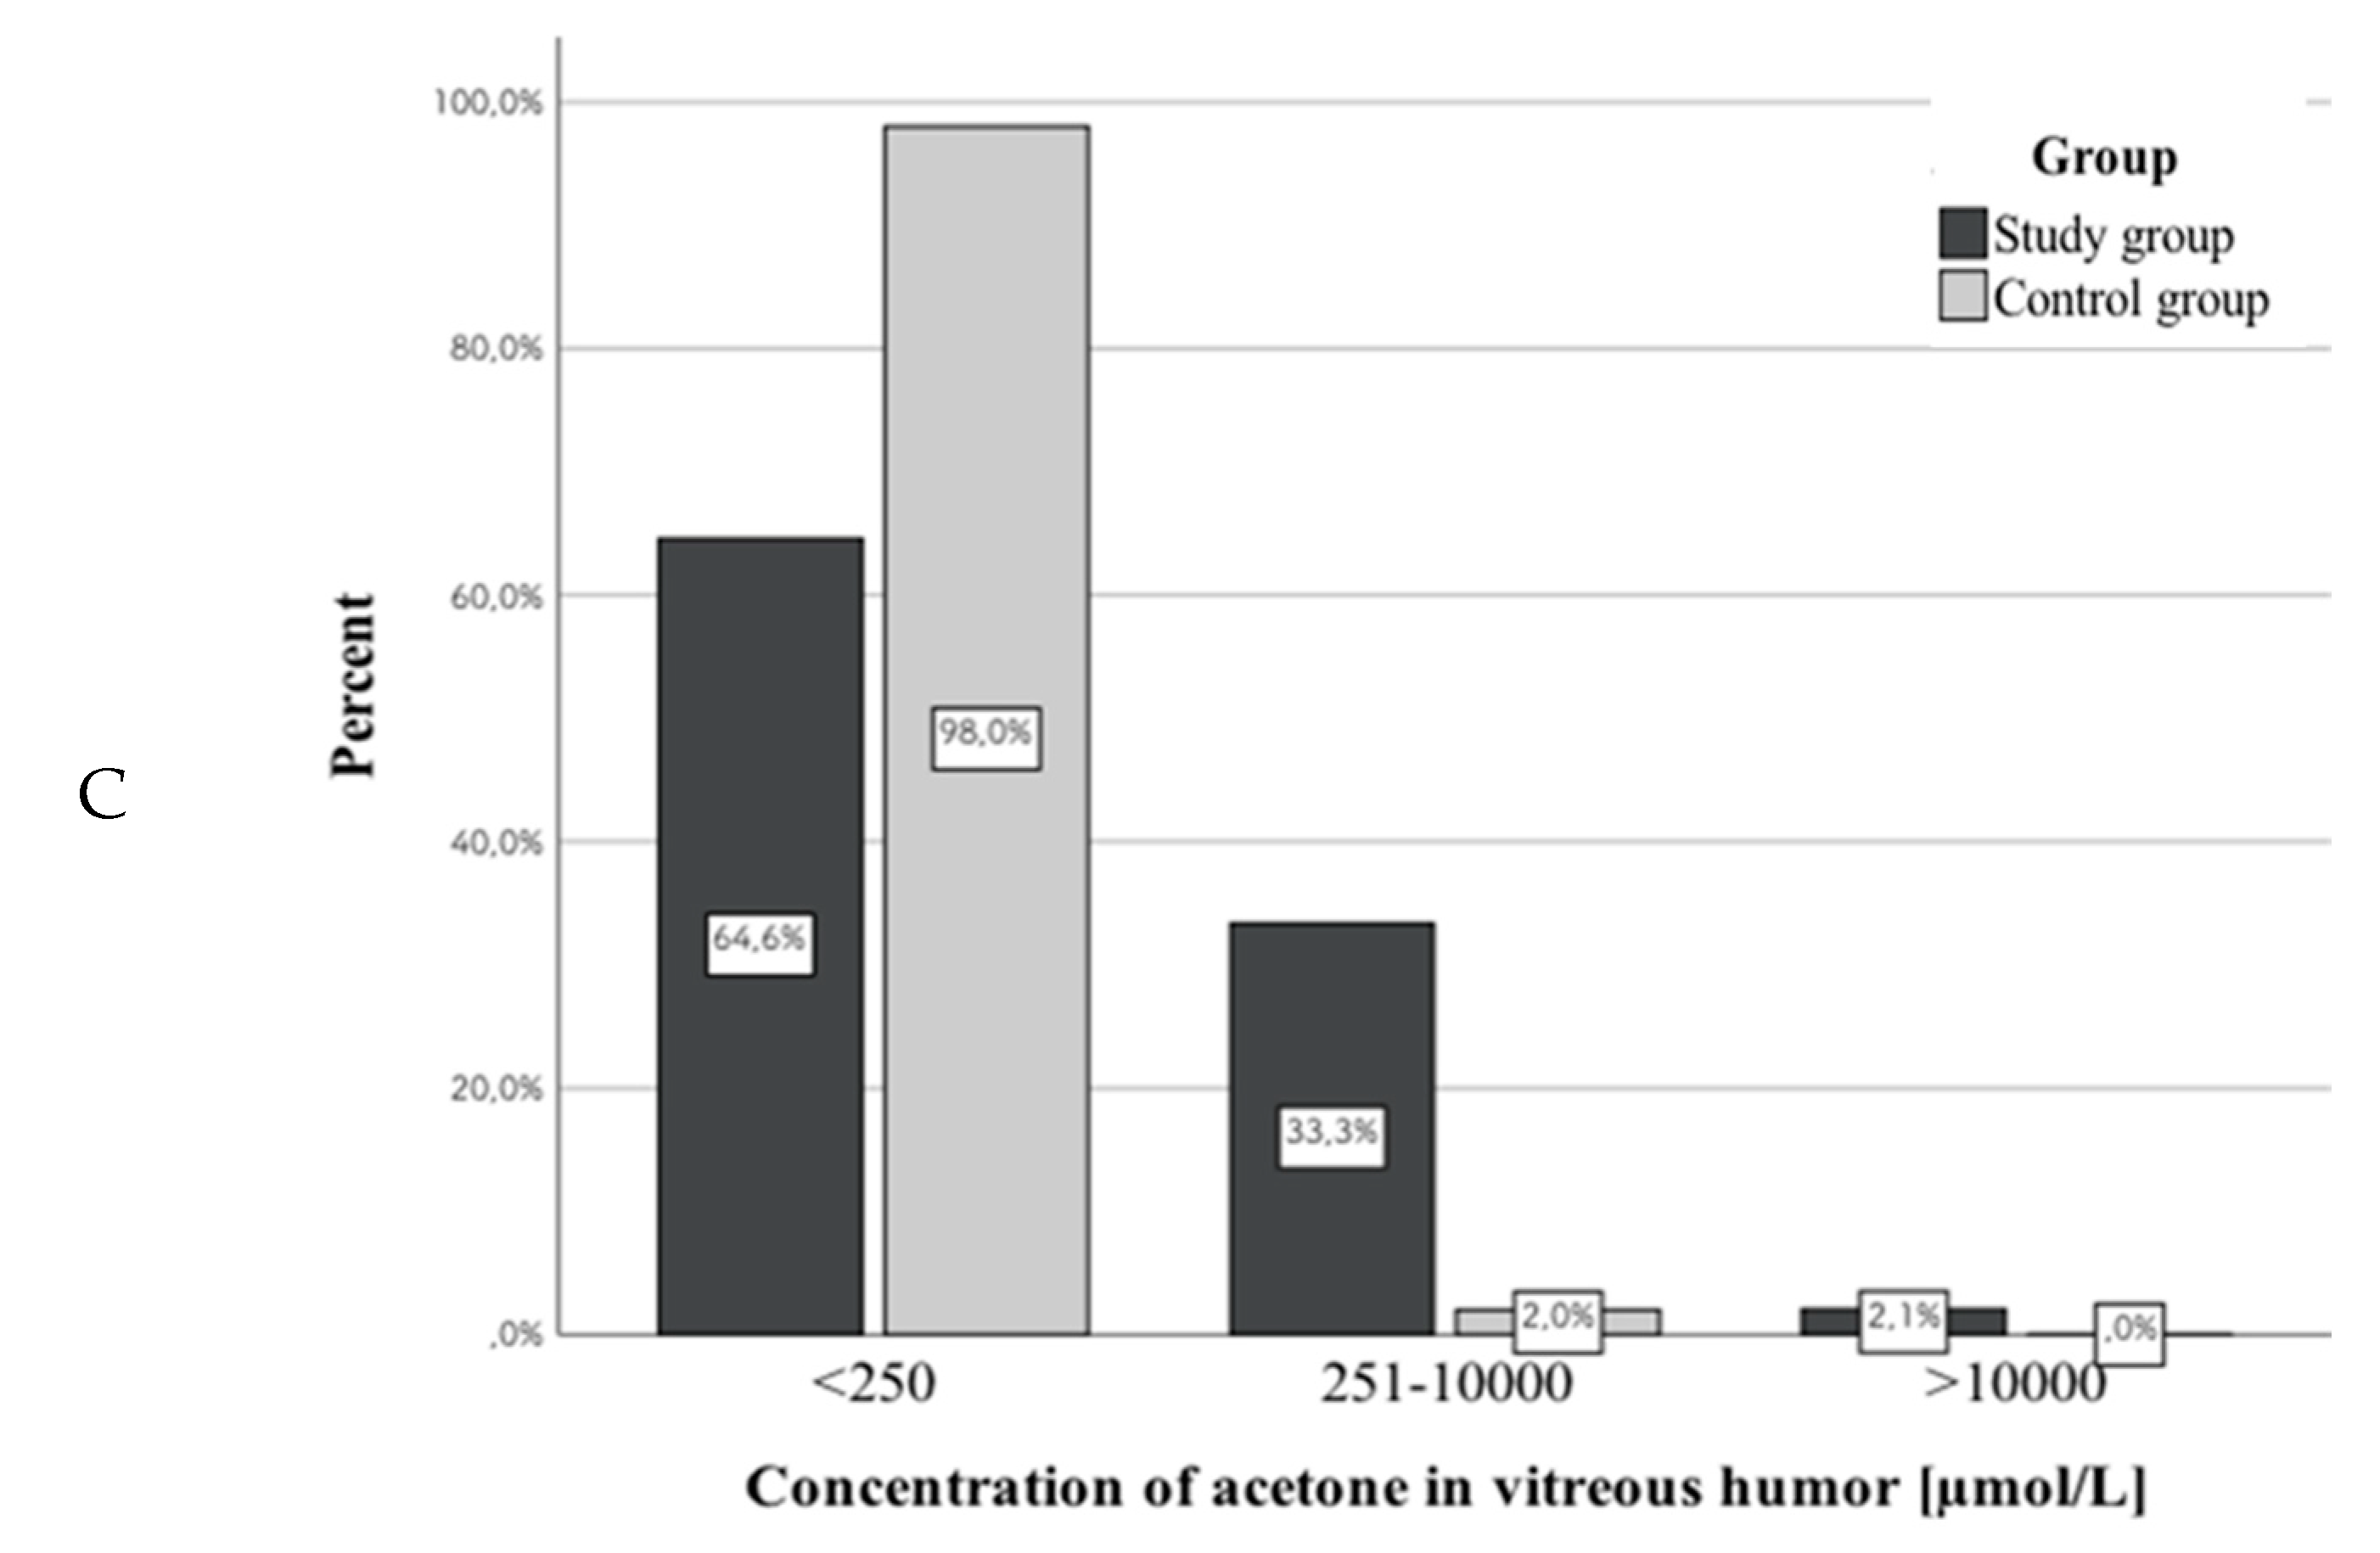
3.2. Acetone
3.3. β-hydroxybutyric Acid
3.4. 1,5-anhydroglucitol
3.5. PMI and Concentrations of Studied Markers
3.6. Assessment of the Correlation between Concentrations of the Same Marker in Different Biological Matrices
3.6.1. Glucose
3.6.2. Lactate
3.6.3. β-hydroxybutyric Acid
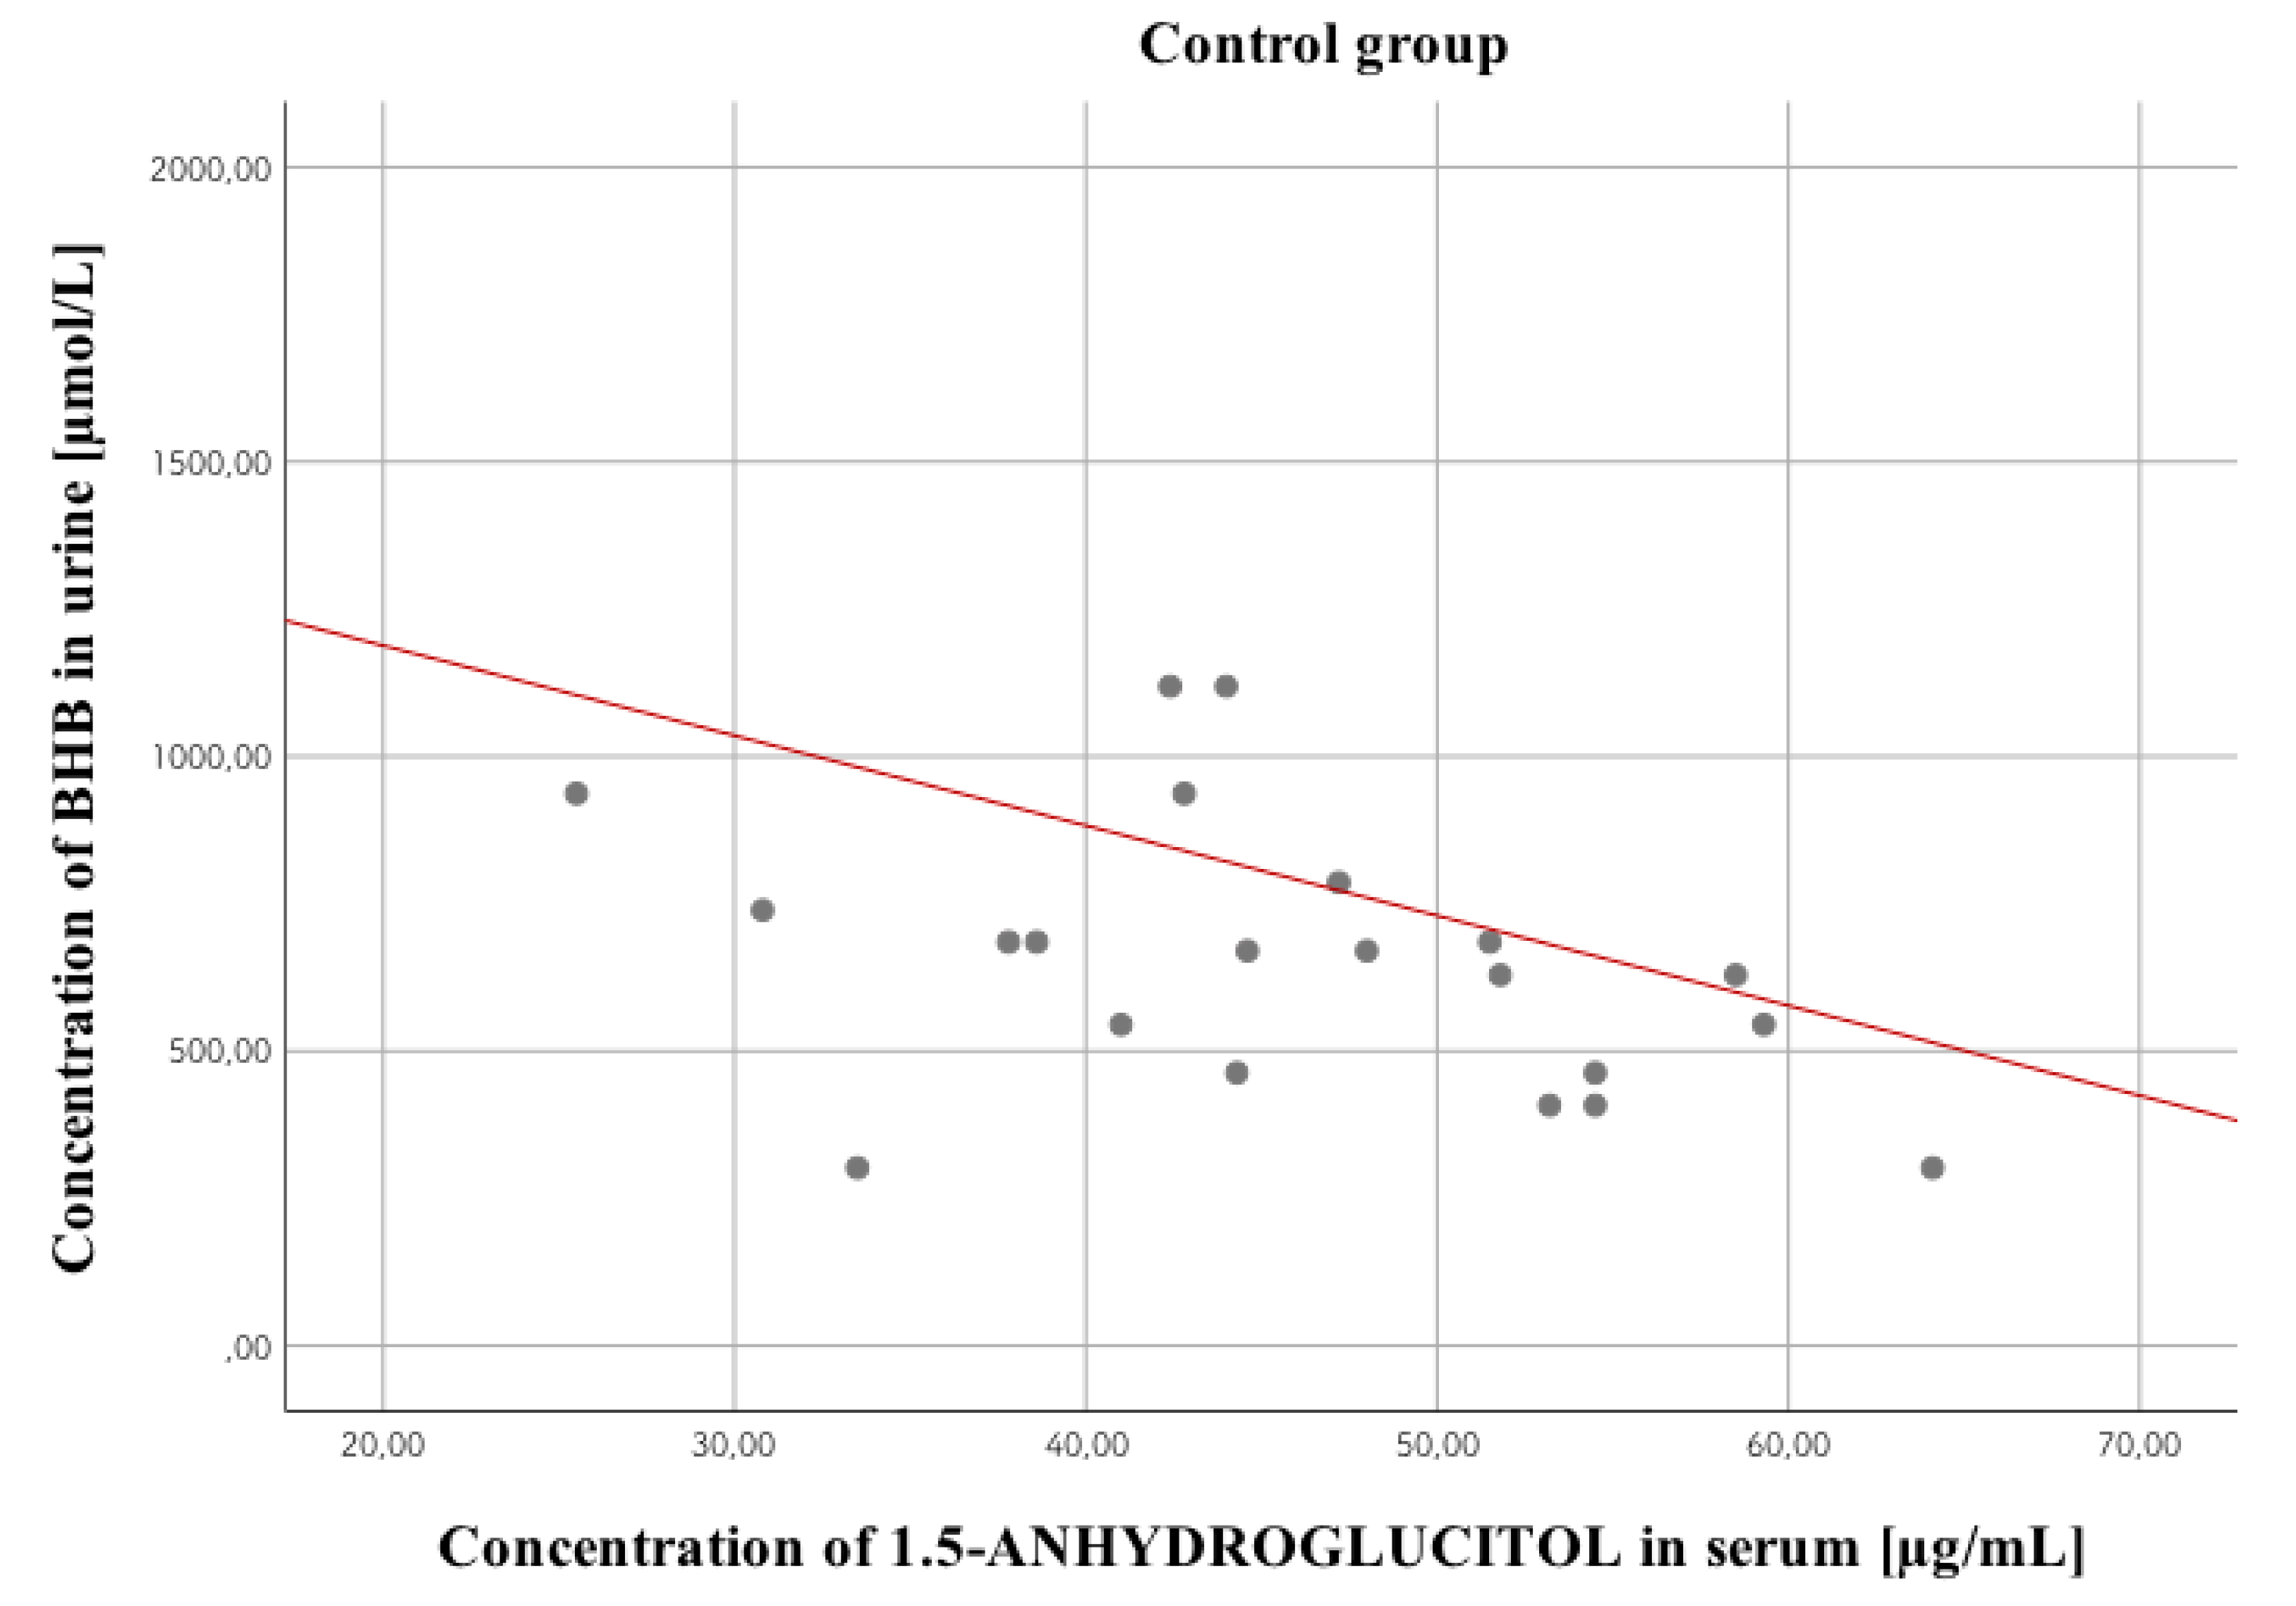
3.6.4. 1,5-anhydroglucitol
3.7. Assessment of the Correlation between Concentrations of the Analyzed Markers in Different Study Groups
4. Discussion
5. Limitations
6. Conclusions
Author Contributions
Funding
Conflicts of Interest
References
- IDF Diabetes Atlas Ninth Edition 2019. Available online: https://www.idf.org/e-library/epidemiology-research/diabetes-atlas/159-idf-diabetes-atlas-ninth-edition-2019.html (accessed on 20 March 2020).
- Palmiere, C. Postmortem diagnosis of diabetes mellitus and its complications. Croat. Med. J. 2015, 56, 181–193. [Google Scholar] [CrossRef]
- Musshoff, F.; Hess, C.; Madea, B. Disorders of glucose metabolism: Post mortem analyses in forensic cases-part II. Int. J. Leg. Med. 2011, 125, 171–180. [Google Scholar] [CrossRef] [PubMed]
- Szadkowska, A. Acute complications of diabetes mellitus. Fam. Med. Prim. Care Rev. 2012, 14, 286–290. (In Polish) [Google Scholar]
- Solnica, B. Laboratory diagnosis of metabolic diseases. In Laboratory Diagnostics, 1st ed.; Solnica, B., Ed.; PZWL: Warsaw, Poland, 2014; pp. 169–170. (In Polish) [Google Scholar]
- Winecker, R.E.; Hammett-Stabler, C.A.; Chapman, J.F.; Ropero-Miller, J.D. HbA1c as a postmortem tool to identify glycemic control. J. Forensic Sci. 2002, 47, 1373–1379. [Google Scholar] [CrossRef]
- Ergönen, A.T.; Can, I.Ö.; Özdemir, H.M.; Sonmez, E.; Kume, T.; Salacin, S.; Ergönen, F.; Önvural, B.; Sen, F. Evaluation of glycosylated hemoglobin and glycosylated albumin levels in forensic autopsies. Rom. J. Leg. Med. 2010, 18, 63–68. [Google Scholar] [CrossRef]
- Yang, C.; Li, H.; Wang, Z.; Zhang, W.; Zhou, K.; Meng, J.; Technician, C.; Zhao, Y.; Technician, C.; Pan, J.; et al. Glycated albumin is a potential diagnostic tool for diabetes mellitus. Clin. Med. 2012, 12, 568–571. [Google Scholar] [CrossRef] [PubMed]
- Hess, C.; Musshoff, F.; Madea, B. 1, 5-anhydroglucitol- a marker for ante mortem hyperglycemia? Toxichem Krimtech. 2011, 78, 363–366. [Google Scholar]
- Nowak, K.; Zawadzki, M.; Jurek, T. Postmortem determination of HbA1c and glycated albumin concentrations using the UHPLC-QqQ-MS/MS method for the purposes of medicolegal opinions. Microchem. J. 2020, 155, 104733. [Google Scholar] [CrossRef]
- Hess, C.; Stratmann, B.; Quester, W.; Madea, B.; Musshoff, F.; Tschoepe, D. Clinical and forensic examination of glycemic marker 1,5-anhydroglucitol by means of high performance liquid chromatography tandem mass spectrometry. Forensic Sci. Int. 2012, 222, 132–136. [Google Scholar] [CrossRef]
- Matuszewski, B.K.; Constanzer, M.L.; Chavez-Eng, C.M. Strategies for the assessment of matrix effect in quantitative bioanalytical methods based on HPLC–MS/MS. Anal. Chem. 2003, 75, 3019–3030. [Google Scholar] [CrossRef]
- Karlovsek, M.Z. Diagnostic values of combined glucose and lactate values in cerebrospinal fluid and vitreous humour- our experience. Forensic Sci. Int. 2004, 146, S19–S23. [Google Scholar] [CrossRef] [PubMed]
- Hess, C.; Mushoff, F.; Medea, B. Disorders of glucose metabolism- post mortem analyses in forensic cases: Part I. Int. J. Leg. Med. 2011, 125, 163–170. [Google Scholar] [CrossRef] [PubMed]
- Goulle, J.-P.; Lacroix, C.; Bouige, D. Glycated haemoglobin: A useful post-mortem reference marker in determining diabetes. Forensic Sci. Int. 2002, 128, 44–49. [Google Scholar] [CrossRef]
- Zilg, B.; Alkass, K.; Berg, S.; Druid, H. Postmortem identification of hyperglycemia. Forensic Sci. Int. 2009, 185, 89–95. [Google Scholar] [CrossRef]
- Cobas® Glucose HK Gen.3 Reagent Package Insert. Available online: http://info.fda.gov.tw/MLMS/ShowFile.aspx?LicId=06021676&Seq=002&Type=9 (accessed on 20 March 2020).
- Cobas® Lactate Gen.2 Reagent Package Insert. Available online: http://labogids.sintmaria.be/sites/default/files/files/lact2_2018-11_v12.pdf (accessed on 20 March 2020).
- Heimer, J.; Gascho, D.; Chatzaraki, V.; Kanute, D.F.; Sterzik, V.; Martinez, R.M.; Thali, M.J.; Zoelch, N. Postmortem 1H-MRS-detection of ketone bodies and glucose in diabetic ketoacidosis. Int. J. Leg. Med. 2018, 132, 593–598. [Google Scholar] [CrossRef] [PubMed]
- Boulagnon, C.; Garnotel, R.; Fornes, P.; Gillery, P. Post-mortem biochemistry of vitreous humor and glucose metabolism: An update. Clin. Chem. Lab. Med. 2011, 49, 1265–1270. [Google Scholar] [CrossRef]
- Madea, B. Is there recent progress in the estimation of the postmortem interval by means of tanatochemistry? Forensic Sci. Int. 2005, 151, 139–149. [Google Scholar] [CrossRef]
- Blana, S.A.; Musshoff, F.; Hoeller, T.; Fimmers, R.; Madea, B. Variations in vitreous humor chemical values as a result of pre-analytical treatment. Forensic Sci. Int. 2011, 210, 263–270. [Google Scholar] [CrossRef]
- Vivero, G.; Vivero-Salmerón, G.; Pérez Cárceles, M.D.; Bedate, A.; Luna, A.; Osuna, E. Combined determination of glucose and fructosamine in vitreous humor as a post-mortem tool to identify antemortem hyperglycemia. Rev. Diabet. Stud. 2008, 5, 220–224. [Google Scholar] [CrossRef][Green Version]
- Keltanen, T.; Neonen, T.; Ketola, R.A.; Ojanperä, I.; Sajantila, A.; Lindroos, K. Post-mortem analysis of lactate concentration in diabetics and metformin poisonings. Int. J. Leg. Med. 2015, 129, 1225–1231. [Google Scholar] [CrossRef]
- Teresiński, G.; Buszewicz, G.; Mądro, R. Usefulness of ß-hydroxybutyric acid, acetoacetic acid and acetone determinations in blood, urine and vitreous humour for necrochemical diagnosis of premortal metabolic disorders. Probl. Forens. Sci. 2000, 44, 57–75. [Google Scholar]
- Keltanen, T.; Sajantila, A.; Palo, J.U.; Partnen, T.; Valonen, T.; Lindroos, K. Assessment of Traub formula and ketone bodies in cause of deathinvestigations. Int. J. Leg. Med. 2013, 127, 1131–1137. [Google Scholar] [CrossRef] [PubMed]
- Brinkmann, B.; Fechner, G.; Karger, B.; DuChesne, A. Ketoacidosis and lactic acidosis–frequent causes of death in chronic alcoholics? Int. J. Legal. Med. 1998, 111, 115–119. [Google Scholar] [CrossRef] [PubMed]
- Heninger, M. Postmortem vitreous beta-hydroxybutyrate: Interpretation in a forensic setting. J. Forensic Sci. 2012, 57, 1234–1240. [Google Scholar] [CrossRef]
- Elliot, S.; Smith, C.; Cassidy, D. The post-mortem relationship between beta-hydroxybutyrate (BHB), acetone and ethanol in ketoacidosis. Forensic Sci. Int. 2010, 198, 53–57. [Google Scholar] [CrossRef]
- Iten, P.X.; Meier, M. Beta-hydroxybutyric acid—an indicator for an alcoholic ketoacidosis as cause of death in deceased alcohol abusers. J. Forensic Sci. 2000, 45, 624–632. [Google Scholar] [CrossRef]
- Nowak, N. Evaluation of 1, 5-Anhydroglucitol as a Marker of Metabolic Control in Pregnant Women with Type I Diabetes. Ph.D. Thesis, Jagiellonian University, Kraków, Poland, 2012. [Google Scholar]
- Dąbrowska, A.M.; Tarach, J.S.; Kurowska, M. 1, 5-anhydroglucitol (1,5-AG) and its usefulness in clinical practice. Med. Biol. Sci. 2012, 26, 11–17. [Google Scholar] [CrossRef][Green Version]
- Takata, T.; Yamasaki, Y.; Kitao, T.; Miyaishi, S. Measurement of postmortem 1, 5-anhydroglucitol in vitreous humor for forensic diagnosis. J. Forensic Sci. 2016, 61, 150–153. [Google Scholar] [CrossRef]
- Sydow, K.; Kueting, T.; Musshoff, F.; Madea, B.; Hess, C. 1,5-Anhydro-D-glucitol in vitreous humor and cerebrospinal fluid—A helpful tool for identification of diabetes coma post mortem. Forensic Sci. Int. 2018, 289, 397–407. [Google Scholar] [CrossRef] [PubMed]
- Sydow, K.; Wiedfeld, C.; Musshoff, F.; Madea, B.; Tschoepe, D.; Stratmann, B.; Hess, C. Evaluation of 1,5-anhydro-D-glucitol in clinical and forensic urine samples. Forensic Sci. Int. 2018, 287, 88–97. [Google Scholar] [CrossRef] [PubMed]
- Belsey, S.I.; Flangan, R.J. Post-mortem biochemistry: Current applications. J. Forensic Leg. Med. 2016, 41, 49–57. [Google Scholar] [CrossRef] [PubMed]
- Holstein, A.; Titzle, U.; Hess, C. Postmortem analysis of vitreous humor for determination of antemortem disorders in glucose metabolism. An old method revisited. Exp. Clin. Endocrinol. Diabetes 2018. [Google Scholar] [CrossRef]
- Garland, J.; Olds, K.; Rousseau, G.; Palmiere, C.; Ondruschka, B.; Kesha, K.; Glenn, C.; Morrow, P.; Stables, S.; Tse, R. Using vitreous humour and cerebrospinal fluid electrolytes in estimating post-mortem interval—An exploratory study. Aust. J. Forensic Sci. 2019. [Google Scholar] [CrossRef]
- Garland, J.; Philcox, W.; McCarthy, S.; Kesha, K.; Lam, L.; Spark, A.; Palmiere, C.; Elstub, H.; Cala, A.D.; Stables, S.; et al. Post-mortem biochemistry differences between vitreous humour and cerebrospinal fluid. Aust. J. Forensic Sci. 2019. [Google Scholar] [CrossRef]
- Pérez-Martínez, C.; Bonete, G.P.; Pérez-Cárceles, M.D.; Luna, A. Influence of the nature of death in biochemical analysis of the vitreous humour for the estimation of post-mortem interval. Aust. J. Forensic Sci. 2019. [Google Scholar] [CrossRef]
- Felby, S.; Nielsen, E.; Thomsen, J.L. The postmortem distribution of ketone bodies between blood, vitreous humor, spinal fluid and urine. Forensic Sci. Med. Pathol. 2008, 4, 100–107. [Google Scholar] [CrossRef]
- Gagajewski, A.; Murakami, M.M.; Kloss, J.; Edstrom, M.; Hillyer, M.; Peterson, G.F.; Amatuzio, J.; Apple, F.S. Measurement of chemical analytes in vitreous humor: Stability and precision studies. J. Forensic Sci. 2004, 49, 371–374. [Google Scholar] [CrossRef]


| Compound | Transition (m/z) | CE (V) | Event Time (s) | Retention Time (min) |
|---|---|---|---|---|
| BHB derivate | 275.0 > 159.2 * 275.0 > 147.2 233.0 > 147.1 | 9 21 12 | 0.075 | 9.385 |
| BHB-d4 derivate | 279.0 > 163.2 * 279.0 > 147.5 237.0 > 146.9 | 6 30 33 | 0.075 | 9.375 |
| Compound | Precursor Ion (m/z) | Product Ion [m/z] | Dwell Time (msec) | Q1 Pre-Bias (V) | Collision Energy (V) | Q3 Pre-Bias (V) | Retention Time (min) |
|---|---|---|---|---|---|---|---|
| 1,5-Anhydro-D-glucitol | 163.2 | 101.0 * 112.9 58.9 | 81.0 | 12 12 12 | 12 15 24 | 19 21 23 | 0.73 |
| 1,5-Anhydro-D-glucitol-13C6 | 169.2 | 105.1 * 118.1 61.0 | 81.0 | 17 12 17 | 13 16 22 | 17 16 22 | 0.72 |
| Marker | Concentration of QC | Intra-Day Precision (%) | Intra-Day Accuracy (%) | Inter-Day Precision (%) | Inter-Day Accuracy (%) |
|---|---|---|---|---|---|
| Glucose | 103 mg/dL | 1.0 | 0.1 | 1.0 | 1.7 |
| 243 mg/dL | 0.3 | 0.0 | 0.8 | 0.3 | |
| Lactate | 15 mg/dL | 0.3 | 1.9 | 1.7 | 0.9 |
| 34.3 mg/dL | 0.5 | −1.8 | 1.0 | −0.5 |
| Parameter | Acetone | β-hydroxybutyric Acid | ||
|---|---|---|---|---|
| The linear concentration range (µmol/L) | 250–10,000 | 250–10,000 | ||
| The coefficient of determination (R2) | 0.9997 | 0.9968 | ||
| The calibration line equation | y = 4.7468x + 0 * | y = 0.0945x − 0.1593 ** | ||
| Intra-day precision (%) | 258 µmol/L | 5.2 | 250 µmol/L | 2.7 |
| 1075 µmol/L | 5.9 | 1000 µmol/L | 3.4 | |
| 8600 µmol/L | 2.0 | 9615 µmol/L | 4.0 | |
| Intra-day accuracy (%) | 258 µmol/L | 9.7 | 250 µmol/L | 3.0 |
| 1075 µmol/L | −2.3 | 1000 µmol/L | −3.1 | |
| 8600 µmol/L | 3.1 | 9615 µmol/L | −3.1 | |
| Inter-day precision (%) | 258 µmol/L | 7.0 | 250 µmol/L | 9.7 |
| 1075 µmol/L | 2.7 | 1000 µmol/L | 5.4 | |
| 8600 µmol/L | 2.7 | 9615 µmol/L | 3.2 | |
| Inter-day accuracy (%) | 258 µmol/L | 9.7 | 250 µmol/L | −6.9 |
| 1075 µmol/L | 3.5 | 1000 µmol/L | −10.8 | |
| 8600 µmol/L | 3.8 | 9615 µmol/L | −4.1 | |
| Parameter | Serum | Whole Blood | |
|---|---|---|---|
| The linear concentration range (µg/mL) | 0.25–50 | 0.50–50 | |
| LOD (limit of detection; µg/mL) | 0.10 | 0.10 | |
| LLOQ (lower limit of quantification; µg/mL) | 0.25 | 0.50 | |
| The coefficient of determination (R2) | 0.9998 | 0.9999 | |
| The calibration line equation | y = 0.335x + 0 | y = 0.0484x + 0.0464 | |
| Recovery (%) | 0.5 µg/mL | 93.1 | 90.4 |
| 5.0 µg/mL | 98.3 | 115.0 | |
| 50 µg/mL | 108.3 | 103.3 | |
| Matrix effect (%) | 0.5 µg/mL | 102.4 | 112.8 |
| 5.0 µg/mL | 92.9 | 87.8 | |
| 50 µg/mL | 93.4 | 86.2 | |
| Process efficiency (%) | 0.5 µg/mL | 95.3 | 102.0 |
| 5.0 µg/mL | 91.3 | 100.9 | |
| 50 µg/mL | 101.2 | 89.1 | |
| Intra-day precision (%) | 0.5 µg/mL | 5.7 | 2.3 |
| 5.0 µg/mL | 4.1 | 4.2 | |
| 50 µg/mL | 0.8 | 5.2 | |
| Intra-day accuracy (%) | 0.5 µg/mL | −0.3 | 6.6 |
| 5.0 µg/mL | 9.1 | 6.9 | |
| 50 µg/mL | 11.9 | −0.6 | |
| Inter-day precision (%) | 0.5 µg/mL | 3.3 | 6.4 |
| 5.0 µg/mL | 7.0 | 3.8 | |
| 50 µg/mL | 2.9 | 7.4 | |
| Inter-day accuracy (%) | 0.5 µg/mL | −2.4 | 2.6 |
| 5.0 µg/mL | 8.2 | 5.8 | |
| 50 µg/mL | 10.2 | 0.1 | |
| Marker | Group | Descriptive Statistics | ||||||
|---|---|---|---|---|---|---|---|---|
| M | SD | Me | Lower Quartile | Upper Quartile | The Result of the Statistical Test | |||
| Glucose | Concentration in serum (mg/dL) | Study group | 209 | 222 | 151 | 46 | 302 | t(89.82) = 2.51; p < 0.05 |
| Control group | 344 | 303 | 291 | 83 | 579.5 | |||
| Concentration in urine (mg/dL) | Study group | 382 | 846 | 21 | 9 | 226 | t(41.59) = 2.28; p < 0.05 | |
| Control group | 65 | 203 | 13 | 6.5 | 23.5 | |||
| Concentration in vitreous humor (mg/dL) | Study group | 119 | 216 | 9 | 5 | 154 | t(50.45) = 2.98; p < 0.05 | |
| Control group | 23 | 48 | 7 | 4.5 | 14 | |||
| Lactate | Concentration in serum (mg/dL) | Study group | 374 | 115 | 360 | 306 | 461 | t(96) = 0.89; p > 0.05 |
| Control group | 420 | 121 | 437.5 | 348 | 517 | |||
| Concentration in urine (mg/dL) | Study group | 208 | 138 | 208.5 | 72 | 310 | t(91) = 0.19; p > 0.05 | |
| Control group | 207 | 202 | 148.5 | 98 | 253.5 | |||
| Concentration in vitreous humor (mg/dL) | Study group | 359 | 137 | 357 | 282 | 460 | t(96) = 0.15; p > 0.05 | |
| Control group | 314 | 124 | 304 | 221.5 | 409 | |||
| Group | Descriptive Statistics | ||||||
|---|---|---|---|---|---|---|---|
| M | SD | Me | Lower Quartile | Upper Quartile | The Result of the Statistical Test | ||
| Concentration in whole blood | Study group | 1260 | 1602 | 582 | 414 | 1042 | t(90) = 1.29; p > 0.05 |
| Control group | 850 | 1436 | 352 | 297.5 | 936 | ||
| Concentration in urine | Study group | 1970 | 2161 | 1658 | 415 | 2253 | t(35.15) = 2.76; p < 0.01 |
| Control group | 792 | 688 | 670 | 463 | 824 | ||
| Concentration in vitreous humor | Study group | 1752 | 2327 | 868 | 419 | 1590 | t(50.63) = 2.23; p < 0.05 |
| Control group | 826 | 837 | 565 | 275 | 1274 | ||
| Group | Descriptive Statistics | ||||||
|---|---|---|---|---|---|---|---|
| M | SD | Me | Lower Quartile | Upper Quartile | The Result of the Statistical Test | ||
| Concentration in whole blood | Study group | 12.7 | 12.3 | 7.8 | 2.9 | 20.8 | t(98) = 5.61; p < 0.001 |
| Control group | 26.5 | 12.3 | 24.2 | 18.7 | 31.8 | ||
| Concentration in serum | Study group | 18.6 | 17.8 | 12.4 | 5.9 | 26.7 | t(80.92) = 8.78; p < 0.001 |
| Control group | 45.4 | 11.7 | 44.2 | 33.8 | 52.2 | ||
| Concentration in vitreous humor | Study group | 17.5 | 16.9 | 9.1 | 4.7 | 27.3 | t(94) = 7.83; p < 0.001 |
| Control group | 43.3 | 15.4 | 44.5 | 31.6 | 53.3 | ||
| Marker | PMI | |||||
|---|---|---|---|---|---|---|
| Study Group | Control Group | |||||
| Serum | Urine | Vitreous Humor | Serum | Urine | Vitreous Humor | |
| Glucose | −0.18 | 0.002 | 0.18 | 0.06 | 0.01 | 0.14 |
| Lactate | 0.15 | 0.23 | 0.45 | −0.09 | 0.02 | 0.13 |
| 1,5-anhydroglucitol | −0.16 (blood) | −0.05 (serum) | −0.06 | 0.18 (blood) | 0.04 (serum) | 0.29 |
| BHB | −0.27 | −0.31 | −0.44 | 0.15 | 0.21 | 0.01 |
| Glucose | ||||
|---|---|---|---|---|
| Biological Material | Serum | Urine | Vitreous Humor | |
| Serum | Study group | - | 0.25 | 0.39 |
| Control group | - | 0.04 | −0.09 | |
| Urine | Study group | 0.25 | - | 0.61 |
| Control group | 0.04 | - | 0.26 | |
| Vitreous humor | Study group | 0.39 | 0.61 | - |
| Control group | −0.09 | 0.26 | - | |
| Lactate | ||||
|---|---|---|---|---|
| Biological Material | Serum | Urine | Vitreous Humor | |
| Serum | Study group | - | 0.4 | 0.61 |
| Control group | - | −0.07 | 0.54 | |
| Urine | Study group | 0.4 | - | 0.51 |
| Control group | −0.07 | - | 0.04 | |
| Vitreous humor | Study group | 0.61 | 0.51 | - |
| Control group | 0.54 | 0.04 | - | |
| β-hydroxybutyric Acid | ||||
|---|---|---|---|---|
| Biological Material | Blood | Urine | Vitreous Humor | |
| Blood | Study group | - | 0.46 | 0.77 |
| Control group | - | 0.002 | 0.63 | |
| Urine | Study group | 0.46 | - | 0.33 |
| Control group | 0.001 | - | 0.4 | |
| Vitreous humor | Study group | 0.77 | 0.33 | - |
| Control group | 0.63 | 0.41 | - | |
| 1,5-anhydroglucitol | ||||
|---|---|---|---|---|
| Biological Material | Blood | Serum | Vitreous Humor | |
| Blood | Study group | - | 0.77 | 0.66 |
| Control group | - | 0.59 | 0.56 | |
| Serum | Study group | 0.77 | - | 0.7 |
| Control group | 0.59 | - | 0.81 | |
| Vitreous humor | Study group | 0.66 | 0.7 | - |
| Control group | 0.56 | 0.81 | - | |
| Study Group | Control Group | |
|---|---|---|
| Positive Correlation | Serum glucose concentration versus serum lactate concentration, r = 0.31; p < 0.05 Urine glucose concentration versus HbA1c levels, r = 0.48; p < 0.01 VH glucose concentration versus VH lactate levels, r = 0.3; p < 0.05 VH glucose concentration versus HbA1c levels, r = 0.38; p < 0.05 Serum lactate concentration versus HbA1c levels, r = 0.34; p < 0.05 | Serum glucose concentration versus serum lactate concentration, r = 0.31; p < 0.05 Urine glucose concentration versus urine lactate concentration, r = 0.32; p < 0.05 |
| Negative Correlation | VH 1,5-AG concentration versus HbA1c concentration, r = –0.38; p < 0.01 VH glucose concentration versus VH 1,5-AG concentration, r = –0.38; p < 0.01 | VH glucose concentration versus VH 1,5-AG concentration, r = –0.3; p < 0.05 Urine glucose concentration versus VH 1,5-AG concentration, r = –0.31; p < 0.05 Urine lactate concentration versus VH 1,5-AG concentration, r = –0.35; p < 0.05 VH lactate concentration versus VH 1,5-AG concentration, r = –0.31; p < 0.05 Serum 1,5-AG concentration versus urine BHB concentration, r = –0.5; p < 0.05 |
© 2020 by the authors. Licensee MDPI, Basel, Switzerland. This article is an open access article distributed under the terms and conditions of the Creative Commons Attribution (CC BY) license (http://creativecommons.org/licenses/by/4.0/).
Share and Cite
Nowak, K.; Jurek, T.; Zawadzki, M. Postmortem Determination of Short-Term Markers of Hyperglycemia for the Purposes of Medicolegal Opinions. Diagnostics 2020, 10, 236. https://doi.org/10.3390/diagnostics10040236
Nowak K, Jurek T, Zawadzki M. Postmortem Determination of Short-Term Markers of Hyperglycemia for the Purposes of Medicolegal Opinions. Diagnostics. 2020; 10(4):236. https://doi.org/10.3390/diagnostics10040236
Chicago/Turabian StyleNowak, Karolina, Tomasz Jurek, and Marcin Zawadzki. 2020. "Postmortem Determination of Short-Term Markers of Hyperglycemia for the Purposes of Medicolegal Opinions" Diagnostics 10, no. 4: 236. https://doi.org/10.3390/diagnostics10040236
APA StyleNowak, K., Jurek, T., & Zawadzki, M. (2020). Postmortem Determination of Short-Term Markers of Hyperglycemia for the Purposes of Medicolegal Opinions. Diagnostics, 10(4), 236. https://doi.org/10.3390/diagnostics10040236