Simultaneous Measurement of Gastric Emptying of a Soup Test Meal Using MRI and Gamma Scintigraphy

 , ,
, , 
Abstract
1. Introduction
2. Materials and Methods
2.1. Subjects
2.2. Test Meal
2.3. Study Design
2.4. MRI Protocol and Data Analysis
2.5. GS Protocol and Data Analysis
2.6. Statistical Analysis
3. Results
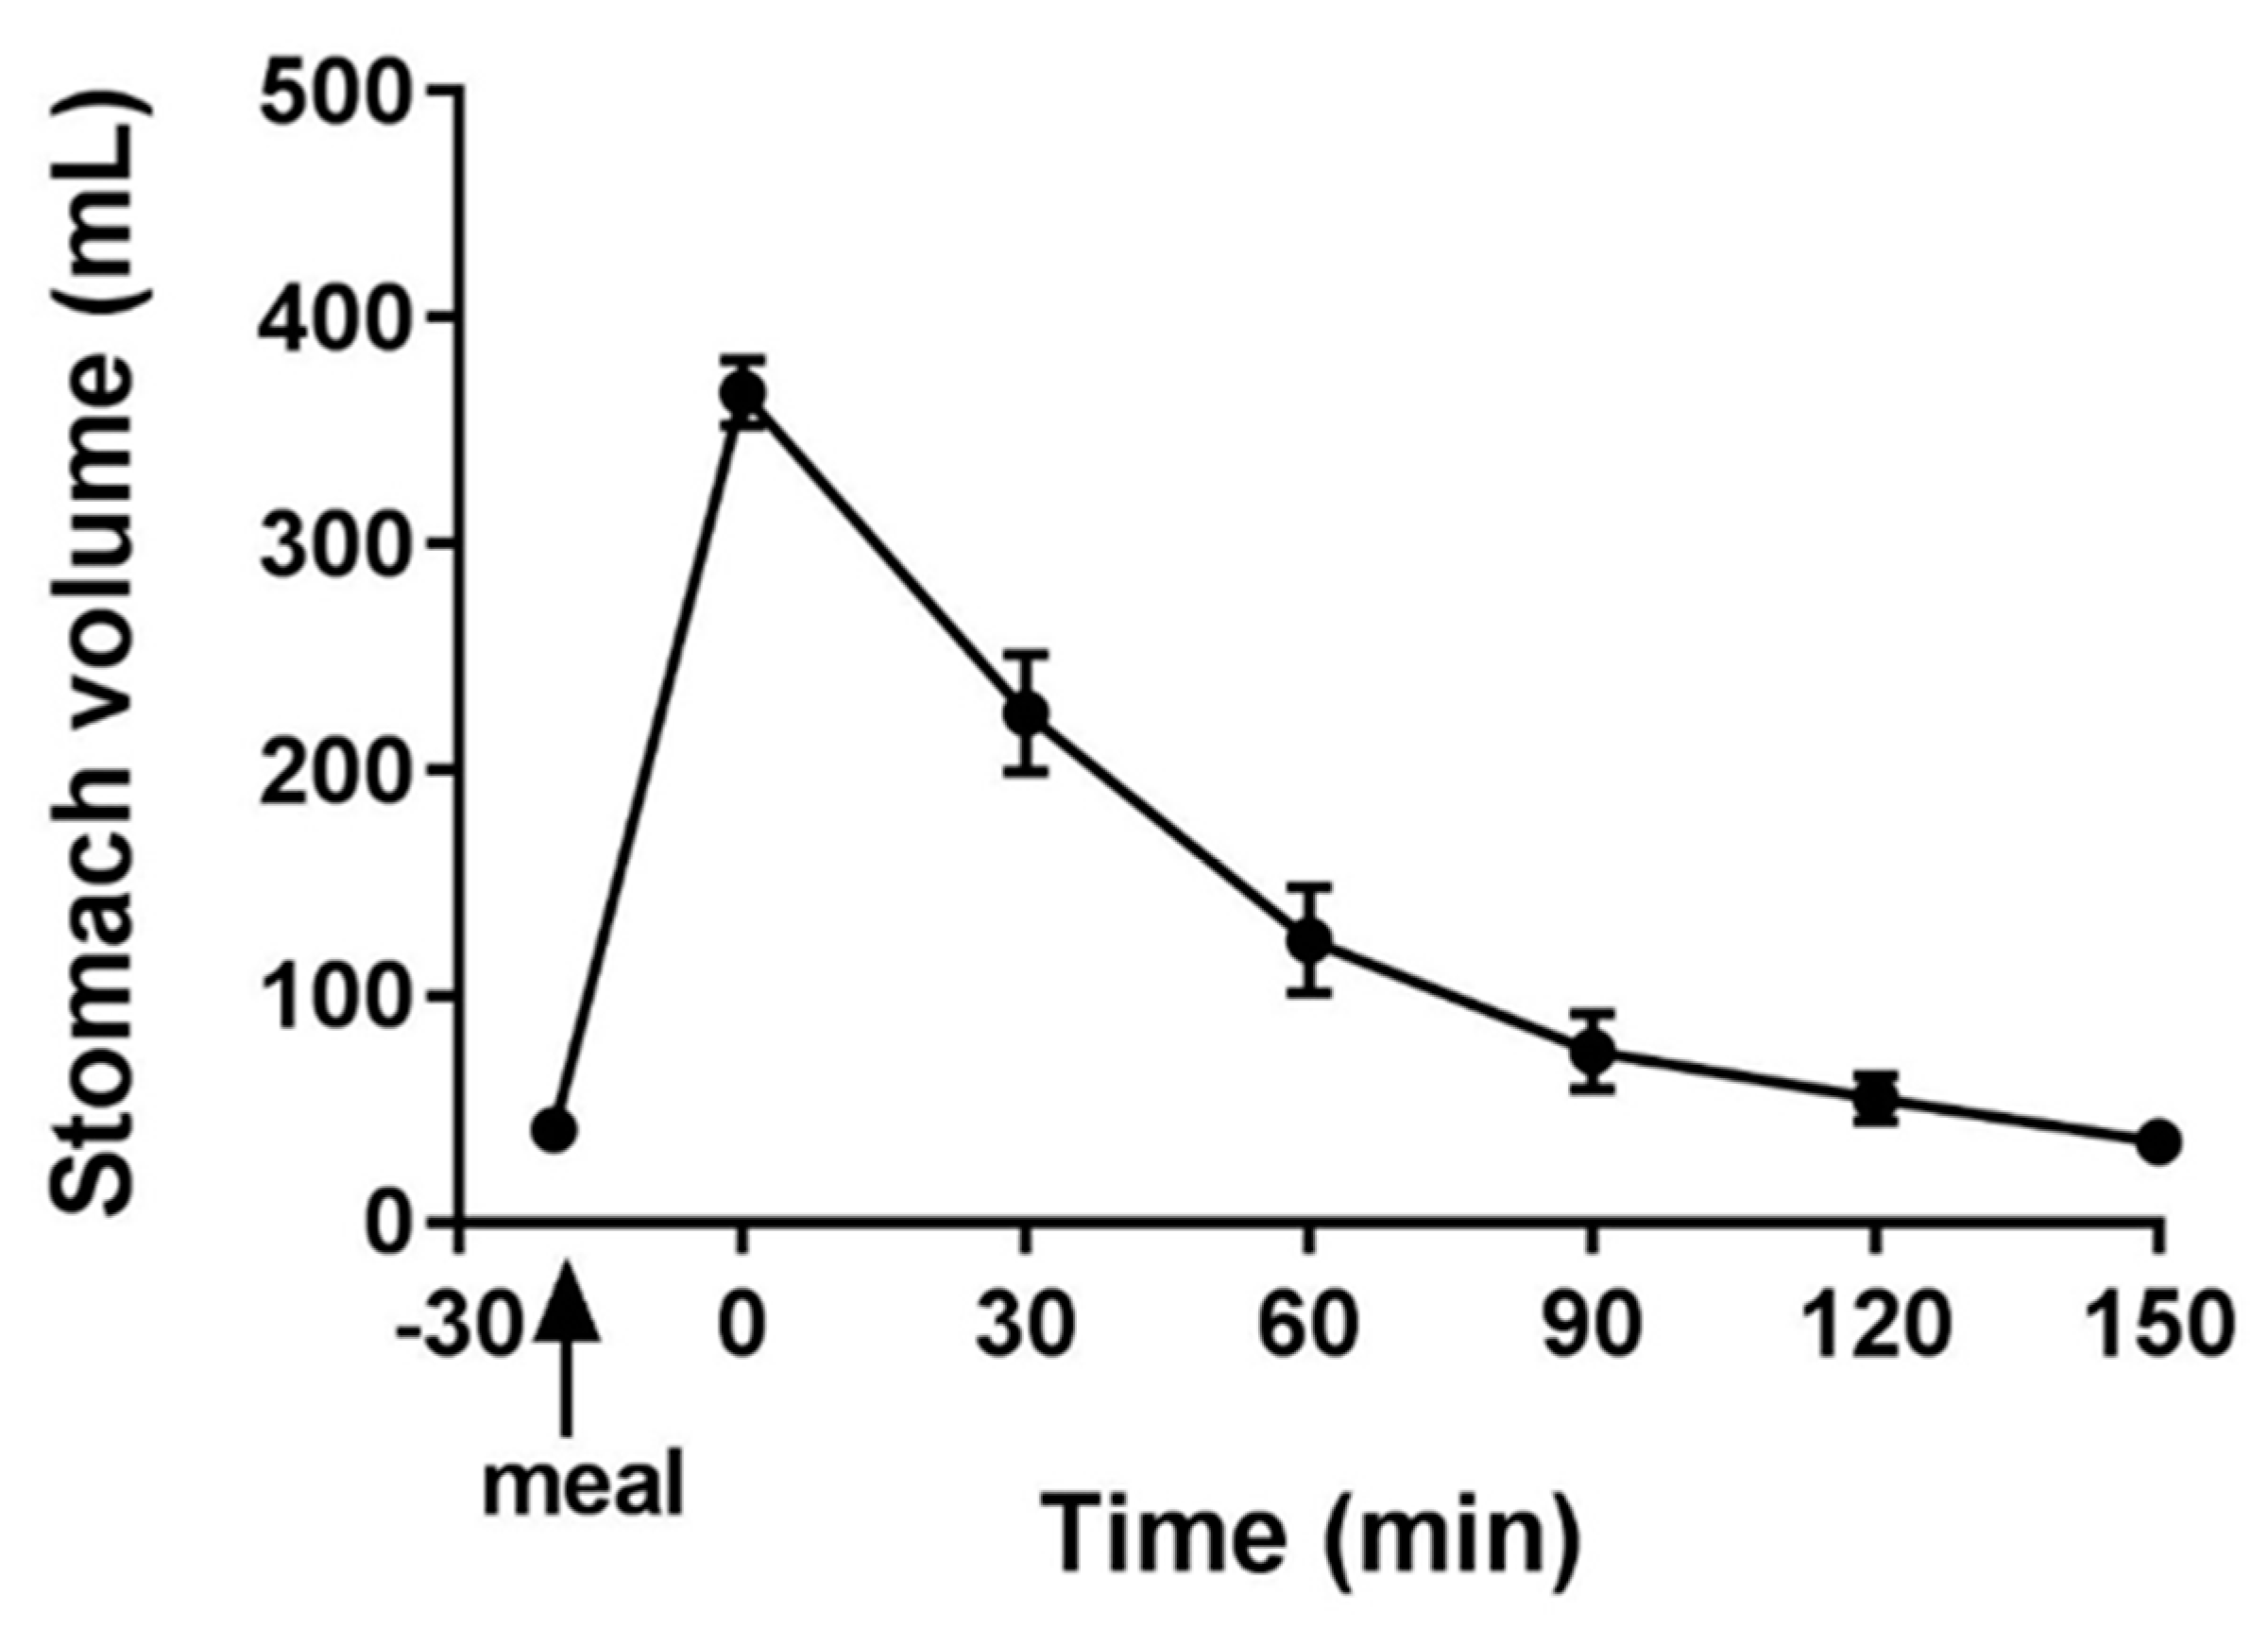
3.1. MRI
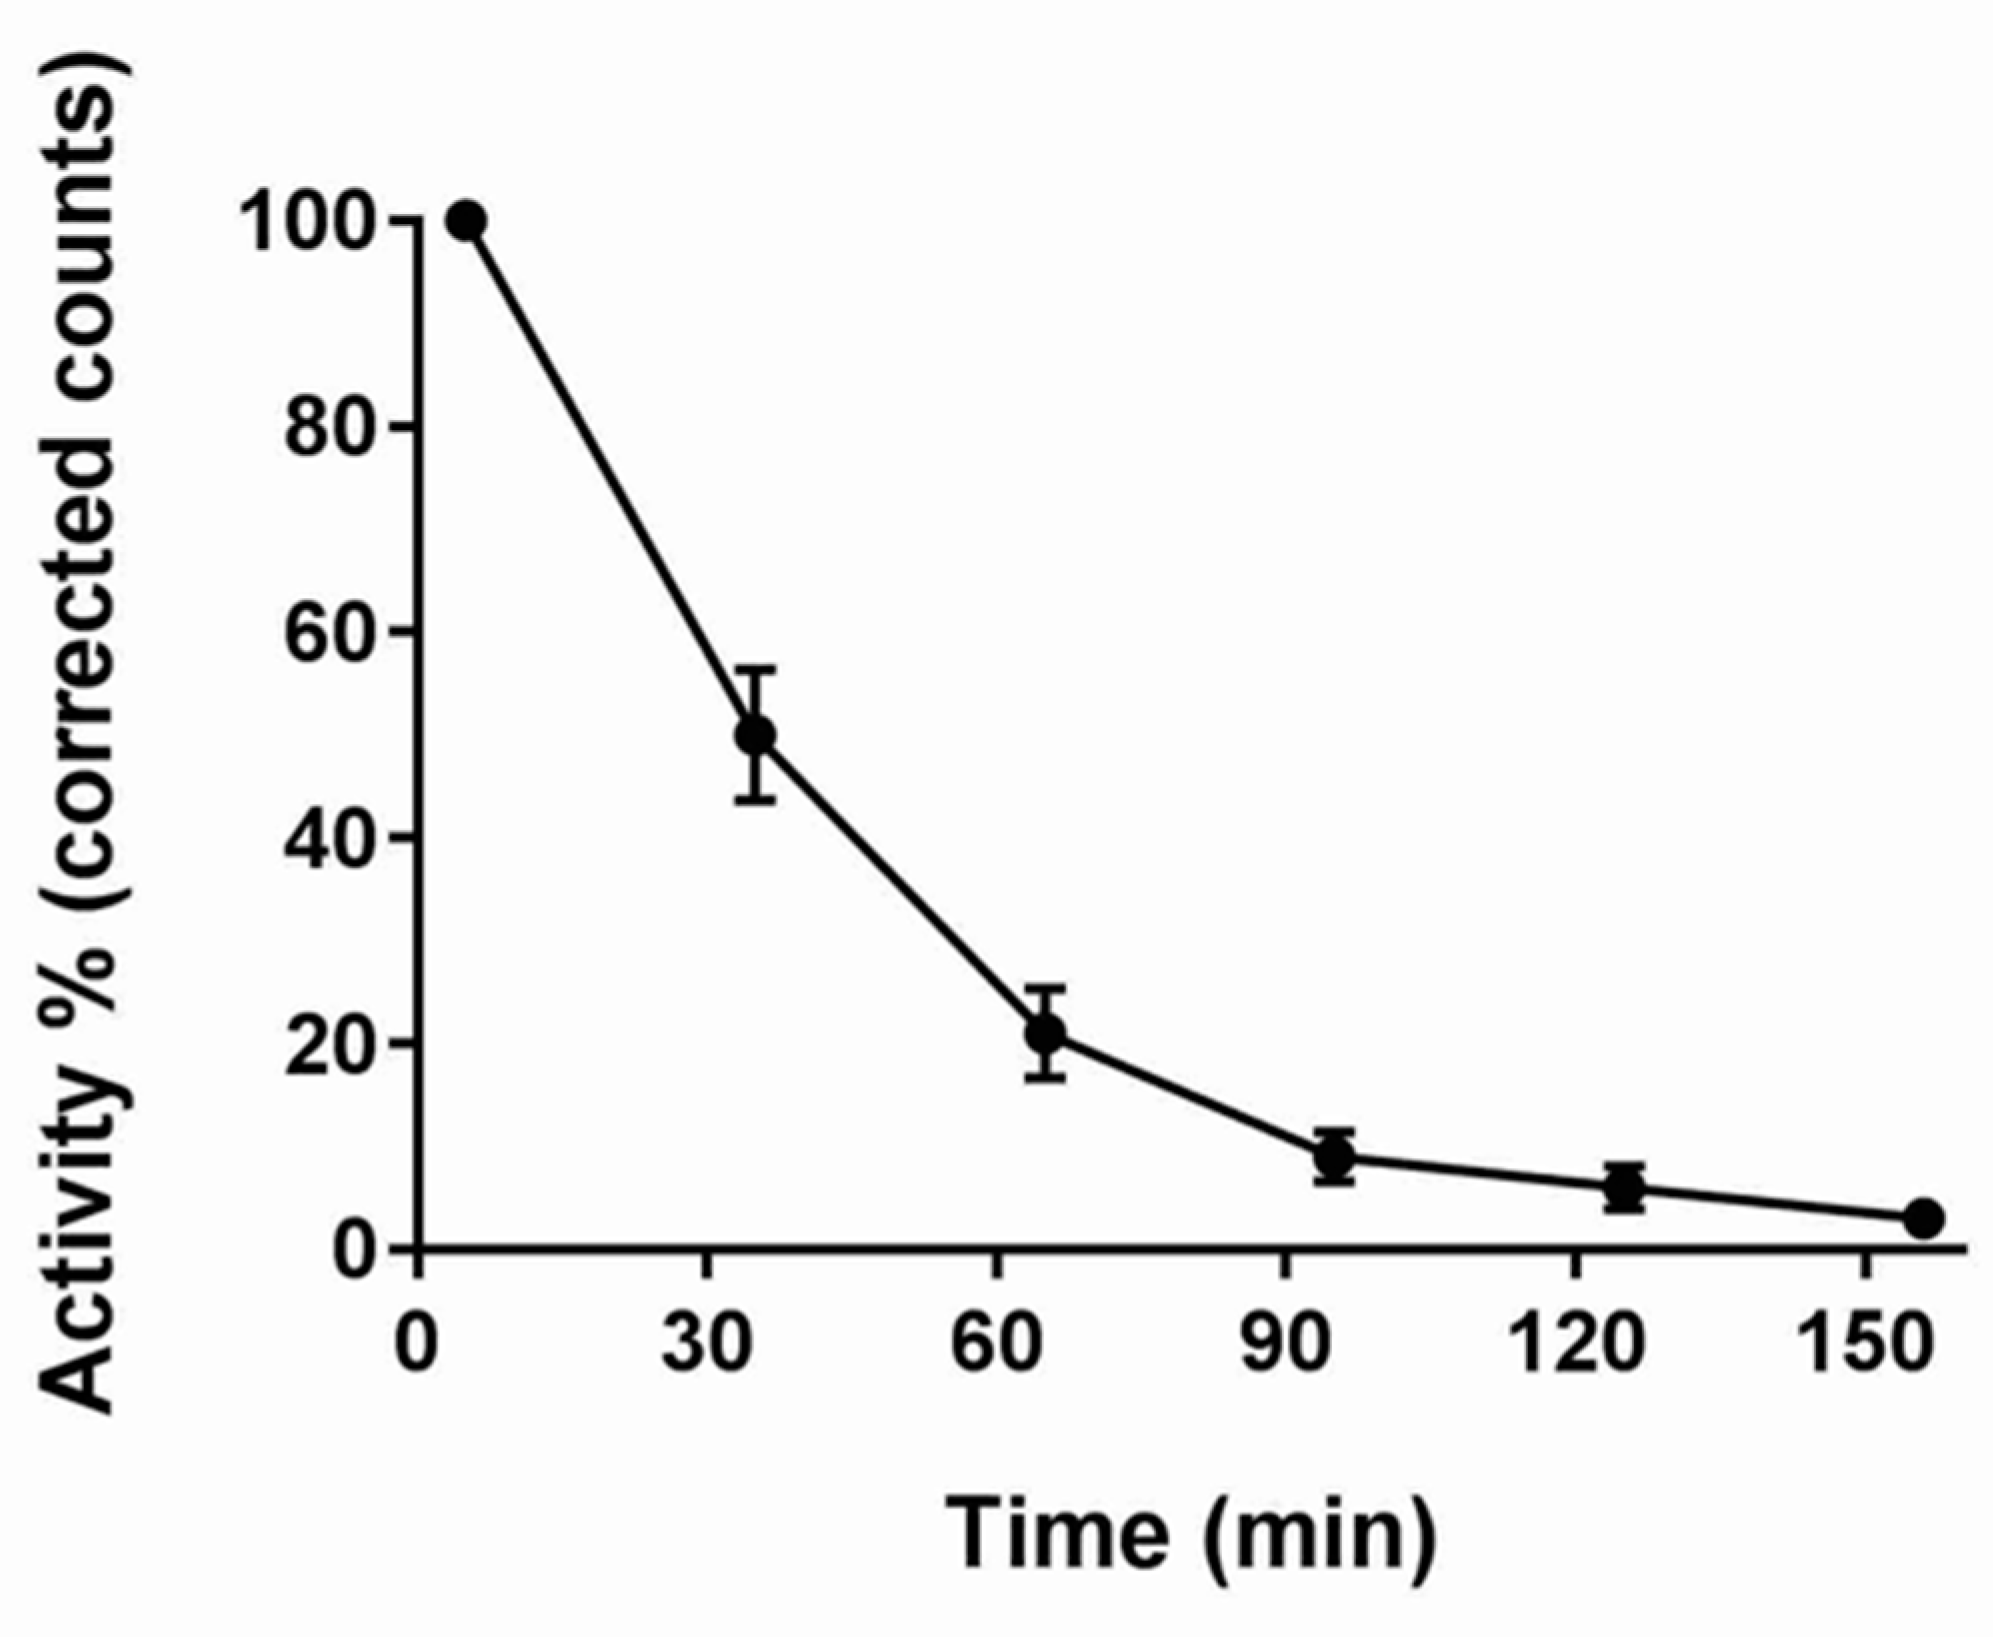
3.2. GS
3.3. Correlation of MRI and GS
4. Discussion
5. Conclusions
Author Contributions
Funding
Acknowledgments
Conflicts of Interest
References
- Camilleri, M.; Parkman, H.P.; Shafi, M.A.; Abell, T.L.; Gerson, L. Clinical guideline: Management of gastroparesis. Am. J. Gastroenterol. 2013, 108, 18–37. [Google Scholar] [CrossRef] [PubMed]
- Scott, A.M.; Kellow, J.E.; Shuter, B.; Cowan, H.; Corbett, A.M.; Riley, J.W.; Lunzer, M.R.; Eckstein, R.P.; Hoschl, R.; Lam, S.K.; et al. Intragastric distribution and gastric emptying of solids and liquids in functional dyspepsia: Lack of influence of symptom subgroups and h-pylori associated gastritis. Dig. Dis. Sci. 1993, 38, 2247–2254. [Google Scholar] [CrossRef] [PubMed]
- Tack, J.; Arts, J.; Caenepeel, P.; De Wulf, D.; Bisschops, R. Pathophysiology, diagnosis and management of postoperative dumping syndrome. Nat. Rev. Gastroenterol. Hepatolog. 2009, 6, 583–590. [Google Scholar] [CrossRef] [PubMed]
- George, J.D. New clinical method for measuring the rate of gastric emptying: The double sampling test meal. Gut 1968, 9, 237–242. [Google Scholar] [CrossRef]
- Medhus, A.W.; Sandstad, O.; Bredesen, J.; Husebye, E. Delay of gastric emptying by duodenal intubation: Sensitive measurement of gastric emptying by the paracetamol absorption test. Aliment. Pharmacol. Ther. 1999, 13, 609–620. [Google Scholar] [CrossRef]
- Ghoos, Y.F.; Maes, B.D.; Geypens, B.J.; Mys, G.; Hiele, M.I.; Rutgeerts, P.J.; Vantrappen, G. Measurement of gastriuc emptyign rate of solids by means of a carbon labeled octanoic acid test. Gastroenterology 1993, 104, 1640–1647. [Google Scholar] [CrossRef]
- Bateman, D.N.; Whittingham, T.A. Measurement of gastric emptying by real time ultrasound. Gut 1982, 23, 524–527. [Google Scholar] [CrossRef]
- Hardy, J.G.; Perkins, A.C. Validity of the geometric mean correction in the quantification of whole bowel transit. Nucl. Med. Commun. 1985, 6, 217–224. [Google Scholar] [CrossRef]
- Abell, T.L.; Camilleri, M.; Donohoe, K.; Hasler, W.L.; Lin, H.C.; Maurer, A.H.; McCallum, R.W.; Nowak, T.; Nusynowitz, M.L.; Parkman, H.P.; et al. Consensus Recommendations for Gastric Emptying Scintigraphy: A Joint Report of the American Neurogastroenterology and Motility Society and the Society of Nuclear Medicine. Am. J. Gastroenterol. 2008, 103, 753–763. [Google Scholar] [CrossRef]
- Schwizer, W.; Maecke, H.; Fried, M. Measurement of Gastric-Emptying by Magnetic-Resonance-Imaging in Humans. Gastroenterology 1992, 103, 369–376. [Google Scholar] [CrossRef]
- Fidler, J.; Bharucha, A.E.; Camilleri, M.; Camp, J.; Burton, D.; Grimm, R.; Riederer, S.J.; Robb, R.A.; Zinsmeister, A.R. Application of magnetic resonance imaging to measure fasting and postprandial volumes in humans. Neurogastroenterol. Motil. 2009, 21, 42–51. [Google Scholar] [CrossRef] [PubMed]
- Goetze, O.; Steingoetter, A.; Menne, D.; van der Voort, I.R.; Kwiatek, M.A.; Boesiger, P.; Weishaupt, D.; Thumshirn, M.; Fried, M.; Schwizer, W. The effect of macronutrients on gastric volume responses and gastric emptying in humans: A magnetic resonance imaging study. Am. J. Physiol. Gastrointes. Liver Physiol. 2007, 292, G11–G17. [Google Scholar] [CrossRef] [PubMed]
- Marciani, L. Assessment of gastrointestinal motor functions by MRI: A comprehensive review. Neurogastroenterol. Motil. 2011, 23, 399–407. [Google Scholar] [CrossRef] [PubMed]
- Feinle, C.; Kunz, P.; Boesiger, P.; Fried, M.; Schwizer, W. Scintigraphic validation of a magnetic resonance imaging method to study gastric emptying of a solid meal in humans. Gut 1999, 44, 106–111. [Google Scholar] [CrossRef]
- Hoad, C.L.; Parker, H.; Hudders, N.; Costigan, C.; Cox, E.F.; Perkins, A.C.; Blackshaw, P.E.; Marciani, L.; Spiller, R.C.; Fox, M.R.; et al. Measurement of gastric meal and secretion volumes using magnetic resonance imaging. Phys. Med. Biol. 2015, 60, 1367–1383. [Google Scholar] [CrossRef]
- Parker, H.L.; Tucker, E.; Hoad, C.L.; Pal, A.; Costigan, C.; Hudders, N.; Perkins, A.; Blackshaw, E.; Gowland, P.; Marciani, L.; et al. Development and validation of a large, modular test meal with liquid and solid components for assessment of gastric motor and sensory function by non-invasive imaging. Neurogastroenterol. Motil. 2016, 28, 554–568. [Google Scholar] [CrossRef]
- Hayakawa, N.; Nakamoto, Y.; Chen-Yoshikawa, T.F.; Kido, A.; Ishimori, T.; Fujimoto, K.; Yamada, T.; Sato, M.; Aoyama, A.; Date, H.; et al. Gastric motility and emptying assessment by magnetic resonance imaging after lung transplantation: Correlation with gastric emptying scintigraphy. Abdom. Radiol. 2017, 42, 818–824. [Google Scholar] [CrossRef]
- Leslie, F.C.; Thompson, D.G.; McLaughlin, J.T.; Varro, A.; Dockray, G.J.; Mandal, B.K. Plasma cholecystokinin concentrations are elevated in acute upper gastrointestinal infections. QJM 2003, 96, 870–871. [Google Scholar] [CrossRef]
- Moran, G.W.; Leslie, F.C.; McLaughlin, J.T. Crohn’s disease affecting the small bowel is associated with reduced appetite and elevated levels of circulating gut peptides. Clin. Nutr. 2013, 32, 404–411. [Google Scholar] [CrossRef]
- Khalaf, A.; Hoad, C.L.; Menys, A.; Nowak, A.; Taylor, S.A.; Paparo, S.; Lingaya, M.; Falcone, Y.; Singh, G.; Spiller, R.C.; et al. MRI assessment of the postprandial gastrointestinal motility and peptide response in healthy humans. Neurogastroenterol. Motil. 2017, 30, e13182. [Google Scholar] [CrossRef]
- Keller, J.; Binnewies, U.; Rosch, M.; Holst, J.J.; Beglinger, C.; Andresen, V.; Layer, P. Gastric emptying and disease activity in inflammatory bowel disease. Eur. J. Clin. Invest. 2015, 45, 1234–1242. [Google Scholar] [CrossRef] [PubMed]
- Parkman, H.P.; Hasler, W.L.; Fisher, R.S. American Gastroenterological Association technical review on the diagnosis and treatment of gastroparesis. Gastroenterology 2004, 127, 1592–1622. [Google Scholar] [CrossRef] [PubMed]
- Tseng, A.S.; Crowell, M.D.; DiBaise, J.K. Clinical utility of gastric emptying scintigraphy: Patient and physician perspectives. Neurogastroenterol. Motil. 2018, 30, e13279. [Google Scholar] [CrossRef] [PubMed]
- Holt, S.; Cervantes, J.; Wilkinson, A.A.; Wallace, J.H.K. Measurement of Gastric-Emptying Rate in Humans by Real-Time Ultrasound. Gastroenterology 1986, 90, 918–923. [Google Scholar] [CrossRef]
- Read, N.W.; Al Janabi, M.N.; Bates, T.E.; Barber, D.C. Effect of gastrointestinal intubation on the passage of a solid meal through the stomach and small intestine in humans. Gastroenterology 1983, 84, 1568–1572. [Google Scholar] [CrossRef]
- Marciani, L.; Pritchard, S.E.; Hellier-Woods, C.; Costigan, C.; Hoad, C.L.; Gowland, P.A.; Spiller, R.C. Delayed gastric emptying and reduced postprandial small bowel water content of equicaloric whole meal bread versus rice meals in healthy subjects: Novel MRI insights. Eur. J. Clin. Nutr. 2013, 67, 754–758. [Google Scholar] [CrossRef]
- Murray, K.E.; Placidi, E.; Schuring, E.A.H.; Hoad, C.L.; Koppenol, W.; Arnaudov, L.N.; Blom, W.A.M.; Pritchard, S.E.; Stoyanov, S.D.; Gowland, P.A.; et al. Aerated drinks increase gastric volume and reduce appetite as assessed by MRI: A randomized, balanced, crossover trial. Am. J. Clin. Nutr. 2015, 101, 270–278. [Google Scholar] [CrossRef]


© 2020 by the authors. Licensee MDPI, Basel, Switzerland. This article is an open access article distributed under the terms and conditions of the Creative Commons Attribution (CC BY) license (http://creativecommons.org/licenses/by/4.0/).
Share and Cite
Khalaf, A.; Hoad, C.L.; Blackshaw, E.; Alyami, J.; Spiller, R.C.; Gowland, P.A.; Vinayaka-Moorthy, V.; Perkins, A.C.; Moran, G.W.; Marciani, L. Simultaneous Measurement of Gastric Emptying of a Soup Test Meal Using MRI and Gamma Scintigraphy. Diagnostics 2020, 10, 170. https://doi.org/10.3390/diagnostics10030170
Khalaf A, Hoad CL, Blackshaw E, Alyami J, Spiller RC, Gowland PA, Vinayaka-Moorthy V, Perkins AC, Moran GW, Marciani L. Simultaneous Measurement of Gastric Emptying of a Soup Test Meal Using MRI and Gamma Scintigraphy. Diagnostics. 2020; 10(3):170. https://doi.org/10.3390/diagnostics10030170
Chicago/Turabian StyleKhalaf, Asseel, Caroline L. Hoad, Elaine Blackshaw, Jaber Alyami, Robin C. Spiller, Penny A. Gowland, Vidhiya Vinayaka-Moorthy, Alan C. Perkins, Gordon W. Moran, and Luca Marciani. 2020. "Simultaneous Measurement of Gastric Emptying of a Soup Test Meal Using MRI and Gamma Scintigraphy" Diagnostics 10, no. 3: 170. https://doi.org/10.3390/diagnostics10030170
APA StyleKhalaf, A., Hoad, C. L., Blackshaw, E., Alyami, J., Spiller, R. C., Gowland, P. A., Vinayaka-Moorthy, V., Perkins, A. C., Moran, G. W., & Marciani, L. (2020). Simultaneous Measurement of Gastric Emptying of a Soup Test Meal Using MRI and Gamma Scintigraphy. Diagnostics, 10(3), 170. https://doi.org/10.3390/diagnostics10030170