A Light-Sheet-Based Imaging Spectrometer to Characterize Acridine Orange Fluorescence within Leukocytes

 and
and 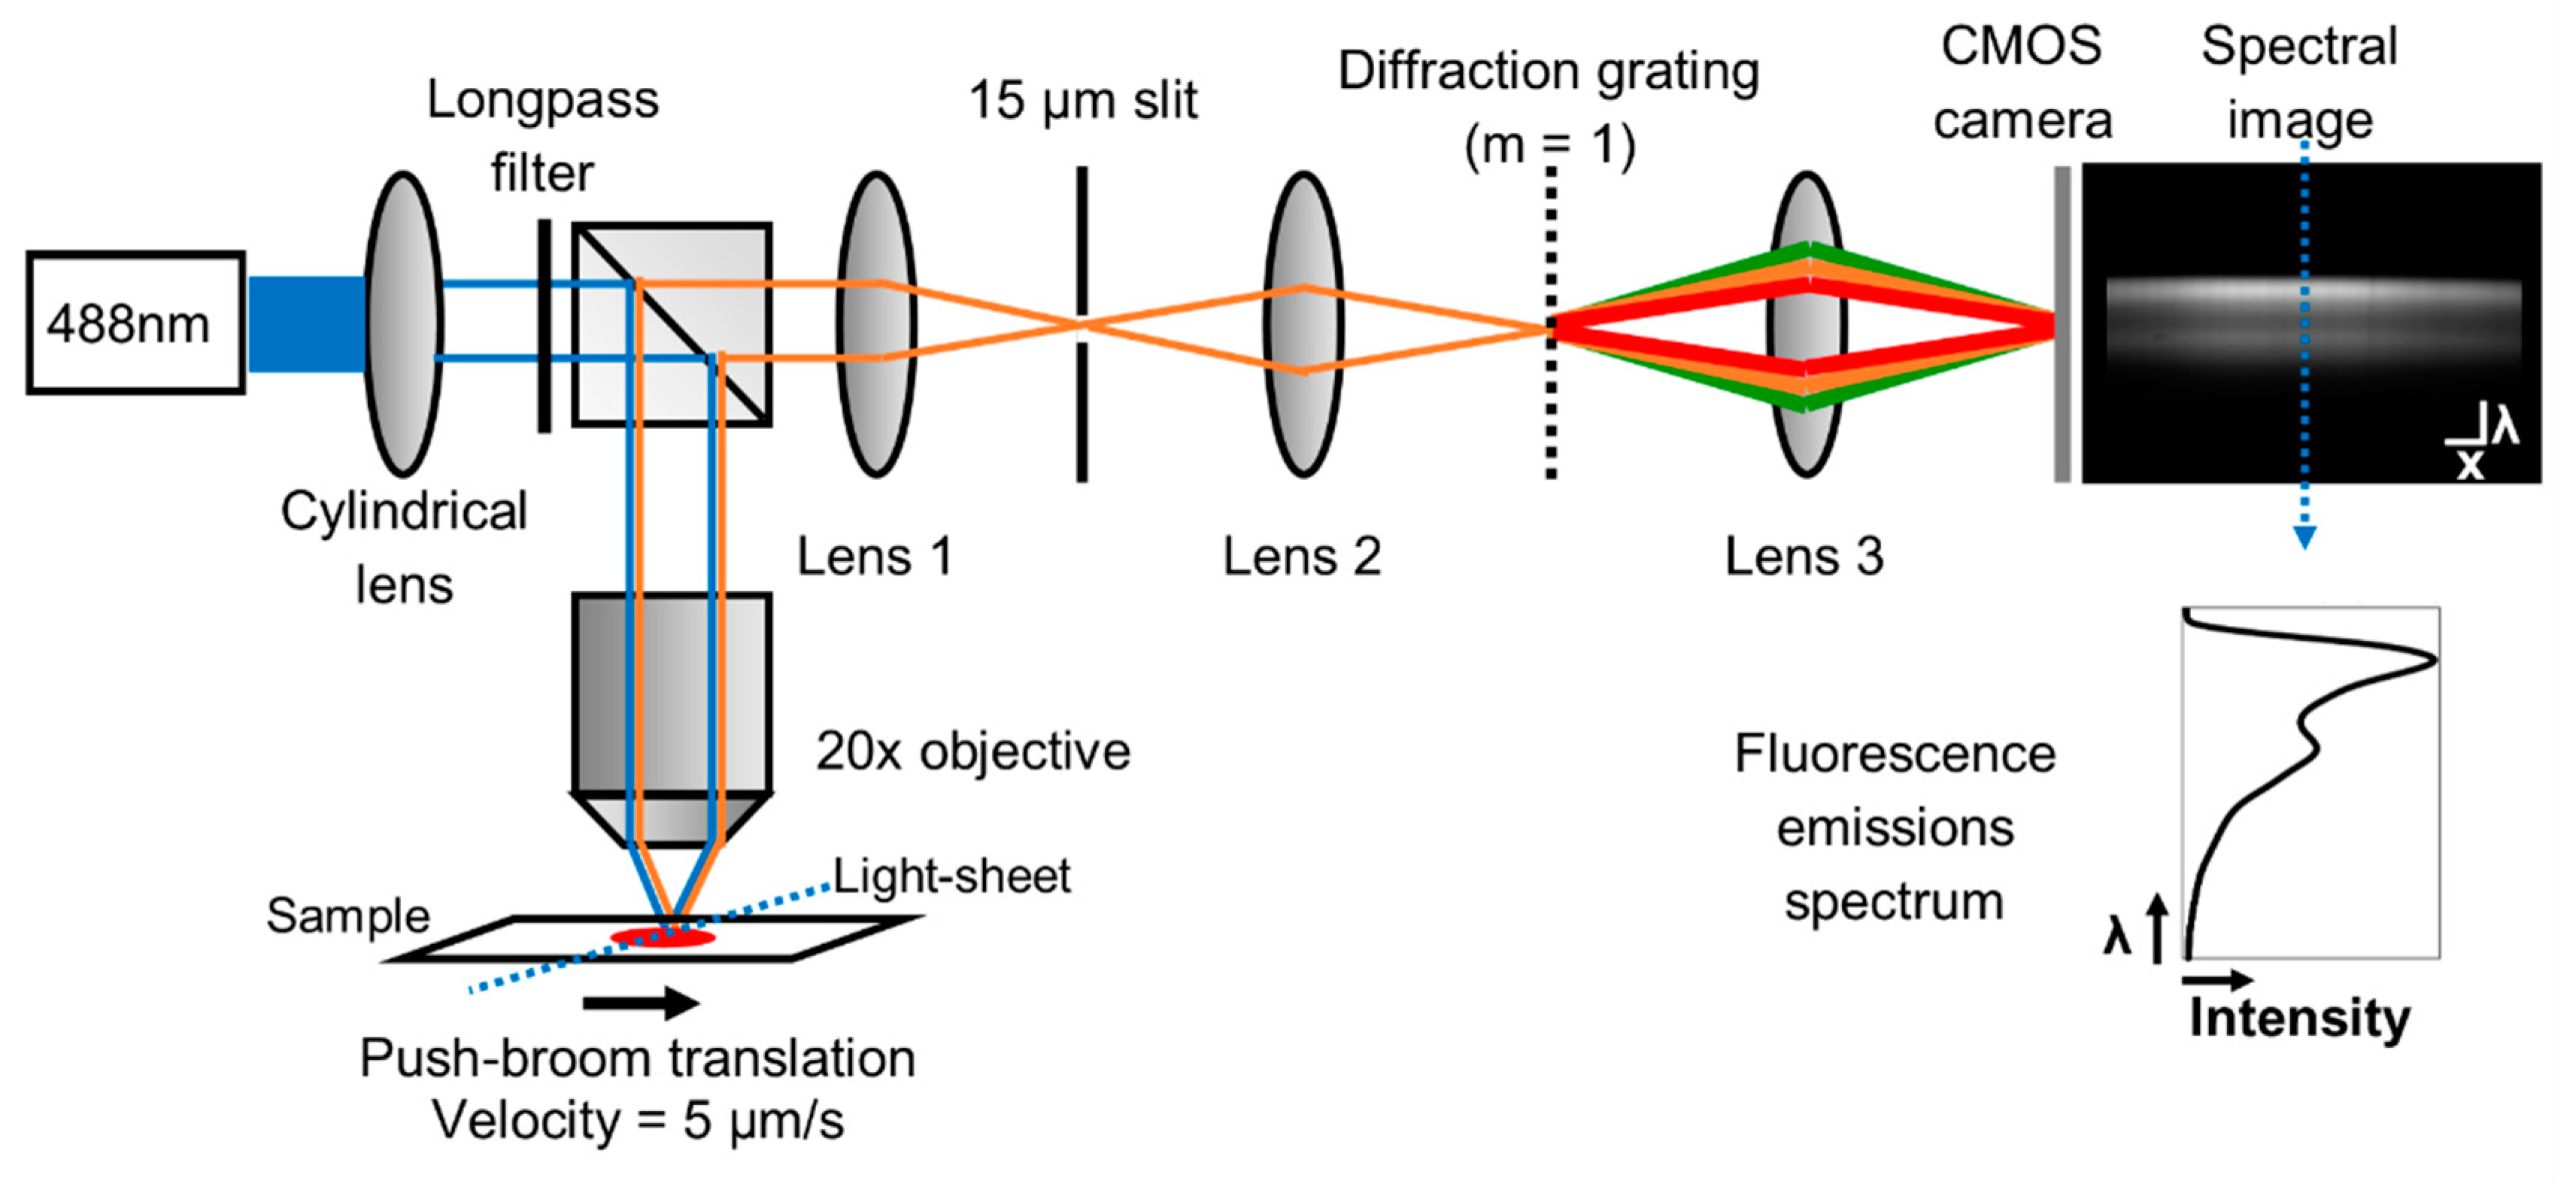
Abstract
1. Introduction
2. Materials and Methods
2.1. Light-Sheet Based Imaging Spectrometer Fluorescence Platform
2.2. Linear Translation of the Sample
2.3. System Validation and Calibration
2.4. Alignment of the Illumination Pattern in each Spectral Image
2.5. Characterization of Acridine Orange Fluorescence
2.6. Blood Collection and Staining of Whole Blood
2.7. Automated Spectral Extraction Algorithm
2.8. Image Processing
2.9. Quality Image Control
2.10. Spectral Extraction
3. Results
4. Discussion
5. Conclusions
Author Contributions
Funding
Acknowledgments
Conflicts of Interest
References
- Buttarello, M.; Plebani, M. Automated blood cell counts: State of the art. Am. J. Clin. Pathol. 2008, 130, 104–116. [Google Scholar] [CrossRef] [PubMed]
- Vercruysse, D.; Dusa, A.; Stahl, R.; Vanmeerbeeck, G.; de Wijs, K.; Liu, C.; Prodanov, D.; Peumans, P.; Lagae, L. Three-part differential of unlabeled leukocytes with a compact lens-free imaging flow cytometer. Lab Chip 2015, 15, 1123–1132. [Google Scholar] [CrossRef] [PubMed]
- Shi, W.; Guo, L.; Kasdan, H.; Tai, Y.-C. Four-part leukocyte differential count based on sheathless microflow cytometer and fluorescent dye assay. Lab Chip 2013, 13, 1257–1265. [Google Scholar] [CrossRef] [PubMed]
- Houwen, B. The differential cell count. Lab. Hematol. 2001, 7, 89–100. [Google Scholar]
- Heikali, D.; Di Carlo, D. A Niche for Microfluidics in Portable Hematology Analyzers. J. Assoc. Lab. Autom. 2010, 15, 319–328. [Google Scholar] [CrossRef]
- Pham, H.V.; Bhaduri, B.; Tangella, K.; Best-Popescu, C.; Popescu, G. Real time blood testing using quantitative phase imaging. PLoS ONE 2013, 8, e55676. [Google Scholar] [CrossRef]
- Majors, C.E.; Pawlowski, M.; Tkaczyk, T.; Richards-Kortum, R. Imaging based system for performing a white blood cell count and partial differential at the point of care. In Proceedings of the Clinical and Translational Biophotonics; Optical Society of America: Washington, DC, USA, 2016; p. TTu2B.3. [Google Scholar]
- Lichtman, M.A.; Kaushansky, K.; Prchal, J.T.; Levi, M.M.; Burns, L.J.; Armitage, J. Williams Manual of Hematology; McGraw Hill Professional: New York, NY, USA, 2017. [Google Scholar]
- Roy, M.; Jin, G.; Seo, D.; Nam, M.-H.; Seo, S. A simple and low-cost device performing blood cell counting based on lens-free shadow imaging technique. Sens. Actuators B Chem. 2014, 201, 321–328. [Google Scholar] [CrossRef]
- Zheng, S.; Lin, J.C.-H.; Kasdan, H.L.; Tai, Y.-C. Fluorescent labeling, sensing, and differentiation of leukocytes from undiluted whole blood samples. Sens. Actuators B Chem. 2008, 132, 558–567. [Google Scholar] [CrossRef]
- Nguyen, J.; Wei, Y.; Zheng, Y.; Wang, C.; Sun, Y. On-chip sample preparation for complete blood count from raw blood. Lab Chip 2015, 15, 1533–1544. [Google Scholar] [CrossRef]
- Briggs, C.; Kimber, S.; Green, L. Where are we at with point-of-care testing in haematology? Br. J. Haematol. 2012, 158, 679–690. [Google Scholar] [CrossRef]
- van Berkel, C.; Gwyer, J.D.; Deane, S.; Green, N.; Holloway, J.; Hollis, V.; Morgan, H. Integrated systems for rapid point of care (PoC) blood cell analysis. Lab Chip 2011, 11, 1249–1255. [Google Scholar] [CrossRef] [PubMed]
- Forcucci, A.; Pawlowski, M.E.; Crannell, Z.; Pavlova, I.; Richards-Kortum, R.; Tkaczyk, T.S. All-plastic miniature fluorescence microscope for point-of-care readout of bead-based bioassays. J. Biomed. Opt. 2015, 20, 105010. [Google Scholar] [CrossRef] [PubMed]
- Wu, G.; Zaman, M.H. Low-cost tools for diagnosing and monitoring HIV infection in low-resource settings. Bull. World Health Organ. 2012, 90, 914–920. [Google Scholar] [CrossRef] [PubMed]
- Gao, T.; Smith, Z.J.; Lin, T.-Y.; Carrade Holt, D.; Lane, S.M.; Matthews, D.L.; Dwyre, D.M.; Hood, J.; Wachsmann-Hogiu, S. Smart and fast blood counting of trace volumes of body fluids from various mammalian species using a compact, custom-built microscope cytometer. Anal. Chem. 2015, 87, 11854–11862. [Google Scholar] [CrossRef] [PubMed]
- Smith, Z.J.; Gao, T.; Chu, K.; Lane, S.M.; Matthews, D.L.; Dwyre, D.M.; Hood, J.; Tatsukawa, K.; Heifetz, L.; Wachsmann-Hogiu, S. Single-step preparation and image-based counting of minute volumes of human blood. Lab Chip 2014, 14, 3029–3036. [Google Scholar] [CrossRef] [PubMed]
- Majeed, H.; Kandel, M.E.; Bhaduri, B.; Han, K.; Luo, Z.; Tangella, K.; Popescu, G. High throughput imaging of blood smears using white light diffraction phase microscopy. In Proceedings of the Quantitative Phase Imaging; International Society for Optics and Photonics: Bellingham, WA, USA, 2015; p. 93361Y. [Google Scholar]
- Forcucci, A.; Pawlowski, M.E.; Majors, C.; Richards-Kortum, R.; Tkaczyk, T.S. All-plastic, miniature, digital fluorescence microscope for three part white blood cell differential measurements at the point of care. Biomed. Opt. Express 2015, 6, 4433–4446. [Google Scholar] [CrossRef]
- Betts, J.G. Anatomy & Physiology; Open Stax College, Rice University: Houston, TX, USA, 2013. [Google Scholar]
- Sanderson, M.J.; Smith, I.; Parker, I.; Bootman, M.D. Fluorescence microscopy. Cold Spring Harb. Protoc. 2014, 2014, pdb.top071795. [Google Scholar] [CrossRef]
- Jahanmehr, S.; Hyde, K.; Geary, C.; Cinkotai, K.; Maciver, J. Simple technique for fluorescence staining of blood cells with acridine orange. J. Clin. Pathol. 1987, 40, 926. [Google Scholar] [CrossRef]
- Evenson, D.P. The Sperm Chromatin Structure Assay (SCSA®) and other sperm DNA fragmentation tests for evaluation of sperm nuclear DNA integrity as related to fertility. Anim. Reprod. Sci. 2016, 169, 56–75. [Google Scholar] [CrossRef]
- Nadrigny, F.; Li, D.; Kemnitz, K.; Ropert, N.; Koulakoff, A.; Rudolph, S.; Vitali, M.; Giaume, C.; Kirchhoff, F.; Oheim, M. Systematic colocalization errors between acridine orange and EGFP in astrocyte vesicular organelles. Biophys. J. 2007, 93, 969–980. [Google Scholar] [CrossRef]
- Thomé, M.P.; Filippi-Chiela, E.C.; Villodre, E.S.; Migliavaca, C.B.; Onzi, G.R.; Felipe, K.B.; Lenz, G. Ratiometric analysis of Acridine Orange staining in the study of acidic organelles and autophagy. J. Cell Sci. 2016, 129, 4622–4632. [Google Scholar] [CrossRef] [PubMed]
- Millot, C.; Millot, J.-M.; Morjani, H.; Desplaces, A.; Manfait, M. Characterization of acidic vesicles in multidrug-resistant and sensitive cancer cells by acridine orange staining and confocal microspectrofluorometry. J. Histochem. Cytochem. 1997, 45, 1255–1264. [Google Scholar] [CrossRef] [PubMed]
- Traganos, F.; Darzynkiewicz, Z. Chapter 12 Lysosomal Proton Pump Activity: Supravital Cell Staining with Acridine Orange Differentiates Leukocyte Subpopulations. In Methods in Cell Biology; Darzynkiewicz, Z., Paul Robinson, J., Crissman, H.A., Eds.; Academic Press: Cambridge, MA, USA, 1994; Volume 41, pp. 185–194. [Google Scholar]
- Traganos, F.; Darzynkiewicz, Z.; Sharpless, T.; Melamed, M. Simultaneous staining of ribonucleic and deoxyribonucleic acids in unfixed cells using acridine orange in a flow cytofluorometric system. J. Histochem. Cytochem. 1977, 25, 46–56. [Google Scholar] [CrossRef] [PubMed]
- Powless, A.J.; Conley, R.J.; Freeman, K.A.; Muldoon, T.J. Considerations for point-of-care diagnostics: Evaluation of acridine orange staining and postprocessing methods for a three-part leukocyte differential test. J. Biomed. Opt. 2017, 22, 035001. [Google Scholar] [CrossRef]
- Majors, C.E.; Pawlowski, M.E.; Tkaczyk, T.; Richards-Kortum, R.R. Low-cost disposable cartridge for performing a white blood cell count and partial differential at the point-of-care. In Proceedings of the 2014 IEEE Healthcare Innovation Conference (HIC), Seattle, WA, USA, 8–10 October 2014; pp. 10–13. [Google Scholar]
- Kong, S.; Wijngaards, D.; Wolffenbuttel, R. Infrared micro-spectrometer based on a diffraction grating. Sens. Actuators A Phys. 2001, 92, 88–95. [Google Scholar] [CrossRef]
- Vo-Dinh, T. Biomedical Photonics Handbook: Biomedical Diagnostics; CRC Press: Boca Raton, FL, USA, 2014. [Google Scholar]
- Melamed, M.R.; Darzynkiewicz, Z.; Traganos, F.; Sharpless, T. Cytology automation by flow cytometry. Cancer Res. 1977, 37, 2806–2812. [Google Scholar]
- Robbins, E.; Marcus, P.I. Dynamics of acridine orange-cell interaction: I. Interrelationships of acridine orange particles and cytoplasmic reddening. J. Cell Biol. 1963, 18, 237–250. [Google Scholar] [CrossRef]


Publisher’s Note: MDPI stays neutral with regard to jurisdictional claims in published maps and institutional affiliations. |
© 2020 by the authors. Licensee MDPI, Basel, Switzerland. This article is an open access article distributed under the terms and conditions of the Creative Commons Attribution (CC BY) license (http://creativecommons.org/licenses/by/4.0/).
Share and Cite
Powless, A.J.; Prieto, S.P.; Gramling, M.R.; Chen, J.; Muldoon, T.J. A Light-Sheet-Based Imaging Spectrometer to Characterize Acridine Orange Fluorescence within Leukocytes. Diagnostics 2020, 10, 1082. https://doi.org/10.3390/diagnostics10121082
Powless AJ, Prieto SP, Gramling MR, Chen J, Muldoon TJ. A Light-Sheet-Based Imaging Spectrometer to Characterize Acridine Orange Fluorescence within Leukocytes. Diagnostics. 2020; 10(12):1082. https://doi.org/10.3390/diagnostics10121082
Chicago/Turabian StylePowless, Amy J., Sandra P. Prieto, Madison R. Gramling, Jingyi Chen, and Timothy J. Muldoon. 2020. "A Light-Sheet-Based Imaging Spectrometer to Characterize Acridine Orange Fluorescence within Leukocytes" Diagnostics 10, no. 12: 1082. https://doi.org/10.3390/diagnostics10121082
APA StylePowless, A. J., Prieto, S. P., Gramling, M. R., Chen, J., & Muldoon, T. J. (2020). A Light-Sheet-Based Imaging Spectrometer to Characterize Acridine Orange Fluorescence within Leukocytes. Diagnostics, 10(12), 1082. https://doi.org/10.3390/diagnostics10121082