Article

Dynamic Enhancement Pattern on CT for Predicting Pancreatic Neuroendocrine Neoplasms with Low PAX6 Expression: A Retrospective Observational Study

1
Department of Diagnostic Radiology, Graduate School of Medicine, Tokyo Medical and Dental University, 1-5-45 Yushima, Bunkyo-ku, Tokyo 1138510, Japan
2
Department of Hepatobiliary and Pancreatic Surgery, Graduate School of Medicine, Tokyo Medical and Dental University, 1-5-45 Yushima, Bunkyo-ku, Tokyo 1138510, Japan
3
Department of Molecular Oncology, Graduate School of Medicine, Tokyo Medical and Dental University, 1-5-45 Yushima, Bunkyo-ku, Tokyo 1138510, Japan
*
Author to whom correspondence should be addressed.
Diagnostics 2020, 10(11), 919; https://doi.org/10.3390/diagnostics10110919
Submission received: 8 October 2020 / Revised: 5 November 2020 / Accepted: 6 November 2020 / Published: 9 November 2020
(This article belongs to the Special Issue Abdominal Surgical Diseases: Diagnosis, Treatment and Management)

Abstract

:
Paired box 6 (PAX6) is a transcription factor that plays a critical role in tumor suppression, implying that the downregulation of PAX6 promotes tumor growth and invasiveness. This study aimed to examine dynamic computed tomography (CT) features for predicting pancreatic neuroendocrine neoplasms (Pan-NENs) with low PAX6 expression. We retrospectively evaluated 51 patients with Pan-NENs without synchronous liver metastasis to assess the pathological expression of PAX6. Two radiologists analyzed preoperative dynamic CT images to determine morphological features and enhancement patterns. We compared the CT findings between low and high PAX6 expression groups. Pathological analysis identified 11 and 40 patients with low and high PAX6 expression, respectively. Iso- or hypoenhancement types in the arterial and portal phases were significantly associated with low PAX6 expression (p = 0.009; p = 0.001, respectively). Low PAX6 Pan-NENs showed a lower portal enhancement ratio than high PAX6 Pan-NENs (p = 0.044). The combination based on enhancement types (iso- or hypoenhancement during arterial and portal phases) and portal enhancement ratio (≤1.22) had 54.5% sensitivity, 92.5% specificity, and 84.3% accuracy in identifying low PAX6 Pan-NENs. Dynamic CT features, including iso- or hypoenhancement types in the arterial and portal phases and lower portal enhancement ratio may help predict Pan-NENs with low PAX6 expression.

1. Introduction

Pancreatic neuroendocrine neoplasms (Pan-NENs) are a heterogeneous group of epithelial tumors that originate from the neuroendocrine cells of the pancreas [1]. Pan-NENs are rare, with an annual prevalence of only <1 per 100,000 persons. However, their incidence is gradually increasing [1,2]. According to the 2017 World Health Organization (WHO) classification, Pan-NENs are divided into well-differentiated tumors (neuroendocrine tumor [NET]) and poorly differentiated tumors (neuroendocrine carcinoma [NEC]). NET is further subdivided into grades 1 (G1), 2 (G2), and 3(G3) according to the malignant potential determined by Ki-67 proliferative index and/or mitotic count [3]. All Pan-NENs have malignant potential, and the five-year survival rate is <43% [4]. Aggressive cases show extrapancreatic invasion and metastases with poor prognosis. Notably, the liver is the most common site for metastasis of Pan-NENs [5], and patients with hepatic metastases show poorer survival rate than those without hepatic metastases [6,7].
Paired box 6 (PAX6) is a transcription factor that is tightly linked with normal organ development and belongs to the paired box family [8]. It is crucial in the embryonic development of several organs, including the central nervous system, eyes and pancreas [9]. More specifically, basic research demonstrated that PAX6 is required for normal vasculature development in the telencephalon and choroid [10,11]. This transcription factor plays a critical role in the correct differentiation and maintenance of function in the islets of Langerhans [12,13,14,15], and also in in the prevention of early-onset diabetes [16]. In addition to organ development, PAX6 is also expressed in a wide range of cancer cell lines and helps inhibit the growth of glioblastoma and prostate carcinoma cell lines in vitro [8,17,18,19,20,21], implying that the downregulation of PAX6 promotes tumor growth and invasiveness. In several types of cancer, low PAX6 expression results in a worse prognosis [22,23,24,25]. PAX6 is regarded as an immunohistochemical marker for NET of pancreatic origin [26]. The majority of Pan-NENs appear as immunohistochemically positive for PAX6 staining [27]. Furthermore, intermediate-grade Pan-NENs showed significantly lower PAX6 staining intensity than low-grade Pan-NENs [26]. A previous study from our institution reported that Pan-NENs with downregulated pancreatic beta-cell genes, involving PAX6, developed postoperative metachronous hepatic metastasis and had poor outcomes [22]. Additionally, that study verified that PAX6 could predict the metachronous hepatic metastasis-free survival of patients with postoperative Pan-NENs more accurately than conventional histologic risk factors, included in the 2017 WHO classification such as the Ki-67 proliferative index, mitotic count, and level of tumor differentiation [22]. This previous study found that PAX6 was the new significant prognostic factor for Pan-NENs. The PAX6 expression assessment is based on a sampling from a biopsy or surgery. However, assessing a single random sample may risk an incorrect evaluation for the entire lesion due to the intratumoral heterogeneity. Therefore, a non-invasive prediction technique is also essential in pointing out the possibility of low PAX6 expression.
Dynamic computed tomography (CT) is a useful imaging technique to evaluate the characteristics of Pan-NENs. Typically, Pan-NENs appear as small, well-defined masses with homogeneous hyperenhancement in the arterial phase because of their high vascularization [28,29]. However, Pan-NENs showing arterial iso- or hypoenhancement are not rare [30,31]. Previous studies showed that iso- or hypoenhancement in the arterial phase indicated low vascularization and poor outcome in Pan-NENs [32,33,34,35]. However, no study has investigated the relationship between CT features and subtypes of Pan-NENs according to PAX6 expression. Accordingly, this study aimed to examine preoperative CT features for predicting low expression of PAX6 in Pan-NENs without synchronous liver metastasis.

2. Materials and Methods

2.1. Patients

This retrospective study was approved by the institutional review board of the Tokyo Medical and Dental University, and the requirement for informed consent was waived (the project identification code: M2018-146, the date of approval: 18 September 2018). We reviewed electronic medical records of 70 patients who had a history of curative surgical treatment and were histologically diagnosed with Pan-NENs without synchronous liver metastasis between April 2000 and March 2018. Fourteen patients were excluded due to lack of available preoperative CT images (n = 5), preoperative CT with no DICOM data sets (n = 2), multiphasic dynamic CT without both arterial and portal phases (n = 7), and no detectable lesions on preoperative CT (n = 3). We also excluded patients with multiple lesions because it was difficult to match individual lesions with data of PAX6 expression (n = 2). Therefore, a total of 51 patients with Pan-NENs who had no synchronous liver metastases were included in the analysis. They were divided into two groups: low and high PAX6 expression. All patients were followed up until 31 March 2018, and we counted the number of metachronous hepatic metastasis and death that occurred during follow-up.

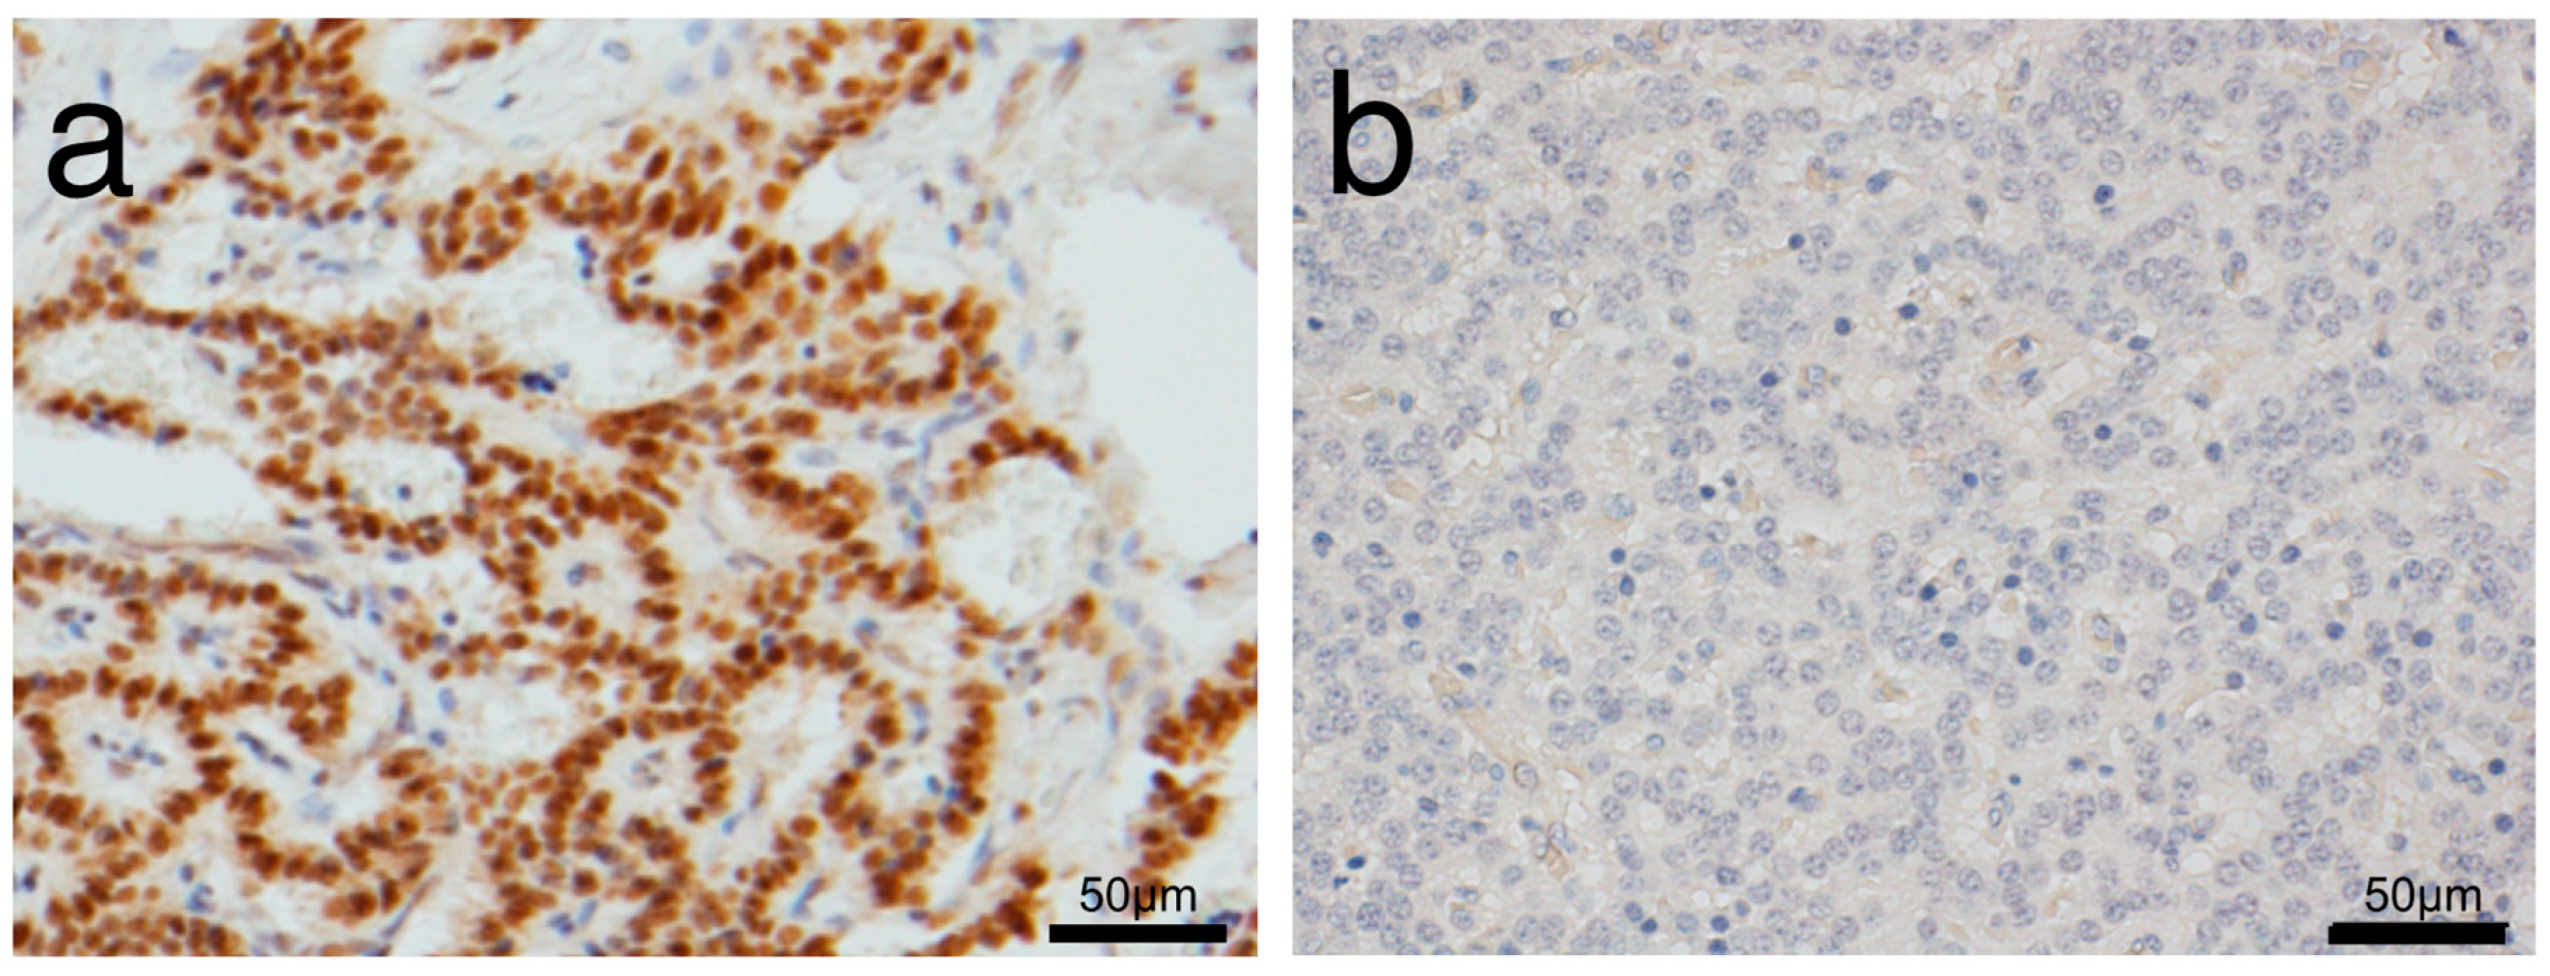
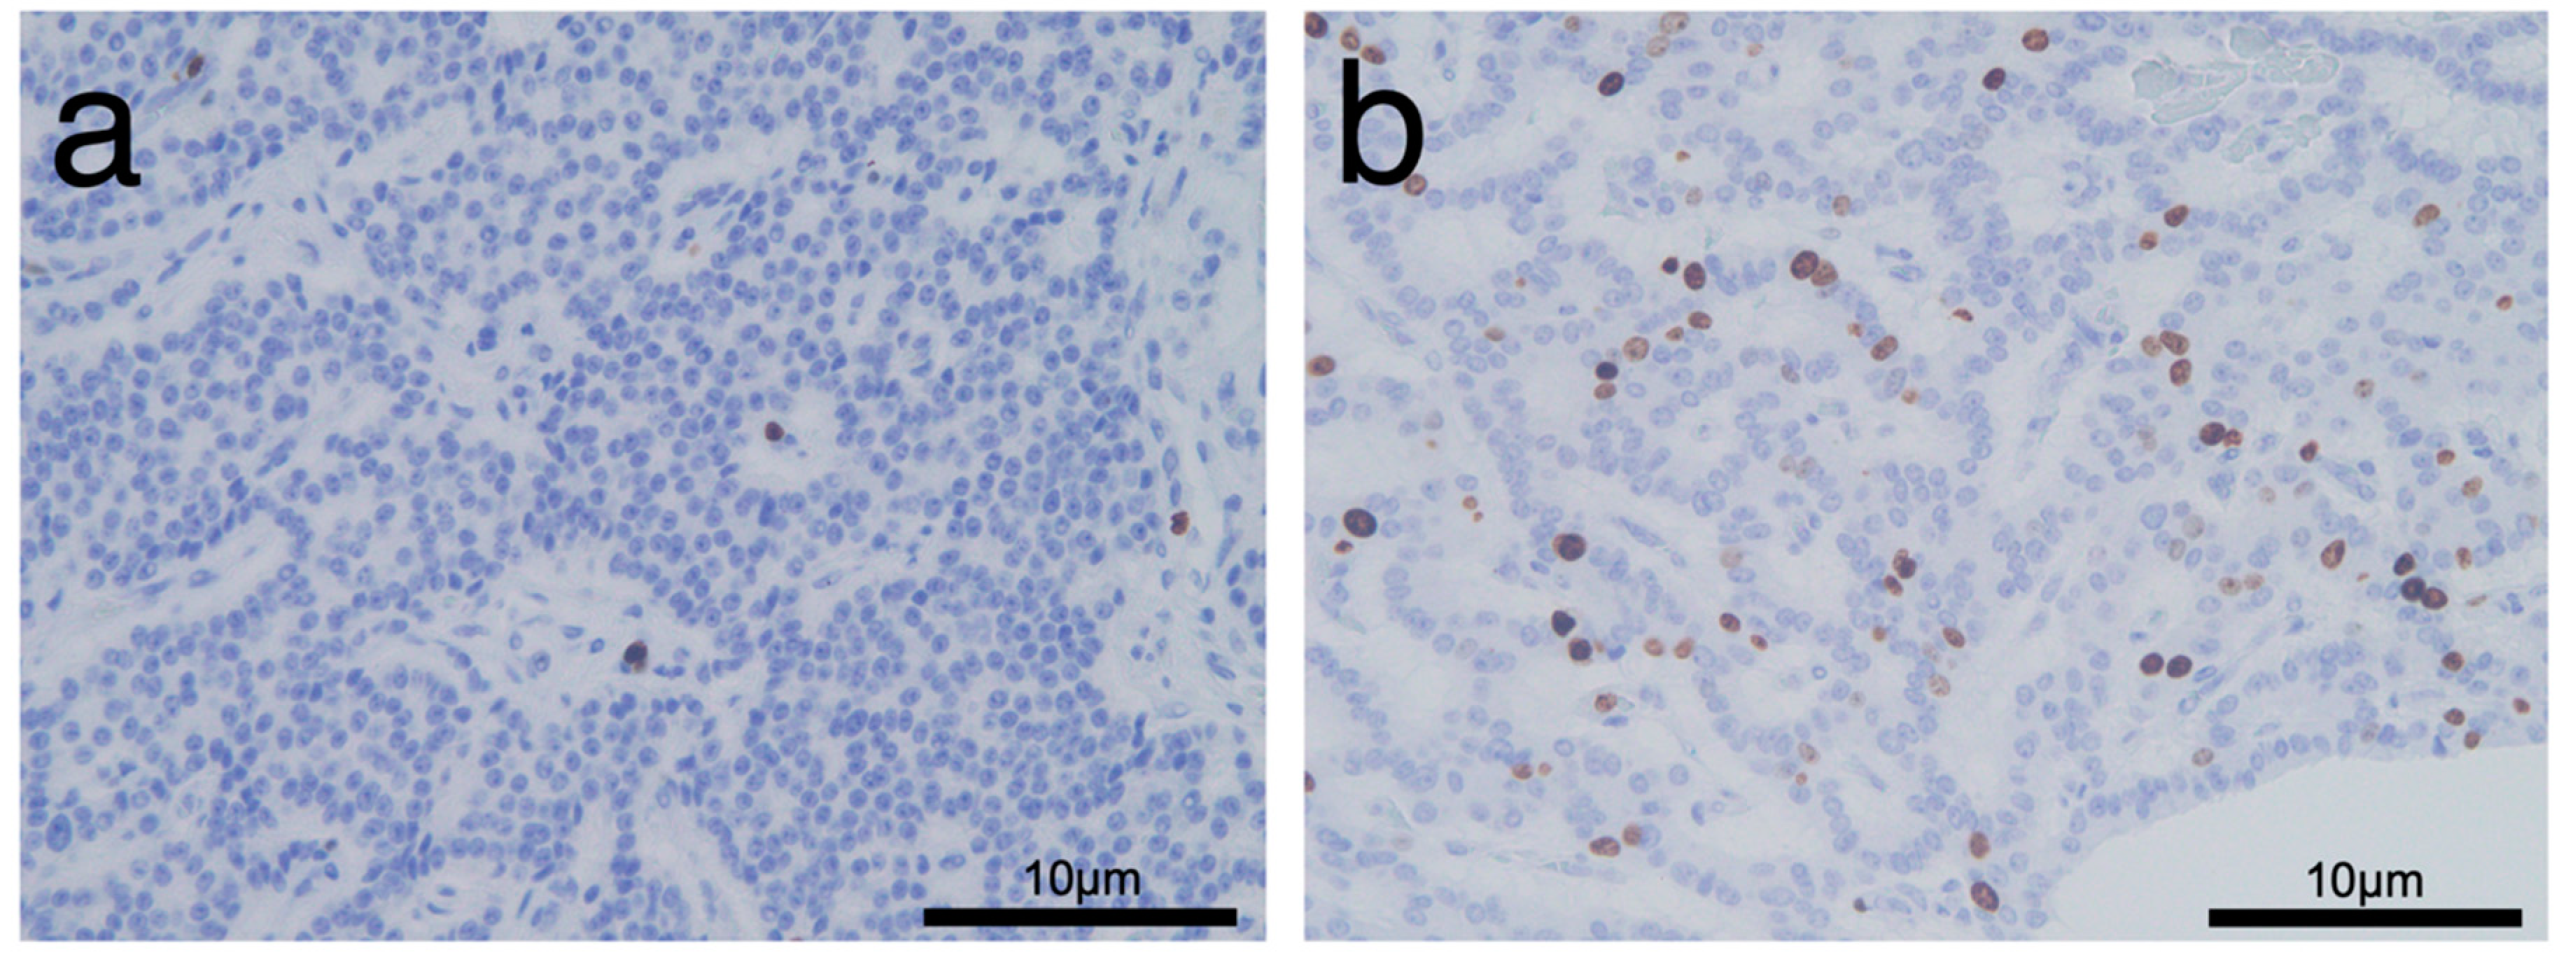
2.2. Pathological Analysis

The diagnosis of Pan-NENs was confirmed based on histologic findings and immunohistochemical expression of chromogranin A and synaptophysin. Pathological grading was performed according to the 2010 WHO classification. PAX6 expression in resected pancreatic samples from patients was evaluated using immunohistochemical staining. The detailed methods for PAX6 immunohistochemistry were as follows. Formalin-fixed paraffin-embedded tissue samples were sectioned into 4-μm-thick slices. For antigen retrieval, slides were subjected to microwave radiation in 0.01 M citrate buffer solution (pH 6.0) for 15 min and then incubated with an anti-PAX6 antibody (sc-81649, Santa Cruz Biotechnology, Texas, U.S.A.) at a 1:200 dilution for 24 h at 4 °C. The secondary antibody used was Histofine Simple Stain MAX Peroxidase (414144F, AS ONE, Osaka, Japan). The incubation time was 1 h at room temperature. All tissue sections were counterstained with hematoxylin. The criteria for determining low and high PAX6 expression are as follows. PAX6 was expressed in all normal islets of Langerhans, which were considered the internal control for PAX6 expression. Tumor tissues with an equal or higher degree of staining of PAX6 when compared with the islet cells were categorized as high PAX6 expression (Figure 1a). Tumor tissues with a lower degree of staining, when compared with the islet cells, were judged as having low PAX6 expression (Figure 1b). Two observers (A.K. and K.A.) independently evaluated PAX6 expression in the primary tumor in a blinded manner. In case of discrepancies, a consensus was reached by joint review. We also extracted the Ki-67 proliferative index and mitotic count of the primary tumors from the pathology reports. We classified the Ki-67 proliferative index and mitotic count respectively into two groups (≤2%: low Ki-67, >2%: high Ki-67; and <2 n/10 high power field: low miotic, ≥2 n/10 high power field: high miotic) according to 2010 WHO classification.

2.3. CT Imaging Techniques and Analysis

Due to this was a retrospective study, 11 (21.6%) patients who had undergone preoperative dynamic CT studies at institutions outside our university hospital were included. Therefore, the CT protocols varied, but all these CT studies included unenhanced scans and arterial and portal phase scans. Overall, 40 (78.4%) patients had undergone preoperative dynamic CT studies at our institution, and again all included unenhanced scans and arterial and portal phase scans. The injection protocol used at our institution is described in Appendix A1.
Two experienced radiologists (J.T. and Y.K.) independently reviewed the preoperative CT images using picture archiving and communication systems, and interobserver agreement was assessed for the CT features. Discrepancies were resolved by a third senior radiologist (M.K.). The radiologists were only aware of the histopathological diagnosis of Pan-NENs, but they were blinded to the pathological grading, Ki-67 proliferative index, mitotic count, and PAX6 expression.
These morphological features of Pan-NENs were analyzed: (1) Ttumor location in the pancreas (head, body, or tail); (2) maximum size; (3) shape (round, oval, or lobulated); (4) margin (well-defined or ill-defined); (5) presence of cystic changes; (6) calcifications; (7) visible intratumoral vessel in the arterial phase; (8) invasion into adjacent vascular structures; (9) main pancreatic duct dilatation (defined as diameter ≥4 mm); and (10) presence of upstream pancreatic atrophy.
The enhancement patterns of Pan-NENs in both, the arterial and portal phases were qualitatively assessed. The qualitative evaluation included tumor homogeneity and main enhancement types. Tumor homogeneity was categorized into “homogeneous” (Figure 2a,c) or “heterogeneous” (Figure 2b,d) according to each phase. During each phase, the main enhancement types were visually rated as either “hyperenhancement” or “iso- or hypoenhancement” and depended on comparison with the normal pancreatic parenchyma. A quantitative evaluation was performed as follows. The Hounsfield unit (HU) value was measured by placing the oval region of interest (ROI), which is at least 10 mm2, within the tumor and normal pancreatic parenchyma in each of the contrast phase images (Figure 3). If the tumor showed heterogeneous enhancement, the ROI was drawn at the area that showed the main enhancement type. Care was taken to avoid calcifications, cystic changes, adjacent vasculatures, and the main pancreatic duct. The enhancement ratio was defined as the HU value of the primary tumor divided by that of the normal pancreatic parenchyma in the arterial and portal phase.

2.4. Statistical Analysis

Cohen’s kappa analysis was used to assess interobserver agreement regarding radiological features. Kappa (k) values were calculated separately for each feature and interpreted as follows: <0.20, slight agreement; 0.21–0.40, fair agreement; 0.41–0.60, moderate agreement; 0.61–0.80, substantial agreement; and 0.81–1.00, almost perfect agreement. We compared the CT features between low and high PAX6 expression groups. Each of the Ki-67 proliferative index and mitotic count groups was also compared to the CT features. Between-group comparisons were performed using Fisher’s exact test for categorical variables. All continuous variables were tested for normality with histogram and the Shapiro-Wilk test. In this study, none of the continuous variables had a normal distribution. Hence, the Mann–Whitney U test was employed for comparing continuous variables between groups. The maximal Youden index, determined using receiver operating characteristic (ROC) analysis, was used to determine the appropriate cut-offs for significant continuous variables. The sensitivity, specificity, accuracy, positive likelihood ratio, and negative likelihood ratio of significant imaging findings and combinations of these features were calculated with 95% confidence intervals (CI). All statistical analyses were performed using EZR version 1.40 (Saitama Medical Center, Jichi Medical University, Tochigi, Japan) and R version 3.6.0 (R Foundation for Statistical Computing, Vienna, Austria). A p value less <0.05 was considered statistically significant.

3. Results

3.1. Comparison of Characteristics between Low and High PAX6 Expression Groups

The clinicopathologic characteristics of the 51 patients according to PAX6 expression are shown in Table 1. Overall, 11 (21.6%) patients showed low PAX6 expression (Figure 4a,b), and 40 (78.4%) showed high PAX6 expression (Figure 5a,b). There were 2 patients (3.9%) who were diagnosed with genetic disorder. Of those patients, one who had von Hippel-Lindau disease was classified into the low PAX6 expression group, and the other patient with multiple endocrine neoplasia type 1 syndrome was classified into the high PAX6 expression group. Approximately half the patients with low PAX6 expression and the majority of patients with high PAX6 had NET G1 (n = 6/11, 54.5% vs. n = 33/40, 82.5%). NET G2 or NEC G3 was more frequent in the low than in the high PAX6 expression group (n = 5/11, 45.5% vs. n = 7/40, 17.5%). Pathological grading was significantly associated with PAX6 expression (p = 0.049). The mean Ki-67 proliferative index was significantly higher for the low than for the high PAX6 expression group (6.25% vs. 1.81%, p = 0.021). Figure 6a,b shows representative immunohistochemistry images of Ki-67 according to PAX6 expression. The mean mitotic count of the low PAX6 expression group was higher than that of the high PAX6 expression group (1.45 vs. 0.80, p = 0.11). The total rate of metachronous hepatic metastasis during follow-up was 5.9% (n = 3/51); 2/11 (18.2%) in the low and 1/40 (2.5%) in the high PAX6 expression group (p = 0.114). Two patients died during follow-up, both in the low PAX6 expression group (n = 2/11, 18.2% vs. n = 0/41, 0%, p = 0.043).

3.2. Morphological Features of Pan-NENs Associated with Low or High PAX6 Expression

The morphological features of the 51 Pan-NEN patients are summarized in Table 2. Interobserver agreement for the radiological features was fair to almost perfect (k = 0.45 for margin; k = 0.92 for calcifications). The median tumor size was slightly larger in the low than in the high PAX6 expression group (18.6 mm vs. 15.5 mm, p = 0.24). Pan-NENs with low PAX6 expression tended to exist in the pancreatic tail (n = 6/11, 54.5%, p = 0.28) and appeared as an oval mass (n = 7/11, 63.6%, p = 0.44). Calcifications, invasion into adjacent vascular, and upstream pancreatic atrophy occurred more frequently in the low PAX6 expression group than in the high PAX6 expression group (n = 4/11, 36.4% vs. n = 4/40, 10.0%, p = 0.055; n = 2/11, 18.1% vs. n = 3/40, 7.5%, p = 0.29; n = 2/11, 18.1% vs. n = 1/40, 2.5%, p = 0.11). However, there was no significant difference in morphological features between the low and high PAX6 expression groups.

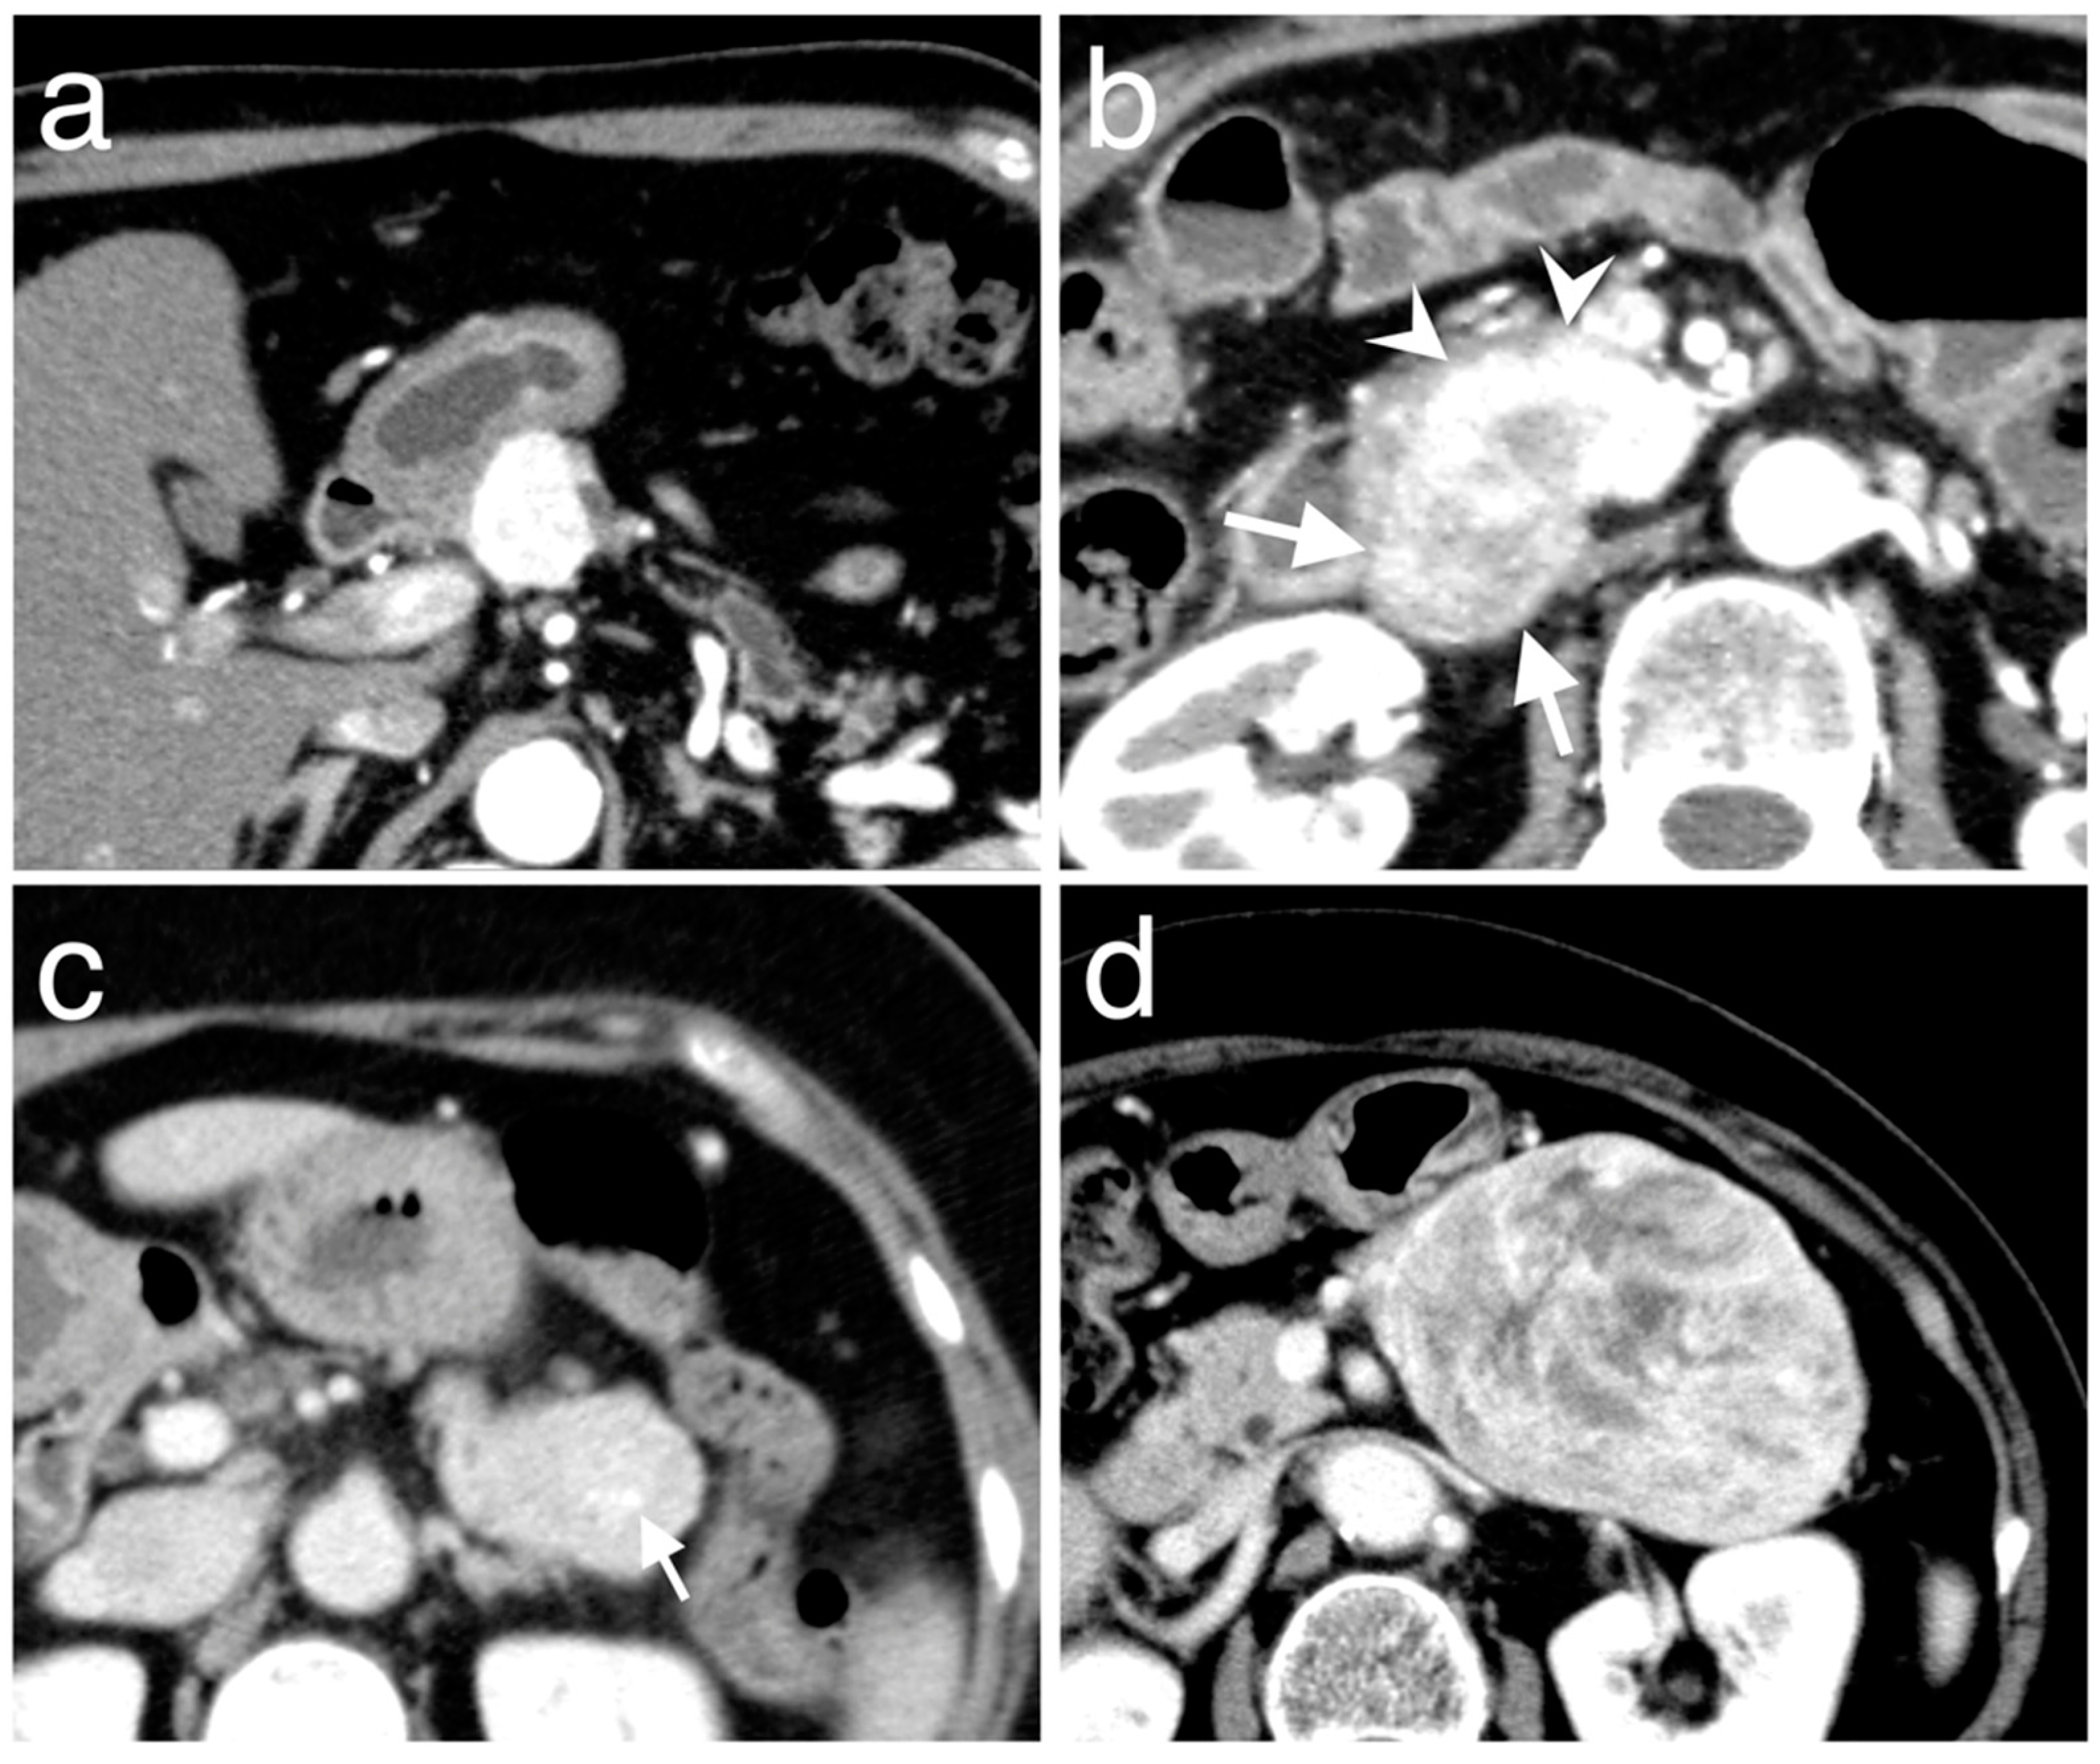
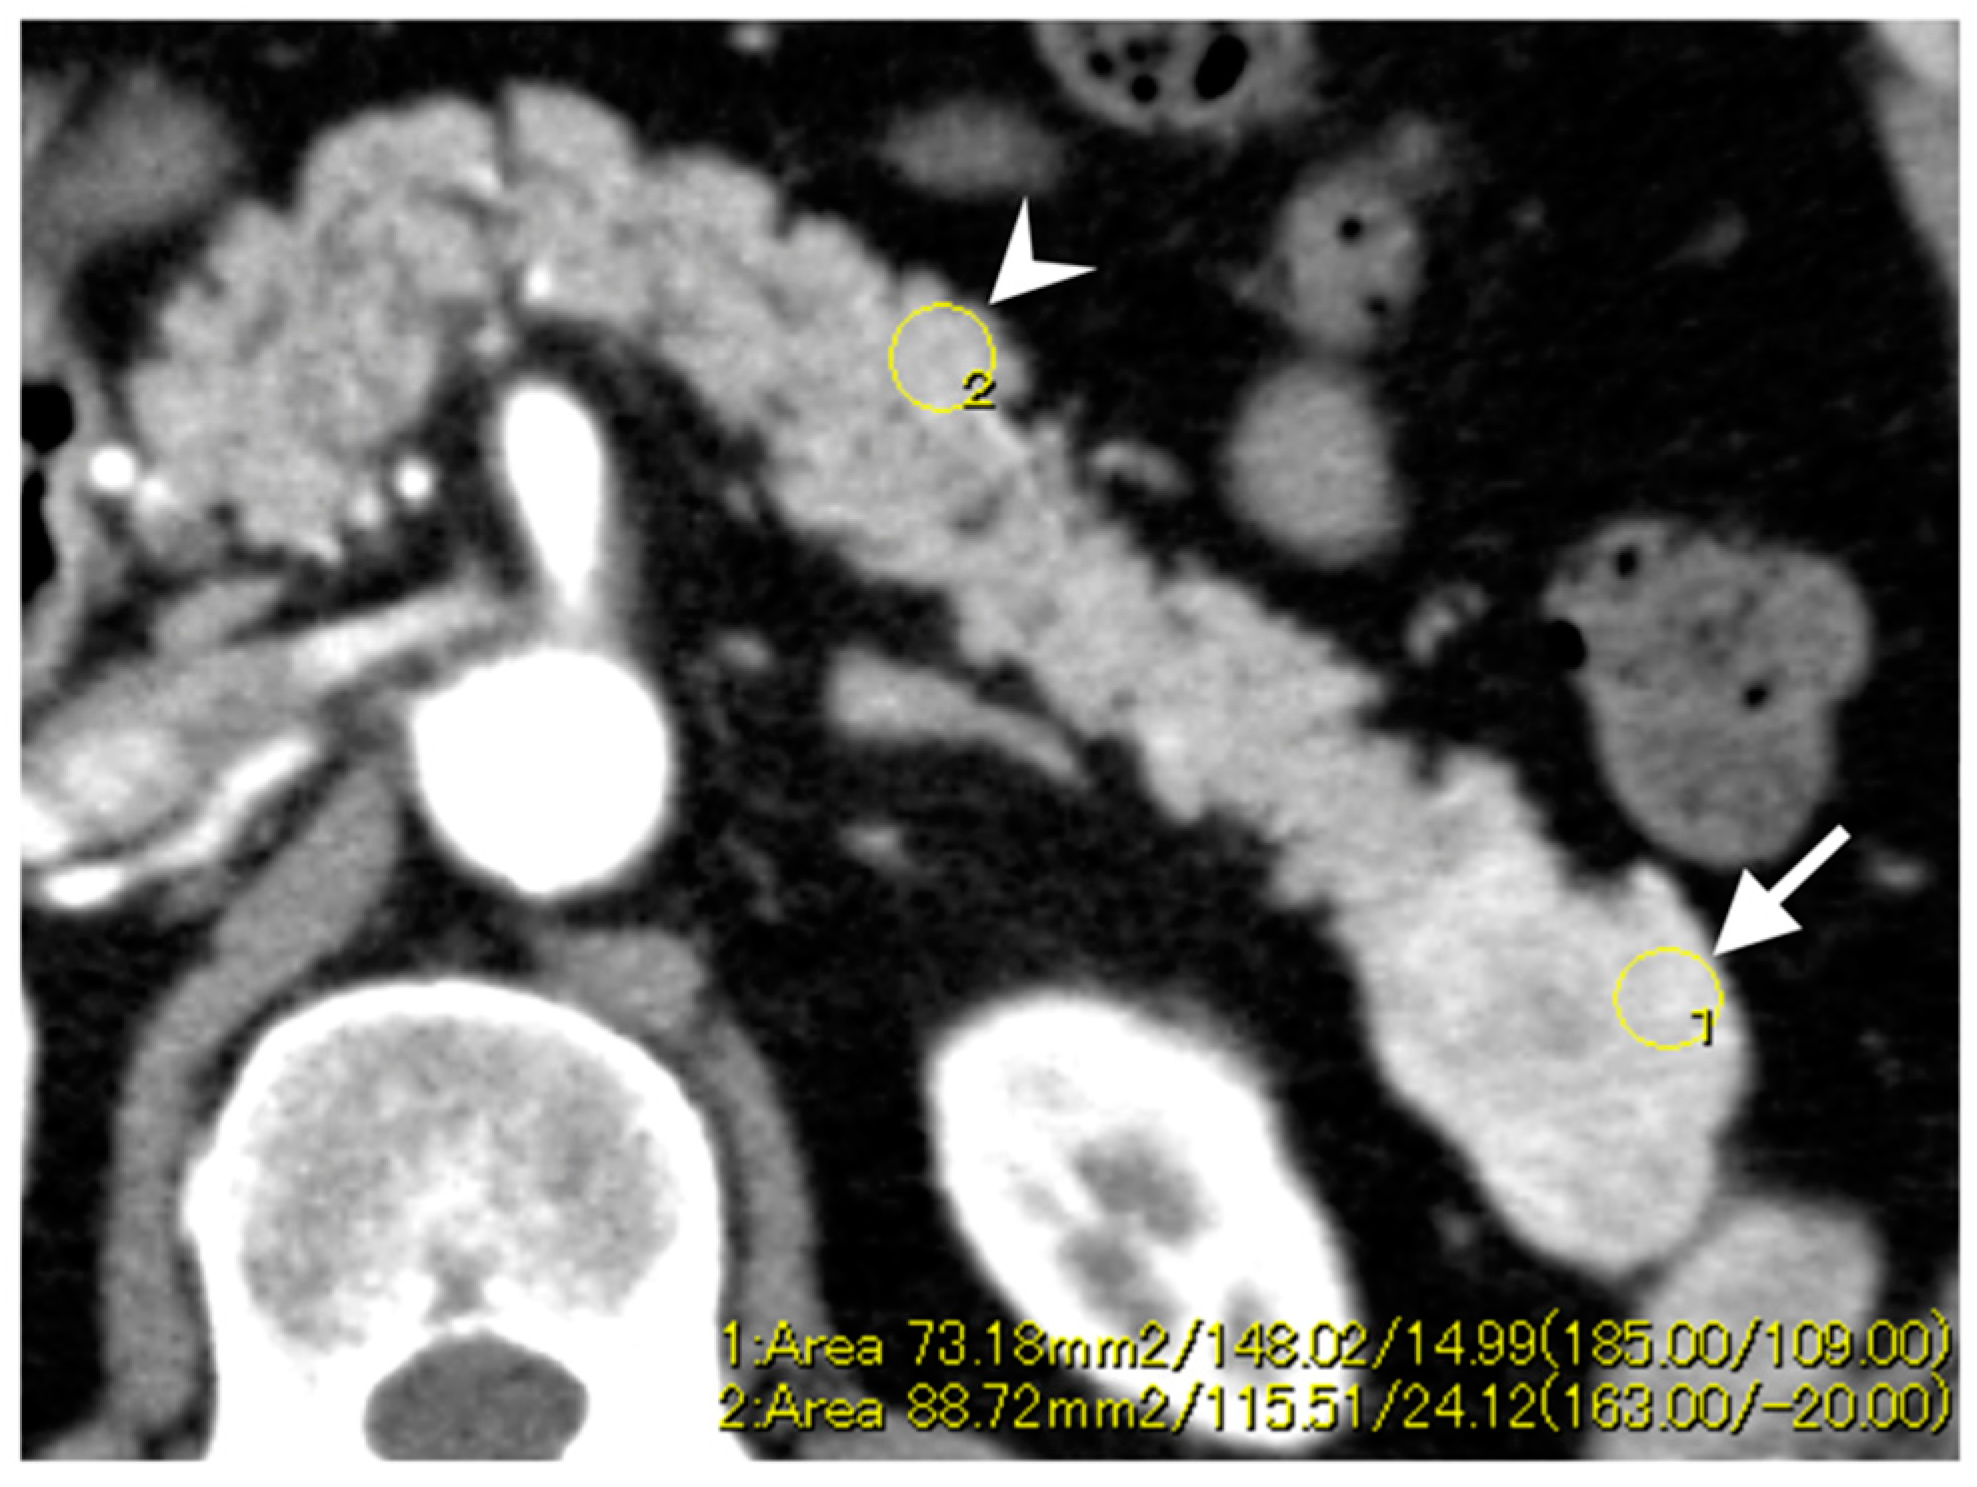
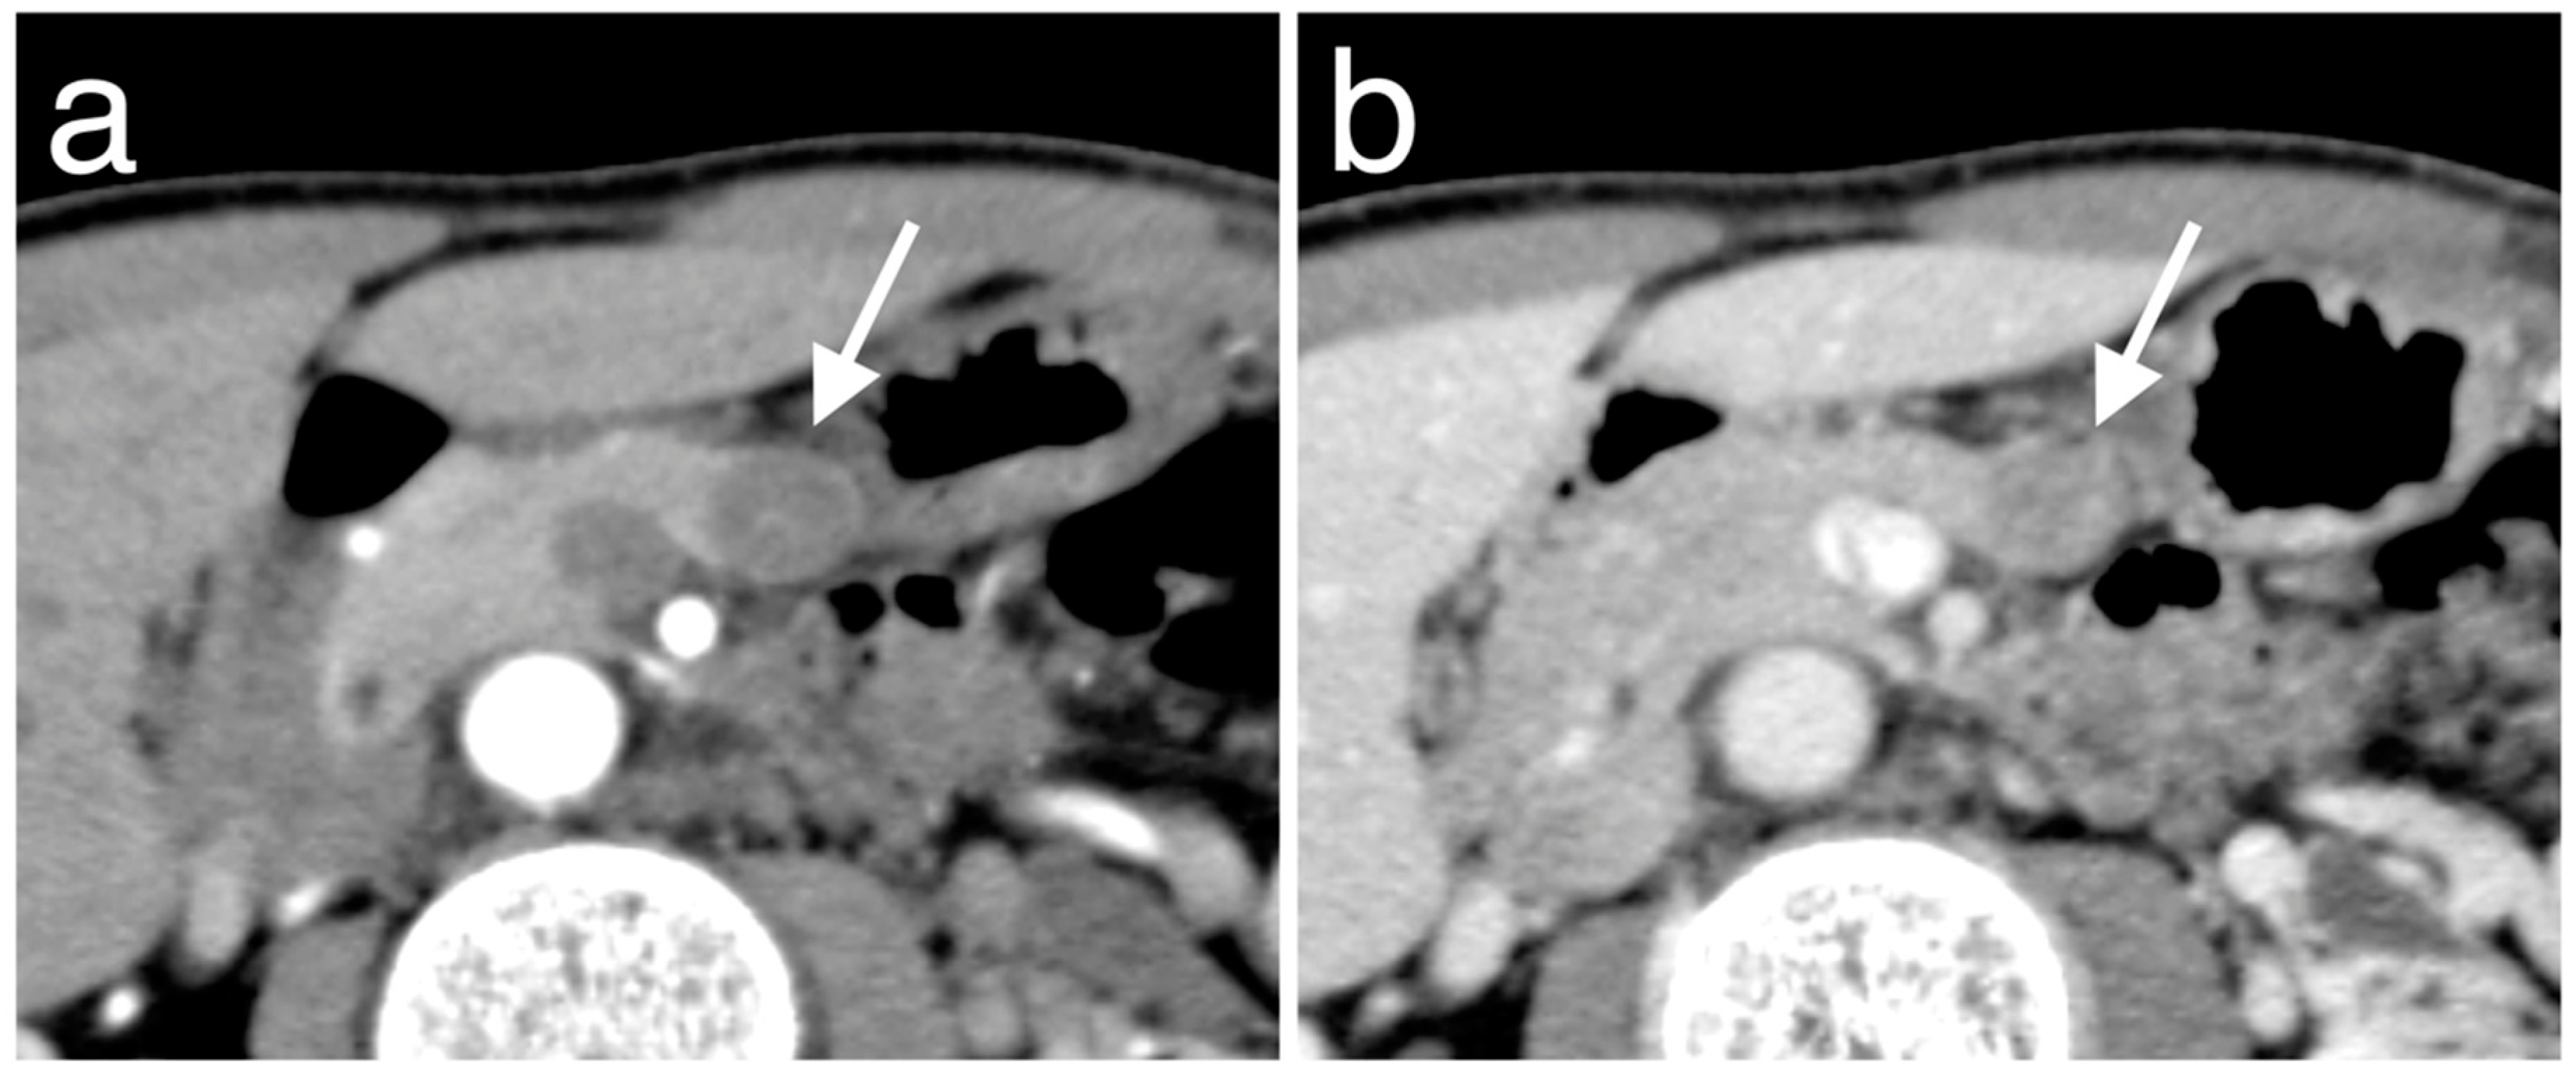
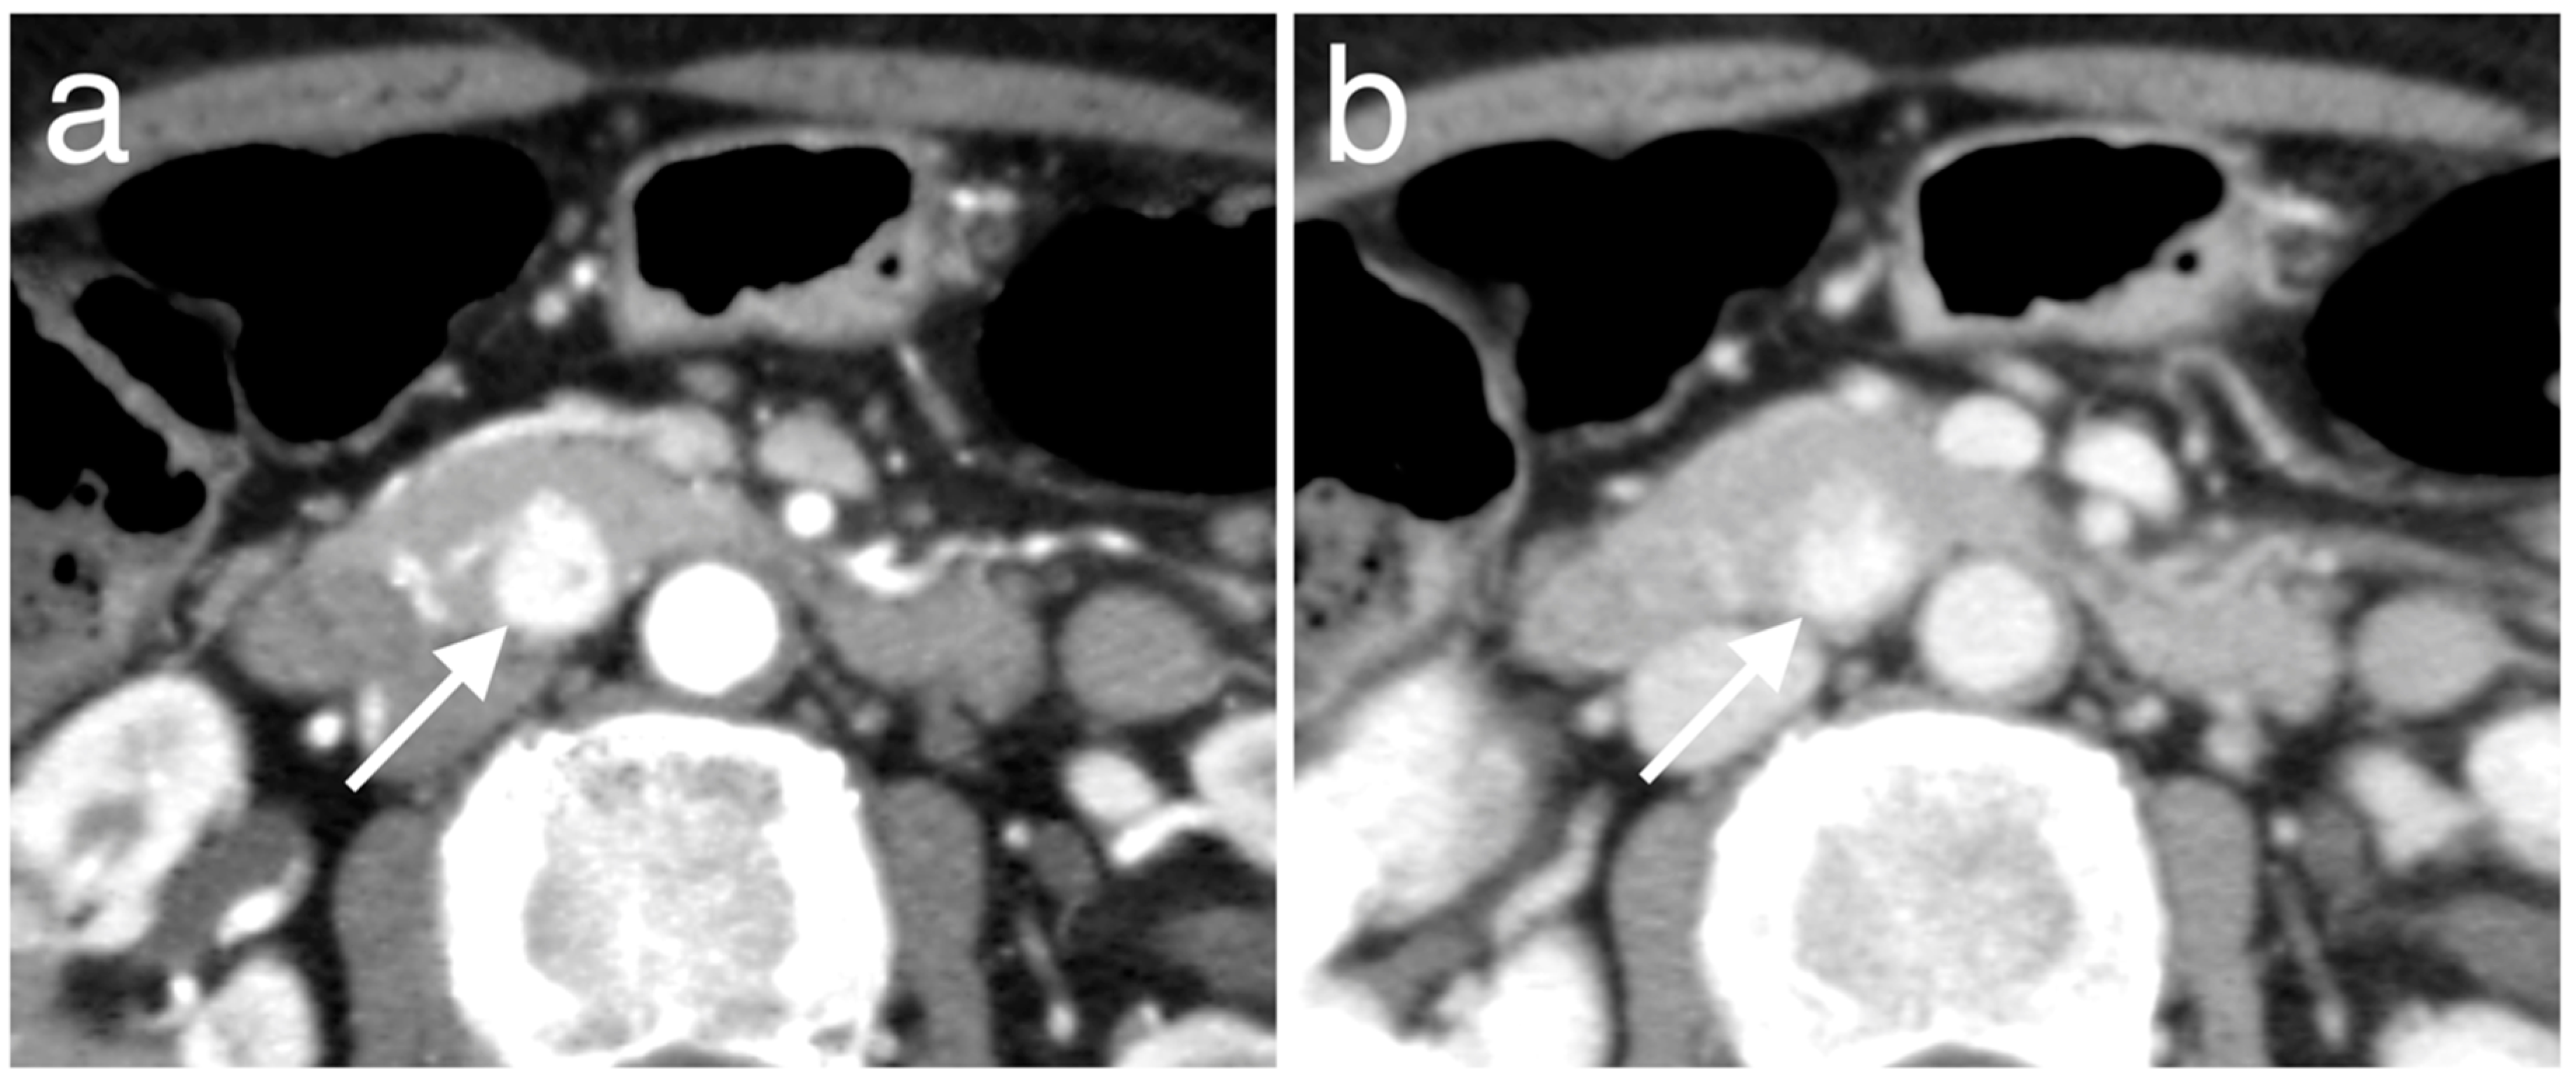
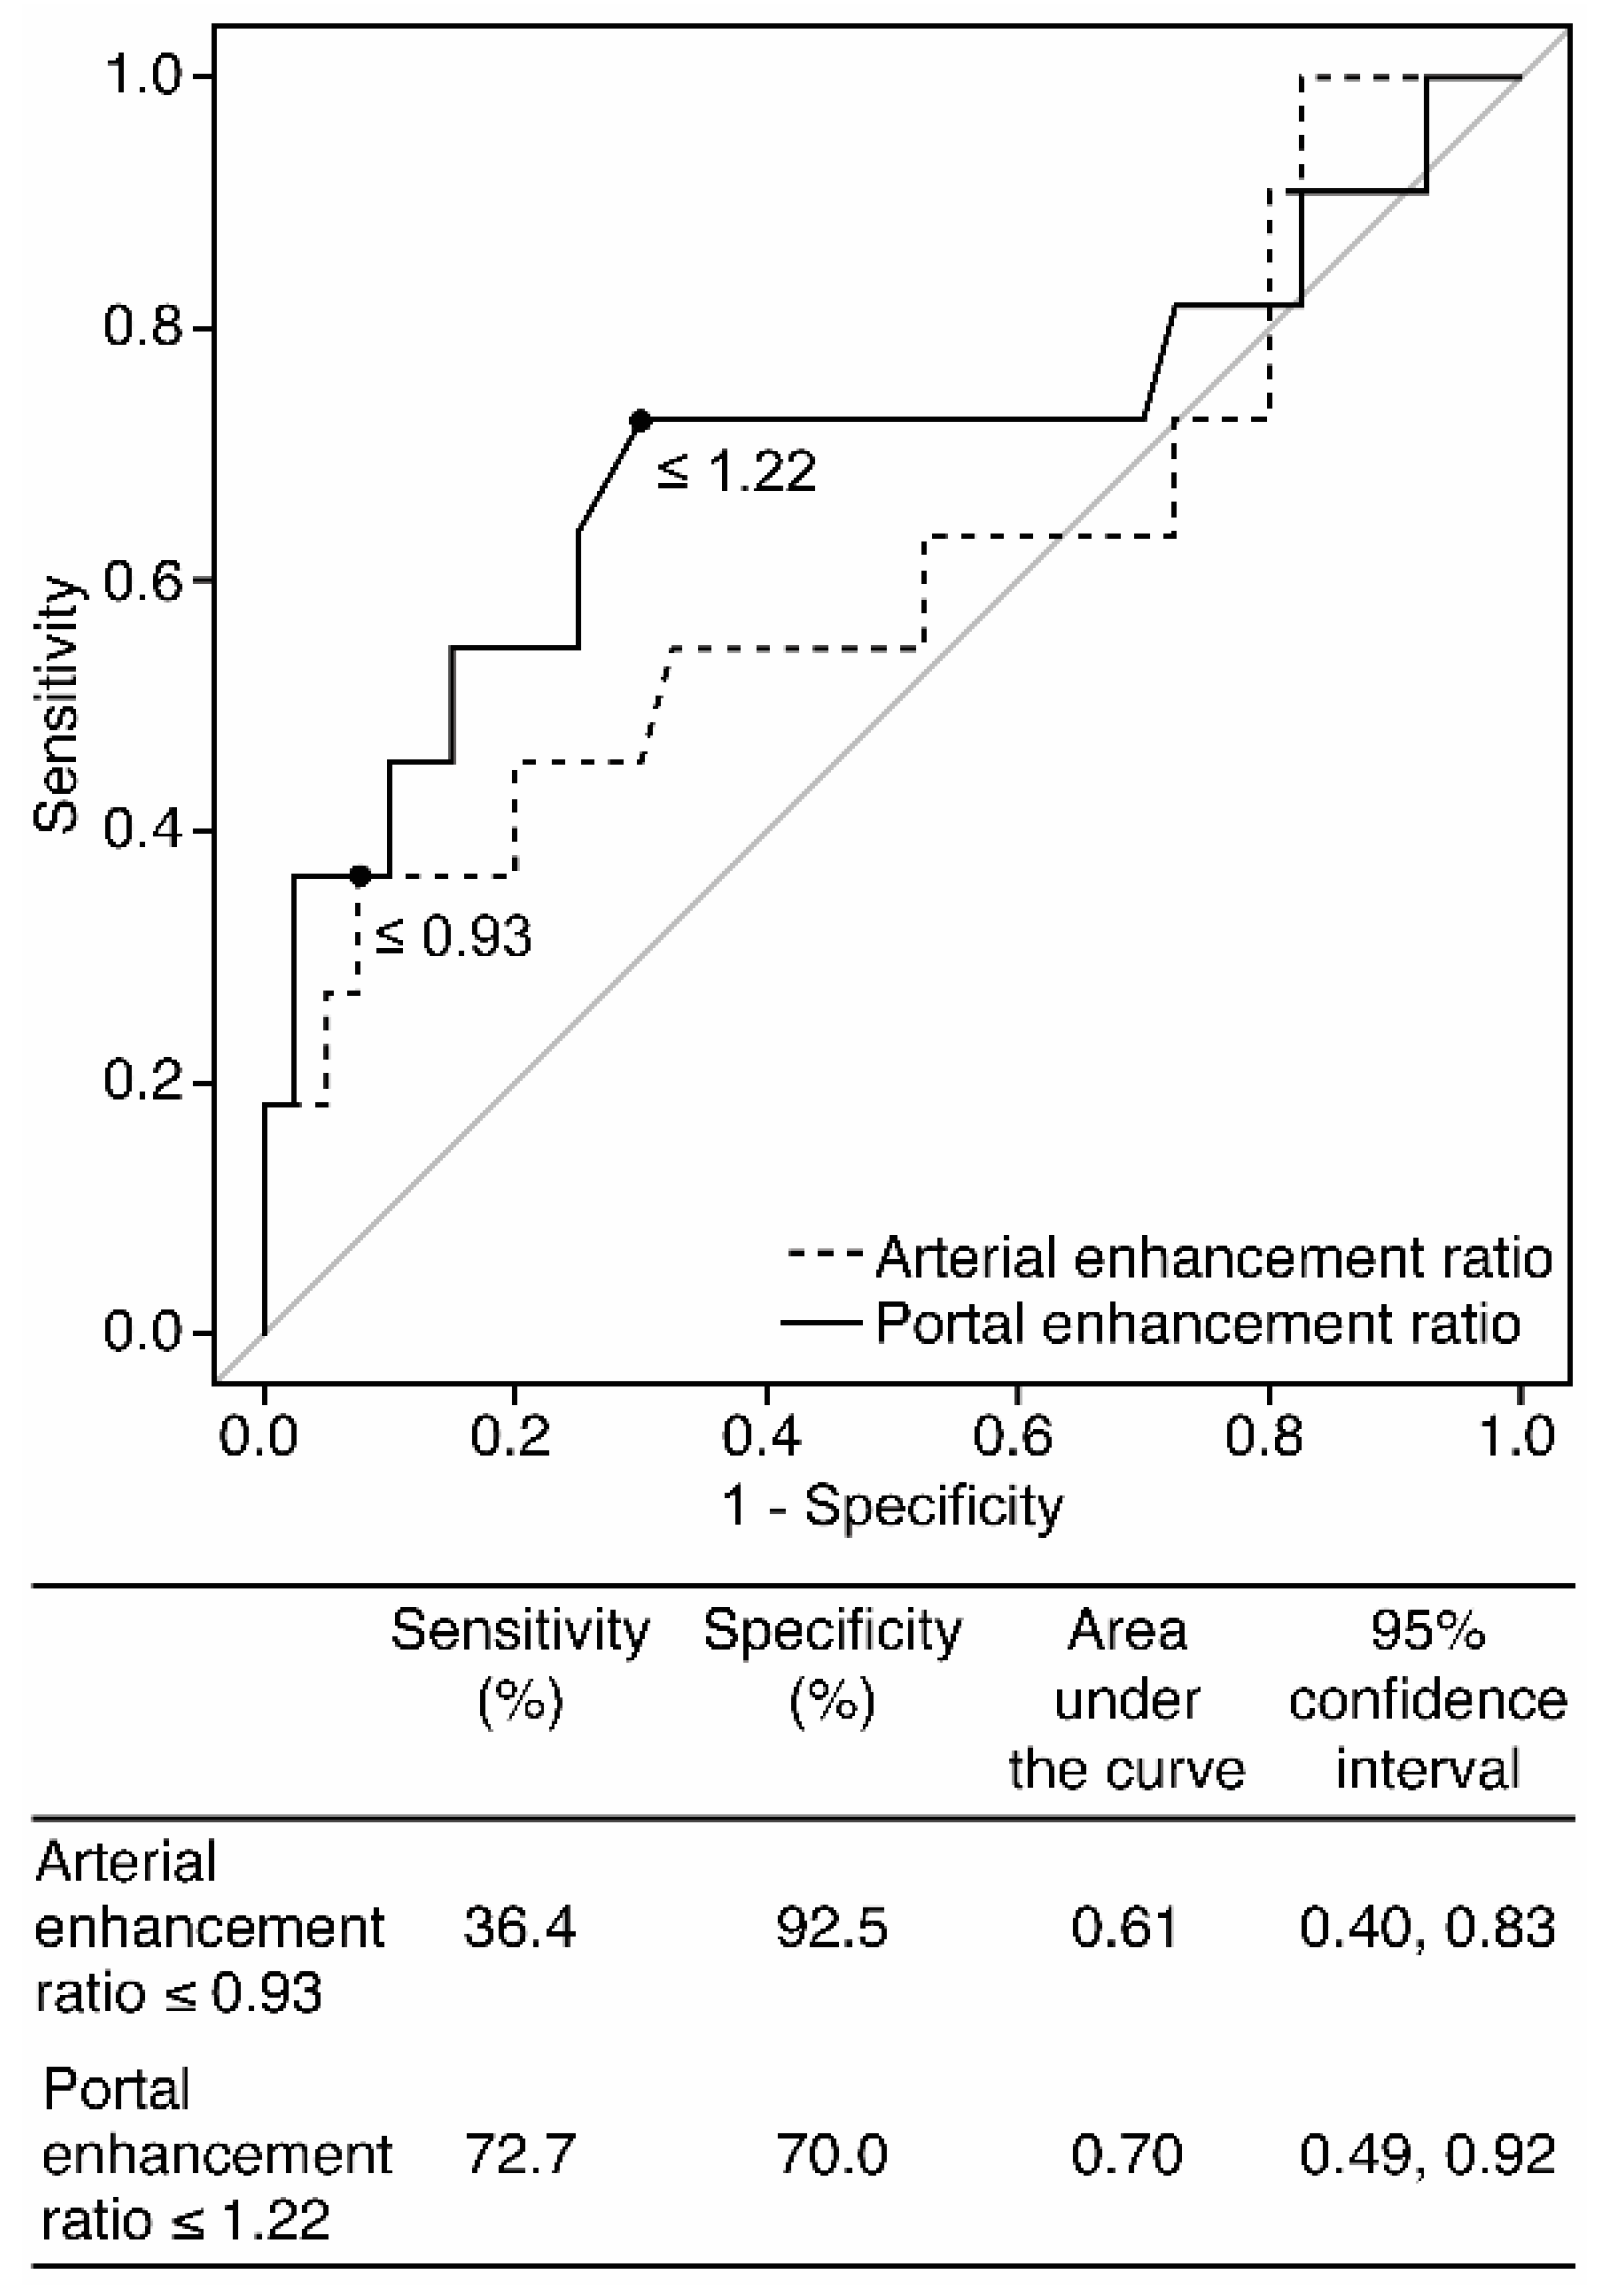
3.3. Enhancement Patterns of Pan-NENs Related to Low or High PAX6 Expression

The tumor homogeneity, main enhancement types, and enhancement ratio according to PAX6 expression are shown in Table 3. Iso- or hypoenhancement types in the arterial phase were significantly more frequent in the low than in the high PAX6 expression group (n = 7/11, 63.6% vs. n = 8/40, 20.0%, p = 0.009). In addition, iso- or hypoenhancement types in the portal phase were significantly more frequent in the low PAX6 than in the high PAX6 expression group (n = 8/11 72.7% vs. n = 7/40 17.5%, p = 0.001). The enhancement ratio in the arterial phase of the low PAX6 expression group was lower than that of the high PAX6 expression group, but the difference was not significant (1.19 ± 0.44 vs. 1.38 ± 0.36, p = 0.28). Whereas, the low PAX6 expression group had a significantly lower enhancement ratio in the portal phase than the high PAX6 expression group (1.12 ± 0.28 vs. 1.30 ± 0.22, p = 0.044). ROC curves based on arterial and portal enhancement ratio and optimal cutoff values for differentiating low PAX6 from high PAX6 Pan-NENs are shown in Figure 7. The optimal cut-off value of the portal enhancement ratio was ≤1.22. This had a sensitivity and specificity of 72.7%, and 70.0%, respectively, and the area under the curve was 0.70 (95% CI: 0.49–0.92).
The sensitivity, specificity, accuracy, positive likelihood ratio, and negative likelihood ratio for significant enhancement features and their combinations are presented in Table 4. The combination of iso- or hypoenhancement types in the arterial phase, iso- or hypoenhancement types in the portal phase, and portal enhancement ratio ≤1.22 had a sensitivity, specificity, accuracy, positive likelihood ratio, and negative likelihood ratio of 54.5%, 92.5%, 84.3%, 7.27, and 0.49, respectively, for predicting low PAX6 Pan-NENs.

3.4. Morphological Features and Enhancement Patterns of Pan-NENs Associated with Ki-67 Proliferative Index and Mitotic Count

The morphological features, according to Ki-67 proliferative index and mitotic count, are shown in Table 5. The median tumor size was significantly larger for high Ki-67 and mitotic groups than for low Ki-67 and mitotic groups (28.3 mm vs. 15.0 mm, p = 0.012 for the Ki-67 proliferative index; 57.9 mm vs. 15.3 mm, p = 0.004 for the mitotic count, respectively). The high Ki-67 group showed ill-defined margins compared with the low Ki-67 group, and this difference was significant (n = 5/16, 31.3% vs. n = 2/35, 5.7%, p = 0.025). Calcifications were observed to occur significantly more frequently in both high Ki-67 and mitotic groups than in low Ki-67 and mitotic groups (n = 6/16, 37.5% vs. n = 2/35, 5.7%, p = 0.008 for Ki-67 proliferative index; n = 3/4, 75.0% vs. n = 5/47, 10.6%, p = 0.009 for mitotic count, respectively). Table 6 shows the enhancement patterns according to the Ki-67 proliferative index and the mitotic count. Iso- or hypoenhancement types in the arterial phase were significantly associated with the high Ki-67 group compared with the low Ki-67 group (n = 8/16, 50.0% vs. n = 7/35, 20.0%, p = 0.046). No other significant differences were observed in the enhancement patterns between the low and high Ki-67 or mitotic groups.

4. Discussion

Biological factors, such as protein expression, epigenetics, and gene expression in Pan-NENs are expected to optimize prognostic stratification and help plan personalized treatment [36]. Integrating imaging features and the biological information could increase precision in the diagnosis, assessment of the prognosis, and prediction of the treatment response [37]. PAX6 is a critical factor for the differentiation of the pancreas endocrine cells and necessary to control the specification of each hormone-producing endocrine cells [12,13,14,15]. Recently, we showed the relationship of low PAX6 expression with the occurrence of metachronous metastasis and poor survival [22]. The non-invasive prediction technique of low expression of PAX6 in Pan-NENs is desirable for planning appropriate treatment to improve prognosis. Our results showed that among CT enhancement patterns, iso- or hypo-enhancement types in both the arterial and portal phase and portal enhancement ratio of ≤1.22 was useful in predicting Pan-NENs with low PAX6 expression. The combination of these three features showed high specificity and accuracy. To the best of our knowledge, this is the first study to investigate the association between imaging features in Pan-NENs and PAX6 expression.
In this present study, iso- or hypoenhancement types in both the arterial and portal phases were associated with low PAX6 expression. Moreover, NET G2 and NEC G3 Pan-NENs demonstrated low PAX6 expression more frequently. Previous findings have indicated that high-grade Pan-NENs were correlated with low blood flow in perfusion CT and iso- or hypoenhancement types on dynamic CT [32,33,38,39]. Decreased blood flow in iso- or hypo-enhancement types might result from the downregulation of PAX6 expression.
Portal enhancement ratio was significantly lower in the low than in the high PAX6 expression group. Although its sensitivity and specificity were insufficient, the cut-off value of ≤1.22 showed the best performance for differentiating low PAX6 from high PAX6 expression of Pan-NENs. Kim et al. [40] and Belousova et al. [34] showed that the enhancement ratio in the portal phase was associated with histologic grade of Pan-NENs. The higher-grade Pan-NENs tended to have lower values of enhancement ratio in the portal phase [34,40]. Collectively, these results indicate that a lower enhancement ratio in the portal phase may be a potential indicator for Pan-NENs with low PAX6 expression. The arterial enhancement ratio was lower in the low than in the high PAX6 expression group, although not significant. In contrast, the qualitative evaluation showed a significant association between low and high PAX6 expression groups. Ideally, quantitative evaluation findings should align with qualitative evaluation findings. Previous studies have shown that the arterial enhancement ratio was also associated with the histologic grade of Pan-NENs [34,40]. The present study might be limited in detecting a significant difference in the arterial enhancement ratio because of the small number of patients in the low PAX6 group.
Tumor size and calcification were associated with high Ki-67 and miotic group count, and ill-defined margins were significantly observed in the high Ki-67 group. These morphological features were considered as tumor aggressiveness and several previous studies supported this finding [40,41,42,43]. In terms of enhancement patterns, the main enhancement types in the arterial phase were significantly different according to the Ki-67 proliferative index. Our findings are analogous with those of previous studies that indicated Pan-NENs with higher Ki-67 proliferative index showed low blood flow and appeared as iso- or hypoenhancement types [38,41,44]. Unlike the result of Ki-67 and miotic groups, we could not find a significant association between morphological features and PAX6 expression, whereas significant differences in the enhancement patterns were more observed in the PAX6 expression group than in the Ki-67 or miotic groups. These facts might indicate that PAX6 expression contributes to determining the enhancement patterns of Pan-NENs more than morphological features.
The enhancement patterns on dynamic CT may explain the biological characteristics of PAX6 in Pan-NENs. Typical Pan-NENs preserve high vascularization and high PAX6 expression, as they originate from the pancreatic islet. Our results showed that PAX6 downregulation was associated with impaired angiogenesis in Pan-NENs, resulting in low vascularization. Angiogenesis is regulated by multiple molecular factors such as the vascular endothelial growth factor family, platelet-derived growth factor, and epidermal growth factor [45,46]. However, the association of PAX6 with these factors has not been identified in Pan-NENs. Tang et al. recently showed that PAX6 regulates the function of epidermal growth factor like domain multiple 6 and promotes angiogenesis in small bowel vascular malformation disease [47]. In glioma cells, PAX6 suppressed the expression of vascular endothelial growth factor A and the angiogenesis of glioma cells [48]. Interestingly, PAX6 expression of glioma cells seems to be inversely correlated with angiogenesis in Pan-NENs. Further studies are needed to investigate the association between PAX6 and angiogenesis factors in Pan-NENs and clarify the differences in the association between PAX6 expression and angiogenesis observed in Pan-NENs and other tumors.
In this study, the prediction of low PAX6 expression in Pan-NENs was solely analyzed based on CT features. Currently, various imaging techniques such as CT, magnetic resonance imaging (MRI), and positron emission tomography (PET)/CT play a key role in staging and determining the treatment of Pan-NENs [49]. MRI shows higher soft-tissue contrast resolution compared to CT; thus, it has an advantage for finding the lesions of Pan-NENs [28]. PET/CT is generally useful in identifying the unknown primary or detecting metastatic lesions, which cannot be found by CT or MRI. There are several 68Ga-radiolabelled somatostatin analogs that show high sensitivity (>90%) and specificity (92–98%) for finding NETs [50,51]. Conversely, 18F-fludeoxyglucose uptake is observed in the poorly differentiated tumors that show the low expression of somatostatin receptors [52,53]. In the future, it is desirable to clarify the relationship between PAX6 expression in Pan-NENs and imaging findings of modalities other than CT. It is then necessary to investigate the most useful imaging technique for predicting low PAX6 expression or whether the combination of multi-modality imaging may improve the prediction of low PAX6 expression in Pan-NENs.
Our study has some limitations. First, research on the value of PAX6 expression of Pan-NENs in predicting hepatic metastasis or survival remains limited. Further studies are needed to evaluate the value of PAX6 expression in patients with Pan-NENs. Second, our cohort was small, and the number of patients in each PAX6 expression group was uneven. There may be more critical imaging features associated with low expression of PAX6 in Pan-NENs. Generally, Pan-NENs are rare tumors, and PAX6 is demonstrated to be immunohistochemically positive in the majority of Pan-NENs. Therefore, it was challenging to obtain the same number of patients in each group according to PAX6 expression in a retrospective study. Third, some patients who had undergone preoperative dynamic CT studies outside of our institutions (approximately 20%) were included because of the retrospective design of the study, and variance in the CT protocols is a major concern. Further validation studies in large populations and using the unified dynamic CT protocol are needed to confirm the relationship between enhancement types and PAX6 expression in Pan-NENs.
In conclusion, arterial and portal iso- or hypoenhancement types and low portal enhancement ratio on dynamic CT may be predictive factors for Pan-NENs with low PAX6 expression. These predictive factors may enable us to identify poor outcomes of Pan-NENs patients with no synchronous liver metastasis and help in planning appropriate treatment to improve prognosis.

Author Contributions

Conceptualization, data curation, K.K.; methodology, K.K. and J.T.; resources, K.A., A.K. and S.T.; investigation, J.T., Y.K. and M.K.; writing—original draft preparation, K.K. and A.K.; writing—review and editing, K.K. and J.T.; supervision, M.T.; project administration U.T. All authors have read and agreed to the final draft of the manuscript.

Funding

This research received no external funding.

Conflicts of Interest

The authors declare no conflict of interest.

Appendix A

A.1. Injection protocol of CT for our institution

After unenhanced scans were acquired, the contrast media with iodine concentrations of 300 mg/mL were intravenously administered, amounting to 2.0 mL/kg of body weight, at a rate of 3 mL/s using a pump injector. The scanning timings for GE HiSpeed CT (GE Healthcare, Chicago, U.S.A.) were as follows: The arterial and portal phase scans were obtained at 30 and 70 s after injecting the contrast media. The scanning timings for Aquilion 64-slice CT (Canon medical systems, Tochigi, Japan) were as follows: the arterial phase scan was obtained at 15 s after aortic attenuation reached 150 Hounsfield units (HUs). The portal phase scans were obtained at 80–100 s after injecting the contrast media. Thus, all these CT studies included unenhanced scans and the arterial and portal phase scans.

References

  1. Yao, J.C.; Hassan, M.; Phan, A.; Dagohoy, C.; Leary, C.; Mares, J.E.; Abdalla, E.K.; Fleming, J.B.; Vauthey, J.N.; Rashid, A.; et al. One hundred years after “carcinoid”: Epidemiology of and prognostic factors for neuroendocrine tumors in 35,825 cases in the United States. J. Clin. Oncol. 2008, 26, 3063–3072. [Google Scholar] [CrossRef] [PubMed] [Green Version]
  2. Halfdanarson, T.R.; Rabe, K.G.; Rubin, J.; Petersen, G.M. Pancreatic neuroendocrine tumors (PNETs): Incidence, prognosis and recent trend toward improved survival. Ann. Oncol. 2008, 19, 1727–1733. [Google Scholar] [CrossRef] [PubMed]
  3. Lloyd, R.V.; Or, K.G.; Rosai, J. WHO Classification of Tumours of Endocrine Organs; World Health Organization: Geneva, Switzerland, 2017. [Google Scholar]
  4. Pape, U.F.; Böhmig, M.; Berndt, U.; Tiling, N.; Wiedenmann, B.; Plöckinger, U. Survival and clinical outcome of patients with neuroendocrine tumors of the gastroenteropancreatic tract in a German referral center. Ann. N. Y. Acad. Sci. 2004, 1014, 222–233. [Google Scholar] [CrossRef] [PubMed]
  5. Modlin, I.M.; Lye, K.D.; Kidd, M. A 5-decade analysis of 13,715 carcinoid tumors. Cancer 2003, 97, 934–959. [Google Scholar] [CrossRef] [PubMed]
  6. Thompson, G.B.; van Heerden, J.A.; Grant, C.S.; Carney, J.A.; Ilstrup, D.M. Islet cell carcinomas of the pancreas: A twenty-year experience. Surgery 1988, 104, 1011–1017. [Google Scholar]
  7. Frilling, A.; Modlin, I.M.; Kidd, M.; Russell, C.; Breitenstein, S.; Salem, R.; Kwekkeboom, D.; Lau, W.Y.; Klersy, C.; Vilgrain, V.; et al. Recommendations for management of patients with neuroendocrine liver metastases. Lancet Oncol. 2014, 15, e8–e21. [Google Scholar] [CrossRef]
  8. Strachan, T.; Read, A.P. PAX genes. Curr. Opin. Genet. Dev. 1994, 4, 427–438. [Google Scholar] [CrossRef]
  9. Simpson, T.I.; Price, D.J. Pax6; a pleiotropic player in development. BioEssays 2002, 24, 1041–1051. [Google Scholar] [CrossRef]
  10. Cohen-Tayar, Y.; Cohen, H.; Mitiagin, Y.; Abravanel, Z.; Levy, C.; Idelson, M.; Reubinoff, B.; Itzkovitz, S.; Raviv, S.; Kaestner, K.H.; et al. Pax6 regulation of Sox9 in the mouse retinal pigmented epithelium controls its timely differentiation and choroid vasculature development. Development 2018, 145, dev163691. [Google Scholar] [CrossRef] [PubMed] [Green Version]
  11. Vasudevan, A.; Long, J.E.; Crandall, J.E.; Rubenstein, J.L.; Bhide, P.G. Compartment-specific transcription factors orchestrate angiogenesis gradients in the embryonic brain. Nat. Neurosci. 2008, 11, 429–439. [Google Scholar] [CrossRef] [Green Version]
  12. St-Onge, L.; Sosa-Pineda, B.; Chowdhury, K.; Mansouri, A.; Gruss, P. Pax6 is required for differentiation of glucagon-producing alpha-cells in mouse pancreas. Nature 1997, 387, 406–409. [Google Scholar] [CrossRef]
  13. Sander, M.; Neubüser, A.; Kalamaras, J.; Ee, H.C.; Martin, G.R.; German, M.S. Genetic analysis reveals that PAX6 is required for normal transcription of pancreatic hormone genes and islet development. Genes Dev. 1997, 11, 1662–1673. [Google Scholar] [CrossRef] [Green Version]
  14. Hart, A.W.; Mella, S.; Mendrychowski, J.; van Heyningen, V.; Kleinjan, D.A. The developmental regulator Pax6 is essential for maintenance of islet cell function in the adult mouse pancreas. PLoS ONE 2013, 8, e54173. [Google Scholar] [CrossRef] [Green Version]
  15. Ahmad, Z.; Rafeeq, M.; Collombat, P.; Mansouri, A. Pax6 inactivation in the adult pancreas reveals ghrelin as endocrine cell maturation marker. PLoS ONE 2015, 10, e0144597. [Google Scholar] [CrossRef] [Green Version]
  16. Ashery-Padan, R.; Zhou, X.; Marquardt, T.; Herrera, P.; Toube, L.; Berry, A.; Gruss, P. Conditional inactivation of Pax6 in the pancreas causes early onset of diabetes. Dev. Biol. 2004, 269, 479–488. [Google Scholar] [CrossRef] [Green Version]
  17. Muratovska, A.; Zhou, C.; He, S.; Goodyer, P.; Eccles, M.R. Paired-Box genes are frequently expressed in cancer and often required for cancer cell survival. Oncogene 2003, 22, 7989–7997. [Google Scholar] [CrossRef] [Green Version]
  18. Robson, E.J.D.; He, S.J.; Eccles, M.R. A PANorama of PAX genes in cancer and development. Nat. Rev. Cancer 2006, 6, 52–62. [Google Scholar] [CrossRef]
  19. Zhou, Y.H.; Wu, X.; Tan, F.; Shi, Y.X.; Glass, T.; Liu, T.J.; Wathen, K.; Hess, K.R.; Gumin, J.; Lang, F.; et al. PAX6 suppresses growth of human glioblastoma cells. J. Neurooncol. 2005, 71, 223–229. [Google Scholar] [CrossRef]
  20. Mayes, D.A.; Hu, Y.; Teng, Y.; Siegel, E.; Wu, X.; Panda, K.; Tan, F.; Yung, W.K.; Zhou, Y.H. PAX6 suppresses the invasiveness of glioblastoma cells and the expression of the matrix metalloproteinase-2 gene. Cancer Res. 2006, 66, 9809–9817. [Google Scholar] [CrossRef] [Green Version]
  21. Shyr, C.R.; Tsai, M.Y.; Yeh, S.; Kang, H.Y.; Chang, Y.C.; Wong, P.L.; Huang, C.C.; Huang, K.E.; Chang, C. Tumor suppressor PAX6 functions as androgen receptor co-repressor to inhibit prostate cancer growth. Prostate 2010, 70, 190–199. [Google Scholar] [CrossRef] [Green Version]
  22. Kudo, A.; Akahoshi, K.; Ito, S.; Akashi, T.; Shimada, S.; Toshiro, O.; Ogawa, K.; Ono, H.; Mitsunori, Y.; Ban, D.; et al. Downregulated pancreatic beta cell genes indicate poor prognosis in patients with pancreatic neuroendocrine neoplasms. Ann. Surg. 2020, 271, 732–739. [Google Scholar] [CrossRef]
  23. Zhang, X.; Yang, X.; Wang, J.; Liang, T.; Gu, Y.; Yang, D. Down-regulation of PAX6 by promoter methylation is associated with poor prognosis in non small cell lung cancer. Int. J. Clin. Exp. Pathol. 2015, 8, 11452–11457. [Google Scholar]
  24. Kiselev, Y.; Andersen, S.; Johannessen, C.; Fjukstad, B.; Standahl Olsen, K.; Stenvold, H.; Al-Saad, S.; Donnem, T.; Richardsen, E.; Bremnes, R.M.; et al. Transcription factor PAX6 as a novel prognostic factor and putative tumour suppressor in non-small cell lung cancer [sci. rep., 5059]. Sci. Rep. 2018, 8, 5059. [Google Scholar]
  25. Zhou, Y.H.; Tan, F.; Hess, K.R.; Yung, W.K.A. The expression of PAX6, PTEN, vascular endothelial growth factor, and epidermal growth factor receptor in gliomas: Relationship to tumor grade and survival. Clin. Cancer Res. 2003, 9, 3369–3375. [Google Scholar]
  26. Lai, J.P.; Mertens, R.B.; Mirocha, J.; Koo, J.; Venturina, M.; Chung, F.; Mendez, A.B.; Kahn, M.; Dhall, D. Comparison of PAX6 and PAX8 as immunohistochemical markers for pancreatic neuroendocrine tumors. Endocr. Pathol. 2015, 26, 54–62. [Google Scholar]
  27. Zhang, L.; Smyrk, T.C.; Oliveira, A.M.; Lohse, C.M.; Zhang, S.; Johnson, M.R.; Lloyd, R.V. KIT is an independent prognostic marker for pancreatic endocrine tumors: A finding derived from analysis of islet cell differentiation markers. Am. J. Surg. Pathol. 2009, 33, 1562–1569. [Google Scholar]
  28. Kartalis, N.; Mucelli, R.M.P.; Sundin, A. Recent developments in imaging of pancreatic neuroendocrine tumors. Ann. Gastroenterol. 2015, 28, 193–202. [Google Scholar]
  29. Lewis, R.B.; Lattin, G.E., Jr.; Paal, E. Pancreatic endocrine tumors: Radiologic-clinicopathologic correlation. RadioGraphics 2010, 30, 1445–1464. [Google Scholar]
  30. Humphrey, P.E.; Alessandrino, F.; Bellizzi, A.M.; Mortele, K.J. Non-hyperfunctioning pancreatic endocrine tumors: Multimodality imaging features with histopathological correlation. Abdom. Imaging 2015, 40, 2398–2410. [Google Scholar] [PubMed]
  31. Jeon, S.K.; Lee, J.M.; Joo, I.; Lee, E.S.; Park, H.J.; Jang, J.Y.; Ryu, J.K.; Lee, K.B.; Han, J.K. Nonhypervascular pancreatic neuroendocrine tumors: Differential diagnosis from pancreatic ductal adenocarcinomas at MR imaging-retrospective cross-sectional study. Radiology 2017, 284, 77–87. [Google Scholar] [PubMed] [Green Version]
  32. Worhunsky, D.J.; Krampitz, G.W.; Poullos, P.D.; Visser, B.C.; Kunz, P.L.; Fisher, G.A.; Norton, J.A.; Poultsides, G.A. Pancreatic neuroendocrine tumours: Hypoenhancement on arterial phase computed tomography predicts biological aggressiveness. HPB 2014, 16, 304–311. [Google Scholar] [CrossRef] [PubMed] [Green Version]
  33. Hyodo, R.; Suzuki, K.; Ogawa, H.; Komada, T.; Naganawa, S. Pancreatic neuroendocrine tumors containing areas of iso- or hypoattenuation in dynamic contrast-enhanced computed tomography: Spectrum of imaging findings and pathological grading. Eur. J. Radiol. 2015, 84, 2103–2109. [Google Scholar] [CrossRef] [PubMed]
  34. Belousova, E.; Karmazanovsky, G.; Kriger, A.; Kalinin, D.; Mannelli, L.; Glotov, A.; Karelskaya, N.; Paklina, O.; Kaldarov, A. Contrast-enhanced MDCT in patients with pancreatic neuroendocrine tumours: Correlation with histological findings and diagnostic performance in differentiation between tumour grades. Clin. Radiol. 2017, 72, 150–158. [Google Scholar] [CrossRef] [Green Version]
  35. Rodallec, M.; Vilgrain, V.; Couvelard, A.; Rufat, P.; O’Toole, D.; Barrau, V.; Sauvanet, A.; Ruszniewski, P.; Menu, Y. Endocrine pancreatic tumours and helical CT: Contrast enhancement is correlated with microvascular density, histoprognostic factors and survival. Pancreatology 2006, 6, 77–85. [Google Scholar] [CrossRef]
  36. Vicentini, C.; Fassan, M.; D’Angelo, E.; Corbo, V.; Silvestris, N.; Nuovo, G.J.; Scarpa, A. Clinical application of microRNA testing in neuroendocrine tumors of the gastrointestinal tract. Molecules 2014, 19, 2458–2468. [Google Scholar] [CrossRef] [Green Version]
  37. Lo Gullo, R.; Daimiel, I.; Morris, E.A.; Pinker, K. Combining molecular and imaging metrics in cancer: Radiogenomics. Insights Imaging 2020, 11, 1. [Google Scholar] [CrossRef]
  38. d’Assignies, G.; Couvelard, A.; Bahrami, S.; Vullierme, M.P.; Hammel, P.; Hentic, O.; Sauvanet, A.; Bedossa, P.; Ruszniewski, P.; Vilgrain, V. Pancreatic endocrine tumors: Tumor blood flow assessed with perfusion CT reflects angiogenesis and correlates with prognostic factors. Radiology 2009, 250, 407–416. [Google Scholar] [CrossRef]
  39. Kim, J.H.; Eun, H.W.; Kim, Y.J.; Lee, J.M.; Han, J.K.; Choi, B.I. Pancreatic neuroendocrine tumour (PNET): Staging accuracy of MDCT and its diagnostic performance for the differentiation of PNET with uncommon CT findings from pancreatic adenocarcinoma. Eur. Radiol. 2016, 26, 1338–1347. [Google Scholar] [CrossRef] [PubMed]
  40. Kim, D.W.; Kim, H.J.; Kim, K.W.; Byun, J.H.; Song, K.B.; Kim, J.H.; Hong, S.M. Neuroendocrine neoplasms of the pancreas at dynamic enhanced CT: Comparison between grade 3 neuroendocrine carcinoma and grade 1/2 neuroendocrine tumour. Eur. Radiol. 2015, 25, 1375–1383. [Google Scholar] [CrossRef] [PubMed]
  41. Yamamoto, Y.; Okamura, Y.; Uemura, S.; Sugiura, T.; Ito, T.; Ashida, R.; Kato, Y.; Ohgi, K.; Yamada, M.; Sasaki, K.; et al. Vascularity and tumor size are significant predictors for recurrence after resection of a pancreatic neuroendocrine tumor. Ann. Surg. Oncol. 2017, 24, 2363–2370. [Google Scholar] [CrossRef]
  42. Takumi, K.; Fukukura, Y.; Higashi, M.; Ideue, J.; Umanodan, T.; Hakamada, H.; Kanetsuki, I.; Yoshiura, T. Pancreatic neuroendocrine tumors: Correlation between the contrast-enhanced computed tomography features and the pathological tumor grade. Eur. J. Radiol. 2015, 84, 1436–1443. [Google Scholar] [CrossRef]
  43. Gallotti, A.; Johnston, R.P.; Bonaffini, P.A.; Ingkakul, T.; Deshpande, V.; Fernández-del Castillo, C.; Sahani, D.V. Incidental neuroendocrine tumors of the pancreas: MDCT findings and features of malignancy. Am. J. Roentgenol. 2013, 200, 355–362. [Google Scholar] [CrossRef]
  44. Karmazanovsky, G.; Belousova, E.; Schima, W.; Glotov, A.; Kalinin, D.; Kriger, A. Nonhypervascular pancreatic neuroendocrine tumors: Spectrum of MDCT imaging findings and differentiation from pancreatic ductal adenocarcinoma. Eur. J. Radiol. 2019, 110, 66–73. [Google Scholar] [CrossRef] [PubMed]
  45. Nishida, N.; Yano, H.; Nishida, T.; Kamura, T.; Kojiro, M. Angiogenesis in cancer. Vasc. Health Risk Manag. 2006, 2, 213–219. [Google Scholar] [CrossRef] [PubMed]
  46. Maxwell, J.E.; Sherman, S.K.; Howe, J.R. Translational diagnostics and therapeutics in pancreatic neuroendocrine tumors. Clin. Cancer Res. 2016, 22, 5022–5029. [Google Scholar] [CrossRef] [Green Version]
  47. Tang, C.T.; Zhang, Q.W.; Wu, S.; Tang, M.Y.; Liang, Q.; Lin, X.L.; Gao, Y.; Ge, Z. Thalidomide Targets EGFL6 to Inhibit EGFL6/PAX6 Axis-Driven Angiogenesis in Small Bowel Vascular Malformation. Cell. Mol. Life Sci. 2020. [Tang, C.; Zhang, Q.; Wu, S.; Tang, M.; Liang, Q.; Lin, X.; Gao, Y.; Ge, Z. Online. Cell. Mol. Life Sci. Ahead of print]. [Google Scholar] [CrossRef] [Green Version]
  48. Zhou, Y.H.; Hu, Y.; Mayes, D.; Siegel, E.; Kim, J.G.; Mathews, M.S.; Hsu, N.; Eskander, D.; Yu, O.; Tromberg, B.J.; et al. PAX6 suppression of glioma angiogenesis and the expression of vascular endothelial growth factor A. J. Neurooncol. 2010, 96, 191–200. [Google Scholar] [CrossRef] [PubMed] [Green Version]
  49. Corrias, G.; Monti, S.; Horvat, N.; Tang, L.; Basturk, O.; Saba, L.; Mannelli, L. Imaging features of malignant abdominal neuroendocrine tumors with rare presentation. Clin. Imaging 2018, 51, 59–64. [Google Scholar] [CrossRef]
  50. Gabriel, M.; Decristoforo, C.; Kendler, D.; Dobrozemsky, G.; Heute, D.; Uprimny, C.; Kovacs, P.; Von, G.E.; Bale, R.; Virgolini, I.J. 68Ga-DOTA-Tyr3-octreotide PET in neuroendocrine tumors: Comparison with somatostatin receptor scintigraphy and CT. J. Nucl. Med. 2007, 48, 508–518. [Google Scholar] [CrossRef]
  51. Ambrosini, V.; Campana, D.; Tomassetti, P.; Fanti, S. 68Ga-labelled peptides for diagnosis of gastroenteropancreatic NET. Eur. J. Nucl. Med. Mol. Imaging 2012, 39 (Suppl 1), S52–S60. [Google Scholar] [CrossRef]
  52. Kayani, I.; Conry, B.G.; Groves, A.M.; Win, T.; Dickson, J.; Caplin, M.; Bomanji, J.B. A comparison of 68Ga-DOTATATE and 18F-FDG PET/CT in pulmonary neuroendocrine tumors. J. Nucl. Med. 2009, 50, 1927–1932. [Google Scholar]
  53. Hofman, M.S.; Lau, W.F.; Hicks, R.J. Somatostatin receptor imaging with 68Ga DOTATATE PET/CT: Clinical utility, normal patterns, pearls, and pitfalls in interpretation. RadioGraphics 2015, 35, 500–516. [Google Scholar]
Figure 1. Representative immunohistochemistry images of high PAX6 expression; and (a) low PAX6 expression; (b) in primary tumors.
Diagnostics 10 00919 g001
Figure 2. Classification of tumor homogeneity, according to arterial (a,b) and portal phase (c,d). (a) A 62-year-old man with Pan-NEN shows homogeneous enhancement at the arterial phase over the whole area. (b) A 51-year-old woman with Pan-NEN shows heterogeneous enhancement at the arterial phase: the tumor contains a large area of weak to moderate enhancements (arrows) and shows strong enhancement in part of the area (arrowheads). (c) A 65-year-old woman with Pan-NEN shows homogeneous enhancement at the portal phase over the whole tumor. The arrow indicates the nodular calcification. (d) An 80-year-old woman with Pan-NEN shows heterogeneous enhancement at the portal phase, the tumor contains the area of both strong and weak enhancements.
Diagnostics 10 00919 g002
Figure 3. Representative images with region of interest drawn in the Pan-NEN tumor (arrow) and normal pancreatic parenchyma (arrowhead) at the arterial phase.
Diagnostics 10 00919 g003
Figure 4. Representative images of Pan-NEN with low PAX6 expression in a 43-year-old man. Compared with normal pancreatic parenchyma, the round mass in the pancreatic tail (arrows) shows hypoenhancement over the entire area in the arterial; and (a) portal; (b) phases.
Diagnostics 10 00919 g004
Figure 5. Representative images of Pan-NEN with high PAX6 expression in a 64-year-old woman. Compared with normal pancreatic parenchyma, the round mass in the pancreatic head (arrows) shows a hyperenhancement in the arterial phase; (a) persistence of the hyperenhancement in the portal; and (b) phase.
Diagnostics 10 00919 g005
Figure 6. Representative immunohistochemistry images of Ki-67 according to high PAX6 expression (a) and low PAX6 expression (b) in primary tumors. (a) A 57-year-old man with NET G1. Ki-67 immunostaining shows positive in 1.0% of tumor cells. (b) A 77-year-old man with NET G2. Ki-67 immunostaining shows positive in 9.4% of tumor cells.
Diagnostics 10 00919 g006
Figure 7. Receiver operating characteristic curves based on arterial and portal enhancement ratio and the optimal cut-off values for differentiating low PAX6 from high PAX6 expression of Pan-NENs.
Diagnostics 10 00919 g007
Table 1. Patient characteristics according to PAX6 expression.
CharacteristicLow PAX6
Expression Group
(n = 11)
High PAX6
Expression Group
(n = 40)
p Value a
Age (y) b53 ± 1561 ± 110.14
Male sex6160.50
Genetic disorder110.39
Time from CT to surgery (d) c24 [6.5, 43]34 [8.75, 76.5]0.43
2010 WHO classification
  NET G16330.049
  NET G247
  NEC G310
Ki-67 index (%) b6.25 ± 8.851.81 ± 1.720.021
Mitotic count (n/10 HPF) b1.45 ± 1.860.80 ± 0.940.11
Symptomatic tumor2130.47
Metachronous hepatic metastasis210.11
Death200.043
Unless otherwise specified, data indicate the number of patients. a p values were calculated using Fisher’s exact test for categorical variables and Mann–Whitney U test for continuous variables. b mean ± standard deviation. c median [1st quartile, 3rd quartile]. Abbreviations: PAX6, paired box 6; CT, computed tomography; NET G1, neuroendocrine tumor grade 1; NET G2, neuroendocrine tumor grade 2; NEC G3, neuroendocrine carcinoma grade 3; HPF, high power field.
Table 2. Morphological features according to PAX6 expression.
FeaturesLow PAX6
Expression Group
(n = 11)
High PAX6
Expression Group
(n = 40)
kp Value a
Size (mm) b18.6 [13.5, 44.0]15.5 [10.1, 21.8] 0.24
Location
  Head5160.760.28
  Body09
  Tail615
Shape
  Round2150.500.44
  Oval721
  Lobulated24
Margin (well-defined)9350.450.63
Cystic change150.461.00
Calcification440.920.055
Visible intratumoral vessel150.731.00
Invasion into adjacent vascular230.630.29
Main pancreatic duct dilatation120.840.52
Upstream pancreatic atrophy210.640.11
Unless otherwise specified, data indicate the number of patients. a p values were calculated using Fisher’s exact test for categorical variables and Mann–Whitney U test for continuous variables. b median [1st quartile, 3rd quartile]. Abbreviation: PAX6, paired box 6.
Table 3. Enhancement patterns according to PAX6 expression.
Low PAX6
Expression Group
(n = 11)
High PAX6
Expression Group
(n = 40)
kp Value a
Tumor homogeneity
 Arterial phase
  Homogeneous8260.690.73
  Heterogeneous314
 Portal phase
  Homogeneous8290.771.00
  Heterogeneous311
Main enhancement types
 Arterial phase
  Hyperenhancement4320.640.009
  Iso- or hypoenhancement b7 (3, 4)8 (6, 2)
 Portal phase
  Hyperenhancement3330.760.001
  Iso- or hypoenhancement b8 (6, 2)7 (6, 1)
Enhancement ratio c
  Arterial phase1.19 ± 0.441.38 ± 0.36 0.28
  Portal phase1.12 ± 0.281.30 ± 0.22 0.044
Unless otherwise specified, data indicate the number of patients. a p values were calculated using Fisher’s exact test for categorical variables and Mann–Whitney U test for continuous variables. b Data in parentheses are number of iso- and hypoenhancement tumors. c mean ± standard deviation. Abbreviation: PAX6, paired box 6.
Table 4. Diagnostic performance of the three significant enhancement features and their combination in predicting low PAX6 Pan-NENs.
Parameter Sensitivity (%)Specificity (%)Accuracy (%)Positive LR Negative LR
Iso- or hypoenhancement types on the arterial phase63.6 (30.8, 89.1)
[7/11]
80.0 (64.4, 90.9)
[32/40]
76.5 (62.5, 87.2)
[39/51]
3.18 (1.48, 6.83)0.46 (0.21, 1.01)
Iso- or hypoenhancement types on the portal phase72.7 (39.0, 94.0)
[8/11]
82.5 (67.2, 92.7)
[33/40]
80.4 (66.9, 90.2)
[41/51]
4.16 (1.94, 8.92)0.33 (0.13, 0.88)
Enhancement ratio on the portal phase ≤ 1.2272.7 (39.0, 94.0)
[8/11]
70.0 (53.5, 83.4)
[28/40]
70.6 (56.2, 82.5)
[36/51]
2.42 (1.34, 4.40)0.39 (0.15, 1.04)
At least one parameter81.8 (48.2, 97.7)
[9/11]
60.0 (43.3, 75.1)
[24/40]
64.7 (50.1, 77.6)
[33/51]
2.05 (1.28, 3.26)0.30 (0.08, 1.09)
Any two parameters72.7 (39.0, 94.0)
[8/11]
80.0 (64.4, 90.9)
[32/40]
78.4 (64.7, 88.7)
[40/51]
3.64 (1.77, 7.45)0.34 (0.13, 0.91)
All three parameters54.5 (23.4, 83.3)
[6/11]
92.5 (79.6, 98.4)
[37/40]
84.3 (71.4, 93.0)
[43/51]
7.27 (2.16, 24.5)0.49 (0.26, 0.94)
Data in parentheses are 95% confidence intervals; data in brackets are numerator/denominator. Abbreviation: LR, likelihood ratio.
Table 5. Morphological features according to Ki-67 proliferative index and mitotic count.
Ki-67 Proliferative IndexMitotic Count
Features≤2%:
Low Group
(n = 35)
>2%:
High Group
(n = 16)
p Value a<2 n/10 HPF:
Low Group
(n = 47)
≥2 n/10 HPF:
High Group
(n = 4)
p Value a
Size (mm) b15.0
[10.6, 17.8]
28.3
[14.5, 54.3]
0.01215.3
[10.0, 20.1]
57.9
[42.2, 76.7]
0.004
Location
  Head1470.851921.00
  Body72 90
  Tail147 192
Shape
  Round1340.151700.24
  Oval208 253
  Lobulated24 51
Margin (well-defined)33110.0254130.46
Cystic change330.36420.063
Calcification260.008530.009
Visible intratumoral vessel240.069510.40
Invasion into adjacent vascular230.309410.35
Main pancreatic duct dilatation120.23210.22
Upstream pancreatic atrophy120.23210.22
Unless otherwise specified, data indicate the number of patients. a p values were calculated using Fisher’s exact test for categorical variables and Mann–Whitney U test for continuous variables. b median [1st quartile, 3rd quartile]. Abbreviation: HPF, high power field.
Table 6. Enhancement patterns according to Ki-67 proliferative index and mitotic count.
Ki-67 Proliferative IndexMitotic Count
Features≤2%:
Low Group
(n = 35)
>2%:
High Group
(n = 16)
p Value a<2 n/10 HPF:
Low Group
(n = 47)
≥2 n/10 HPF:
High Group
(n = 4)
p Value a
Tumor homogeneity
 Arterial phase
  Homogeneous24100.753310.10
  Heterogeneous116 143
 Portal phase
  Homogeneous27100.323610.057
  Heterogeneous86 113
Main enhancement types
 Arterial phase
  Hyperenhancement2880.0463420.57
  Iso- or hypoenhancement b7 (3, 4)8 (6, 2) 13 (8, 5)2 (1, 1)
 Portal phase
  Hyperenhancement25111.003331.00
  Iso- or hypoenhancement b10 (8, 2)5 (4, 1) 14 (12, 2)1 (0, 1)
Enhancement ratio c
  Arterial phase1.38 ± 0.411.24 ± 0.320.0961.36 ± 0.391.13 ± 0.200.19
  Portal phase1.27 ± 0.231.27 ± 0.270.961.26 ± 0.231.24 ± 0.390.57
Unless otherwise specified, data indicate the number of patients. a p values were calculated using Fisher’s exact test for categorical variables and Mann–Whitney U test for continuous variables. b Data in parentheses are the number of iso- and hypoenhancement tumors, respectively. c mean ± standard deviation. Abbreviation: HPF, high power field.
Publisher’s Note: MDPI stays neutral with regard to jurisdictional claims in published maps and institutional affiliations.

