Allele-Specific PCR for KRAS Mutation Detection Using Phosphoryl Guanidine Modified Primers

 ,
,  , and
, and
Abstract

1. Introduction
2. Materials and Methods
2.1. Synthesis and Isolation of Oligonucleotides
2.2. Plasmid Standards
2.3. Real-Time PCR
3. Results and Discussion
3.1. Effect of the Number of PG Groups and Their Position from 3′ End of the Primer on the AS-PCR Results
3.2. Allele-Specific PG-Modified Primer Improves Discrimination of Mutant and WT DNA
3.3. Simultaneous Efficiency of PG Modification and Mismatches in the Primers Structure
3.4. Detection Limit and Specificity Investigation of the Synthesized PG-Modified Primers
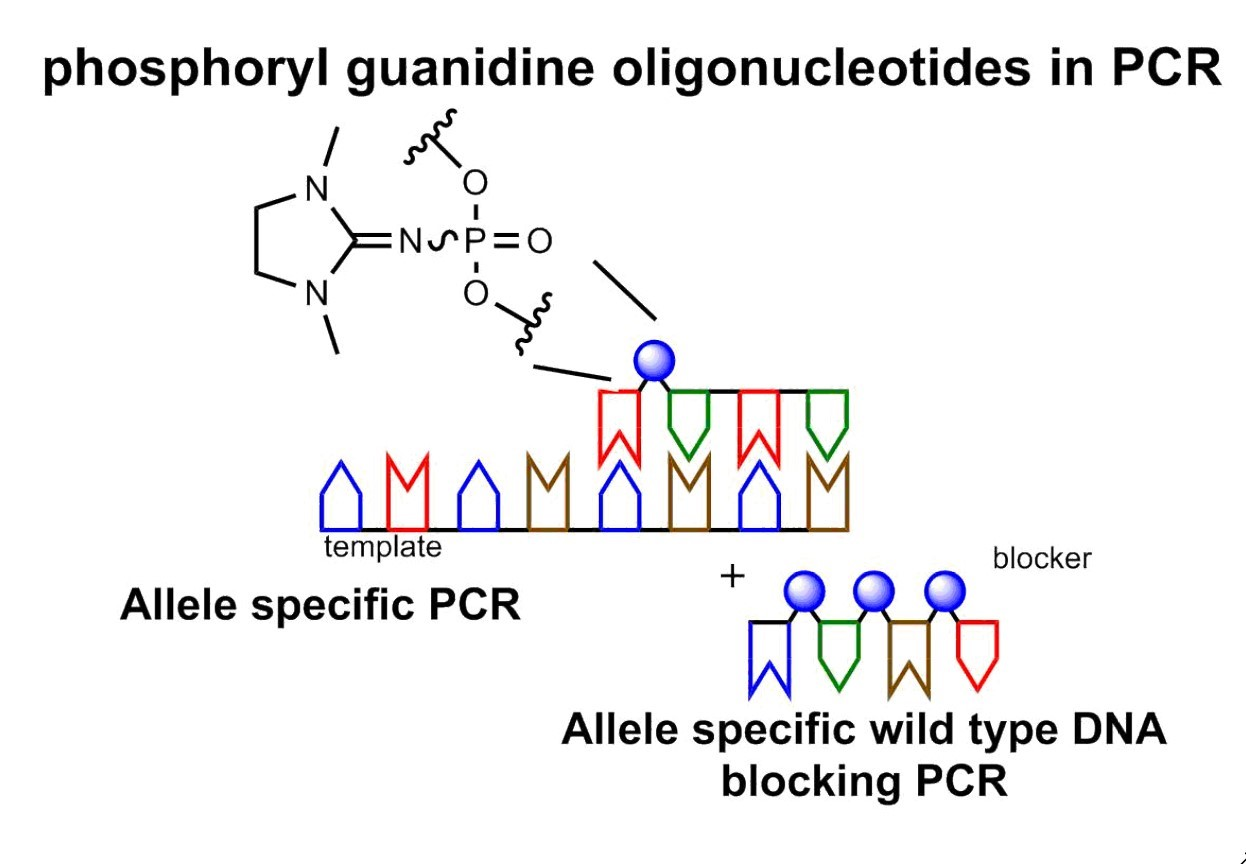
3.5. Improving AS-PCR Specificity by Wild-Type DNA Blocking PCR
4. Conclusions
Supplementary Materials
Author Contributions
Funding
Conflicts of Interest
References
- Anderson, S.M. Laboratory methods for KRAS mutation analysis. Expert Rev. Mol. Diagn. 2011, 11, 635–642. [Google Scholar] [CrossRef] [PubMed]
- Ishige, T.; Itoga, S.; Matsushita, K. Locked Nucleic Acid Technology for Highly Sensitive Detection of Somatic Mutations in Cancer; Elsevier BV: New York, NY, USA, 2018; Volume 83, pp. 53–72. Available online: https://www.sciencedirect.com/science/article/pii/S0065242317300616?via%3Dihub (accessed on 24 October 2020).
- Serebriiskii, I.G.; Connelly, C.; Frampton, G.; Newberg, J.; Cooke, M.; Miller, V.; Ali, S.; Ross, J.S.; Handorf, E.; Arora, S.; et al. Comprehensive characterization of RAS mutations in colon and rectal cancers in old and young patients. Nat. Commun. 2019, 10, 1–12. [Google Scholar] [CrossRef] [PubMed]
- Nagakubo, Y.; Hirotsu, Y.; Amemiya, K.; Oyama, T.; Mochizuki, H.; Omata, M. Accurate detection of KRAS, NRAS and BRAF mutations in metastatic colorectal cancers by bridged nucleic acid-clamp real-time PCR. BMC Med. Genom. 2019, 12, 162. [Google Scholar] [CrossRef]
- Jackson, M.P.; Truong, D.; Brownlow, M.L.; Wagner, J.A.; McKinley, R.A.; Bikson, M.; Jankord, R. Safety parameter considerations of anodal transcranial Direct Current Stimulation in rats. Brain Behav. Immun. 2017, 64, 152–161. [Google Scholar] [CrossRef] [PubMed]
- Lin, M.-T.; Mosier, S.L.; Thiess, M.; Beierl, K.F.; Debeljak, M.; Tseng, L.-H.; Chen, G.; Yegnasubramanian, S.; Ho, H.; Cope, L.; et al. Clinical Validation of KRAS, BRAF, and EGFR Mutation Detection Using Next-Generation Sequencing. Am. J. Clin. Pathol. 2014, 141, 856–866. [Google Scholar] [CrossRef] [PubMed]
- Tímár, J.; Kashofer, K. Molecular epidemiology and diagnostics of KRAS mutations in human cancer. Cancer Metastasis Rev. 2020, 1–10. [Google Scholar] [CrossRef]
- OPATHY Consortium; Arastehfar, A.; Boekhout, T.; Butler, G.; De Cesare, G.B.; Dolk, E.; Gabaldóln, T.; Hafez, A.I.; Hube, B.; Hagen, F.; et al. Recent trends in molecular diagnostics of yeast infections: From PCR to NGS. FEMS Microbiol. Rev. 2019, 43, 517–547. [Google Scholar] [CrossRef]
- Van Dijk, E.L.; Jaszczyszyn, Y.; Naquin, D.; Thermes, C. The Third Revolution in Sequencing Technology. Trends Genet. 2018, 34, 666–681. [Google Scholar] [CrossRef]
- Liu, Y.-P.; Wu, H.-Y.; Yang, X.; Xu, H.-Q.; Chen, D.; Huang, Q.; Fu, W.-L. Diagnostic accuracy of high resolution melting analysis for detection of KRAS mutations: A systematic review and meta-analysis. Sci. Rep. 2014, 4, 7521. [Google Scholar] [CrossRef]
- Rejali, N.A.; Moric, E.; Wittwer, C.T. The Effect of Single Mismatches on Primer Extension. Clin. Chem. 2018, 64, 801–809. [Google Scholar] [CrossRef]
- Morlan, J.; Baker, J.; Sinicropi, D. Mutation Detection by Real-Time PCR: A Simple, Robust and Highly Selective Method. PLoS ONE 2009, 4, e4584. [Google Scholar] [CrossRef]
- Wang, H.; Jiang, J.; Mostert, B.; Sieuwerts, A.M.; Martens, J.W.; Sleijfer, S.; Foekens, J.; Wang, Y. Allele-Specific, Non-Extendable Primer Blocker PCR (AS-NEPB-PCR) for DNA Mutation Detection in Cancer. J. Mol. Diagn. 2013, 15, 62–69. [Google Scholar] [CrossRef] [PubMed]
- McKinzie, P.B.; Parsons, B.L. Detection of rare K-ras codon 12 mutations using allele-specific competitive blocker PCR. Mutat. Res. Mol. Mech. Mutagen. 2002, 517, 209–220. [Google Scholar] [CrossRef]
- Navarro, E.; Serrano-Heras, G.; Castaño, M.; Solera, J. Real-time PCR detection chemistry. Clin. Chim. Acta 2015, 439, 231–250. [Google Scholar] [CrossRef] [PubMed]
- Li, T.-L.; Wu, M.-W.; Lin, W.-C.; Lai, C.-H.; Chang, Y.-H.; Su, L.-J.; Chen, W.-Y. Designed phosphate-methylated oligonucleotides as PCR primers for SNP discrimination. Anal. Bioanal. Chem. 2019, 411, 3871–3880. [Google Scholar] [CrossRef]
- Yang, H.-L.; Jiang, H.-J.; Fang, W.-Y.; Xu, Y.-Y.; Li, K.; Zhang, J.; Liao, D.-F.; He, F.-C. High fidelity PCR with an off/on switch mediated by proofreading polymerases combining with phosphorothioate-modified primer. Biochem. Biophys. Res. Commun. 2005, 328, 265–272. [Google Scholar] [CrossRef]
- D’Agata, R.; Giuffrida, M.C.; Spoto, G. Peptide Nucleic Acid-Based Biosensors for Cancer Diagnosis. Molecules 2017, 22, 1951. [Google Scholar] [CrossRef]
- Gupta, A.; Mishra, A.; Puri, N. Peptide nucleic acids: Advanced tools for biomedical applications. J. Biotechnol. 2017, 259, 148–159. [Google Scholar] [CrossRef]
- Saarbach, J.; Sabale, P.M.; Winssinger, N. Peptide nucleic acid (PNA) and its applications in chemical biology, diagnostics, and therapeutics. Curr. Opin. Chem. Biol. 2019, 52, 112–124. [Google Scholar] [CrossRef]
- Ballantyne, K.N.; Van Oorschot, R.; Mitchell, R. Locked nucleic acids in PCR primers increase sensitivity and performance. Genomics 2008, 91, 301–305. [Google Scholar] [CrossRef]
- Kuo, T.-C.; Wu, M.-W.; Lin, W.-C.; Matulis, D.; Yang, Y.-S.; Li, S.-Y.; Chen, W.-Y. Reduction of interstrand charge repulsion of DNA duplexes by salts and by neutral phosphotriesters—Contrary effects for harnessing duplex formation. J. Taiwan Inst. Chem. Eng. 2020, 110, 1–7. [Google Scholar] [CrossRef]
- Kupryushkin, M.S.; Pyshnyi, D.V.; Stetsenko, D.A. Phosphoryl Guanidines: A New Type of Nucleic Acid Analogues. Acta Nat. 2014, 6, 116–118. [Google Scholar] [CrossRef]
- Stetsenko, D.A.; Kupryushkin, M.S.; Pyshnyi, D. Modified Oligonucleotides and Methods for Their Synthesis. WO2016028187A1, 25 February 2016. [Google Scholar]
- Dyudeeva, E.S.; Kupryushkin, M.S.; Lomzov, A.A.; Pyshnaya, I.A.; Pyshnyi, D.V. Physicochemical Properties of the Phosphoryl Guanidine Oligodeoxyribonucleotide Analogs. Russ. J. Bioorg. Chem. 2019, 45, 709–718. [Google Scholar] [CrossRef]
- Lomzov, A.A.; Kupryushkin, M.S.; Shernyukov, A.V.; Nekrasov, M.D.; Dovydenko, I.S.; Stetsenko, D.A.; Pyshnyi, D.V. Diastereomers of a mono-substituted phosphoryl guanidine trideoxyribonucleotide: Isolation and properties. Biochem. Biophys. Res. Commun. 2019, 513, 807–811. [Google Scholar] [CrossRef] [PubMed]
- Dmitrienko, E.V.; Naumova, O.V.; Fomin, B.; Kupryushkin, M.; Volkova, A.; Amirkhanov, N.; Semenov, D.; Pyshnaya, I.; Pyshnyi, D.V. Surface modification of SOI-FET sensors for label-free and specific detection of short RNA analyte. Nanomedicine 2016, 11, 2073–2082. [Google Scholar] [CrossRef] [PubMed]
- Garafutdinov, R.R.; Sakhabutdinova, A.R.; Kupryushkin, M.S.; Pyshnyi, D.V. Prevention of DNA multimerization using phosphoryl guanidine primers during isothermal amplification with Bst exo-DNA polymerase. Biochimie 2020, 168, 259–267. [Google Scholar] [CrossRef] [PubMed]
- Epanchintseva, A.; Dolodoev, A.; Grigor’Eva, A.; Chelobanov, B.; Pyshnyi, D.V.; Ryabchikova, E.I.; Pyshnaya, I. Non-covalent binding of nucleic acids with gold nanoparticles provides their stability and effective desorption in environment mimicking biological media. Nanotechnology 2018, 29, 355601. [Google Scholar] [CrossRef]
- Kuznetsov, N.A.; Kupryushkin, M.S.; Abramova, T.; Kuznetsova, A.A.; Miroshnikova, A.D.; Stetsenko, D.A.; Pyshnyi, D.V.; Fedorova, O.S. New oligonucleotide derivatives as unreactive substrate analogues and potential inhibitors of human apurinic/apyrimidinic endonuclease APE1. Mol. BioSyst. 2016, 12, 67–75. [Google Scholar] [CrossRef]
- Lebedeva, N.A.; Anarbaev, R.O.; Kupryushkin, M.S.; Rechkunova, N.I.; Pyshnyi, D.V.; Stetsenko, D.A.; Lavrik, O.I. Design of a New Fluorescent Oligonucleotide-Based Assay for a Highly Specific Real-Time Detection of Apurinic/Apyrimidinic Site Cleavage by Tyrosyl-DNA Phosphodiesterase 1. Bioconjug. Chem. 2015, 26, 2046–2053. [Google Scholar] [CrossRef]
- Kupryushkin, M.S.; Pyshnaya, I.A.; Dmitrienko, E.V.; Stetsenko, D.A.; Filipenko, M.L.; Oscorbin, I.P.; Stepanov, G.A.; Richter, V.A.; Ivanov, M.K.; Pyshnyi, D.V. Template-Directed Enzymatic DNA Synthesis Using Phosphoryl Guanidine Oligonucleotides. 2019. Available online: https://patentscope.wipo.int/search/en/detail.jsf?docId=WO2019112485 (accessed on 24 October 2020).
- Kupryushkin, M.S.; Pyshnaya, I.A.; Dmitrienko, E.V.; Stetsenko, D.A.; Filipenko, M.L.; Oscorbin, I.P.; Stepanov, G.A.; Richter, V.A.; Ivanov, M.K.; Pyshnyi, D.V. The Method of Amplification of Nucleic Acids Using Phosphoryl Guanidine Oligonucleotides. 2017. Available online: https://patentscope.wipo.int/search/en/detail.jsf?docId=WO2019112485 (accessed on 24 October 2020).
- Vinogradova, O.A.; Pyshnyi, D.V. Selectivity of Enzymatic Conversion of Oligonucleotide Probes during Nucleotide Polymorphism Analysis of DN. Acta Nat. 2010, 2, 36–52. [Google Scholar] [CrossRef]
- Lang, A.H.; Drexel, H.; Geller-Rhomberg, S.; Stark, N.; Winder, T.; Geiger, K.; Muendlein, A. Optimized Allele-Specific Real-Time PCR Assays for the Detection of Common Mutations in KRAS and BRAF. J. Mol. Diagn. 2011, 13, 23–28. [Google Scholar] [CrossRef] [PubMed]
- Liu, J.; Huang, S.; Sun, M.; Liu, S.; Liu, Y.; Wang, W.; Zhang, X.; Wang, H.; Hua, W. An improved allele-specific PCR primer design method for SNP marker analysis and its application. Plant Methods 2012, 8, 34. [Google Scholar] [CrossRef] [PubMed]
- Takeda, S.; Ichii, S.; Nakamura, Y. Detection of K-ras mutation in sputum by mutant-allele-specific amplification (MASA). Hum. Mutat. 1993, 2, 112–117. [Google Scholar] [CrossRef] [PubMed]
- Olmedillas-López, S.; García-Olmo, D.C.; Garcia-Arranz, M.; Guadalajara, H.; Pastor, C.; García-Olmo, D. KRAS G12V Mutation Detection by Droplet Digital PCR in Circulating Cell-Free DNA of Colorectal Cancer Patients. Int. J. Mol. Sci. 2016, 17, 484. [Google Scholar] [CrossRef]
- Vestheim, H.; Deagle, B.E.; Jarman, S.N. Application of Blocking Oligonucleotides to Improve Signal-to-Noise Ratio in a PCR. Methods Mol. Biol. 2011, 687, 265–274. [Google Scholar]
- Tolnai, Z.; Harkai, Á.; Szeitner, Z.; Scholz, É.N.; Percze, K.; Gyurkovics, A.; Mészáros, T. A simple modification increases specificity and efficiency of asymmetric PCR. Anal. Chim. Acta 2019, 1047, 225–230. [Google Scholar] [CrossRef]
- Kim, H.E.; Ruby, A.; Shandilya, H.G.; Virmani, A.K.; Rahman, N.; Strange, C.M.; Huuskonen, J. T-blocker: A simple and robust probe-free quantitative PCR assay to detect somatic mutations down to 0.1% frequency. Biotechniques 2018, 65, 205–210. [Google Scholar] [CrossRef]
- Huang, J.-F.; Zeng, D.-Z.; Duan, G.-J.; Shi, Y.; Deng, G.-H.; Xia, H.; Xu, H.-Q.; Zhao, N.; Fu, W.-L.; Huang, Q. Single-Tubed Wild-Type Blocking Quantitative PCR Detection Assay for the Sensitive Detection of Codon 12 and 13 KRAS Mutations. PLoS ONE 2015, 10, e0145698. [Google Scholar] [CrossRef]
- Huang, Q.; Wang, G.-Y.; Huang, J.; Zhang, B.; Fu, W.-L. High sensitive mutation analysis on KRAS gene using LNA/DNA chimeras as PCR amplification blockers of wild-type alleles. Mol. Cell. Probes 2010, 24, 376–380. [Google Scholar] [CrossRef]
- Albitar, A.Z.; Ma, W.; Albitar, M. Wild-type Blocking PCR Combined with Direct Sequencing as a Highly Sensitive Method for Detection of Low-Frequency Somatic Mutations. J. Vis. Exp. 2017, e55130. [Google Scholar] [CrossRef]


| Primers | Cq | ||
|---|---|---|---|
| WT | 1% | 100% | |
| CTTC | 34.25 ± 0.05 | 28.7 ± 0.1 | 21.72 ± 0.02 |
| C*TTC | N/A | 29.65 ± 0.07 | 23.8 ± 0.2 |
| CT*TC | N/A | 33.24 ± 0.01 | 26.8 ± 0.2 |
| CTT*C | N/A | 33.5 ± 0.1 | 26.67 ± 0.01 |
| C*TT*C | N/A | 36.4 ± 0.2 | 29.2 ± 0.1 |
| *C*TTC | N/A | 37.9 ± 0.1 | 32.0 ± 0.1 |
| C*T*TC | N/A | 40.9 ± 0.2 | 34.8 ± 0.1 |
| *CTT*C | N/A | N/A | 40.1 ± 0.3 |
| CT*T*C | N/A | N/A | N/A |
| Primers | Cq | ||
|---|---|---|---|
| WT | 1% | ||
| G12V | CTAT | 33.4 ± 0.1 | 31.9 ± 0.1 |
| C*TAT | 38.7 ± 0.3 | 33.2 ± 0.1 | |
| *CTAT | N/A | 40.2 ± 1.3 | |
| G12D | CGGA | 35.8 ± 0.1 | 32.50 ± 0.05 |
| C*GGA | 41.7 ± 1.8 | 32.9 ± 0.1 | |
| *CGGA | N/A | 42.9 ± 1.2 | |
| G12A | CTTC | 37.7 ± 0.3 | 32.0 ± 0.2 |
| С*TTC | N/A | 32.7 ± 0.2 | |
| G13D | GAGA | 36.3 ± 0.1 | 32.3 ± 0.1 |
| G*AGA | N/A | 35.0 ± 0.1 | |
| *GAGA | N/A | 39.2 ± 0.3 | |
| Primers | Cq | ΔCq | Primers | Cq | ΔCq | ||||
|---|---|---|---|---|---|---|---|---|---|
| WT | 1% | CqWT − Cq1% | WT | 1% | CqWT − Cq1% | ||||
| G12A | CTGC | 33.0 ± 0.5 | 31.5 ± 0.1 | 1.5 | G12V | CTGT | 26.2 ± 0.1 | 26.0 ± 0.1 | 0.2 |
| С*TGC | 38.4 ± 0.4 | 32.6 ± 0.1 | 5.8 | C*TGT | 30.7 ± 0.1 | 29.7 ± 0.1 | 1.0 | ||
| CTTC | 37.7 ± 0.3 | 32.0 ± 0.2 | 5.7 | CTAT | 33.4 ± 0.1 | 31.9 ± 0.1 | 1.5 | ||
| С*TTC | N/A | 32.7 ± 0.2 | 12.3 a | C*TAT | 38.7 ± 0.3 | 33.2 ± 0.1 | 5.5 | ||
| CAGC | 37.7 ± 0.2 | 33.0 ± 0.1 | 4.7 | CTTT | 35.3 ± 0.1 | 34.2 ± 0.1 | 1.1 | ||
| C*AGC | 38.7 ± 0.3 | 32.5 ± 0.1 | 6.2 | C*TTT | 41.8 ± 1.1 | 37.9 ± 0.3 | 3.9 | ||
| G13D | GTGA | 29.0 ± 0.1 | 28.1 ± 0.1 | 0.9 | CGGT | 28.0 ± 0.1 | 27.4 ± 0.1 | 0.6 | |
| G*TGA | 33.4 ± 0.1 | 32.3 ± 0.1 | 1.1 | C*GGT | 28.5 ± 0.1 | 27.6 ± 0.1 | 0.9 | ||
| GAGA | 36.3 ± 0.2 | 32.3 ± 0.1 | 4.0 | CCGT | 31.7 ± 0.1 | 30.0 ± 0.1 | 1.7 | ||
| G*AGA | N/A | 35.0 ± 0.1 | 10.0 a | C*CGT | 33.9 ± 0.2 | 30.9 ± 0.1 | 3.0 | ||
| GCGA | 35.0 ± 0.1 | 31.0 ± 0.1 | 4.0 | G12D | CTGA | 27.7 ± 0.1 | 27.0 ± 0.1 | 0.7 | |
| G*CGA | N/A | 33.1 ± 0.1 | 11.9 a | C*TGA | 29.2 ± 0.1 | 28.7 ± 0.1 | 0.5 | ||
| GGGA | 38.0 ± 0.4 | 32.8 ± 0.1 | 5.2 | CGGA | 35.8 ± 0.1 | 32.50 ± 0.05 | 3.3 | ||
| G*GGA | N/A | 36.4 ± 0.2 | 8.6 a | C*GGA | 41.7 ± 1.8 | 32.9 ± 0.1 | 8.8 | ||
| Primers | Cq | ΔCq | ||||
|---|---|---|---|---|---|---|
| WT | 0.1% | 1% | CqWT − Cq0.1% | CqWT − Cq1% | ||
| G12A | СTTC | 37.7 ± 0.3 | 35.1 ± 0.1 | 32.0 ± 0.2 | 2.6 | 5.7 |
| С*TTC | N/A | 36.9 ± 0.2 | 32.7 ± 0.2 | 8.1 a | 12.3 a | |
| G12V | CTAT | 33.4 ± 0.1 | 33.2 ± 0.1 | 31.9 ± 0.1 | 0.2 | 1.5 |
| C*TAT | 38.7 ± 0.4 | 37.1 ± 0.2 | 33.2 ± 0.1 | 1.6 | 5.5 | |
| G12D | CGGA | 35.8 ± 0.1 | 35.1 ± 0.1 | 32.5 ± 0.1 | 0.7 | 3.3 |
| C*GGA | 41.7 ± 1.8 | 36.2 ± 0.2 | 32.9 ± 0.1 | 5.5 | 9.2 | |
| G13D | GAGA | 36.3 ± 0.1 | 34.6 ± 0.1 | 32.3 ± 0.1 | 1.7 | 4.0 |
| G*AGA | N/A | 38.5 ± 0.3 | 35.0 ± 0.1 | 6.5 a | 10.0 a | |
| GCGA | 35.0 ± 0.1 | 34.3 ± 0.1 | 31.0 ± 0.1 | 0.7 | 4.0 | |
| G*CGA | N/A | 37.0 ± 0.3 | 33.1 ± 0.1 | 8.0 a | 11.9 a | |
| Primers | Cq | ΔCq | |||||
|---|---|---|---|---|---|---|---|
| CqWT − Cq1% | |||||||
| 2 × 10⁴ Copies | 2 × 10⁴ | 2 × 10⁵ | |||||
| 1% | 0.1% | 0.01% | WT | Copies | |||
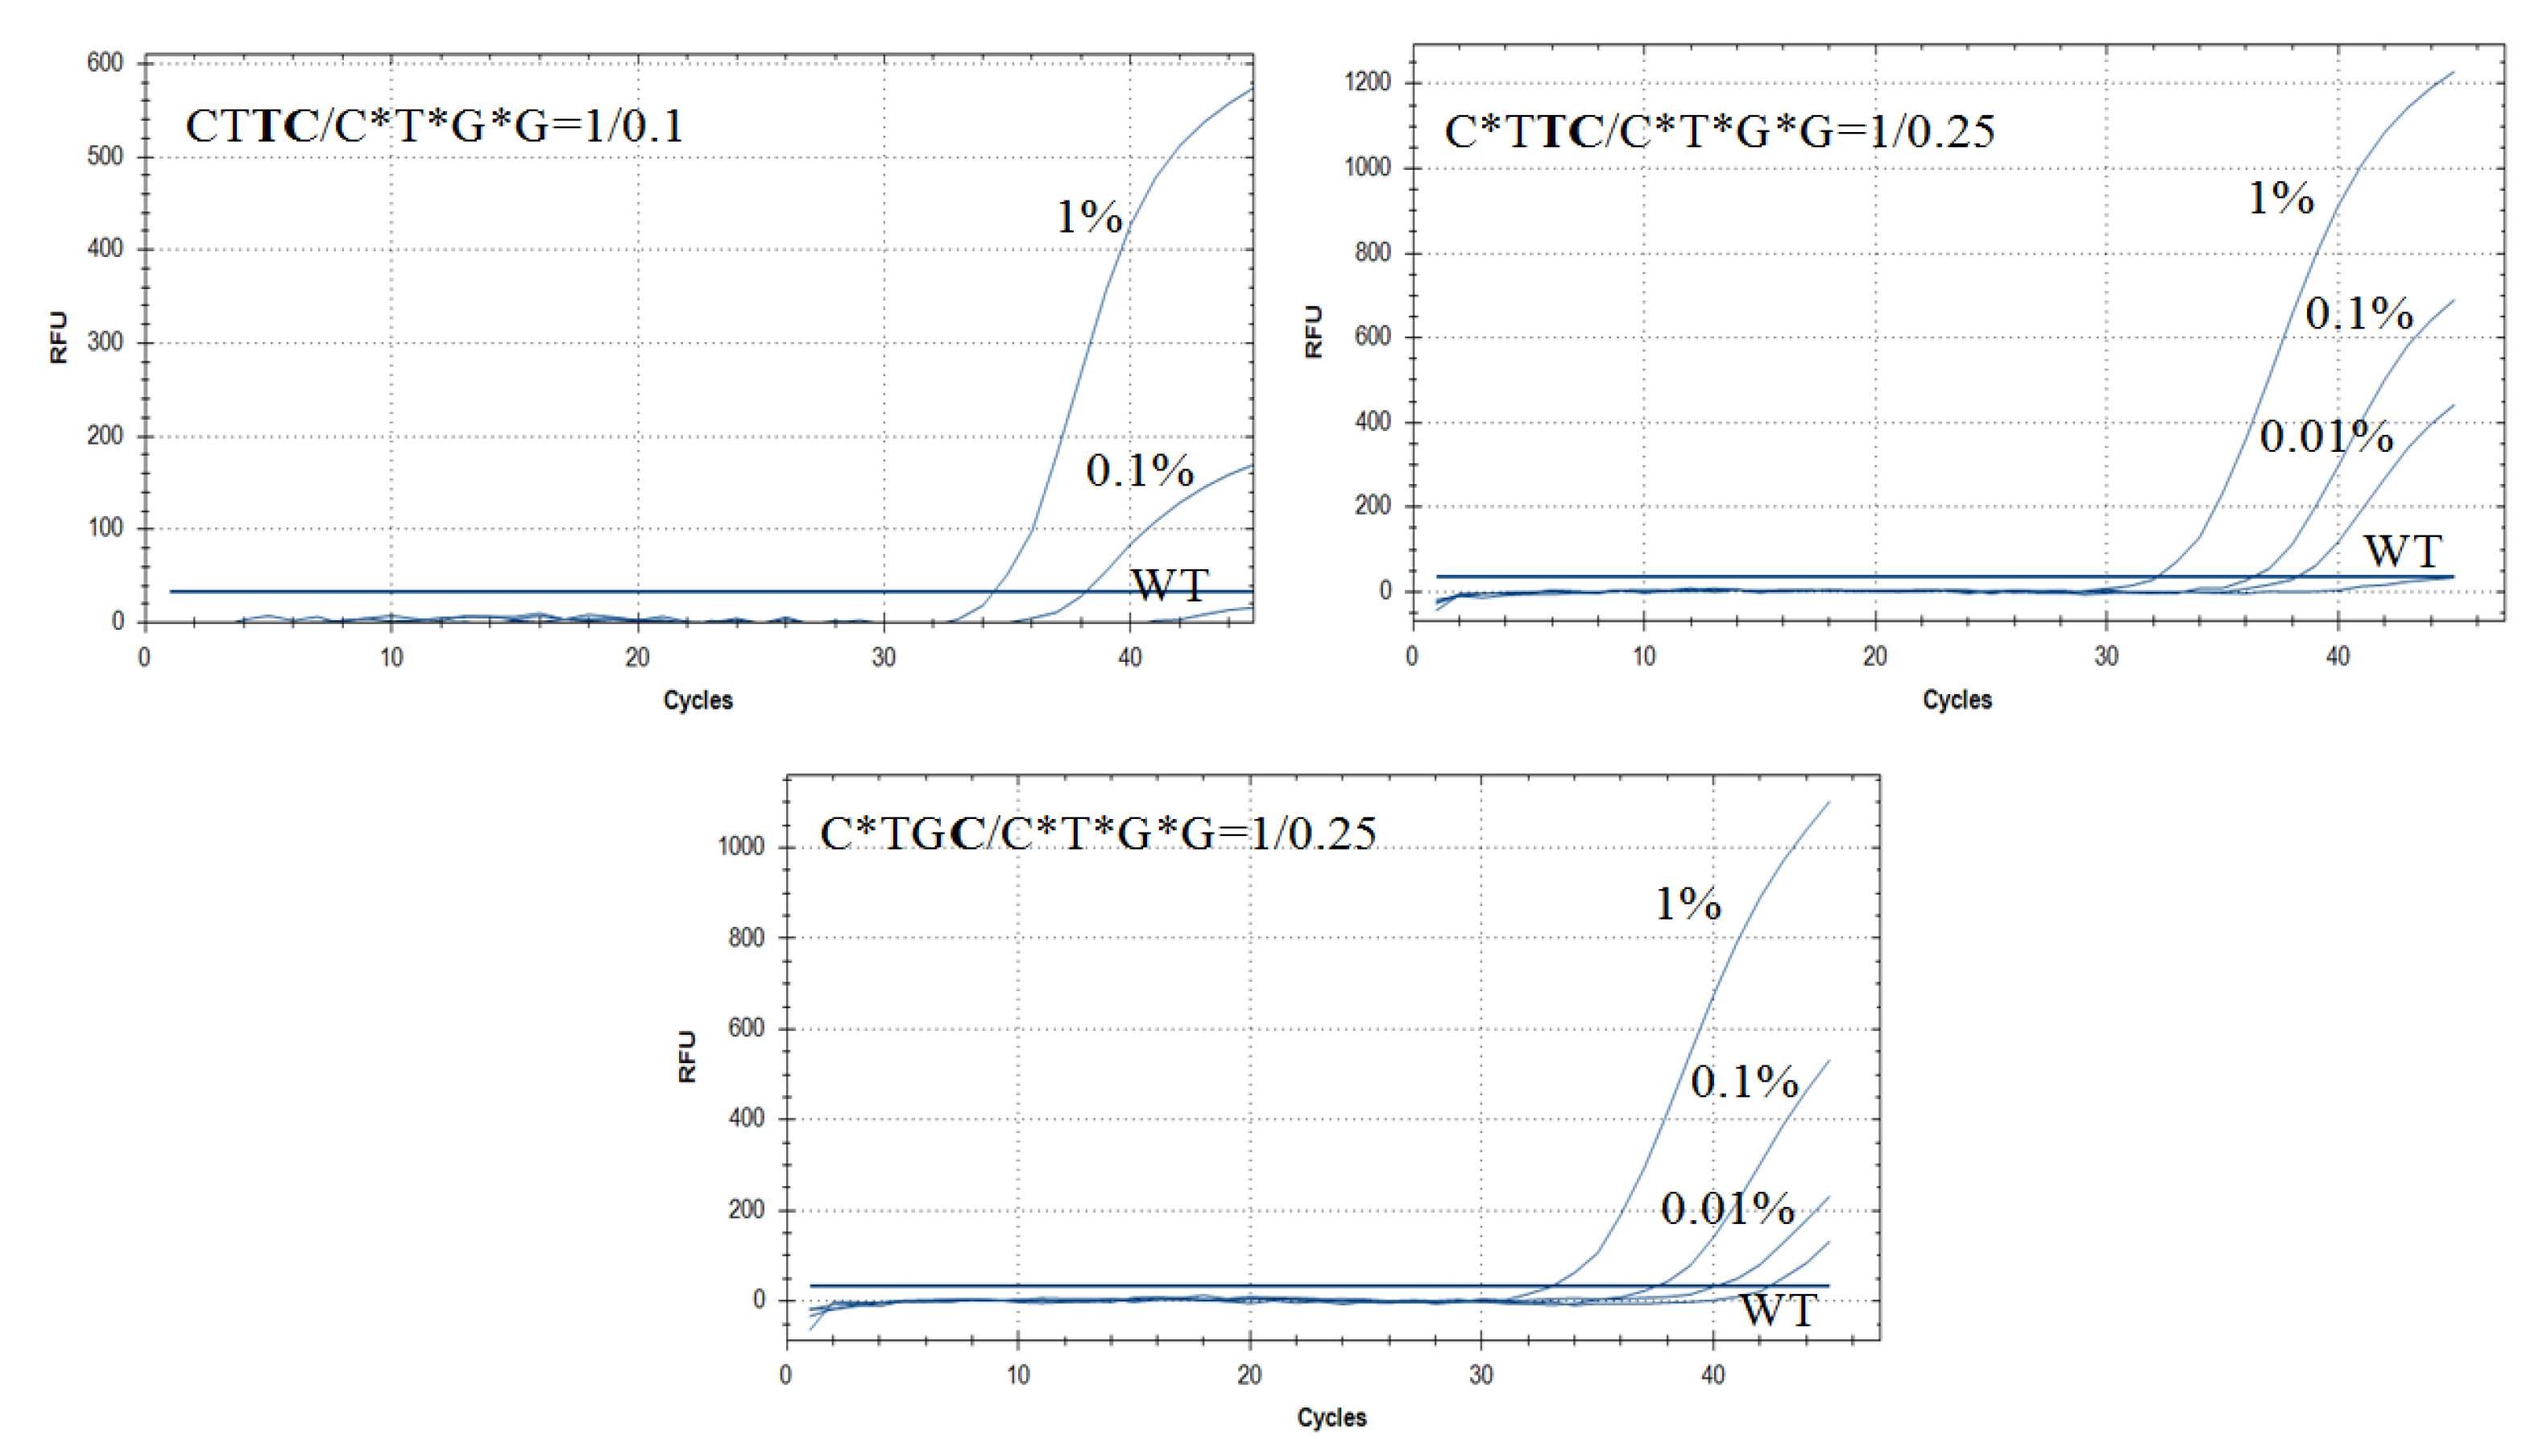
| G12A | No blocker CTGG | 24.6 ± 0.2 | 24.8 ± 0.2 | 25.0 ± 0.3 | 25.0 ± 0.2 | 0.4 | - |
| Blocker C*T*G*G | N/A | N/A | N/A | N/A | - | - | |
| No blocker CTTC | 31.5 ± 0.1 | 33.9 ± 0.1 | 34.2 ± 0.2 | 36.7 ± 0.2 | 5.2 | 5.7 | |
| CTTC/C*T*G*G = 1/0.1 | 33.5 ± 0.1 | 38.0 ± 0.3 | N/A | N/A | 11.5 a | 10.7 | |
| C*TTC/C*T*G*G = 1/0.25 | 32.5 ± 0.1 | 36.3 ± 0.3 | 38.2 ± 0.4 | N/A | 12.5 a | 14.2 | |
| C*TGC/C*T*G*G = 1/0.25 | 33.1 ± 0.1 | 37.5 ± 0.2 | 40.1 ± 0.5 | 42.4 ± 1.5 | 9.3 | 9.2 | |
| G12V | No blocker CTAT | 30.6 ± 0.1 | 30.8 ± 0.2 | 31.4 ± 0.2 | 31.6 ± 0.2 | 1.0 | - |
| C*TAT /C*T*G*G = 1/0.1 | 36.0 ± 0.2 | 37.5 ± 0.4 | 40.3 ± 1.0 | N/A | 9.0 a | 8.8 | |
| G12D | No blocker CGGA | 33.2 ± 0.1 | 36.0 ± 0.3 | 37.0 ± 0.5 | 37.1 | 3.8 | - |
| C*GGA/C*T*G*G = 1/0.1 | 33.6 ± 0.1 | 37.1 ± 0.6 | 39.2 ± 0.9 | N/A | 11.4 a | 9.8 | |
| G13D | No blocker GTGG | 23.5 ± 0.1 | 24.0 ± 0.2 | 24.1 ± 0.1 | 24.2 ± 0.3 | 0.7 | - |
| Blocker G*T*G*G | N/A | N/A | N/A | N/A | - | - | |
| No blocker GAGA | 31.1 ± 0.1 | 33.1 ± 0.2 | 33.6 ± 0.3 | 35.2 ± 0.2 | 4.1 | - | |
| GAGA/G*T*G*G = 1/0.1 | 32.7 ± 0.1 | 34.8 ± 0.2 | N/A | N/A | 12.3 a | 8.8 | |
| G*AGA/G*T*G*G = 1/0.1 | 35.3 ± 0.4 | 39.2 ± 0.8 | 41.0 ± 1.3 | N/A | 9.7 a | 10.9 | |
Publisher’s Note: MDPI stays neutral with regard to jurisdictional claims in published maps and institutional affiliations. |
© 2020 by the authors. Licensee MDPI, Basel, Switzerland. This article is an open access article distributed under the terms and conditions of the Creative Commons Attribution (CC BY) license (http://creativecommons.org/licenses/by/4.0/).
Share and Cite
Chubarov, A.S.; Oscorbin, I.P.; Filipenko, M.L.; Lomzov, A.A.; Pyshnyi, D.V. Allele-Specific PCR for KRAS Mutation Detection Using Phosphoryl Guanidine Modified Primers. Diagnostics 2020, 10, 872. https://doi.org/10.3390/diagnostics10110872
Chubarov AS, Oscorbin IP, Filipenko ML, Lomzov AA, Pyshnyi DV. Allele-Specific PCR for KRAS Mutation Detection Using Phosphoryl Guanidine Modified Primers. Diagnostics. 2020; 10(11):872. https://doi.org/10.3390/diagnostics10110872
Chicago/Turabian StyleChubarov, Alexey S., Igor P. Oscorbin, Maxim L. Filipenko, Alexander A. Lomzov, and Dmitrii V. Pyshnyi. 2020. "Allele-Specific PCR for KRAS Mutation Detection Using Phosphoryl Guanidine Modified Primers" Diagnostics 10, no. 11: 872. https://doi.org/10.3390/diagnostics10110872
APA StyleChubarov, A. S., Oscorbin, I. P., Filipenko, M. L., Lomzov, A. A., & Pyshnyi, D. V. (2020). Allele-Specific PCR for KRAS Mutation Detection Using Phosphoryl Guanidine Modified Primers. Diagnostics, 10(11), 872. https://doi.org/10.3390/diagnostics10110872