Longitudinal Observation of Changes in the Ankle Alignment and Tibiofibular Relationships in Hereditary Multiple Exostoses

 , , , , and
Abstract
1. Introduction
2. Materials and Methods
2.1. Patient Recruitment
2.2. Radiographic Measurements
2.3. Statistical Analyses
3. Results
3.1. Inter-and Intra-Observer Reliability
3.2. Demographic Distribution
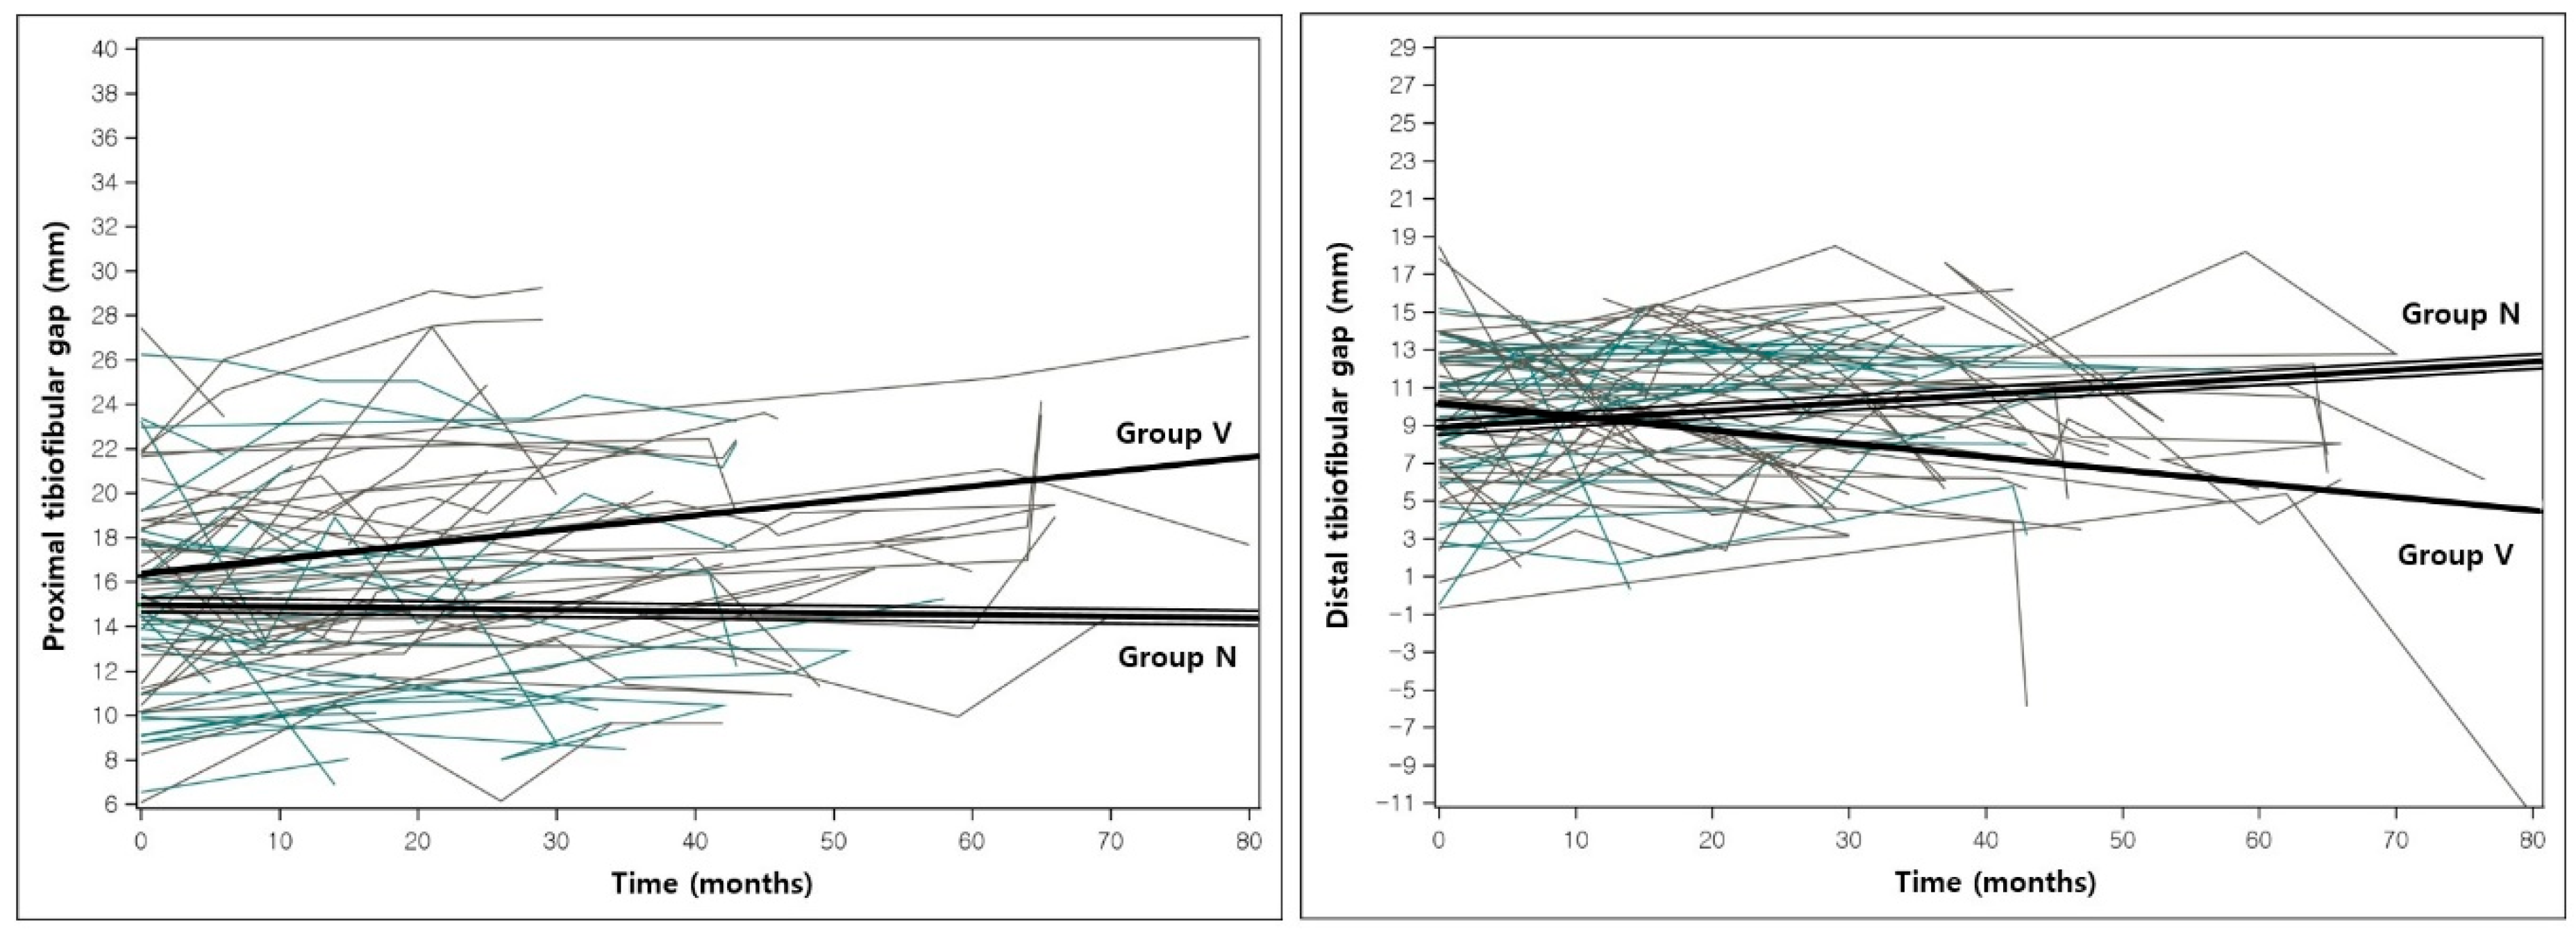
3.3. Change in Alignment During the Observation Period
3.4. Effects of Characteristic Factors
4. Discussion
5. Conclusions
Author Contributions
Funding
Conflicts of Interest
References
- Shapiro, F.; Simon, S.; Glimcher, M.J. Hereditary multiple exostoses. Anthropometric, roentgenographic, and clinical aspects. JBJS 1979, 61, 815–824. [Google Scholar]
- Snearly, W.N.; Peterson, H.A. Management of ankle deformities in multiple hereditary osteochondromata. J. Pediatric Orthop. 1989, 9, 427–432. [Google Scholar] [CrossRef]
- Solomon, L. Bone growth in diaphysial aclasis. J. Bone Jt. Surg. Br. Vol. 1961, 43-B, 700–716. [Google Scholar] [CrossRef]
- Stieber, J.R.; Dormans, J.P. Manifestations of hereditary multiple exostoses. JAAOS J. Am. Acad. Orthop. Surg. 2005, 13, 110–120. [Google Scholar] [CrossRef] [PubMed]
- Chin, K.R.; Kharrazi, F.D.; Miller, B.S.; Mankin, H.J.; Gebhardt, M.C. Osteochondromas of the distal aspect of the tibia or fibula. Natural history and treatment. JBJS 2000, 82, 1269–1278. [Google Scholar] [CrossRef] [PubMed]
- Noonan, K.J.; Feinberg, J.R.; Levenda, A.; Snead, J.; Wurtz, L.D. Natural history of multiple hereditary osteochondromatosis of the lower extremity and ankle. J. Pediatric Orthop. 2002, 22, 120–124. [Google Scholar] [CrossRef]
- Bozkurt, M.; Dogan, M.; Turanli, S. Osteochondroma leading to proximal tibiofibular synostosis as a cause of persistent ankle pain and lateral knee pain: A case report. Knee Surg. Sports Traumatol. Arthrosc. 2004, 12, 152–154. [Google Scholar] [CrossRef]
- Rupprecht, M.; Spiro, A.S.; Rueger, J.M.; Stucker, R. Temporary screw epiphyseodesis of the distal tibia: A therapeutic option for ankle valgus in patients with hereditary multiple exostosis. J. Pediatric Orthop. 2011, 31, 89–94. [Google Scholar] [CrossRef]
- Rupprecht, M.; Spiro, A.S.; Schlickewei, C.; Breyer, S.; Ridderbusch, K.; Stucker, R. Rebound of ankle valgus deformity in patients with hereditary multiple exostosis. J. Pediatric Orthop. 2015, 35, 94–99. [Google Scholar] [CrossRef]
- Ahn, Y.S.; Woo, S.H.; Kang, S.J.; Jung, S.T. Coronal malalignment of lower legs depending on the locations of the exostoses in patients with multiple hereditary exostoses. BMC Musculoskelet. Disord. 2019, 20, 564. [Google Scholar] [CrossRef]
- Takikawa, K.; Haga, N.; Tanaka, H.; Okada, K. Characteristic factors of ankle valgus with multiple cartilaginous exostoses. J. Pediatric Orthop. 2008, 28, 761–765. [Google Scholar] [CrossRef] [PubMed]
- Sabharwal, S.; Zhao, C. Assessment of lower limb alignment: Supine fluoroscopy compared with a standing full-length radiograph. JBJS 2008, 90, 43–51. [Google Scholar] [CrossRef] [PubMed]
- Beals, R.K.; Skyhar, M. Growth and development of the tibia, fibula, and ankle joint. Clin. Orthop. Relat. Res. 1984, 182, 289–292. [Google Scholar] [CrossRef]
- Lachin, J.M. The role of measurement reliability in clinical trials. Clin. Trials 2004, 1, 553–566. [Google Scholar] [CrossRef] [PubMed]
- Czajka, C.M.; DiCaprio, M.R. What is the Proportion of Patients with Multiple Hereditary Exostoses Who Undergo Malignant Degeneration? Clin. Orthop. Relat. Res. 2015, 473, 2355–2361. [Google Scholar] [CrossRef]
- Akita, S.; Murase, T.; Yonenobu, K.; Shimada, K.; Masada, K.; Yoshikawa, H. Long-term results of surgery for forearm deformities in patients with multiple cartilaginous exostoses. JBJS 2007, 89, 1993–1999. [Google Scholar] [CrossRef]
- Porter, D.E.; Emerton, M.E.; Villanueva-Lopez, F.; Simpson, A.H. Clinical and radiographic analysis of osteochondromas and growth disturbance in hereditary multiple exostoses. J. Pediatric Orthop. 2000, 20, 246–250. [Google Scholar] [CrossRef]
- Karrholm, J.; Hansson, L.I.; Selvik, G. Longitudinal growth rate of the distal tibia and fibula in children. Clin. Orthop. Relat. Res. 1984, 191, 121–128. [Google Scholar]
- Pritchett, J.W. Growth and growth prediction of the fibula. Clin. Orthop. Relat. Res. 1997, 334, 251–256. [Google Scholar] [CrossRef]
- Bessler, W.; Eich, G.; Stuckmann, G.; Zollikofer, C. Kissing osteochondromata leading to synostoses. Eur. Radiol. 1997, 7, 480–485. [Google Scholar] [CrossRef]
- Frick, S.L.; Shoemaker, S.; Mubarak, S.J. Altered fibular growth patterns after tibiofibular synostosis in children. JBJS 2001, 83, 247–254. [Google Scholar] [CrossRef] [PubMed]
- Park, H.W.; Kim, H.W.; Kwak, Y.H.; Roh, J.Y.; Lee, J.J.; Lee, K.S. Ankle valgus deformity secondary to proximal migration of the fibula in tibial lengthening with use of the Ilizarov external fixator. JBJS 2011, 93, 294–302. [Google Scholar] [CrossRef] [PubMed]
- Karrholm, J.; Hansson, L.I.; Selvik, G. Changes in tibiofibular relationships due to growth disturbances after ankle fractures in children. JBJS 1984, 66, 1198–1210. [Google Scholar] [CrossRef]
- Schmale, G.A.; Conrad, E.U., 3rd; Raskind, W.H. The natural history of hereditary multiple exostoses. JBJS 1994, 76, 986–992. [Google Scholar] [CrossRef]
- Jang, W.Y.; Park, M.S.; Yoo, W.J.; Chung, C.Y.; Choi, I.H.; Cho, T.J. Beam Projection Effect in the Radiographic Evaluation of Ankle Valgus Deformity Associated with Fibular Shortening. J. Pediatric Orthop. 2016, 36, e101–e105. [Google Scholar] [CrossRef]


| Group N (n = 28) | Group V (n = 35) | p Value | |
|---|---|---|---|
| Numbers of affected leg (right:left) | 15:13 | 18:17 | |
| Age at first visit (months) | 77.6 ± 40.8 | 82.8 ± 33.9 | 0.586 |
| Sex (male:female) | 14:14 | 17:18 | 0.910 |
| Duration of follow-up (months) | 27.1 ± 14.5 | 40.5 ± 19.8 | 0.004 * |
| Numbers of radiologic follow-up | 3.4 ± 1.6 | 4.8 ± 2.1 | 0.003 * |
| Initial ankle alignment † | 0.964 | ||
| Neutral (tibiotalar angle 0°–5°) | 14 (51.9%) | 17 (48.6%) | |
| Valgus (tibiotalar angle > 5°) | 7 (26.0%) | 10 (28.6%) | |
| Varus (tibiotalar angle < 0°) | 6 (22.2%) | 8 (22.9%) | |
| Location of osteochondroma | |||
| Proximal tibia | 17 (63.0%) | 26 (74.3%) | 0.250 |
| Distal tibia | 12 (44.4%) | 21 (60.0%) | 0.176 |
| Proximal fibula | 18 (66.7%) | 27 (77.1%) | 0.262 |
| Distal fibula | 12 (44.4%) | 15 (42.9%) | >0.999 |
| Tibiofibular synostosis | 0.906 | ||
| None | 10 (37.0%) | 12 (34.3%) | |
| Presence | 18 (66.7%) | 23 (65.7%) |
| Group N | Group V | p Value | |
|---|---|---|---|
| Initial visit | |||
| Lateral distal femoral angle (°) | 89.1 ± 4.2 | 87.7 ± 2.5 | 0.111 |
| Medial proximal tibial angle (°) | 89.3 ± 3.1 | 88.9 ± 2.3 | 0.567 |
| Length of fibula (mm) | 233.4 ± 59.0 | 240.8 ± 47.2 | 0.587 |
| Length of tibia (mm) | 239.9 ± 61.1 | 246.9 ± 48.4 | 0.620 |
| Fibula/tibia ratio | 0.97 ± 0.04 | 0.98 ± 0.34 | 0.834 |
| Gap of proximal physis (mm) | 11.9 ± 5.8 | 14.8 ± 6.0 | 0.058 |
| Gap of proximal epiphysis (mm) | 15.0 ± 5.0 | 15.9 ± 4.5 | 0.495 |
| Gap of distal physis (mm) | 6.7 ± 3.8 | 6.6 ± 3.6 | 0.905 |
| Gap of distal epiphysis (mm) | 8.6 ± 4.0 | 9.7 ± 4.3 | 0.329 |
| Tibiotalar angle (°) † | 2.6 ± 7.0 | 2.9 ± 5.5 | 0.876 |
| Last follow-up | |||
| Lateral distal femoral angle (°) | 88.4 ± 3.0 | 86.5 ± 2.3 | 0.007 * |
| Medial proximal tibial angle (°) | 90.5 ± 3.3 | 88.1 ± 2.6 | 0.003 * |
| Length of fibula (mm) | 260.9 ± 47.7 | 284.9 ± 42.0 | 0.040 * |
| Length of tibia (mm) | 265.9 ± 50.2 | 296.9 ± 43.9 | 0.012 * |
| Fibula/tibia ratio | 0.98 ± 0.03 | 0.96 ± 0.03 | 0.005 * |
| Gap of proximal physis (mm) | 13.5 ± 5.8 | 19.2 ± 5.5 | <0.001 * |
| Gap of proximal epiphysis (mm) | 14.4 ± 4.9 | 19.1 ± 4.8 | <0.001 * |
| Gap of distal physis (mm) | 6.3 ± 3.6 | 5.2 ± 3.9 | 0.279 |
| Gap of distal epiphysis (mm) | 10.1 ± 3.7 | 6.0 ± 4.9 | 0.001 * |
| Tibiotalar angle (°) † | 1.6 ± 7.0 | 7.5 ± 6.2 | 0.001 * |
| Estimated Slope (SE) | ||||||
|---|---|---|---|---|---|---|
| Group N | p Value | Group V | p Value | Difference between Group N Versus. Group V | p Value | |
| Lateral distal femoral angle (°) | −0.028 (0.0144) | 0.052 | −0.0266 (0.0081) | 0.001 * | 0.0015 (0.0165) | 0.929 |
| Medial proximal tibial angle (°) | 0.0256 (0.0148) | 0.087 | −0.0026 (0.0084) | 0.753 | −0.0282 (0.017) | 0.100 |
| Length of fibula (mm) | 0.9765 (0.0612) | <0.001 * | 1.0968 (0.0344) | <0.001 * | 0.1203 (0.0702) | 0.088 |
| Length of tibia (mm) | 0.9407 (0.0622) | <0.001 * | 1.2483 (0.035) | <0.001 * | 0.3076 (0.0713) | <0.001 * |
| Fibula/tibia ratio | 0.0002 (0.0001) | 0.066 | −0.0004 (0.0001) | <0.001 * | −0.0006 (0.0001) | <0.001 * |
| Gap of proximal physis (mm) | 0.0623 (0.0166) | <0.001 * | 0.0978 (0.0093) | <0.001 * | 0.0354 (0.019) | 0.064 |
| Gap of proximal epiphysis (mm) | −0.0079 (0.0167) | 0.637 | 0.0667 (0.0094) | <0.001 * | 0.0746 (0.0192) | <0.001 * |
| Gap of distal physis (mm) | −0.0084 (0.0145) | 0.563 | −0.0177 (0.0081) | 0.031 * | −0.0093 (0.0166) | 0.574 |
| Gap of distal epiphysis (mm) | 0.0425 (0.0219) | 0.054 | −0.0702 (0.0124) | <0.001 * | −0.1126 (0.0251) | <0.001 * |
| Tibiotalar angle (°) † | −0.0231 (0.0171) | 0.180 | 0.0972 (0.0097) | <0.001 * | 0.1202 (0.0197) | <0.001 * |
| Fibular Length | Tibial Length | Fibula/Tibia Ratio | Tibiotalar Angle | |||||
|---|---|---|---|---|---|---|---|---|
| Effect (SE) | p Value | Effect (SE) | p Value | Effect (SE) | p Value | Effect (SE) | p Value | |
| Age | −0.005 (0.001) | <0.001 * | −0.004 (0.001) | <0.001 * | −0.000006 (0.0000018) | 0.001 * | 0.0001 (0.0003) | 0.666 |
| Sex | ||||||||
| Male | Ref. (0) † | Ref. (0) † | Ref. (0) † | Ref. (0) † | ||||
| Female | −0.108 (0.058) | 0.062 | −0.102 (0.063) | 0.105 | 0.000003 (0.00012) | 0.979 | −0.017 (0.019) | 0.360 |
| Synostosis | ||||||||
| None | Ref. (0) † | Ref. (0) † | Ref. (0) † | Ref. (0) † | ||||
| Presence | −0.125 (0.058) | 0.031 * | −0.138 (0.062) | 0.028 * | 0.0001 (0.0001) | 0.492 | −0.013 (0.019) | 0.487 |
| Initial ankle alignment | ||||||||
| Neutral (0°- valgus 5°) | Ref. (0) † | Ref. (0) † | Ref. (0) † | Ref. (0) † | ||||
| Valgus (> valgus 5°) | −0.032 (0.077) | 0.673 | −0.114 (0.083) | 0.170 | 0.0005 (0.0002) | 0.004 * | 0.027 (0.025) | 0.278 |
| Varus (< 0°) | 0.080 (0.063) | 0.204 | 0.024 (0.068) | 0.726 | 0.0002 (0.0001) | 0.097 | 0.044 (0.021) | 0.034 * |
© 2020 by the authors. Licensee MDPI, Basel, Switzerland. This article is an open access article distributed under the terms and conditions of the Creative Commons Attribution (CC BY) license (http://creativecommons.org/licenses/by/4.0/).
Share and Cite
Lee, J.H.; Rathod, C.M.; Park, H.; Lee, H.S.; Rhee, I.; Kim, H.W. Longitudinal Observation of Changes in the Ankle Alignment and Tibiofibular Relationships in Hereditary Multiple Exostoses. Diagnostics 2020, 10, 752. https://doi.org/10.3390/diagnostics10100752
Lee JH, Rathod CM, Park H, Lee HS, Rhee I, Kim HW. Longitudinal Observation of Changes in the Ankle Alignment and Tibiofibular Relationships in Hereditary Multiple Exostoses. Diagnostics. 2020; 10(10):752. https://doi.org/10.3390/diagnostics10100752
Chicago/Turabian StyleLee, Jae Hoo, Chasanal Mohan Rathod, Hoon Park, Hye Sun Lee, Isaac Rhee, and Hyun Woo Kim. 2020. "Longitudinal Observation of Changes in the Ankle Alignment and Tibiofibular Relationships in Hereditary Multiple Exostoses" Diagnostics 10, no. 10: 752. https://doi.org/10.3390/diagnostics10100752
APA StyleLee, J. H., Rathod, C. M., Park, H., Lee, H. S., Rhee, I., & Kim, H. W. (2020). Longitudinal Observation of Changes in the Ankle Alignment and Tibiofibular Relationships in Hereditary Multiple Exostoses. Diagnostics, 10(10), 752. https://doi.org/10.3390/diagnostics10100752