Widefield Swept Source OCTA in Retinitis Pigmentosa


 ,
,  ,
, 
Abstract
1. Introduction
2. Materials and Methods
2.1. Study Participants
2.2. Procedures
2.3. Electrophisiology Testing
2.4. Microperimetry
2.5. SD-OCT
2.6. OCTA
2.7. Statistical Analysis
3. Results
3.1. Demographics of Subjects Included in the Analysis
3.2. Visual Acuity, Electrophysiology and Microperimetry
3.3. SD OCT and Widefield OCTA Analysis of the Retinal Vessels
3.3.1. Central Macular Thickness
3.3.2. Perfusion Density
3.3.3. Vessel Length Density
3.4. Correlations
4. Discussion
Author Contributions
Funding
Conflicts of Interest
References
- Ma, Y.; Kawasaki, R.; Dobson, L.P.; Ruddle, J.B.; Kearns, L.S.; Wong, T.Y.; Mackey, D.A. Quantitative analysis of retinal vessel attenuation in eyes with retinitis pigmentosa. Investig. Ophthalmol. Vis. Sci. 2012, 53, 306–314. [Google Scholar] [CrossRef]
- Li, Z.Y.; Possin, D.E.; Milam, A.H. Histopathology of bone spicule pigmentation in retinitis pigmentosa. Ophthalmology 1995, 102, 805–816. [Google Scholar] [CrossRef]
- Milam, A.H.; Li, Z.Y.; Fariss, R.N. Histopathology of the human retina in retinitis pigmentosa. Prog. Retin. Eye Res. 1998, 17, 175–205. [Google Scholar] [PubMed]
- Beutelspacher, S.C.; Serbecic, N.; Barash, H.; Burgansky-Eliash, Z.; Grinvald, A.; Krastel, H.; Jonas, J.B. Retinal blood flow velocity measured by retinal function imaging in retinitis pigmentosa. Graefes Arch. Clin. Exp. Ophthalmol. 2011, 249, 1855–1858. [Google Scholar] [CrossRef] [PubMed]
- Toto, L.; Borrelli, E.; Mastropasqua, R.; Senatore, A.; Di Antonio, L.; Di Nicola, M.; Carpineto, P.; Mastropasqua, L. Macular Features in Retinitis Pigmentosa: Correlations Among Ganglion Cell Complex Thickness Capillary Density and Macular Function. Investig. Ophthalmol. Vis. Sci. 2016, 57, 6360–6366. [Google Scholar] [CrossRef]
- Battaglia Parodi, M.; Cicinelli, M.V.; Rabiolo, A.; Pierro, L.; Gagliardi, M.; Bolognesi, G.; Bandello, F. Vessel density analysis in patients with retinitis pigmentosa by means of optical coherence tomography angiography. Br. J. Ophthalmol. 2017, 101, 428–432. [Google Scholar] [CrossRef]
- Jauregui, R.; Park, K.S.; Duong, J.K.; Mahajan, V.B.; Tsang, S.H. Quantitative progression of retinitis pigmentosa by optical coherence tomography angiography. Sci. Rep. 2018, 8, 13130. [Google Scholar] [CrossRef]
- Liu, G.; Yang, J.; Wang, J.; Li, Y.; Zang, P.; Jia, Y.; Huang, D. Extended axial imaging range. widefield swept source optical coherence tomography angiography. J. Biophotonics 2017, 10, 1464–1472. [Google Scholar] [CrossRef]
- Hirano, T.; Kakihara, S.; Toriyama, Y.; Nittala, M.G.; Murata, T.; Sadda, S. Wide-field en face swept-source optical coherence tomography angiography using extended field imaging in diabetic retinopathy. Br. J. Ophthalmol. 2018, 102, 1199–1203. [Google Scholar] [CrossRef]
- De Pretto, L.R.; Moult, E.M.; Alibhai, A.Y.; Carrasco-Zevallos, O.M.; Chen, S.; Lee, B.; Witkin, A.J.; Baumal, C.R.; Reichel, E.; de Freitas, A.Z.; et al. Controlling for Artifacts in Widefield Optical Coherence Tomography Angiography Measurements of Non-Perfusion Area. Sci. Rep. 2019, 9, 9096. [Google Scholar] [CrossRef]
- Alibhai, A.Y.; De Pretto, L.R.; Moult, E.M.; Or, C.; Arya, M.; McGowan, M.; Carrasco-Zevallos, O.; Lee, B.; Chen, S.; Baumal, C.R.; et al. Quantification of retinal capillary nonperfusion in diabetics using wide-field optical coherence tomography angiography. Retina 2018. [Google Scholar] [CrossRef] [PubMed]
- Mastropasqua, R.; Senatore, A.; Di Antonio, L.; Di Nicola, M.; Marchioni, M.; Perna, F.; Amore, F.; Borrelli, E.; De Nicola, C.; Carpineto, P.; et al. Correlation between Choriocapillaris Density and Retinal Sensitivity in Stargardt Disease. J. Clin. Med. 2019, 8, 1432. [Google Scholar] [CrossRef] [PubMed]
- Hood, D.C.; Bach, M.; Brigell, M.; Keating, D.; Kondo, M.; Lyons, J.S.; Marmor, M.F.; McCulloch, D.L.; Palmowski-Wolfe, A.M. ISCEV standard for clinical multifocal electroretinography (mfERG) (2011 edition). Doc. Ophtalmol. 2012, 124, 1–13. [Google Scholar] [CrossRef]
- Bach, M.; Brigell, M.G.; Hawlina, M.; Holder, G.E.; Johnson, M.A.; McCulloch, D.L.; Meigen, T.; Viswanathan, S. ISCEV standard for clinical pattern electroretinography (PERG): 2012 update. Doc. Ophtalmol. 2012, 127, 1–7. [Google Scholar] [CrossRef]
- Uji, A.; Balasubramanian, S.; Lei, J.; Baghdasaryan, E.; Al-Sheikh, M.; Sadda, S.R. Impact of Multiple En Face Image Averaging on Quantitative Assessment from Optical Coherence Tomography Angiography Images. Ophthalmology 2017, 124, 944–952. [Google Scholar] [CrossRef] [PubMed]
- Borrelli, E.; Lonngi, M.; Balasubramanian, S.; Tepelus, T.C.; Baghdasaryan, E.; Iafe, N.A.; Pineles, S.L.; Velez, F.G.; Sarraf, D.; Sadda, S.R.; et al. Macular microvascular networks in healthy pediatric subjects. Retina 2019, 39, 1216–1224. [Google Scholar] [CrossRef] [PubMed]
- Mastropasqua, R.; D’Aloisio, R.; Di Antonio, L.; Erroi, E.; Borrelli, E.; Evangelista, F.; D’Onofrio, G.; Di Nicola, M.; Di Martino, G.; Toto, L. Widefield optical coherence tomography angiography in diabetic retinopathy. Acta Diabetol. 2019, 56, 1293–1303. [Google Scholar] [CrossRef] [PubMed]
- Wolf, S.P.; Ostgens, H.; Bertram, B.; Schulte, K.; Teping, C.; Reim, M. Hemodynamic findings in patients with retinitis pigmentosa. Klinische Monatsblätter für Augenheilkunde 1991, 199, 325–329. [Google Scholar] [CrossRef]
- Arrigo, A.; Romano, F.; Albertini, G.; Aragona, E.; Bandello, F.; Battaglia Parodi, M. Vascular Patterns in Retinitis Pigmentosa on Swept-Source Optical Coherence Tomography Angiography. J. Clin. Med. 2019, 8, 1425. [Google Scholar] [CrossRef]
- Alnawaiseh, M.; Schubert, F.; Heiduschka, P.; Eter, N. Optical coherence tomography angiography in patients with retinitis pigmentosa. Retina 2019, 39, 210–217. [Google Scholar] [CrossRef]
- Vingolo, E.M.; Limoli, P.G.; Steigerwalt, R.D.J.; Carlesimo, S.C.; Salvatore, S. Abnormal stereopsis and reduced retinal sensitivity in patients with retinitis pigmentosa. Int. Ophthalmol. 2019. [Google Scholar] [CrossRef] [PubMed]
- Iftikhar, M.; Kherani, S.; Kaur, R.; Lemus, M.; Nefalar, A.; Usmani, B.; Junaid, N.; Campochiaro, P.A.; Scholl, H.P.N.; Shah, S.M. Progression of Retinitis Pigmentosa as Measured on Microperimetry: The PREP-1 Study. Ophthalmol. Retina 2018, 2, 502–507. [Google Scholar] [CrossRef] [PubMed]


| Patient | Gender | Age (Years) | VA | Gene | Mutation/Mutations Identified |
|---|---|---|---|---|---|
| Case 1 | male | 63 | RE 0.3 logMAR LE 0.2 logMAR | RPGR | c.257G > A, p.C86Y |
| Case 2 | female | 40 | RE 0.8 logMAR LE 0.7 logMAR | NR2E3 | c.1025T > G, p.V342G |
| Case 3 | male | 59 | RE 0.4 logMAR | PDE6B | c.1547T > C, p.L516P c.1685G > A, p.G562D |
| Case 4 | female | 18 | RE 0.0 logMAR LE 0.1 logMAR | EYS | c.1673G > A, p.W558X c.2811C > A, p.C937X |
| Case 5 | female | 51 | RE 0.0 logMAR LE 0.0 logMAR | PRPF31 | c.1060C > T, p.R354X |
| Case 6 | male | 41 | RE 0.2 logMAR LE 0.2 logMAR | USH2A | c.688G > A, p.V230M c.2109T > C, p.D703D |
| Case 7 | male | 44 | RE 0.0 logMAR | RHO | c.404G > T, p.R135L |
| Case 8 | male | 61 | RE 0.0 logMAR LE 0.1 logMAR | CEP290 | c.4040G > A, W1347X c.6964A > T, p.K2322X |
| Case 9 | female | 23 | LE 0.2 logMAR | MERTK | c.2237A > G, p.I631M c.1893C > G, p.K746R |
| Case 10 | female | 37 | RE 0.2 logMAR LE 0.1 logMAR | USH2A | c.11946G > A, p.L3982L c.6713A > C, p.E2238A |
| Case 11 | male | 54 | RE 0.7 logMAR | AIPL1 | c.834G > A, p.W278X c.834G > A, p.W278X |
| Case 12 | female | 66 | RE 0.4 logMAR LE 0.2 logMAR | EYS | c.9082G > T, p.D3028Y c.4350_4356del7, p.K1450KfsX3 |
| Variable | Controls | Cases | Mean Difference (95%CI) * | p-Value |
|---|---|---|---|---|
| VA (LogMar) | 0.03 ± 0.05 | 0.24 ± 0.28 | −0.27 (−0.43; −0.11) | 0.020 |
| Mf ERG Ring1 (µV) | 139.35 ± 28.27 | 81.82 ± 36.71 | 57.43 (47.42; 67.44) | <0.001 |
| Mf ERG Ring2 (µV) | 63.21 ± 14.19 | 21.78 ± 9.79 | 41.43 (35.02; 47.85) | <0.001 |
| Mf ERG Ring3 (µV) | 33.80 ± 7.36 | 7.98 ± 3.95 | 25.82 (22.66; 28.98) | <0.001 |
| Mf ERG Ring4 (µV) | 22.58 ± 4.78 | 6.55 ± 5.11 | 16.02 (13.52; 18.53) | <0.001 |
| Mf ERG Ring5 (µV) | 16.24 ± 4.06 | 4.15 ± 3.02 | 12.09 (10.22; 13.96) | <0.001 |
| Dark-adapted 0.01 ERG | ||||
| Amplitude (µV) | 203.35 ± 22.68 | 38.94 ± 31.25 | 164.41 (151.35; 177.48) | <0.001 |
| Latency (ms) | 95.70 ± 10.92 | 88.73 ± 24.07 | 6.98 (−1.77; 15.72) | 0.116 |
| Dark-adapted 3.0 ERG | ||||
| Amplitude (µV) | 210.58 ± 19.62 | 31.96 ± 29.05 | 178.62 (166.95; 190.3) | <0.001 |
| Latency (ms) | 44.12 ± 6.77 | 60.11 ± 24.39 | −15.99 (−24.23; −7.75) | <0.001 |
| Light-adapted 3.0 ERG | ||||
| Amplitude (µV) | 124.28 ± 16.96 | 13.26 ± 10.56 | 111.02 (104.16; 117.92) | <0.001 |
| Latency (ms) | 27.54 ± 2.75 | 38.23 ± 6.15 | −10.69 (−12.49; −8.47) | <0.001 |
| Light-adapted 30 Hz flicker ERG | ||||
| Amplitude (µV) | 69.58 ± 10.52 | 10.22 ± 10.18 | 59.35 (54.19; 64.52) | <0.001 |
| Latency (ms) | 27.97 ± 2.54 | 34.48 ± 5.81 | −6.5 (−8.6; −4.39) | <0.001 |
| Variable | Controls | Cases | p-Value a |
|---|---|---|---|
| 4° (dB) | 16.8 (15.0–18.5) | 13.6 (9.2–23.8) | 0.002 |
| 8° (dB) | 14.2 (13.4–16.8) | 10.1 (4.9–20.7) | 0.005 |
| 20° (dB) | 11.6 (11.3–14.3) | 6.7 (2.8–16.7) | 0.004 |
| Perfusion Density | Controls | Cases | Mean Difference (95%CI) * | p-Value |
|---|---|---|---|---|
| SCP | ||||
| Medium central ring | 34.15 ± 5.19 | 34.94 ± 6.12 | −0.8 (−3.81; 2.22) | 0.600 |
| Large central ring | 42.09 ± 5.77 | 37.12 ± 5.41 | 4.97 (2.07; 7.86) | 0.001 |
| Superior ring | 46.82 ± 11.41 | 34.55 ± 11.18 | 12.26 (6.38; 18.15) | <0.001 |
| Temporal ring | 26.75 ± 7.75 | 21.73 ± 8.04 | 5.02 (0.97; 9.06) | 0.016 |
| Inferior ring | 49.46 ± 9.52 | 36.96 ± 9.38 | 12.51 (7.58; 17.43) | 0.001 |
| Tight central ring | 19.81 ± 9.45 | 23.34 ± 9.31 | −5.53 (−9.33; 1.74) | 0.121 |
| DCP | ||||
| Medium central ring | 40.32 ± 8.36 | 28.3 ± 7.68 | 12.02 (7.87; 16.17) | <0.001 |
| Large central ring | 45.64 ± 7.66 | 30.09 ± 7.25 | 15.55 (11.68; 19.42) | <0.001 |
| Superior ring | 43.13 ± 11.33 | 31.55 ± 8.67 | 11.58 (6.48; 16.68) | <0.001 |
| Temporal ring | 35.13 ± 7.30 | 19.63 ± 7.49 | 15.5 (11.62; 19.37) | <0.001 |
| Inferior ring | 48.59 ± 8.44 | 33.01 ± 6.93 | 15.58 (11.64; 19.52) | <0.001 |
| Tight central ring | 17.16 ± 6.33 | 17.44 ± 6.54 | −0.28 (−3.65; 3.1) | 0.870 |
| CC | ||||
| Medium central ring | 84.29 ± 1.86 | 78.85 ± 3.71 | 5.43 (3.8; 7.07) | <0.001 |
| Large central ring | 84.29 ± 1.80 | 79.39 ± 3.09 | 4.9 (3.51; 6.29) | <0.001 |
| Superior ring | 83.73 ± 2.26 | 78.51 ± 3.14 | 5.22 (3.74; 6.7) | <0.001 |
| Temporal ring | 85.84 ± 1.54 | 77.89 ± 4.90 | 7.95 (5.88; 10.02) | <0.001 |
| Inferior ring | 83.99 ± 1.81 | 76.41 ± 6.55 | 7.57 (4.83; 10.32) | <0.001 |
| Tight central ring | 83.93 ± 1.78 | 77.83 ± 4.32 | 6.09 (4.23; 7.95) | <0.001 |
| Vessel Length Density | Controls | Cases | Mean Difference (95%CI) * | p-Value |
|---|---|---|---|---|
| SCP | ||||
| Medium central | 19.50 ± 1.43 | 19.17 ± 1.78 | 0.33 (1.15; 0.49) | 0.423 |
| Large central | 19.16 ± 1.01 | 17.62 ± 1.53 | 1.54 (2.19; 0.89) | <0.001 |
| Superior | 19.83 ± 2.22 | 16.79 ± 0.98 | 3.04 (4.01; 2.08) | <0.001 |
| Temporal | 20.52 ± 2.00 | 19.50 ± 2.61 | 1.03 (0.23; 2.28) | 0.106 |
| Inferior | 19.66 ± 1.44 | 16.53 ± 0.72 | 3.13 (3.77; 2.49) | <0.001 |
| Tight central | 20.04 ± 1.53 | 19.52 ± 2.39 | 0.52 (1.62; −0.58) | 0.351 |
| DCP | ||||
| Medium central | 22.25 ± 2.22 | 20.80 ± 1.02 | 1.46 (4.29;1.37) | <0.001 |
| Large central | 22.49 ± 2.10 | 20.88 ± 1.80 | 1.60 (4.87; −1.66) | 0.016 |
| Superior | 22.48 ± 2.35 | 20.15 ± 1.44 | 2.33 (5.33; 0.66) | <0.001 |
| Temporal | 22.93 ± 4.00 | 20.58 ± 2.38 | 2.35 (3.97; 0.73) | 0.005 |
| Inferior | 22.35 ± 4.01 | 19.63 ± 1.46 | 2.72 (6.37; 0.92) | 0.008 |
| Tight central | 17.37 ± 2.92 | 19.57 ± 1.46 | 2.2 (3.32; 1.08) | <0.001 |
| CC | ||||
| Medium central | 10.85 ± 0.98 | 8.66 ± 1.04 | 2.19 (2.72; 1.67) | <0.001 |
| Large central | 10.67 ± 0.78 | 8.71 ± 1.03 | 1.95 (2.42; 1.49) | <0.001 |
| Superior | 10.35 ± 0.98 | 8.91 ± 1.35 | 1.44 (2.04; 0.85) | <0.001 |
| Temporal | 10.84 ± 1.35 | 8.3 ± 1.15 | 2.54 (3.21; 1.87) | <0.001 |
| Inferior | 11.05 ± 1.03 | 8.89 ± 1.28 | 2.16 (2.75; 1.57) | <0.001 |
| Tight central | 11.1 ± 1.23 | 8.74 ± 1.09 | 2.36 (2.98; 1.74) | <0.001 |
| Perfusion Density | Vessel Length Density | |||
|---|---|---|---|---|
| Controls | Cases | Controls | Cases | |
| Peripheral sectors SCP | Large central SCP | Large central SCP | ||
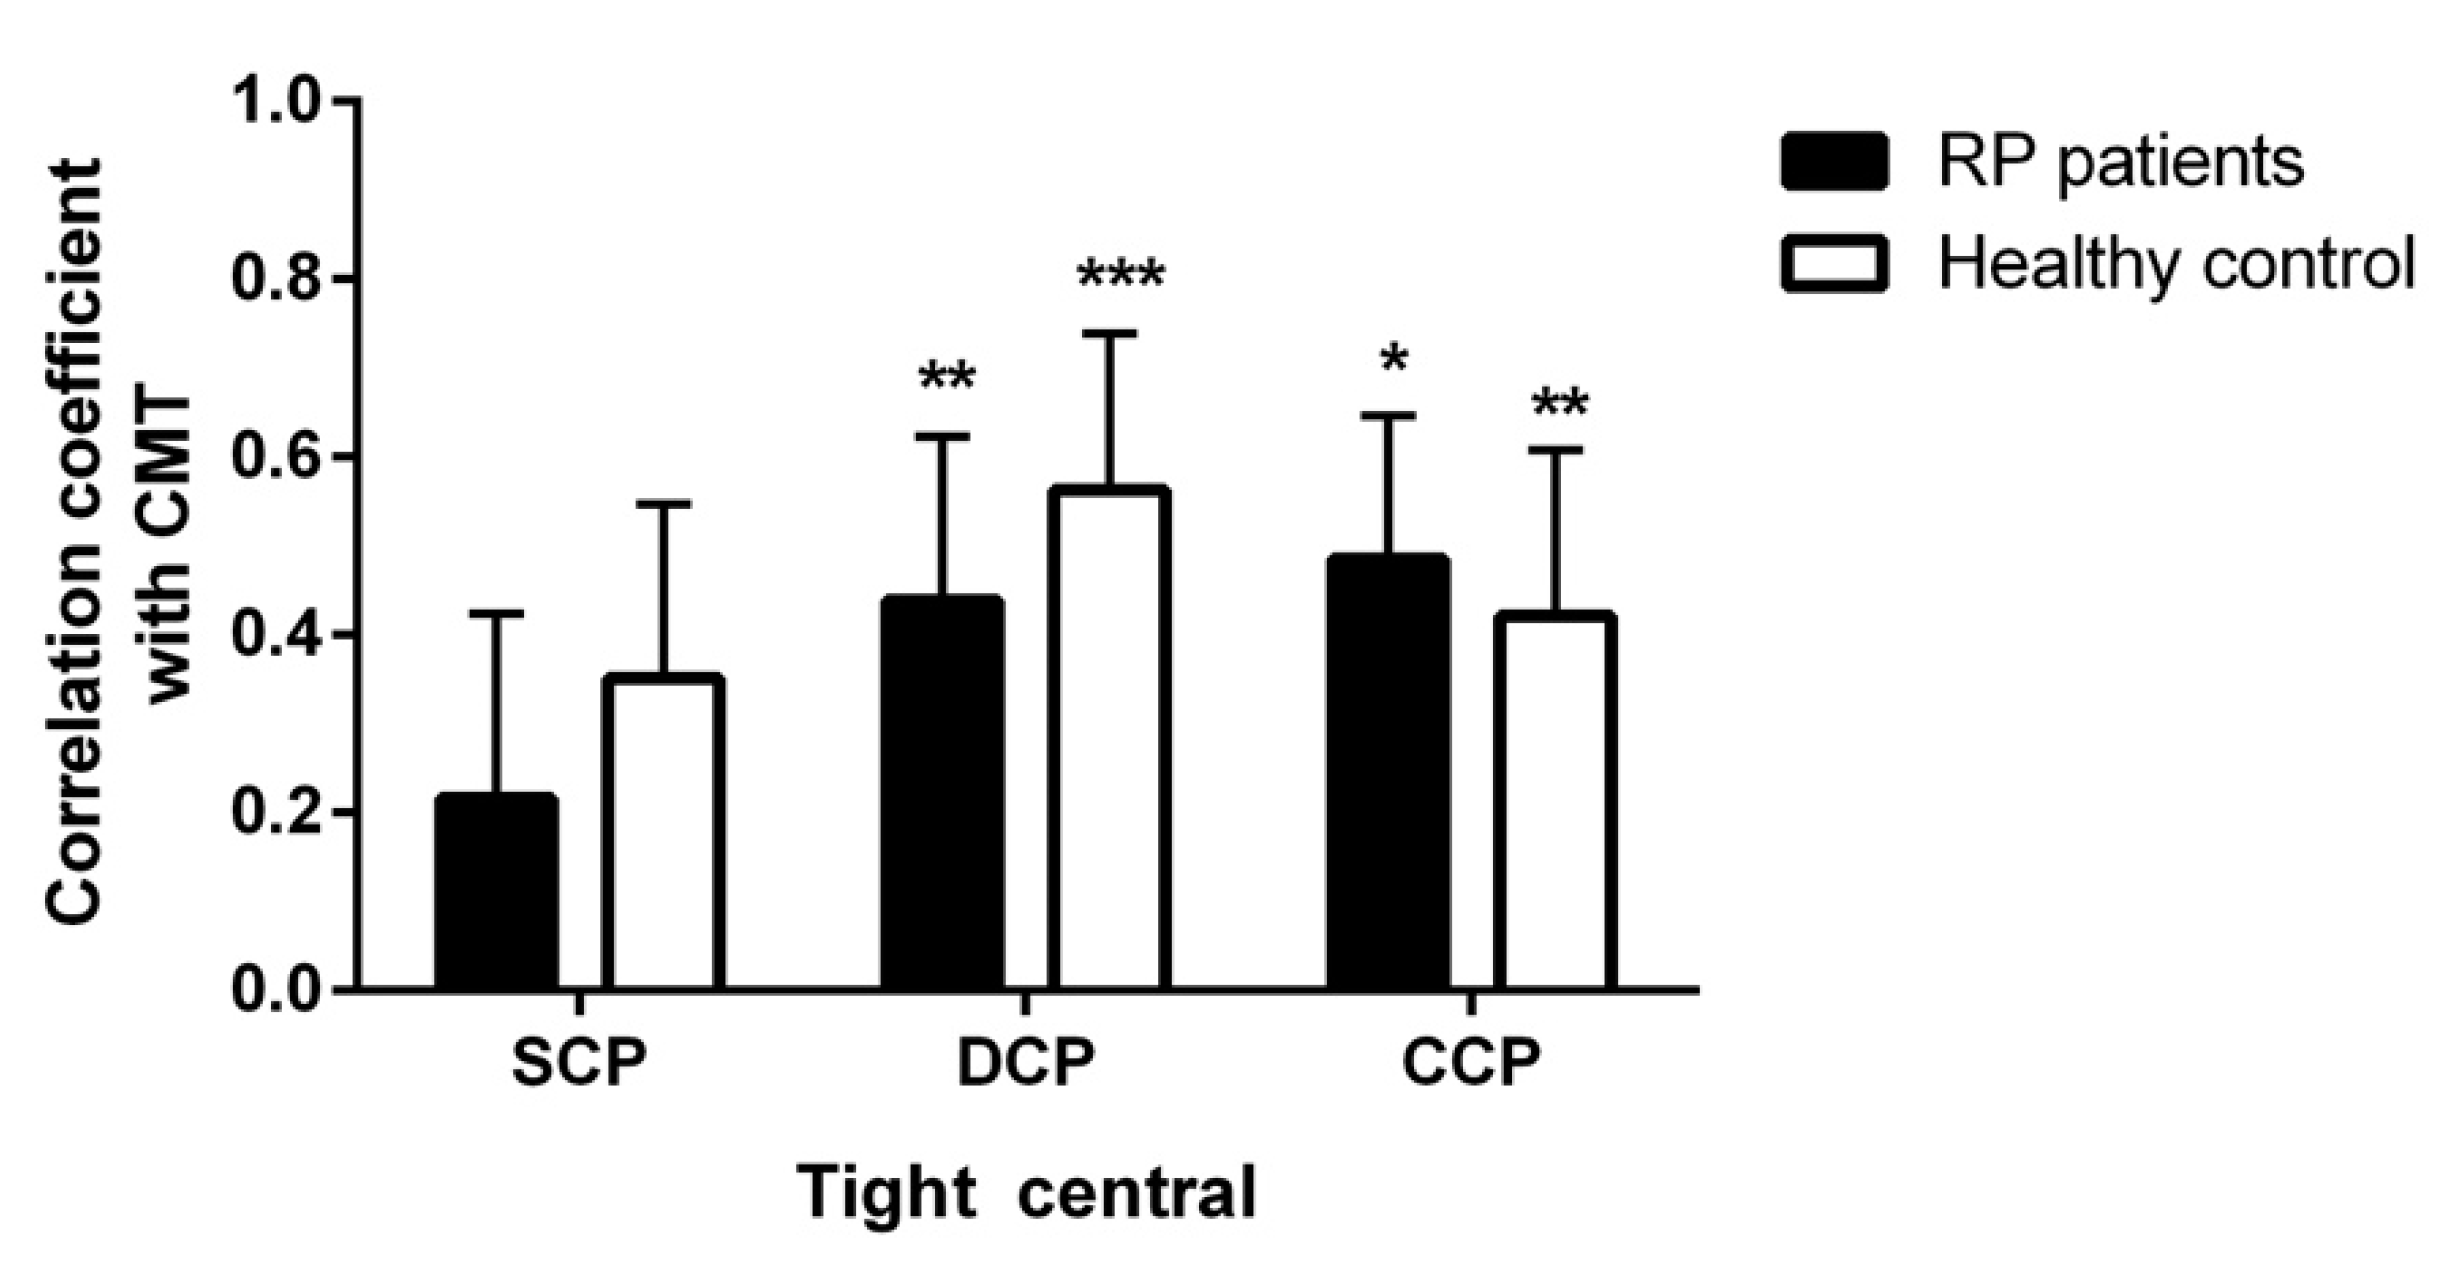
| Superior | 0.717 *** | 0.010 | 0.485 | 0.537 ** |
| Temporal | 0.804 *** | 0.175 | 0.433 * | 0.554 ** |
| Inferior | 0.857 *** | 0.055 | 0.703 * | 0.269 |
| Peripheral sectors DCP | Large central DCP | Large central DCP | ||
| Superior | 0.713 *** | 0.076 | 0.995 *** | 0.301 |
| Temporal | 0.791 *** | 0.181 | 0.966 *** | 0.576 *** |
| Inferior | 0.826 *** | 0.230 | 0.993 *** | 0.077 |
| Peripheral sectors CC | Large central CCP | Large central CCP | ||
| Superior | 0.548 ** | 0.215 | 0.900 *** | 0.162 |
| Temporal | 0.778 *** | 0.251 | 0.909 *** | 0.290 |
| Inferior | 0.566 ** | 0.156 | 0.874 *** | 0.075 |
| Microperimetry 4° Ring | Microperimetry 8° Ring | ||||
|---|---|---|---|---|---|
| Cases | Controls | Cases | Controls | ||
| Perfusion density | Perfusion density | ||||
| Tight central SCP | 0.474 ** | −0.036 | Medium central SCP | 0.309 * | −0.010 |
| Tight central DCP | 0.115 | −0.056 | Medium central DCP | 0.268 | −0.037 |
| Tight central CC | 0.393 * | −0.357 | Medium central CC | 0.508 *** | −0.311 |
| Vessel Length density | Vessel Length density | ||||
| Tight central SCP | 0.245 | 0.027 | Medium central SCP | −0.160 | −0.079 |
| Tight central DCP | −0.034 | 0.045 | Medium central DCP | −0.438 ** | −0.273 |
| Tight central CC | −0.337 * | 0.354 | Medium central CC | −0.498 *** | 0.335 |
© 2020 by the authors. Licensee MDPI, Basel, Switzerland. This article is an open access article distributed under the terms and conditions of the Creative Commons Attribution (CC BY) license (http://creativecommons.org/licenses/by/4.0/).
Share and Cite
Mastropasqua, R.; D’Aloisio, R.; De Nicola, C.; Ferro, G.; Senatore, A.; Libertini, D.; Di Marzio, G.; Di Nicola, M.; Di Martino, G.; Di Antonio, L.; et al. Widefield Swept Source OCTA in Retinitis Pigmentosa. Diagnostics 2020, 10, 50. https://doi.org/10.3390/diagnostics10010050
Mastropasqua R, D’Aloisio R, De Nicola C, Ferro G, Senatore A, Libertini D, Di Marzio G, Di Nicola M, Di Martino G, Di Antonio L, et al. Widefield Swept Source OCTA in Retinitis Pigmentosa. Diagnostics. 2020; 10(1):50. https://doi.org/10.3390/diagnostics10010050
Chicago/Turabian StyleMastropasqua, Rodolfo, Rossella D’Aloisio, Chiara De Nicola, Giada Ferro, Alfonso Senatore, Daniele Libertini, Guido Di Marzio, Marta Di Nicola, Giuseppe Di Martino, Luca Di Antonio, and et al. 2020. "Widefield Swept Source OCTA in Retinitis Pigmentosa" Diagnostics 10, no. 1: 50. https://doi.org/10.3390/diagnostics10010050
APA StyleMastropasqua, R., D’Aloisio, R., De Nicola, C., Ferro, G., Senatore, A., Libertini, D., Di Marzio, G., Di Nicola, M., Di Martino, G., Di Antonio, L., & Toto, L. (2020). Widefield Swept Source OCTA in Retinitis Pigmentosa. Diagnostics, 10(1), 50. https://doi.org/10.3390/diagnostics10010050