Article

Regulatory Mechanisms of Phytohormones in Thiocyanate-Exposed Rice Plants: Integrating Multi-Omics Profiling with Mathematical Modeling

College of Environmental Science & Engineering, Guilin University of Technology, Guilin 541004, China
*
Author to whom correspondence should be addressed.
Life 2025, 15(3), 486; https://doi.org/10.3390/life15030486
Submission received: 25 February 2025 / Revised: 13 March 2025 / Accepted: 14 March 2025 / Published: 18 March 2025
(This article belongs to the Special Issue Plant Biotic and Abiotic Stresses 2024)

Abstract

:
Plants experience various abiotic stresses, among which pollutant stress is one of the most damaging, threatening plant productivity and survival. Thiocyanate (SCN), a recalcitrant byproduct of industrial processes, poses escalating threats to agroecosystems by disrupting plant hormonal homeostasis, which is critical for stress adaptation. Here, we dissect the regulatory interplay of phytohormones in rice (Oryza sativa L.) under SCN stress (4.80–124.0 mg SCN/L) through integrated transcriptomic and metabolomic profiling. Quantitative hormonal assays revealed dose- and tissue-specific perturbations in phytohormone homeostasis, with shoots exhibiting higher sensitivity than roots. Transcriptomic analysis revealed that a number of differentially expressed genes (DEGs) mapped in different phytohormone pathways in SCN-treated rice seedlings, and their transcript abundances are tissue-specific. To identify the phytohormones governing rice’s sensitivity to SCN stress, we developed a Total Hormonal Sensitivity Index (THSI) through an integrative multivariate framework, which combines Modified Variable Importance in Projection (VIP(m)) scores to quantify hormonal fluctuations and Total Weighted Contribution Scores (TWCS) at the gene-level from hormonal pathways. This study establishes a system-level understanding of how phytohormonal crosstalk mediates rice’s adaptation to SCN stress, providing biomarkers for phytoremediation strategies in contaminated paddies.

1. Introduction

Although minor thiocyanate (SCN) can be naturally produced through the microbial degradation of cyanogenic glycosides in decomposing vegetation [1], anthropogenic sources dominate environmental contamination. Key industrial emitters include coal coking, cyanide-based metal extraction, petrochemical refining, and agrochemical manufacturing [2,3,4]. The compound’s environmental persistence stems from high water solubility and resistance to aerobic degradation, enabling widespread dispersion through soil–water systems [5]. Regulatory deficiencies in effluent management have exacerbated environmental accumulation in different matrices [6]. Therefore, it is not surprising that such bioaccumulation potential elevates ecological risks, which eventually make their entry into the food chain and pose a threat to all living organisms [7,8]. In spite of available research demonstrating SCN assimilation in plants through either the COS pathway or CNO pathway, limited enzymatic efficiency results in the accumulation of SCN in plants [9]. Tissue burdens of SCN in plants adversely affect growth and development through multiple mechanisms, including growth inhibition, oxidative stress, photosynthetic impairment, hormonal imbalance, alterations in free amino acid profiles, and the suppression of antioxidant enzyme functionality [8,10,11,12,13].
Plants have developed comprehensive metabolic networks to support their growth and maintain vital cellular functions [14]. One of the most important integral components is phytohormones, which function in multiple processes of biological and chemical reactions in their primary and secondary metabolic pathways [15,16]. Phytohormones, as central regulators of plant growth, development, and stress adaptation, orchestrate intricate regulatory networks that enable plants to adapt to diverse environmental challenges [17,18]. Most phytohormones mainly include auxins (IAA), cytokinins (CK), gibberellins (GA), abscisic acid (ABA), ethylene (ET), jasmonates (JA), salicylic acid (SA), brassinosteroids (BR) [19,20,21]. Individual hormonal pathways in plants have been extensively characterized [22,23]; for instance, IAA drives cell elongation and root development, while CK promotes cell division and shoot growth [24,25]. GA regulates stem elongation and seed germination, whereas ABA induces stomatal closure during drought [26,27,28]. ET coordinates fruit ripening and senescence, while JA and SA mediate defense against herbivores and pathogens [29,30,31,32,33]. BR enhances various stress levels of tolerance and photomorphogenesis [34,35,36]. However, current studies often focus on single phytohormones in plants, and their synergistic or antagonistic crosstalk under stress conditions remains poorly resolved. This knowledge gap is particularly pronounced in staple crops like rice, where hormonal trade-offs between yield and stress resilience require urgent characterization [21].
As a staple crop feeding billions, rice relies on hormones like IAA, CK, ABA, and JA to balance resource allocation between yield-related processes and environmental resilience [21]. Despite established links between SCN exposure and oxidative/metabolic dysfunction in plants [8,10,11,12,13], the regulatory hierarchy of phytohormones in mediating rice responses remains unclear. This knowledge gap hinders the development of strategies to mitigate SCN phytotoxicity. Here, we integrate transcriptomics and hormonal profiling with mathematical modeling to unravel the regulatory modes of phytohormones in SCN-stressed rice, providing a full picture of stress adaptation and identifying hub phytohormones that coordinate growth–stress trade-offs. Thus, the specific objectives of this study include (1) mapping dose-dependent phytohormone fluctuations; (2) characterizing activated genes in hormonal pathways; (3) calculating tissue-specific VIP(m) through the VIP/VF integration; (4) estimating pathway-level TWCS from transcriptional networks; and (5) modeling tissue-specific THSI via VIP(m)-TWCS convergence and identifying hub hormones. This systems-level approach elucidates the regulatory circuitry governing rice’s SCN adaptation, providing actionable targets for phytoremediation strategies that coordinate growth–stress trade-offs.

2. Materials and Methods

2.1. Plant Materials and Experiment Design

Rice (Oryza sativa L. XZX 45) seeds were planted in small cups filled with sandy soil and grown under controlled environmental conditions (light intensity: 20,000 lux, temperature: 25 ± 0.5 °C, humidity: 60 ± 2%). The growth medium comprised a modified ISO 8692 nutrient solution, as described by Feng et al. [37]. Following 16-day cultivation in the climate chamber, uniformly sized rice seedlings were screened for further experiments. Experimental groups received hydroponic solutions supplemented with potassium thiocyanate (KSCN, Sinopharm Chemical Reagent Co., Ltd., Shanghai, China) at 0 (control), 4.80 (low), 20.0 (medium), and 124.0 mg SCN/L (high) [11]. The three concentrations used represent three effective concentrations with the growth inhibition of rice seedlings by 10%, 20%, and 50%, respectively, as determined in our previous study [11]. Vessels were sealed with aluminum foil to prevent photodegradation and algal contamination. The trial employed a completely randomized design with three biological replicates per treatment, which were harvested 72 h post-exposure for endpoint analyses.

2.2. Measurements of Phytohormones

Phytohormone-targeting metabolomic assays were used to determine the concentration of 17 individual phytohormones in the roots and shoots of SCN-treated rice plants. After 3 d of exposure, tissue samples were harvested from different treatments with three biological replications and grounded in liquid N. Each powdery sample (100 mg) was combined with 30 μL of isotope internal standards and 1170 μL of a chilled acetonitrile/water/formic acid solution (80:19:1, v/v/v). The mixture was thoroughly vortexed and then subjected to ultrasonication for 25 min at 4 °C. Next, the mixture was centrifuged at 14,000× g for 20 min at 4 °C. The supernatant was filtered using an Ostro 25 mg 96-well plate with the aid of a positive pressure device. Subsequently, the filtrate was collected and transferred to a 2 mL EP tube for phytohormone analysis (stored at −80 °C). Targeted phytohormone metabolic assays were conducted by Shanghai Applied Protein Technology Co., Ltd. (Shanghai, China) using ultra-performance liquid chromatography (UPLC, 1290 Infinity LC, Agilent Technologies, Santa Clara, CA, USA) coupled with a QTRAP (AB Sciex 6500+).

2.3. Identification of Genes Activated in Different Hormonal Pathways
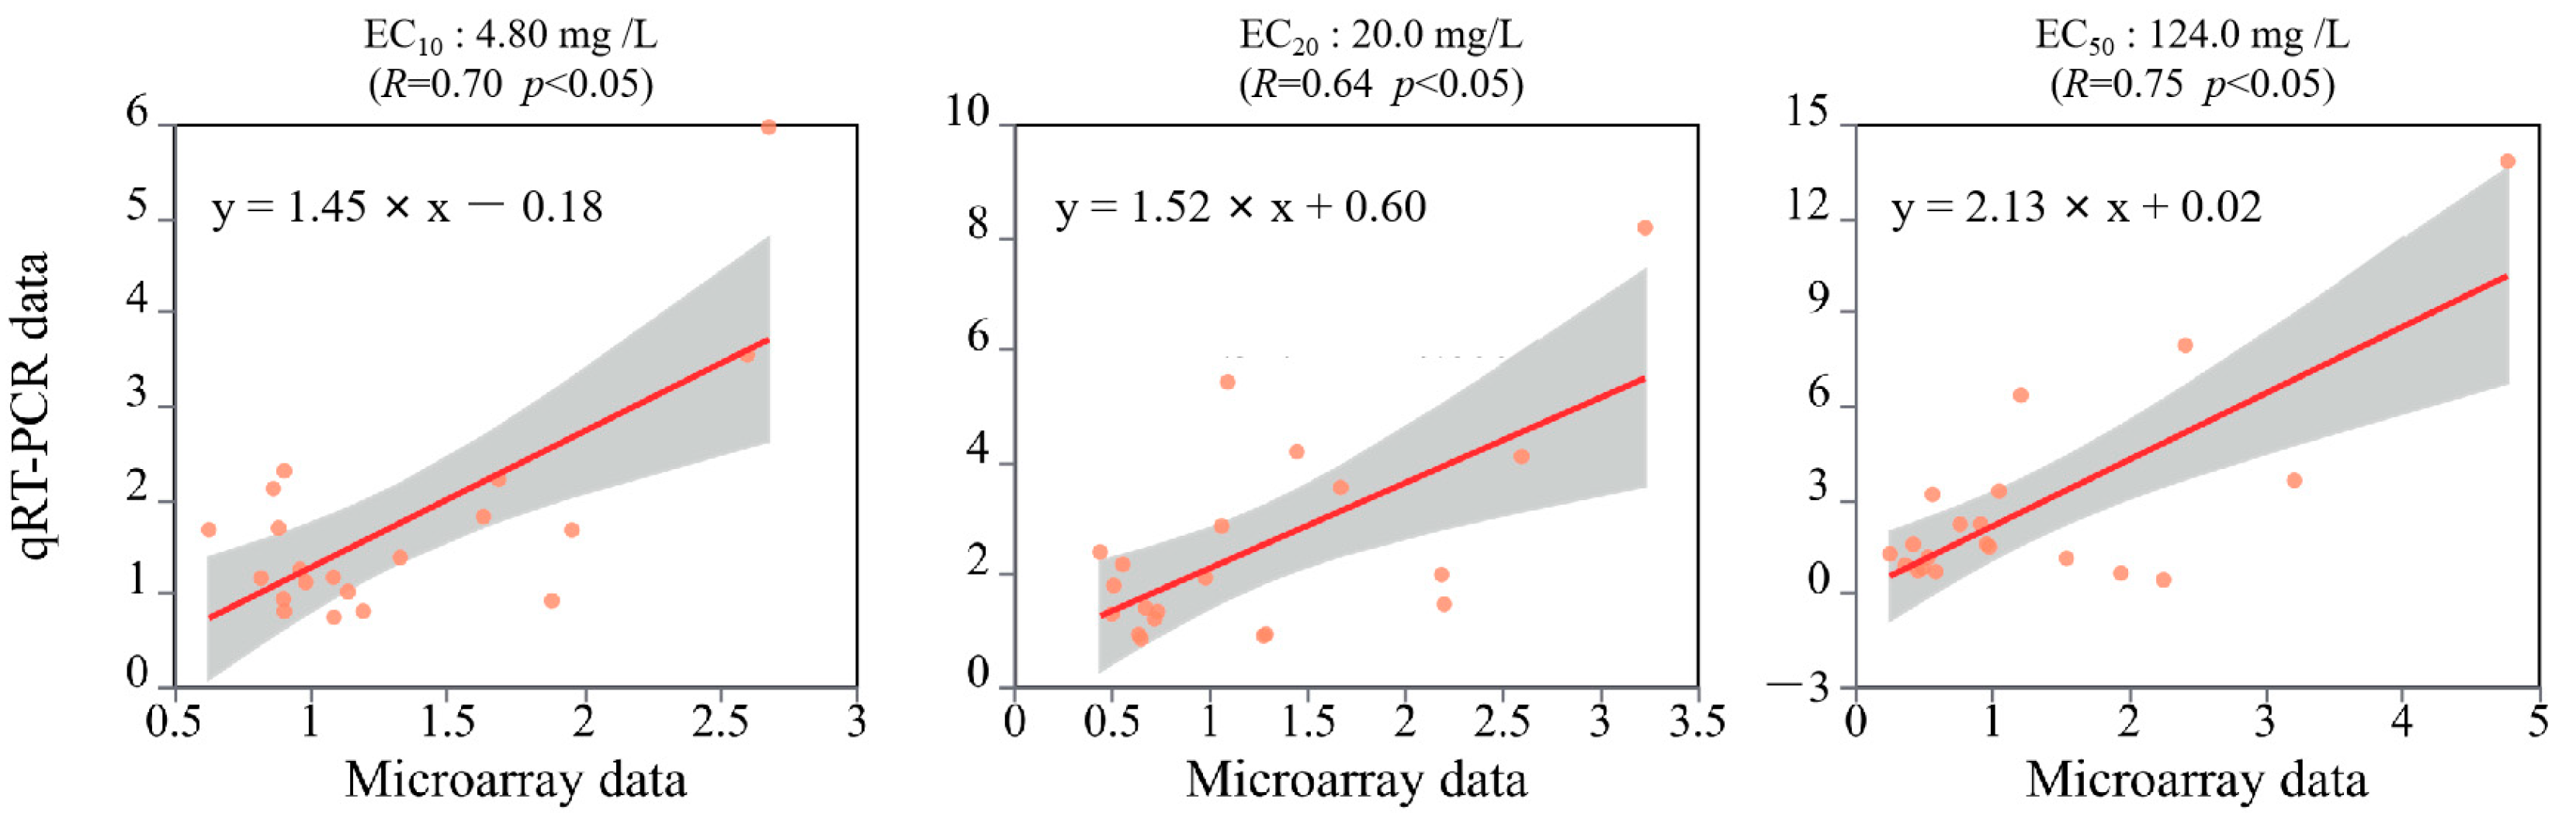
Total RNA was isolated from SCN-treated and control rice tissues using the Ultrapure RNA Kit (CWBio, Taizhou, China), followed by the DNase I treatment (same manufacturer) to eliminate genomic DNA contamination. RNA purification was completed using the RNeasy MinElute Kit (Qiagen, Hilden, Germany). The total RNA sample QC report is provided in Supplementary Materials File S1. Comprehensive transcriptome analysis was conducted with the Agilent 4X44K rice microarray platform. All hybridization procedures, including array washing, fluorescent staining, and slide scanning, were performed by Shanghai Biotechnology Corporation (Shanghai, China) using standardized protocols. Experimental data were processed through their proprietary bioinformatics. Differentially expressed genes (DEGs) were defined using dual criteria: the fold change threshold was less than 0.5 or greater than 2.0 (p < 0.05) [38].
To confirm the microarray results, RT-qPCR validation was conducted using the original RNA samples. Twenty genes were randomly selected for verification. Primer sequences and amplification details are provided in Supplementary Table S1. Reactions were performed on the 7500 system (Applied Biosystems) with SYBR Green under the following cycling conditions: 95 °C for 10 s, 58 °C for 30 s, and 72 °C for 32 s (40 cycles). Rice GAPDH (LOC_Os08g03290) served as the reference gene [8]. Gene expression levels were calculated using the 2−ΔΔCT method with four technical replicates [8].
The DEGs involved in the phytohormones pathways in rice plants detected from different SCN treatments were identified by the MapMan database (https://mapman.gabipd.org/, Version 3.6.0RC1, accessed on 10 January 2025). The detailed list of DEGs mapped in hormonal pathways is provided in Supplementary Materials File S2.

2.4. Data Analysis

Phytohormone quantification assays were performed in triplicate biological replicates, with experimental results expressed as the mean ± SD. Inter-group comparisons between control and treated samples were evaluated using Tukey’s multiple comparison test, with statistical significance defined at p < 0.05.

3. Results

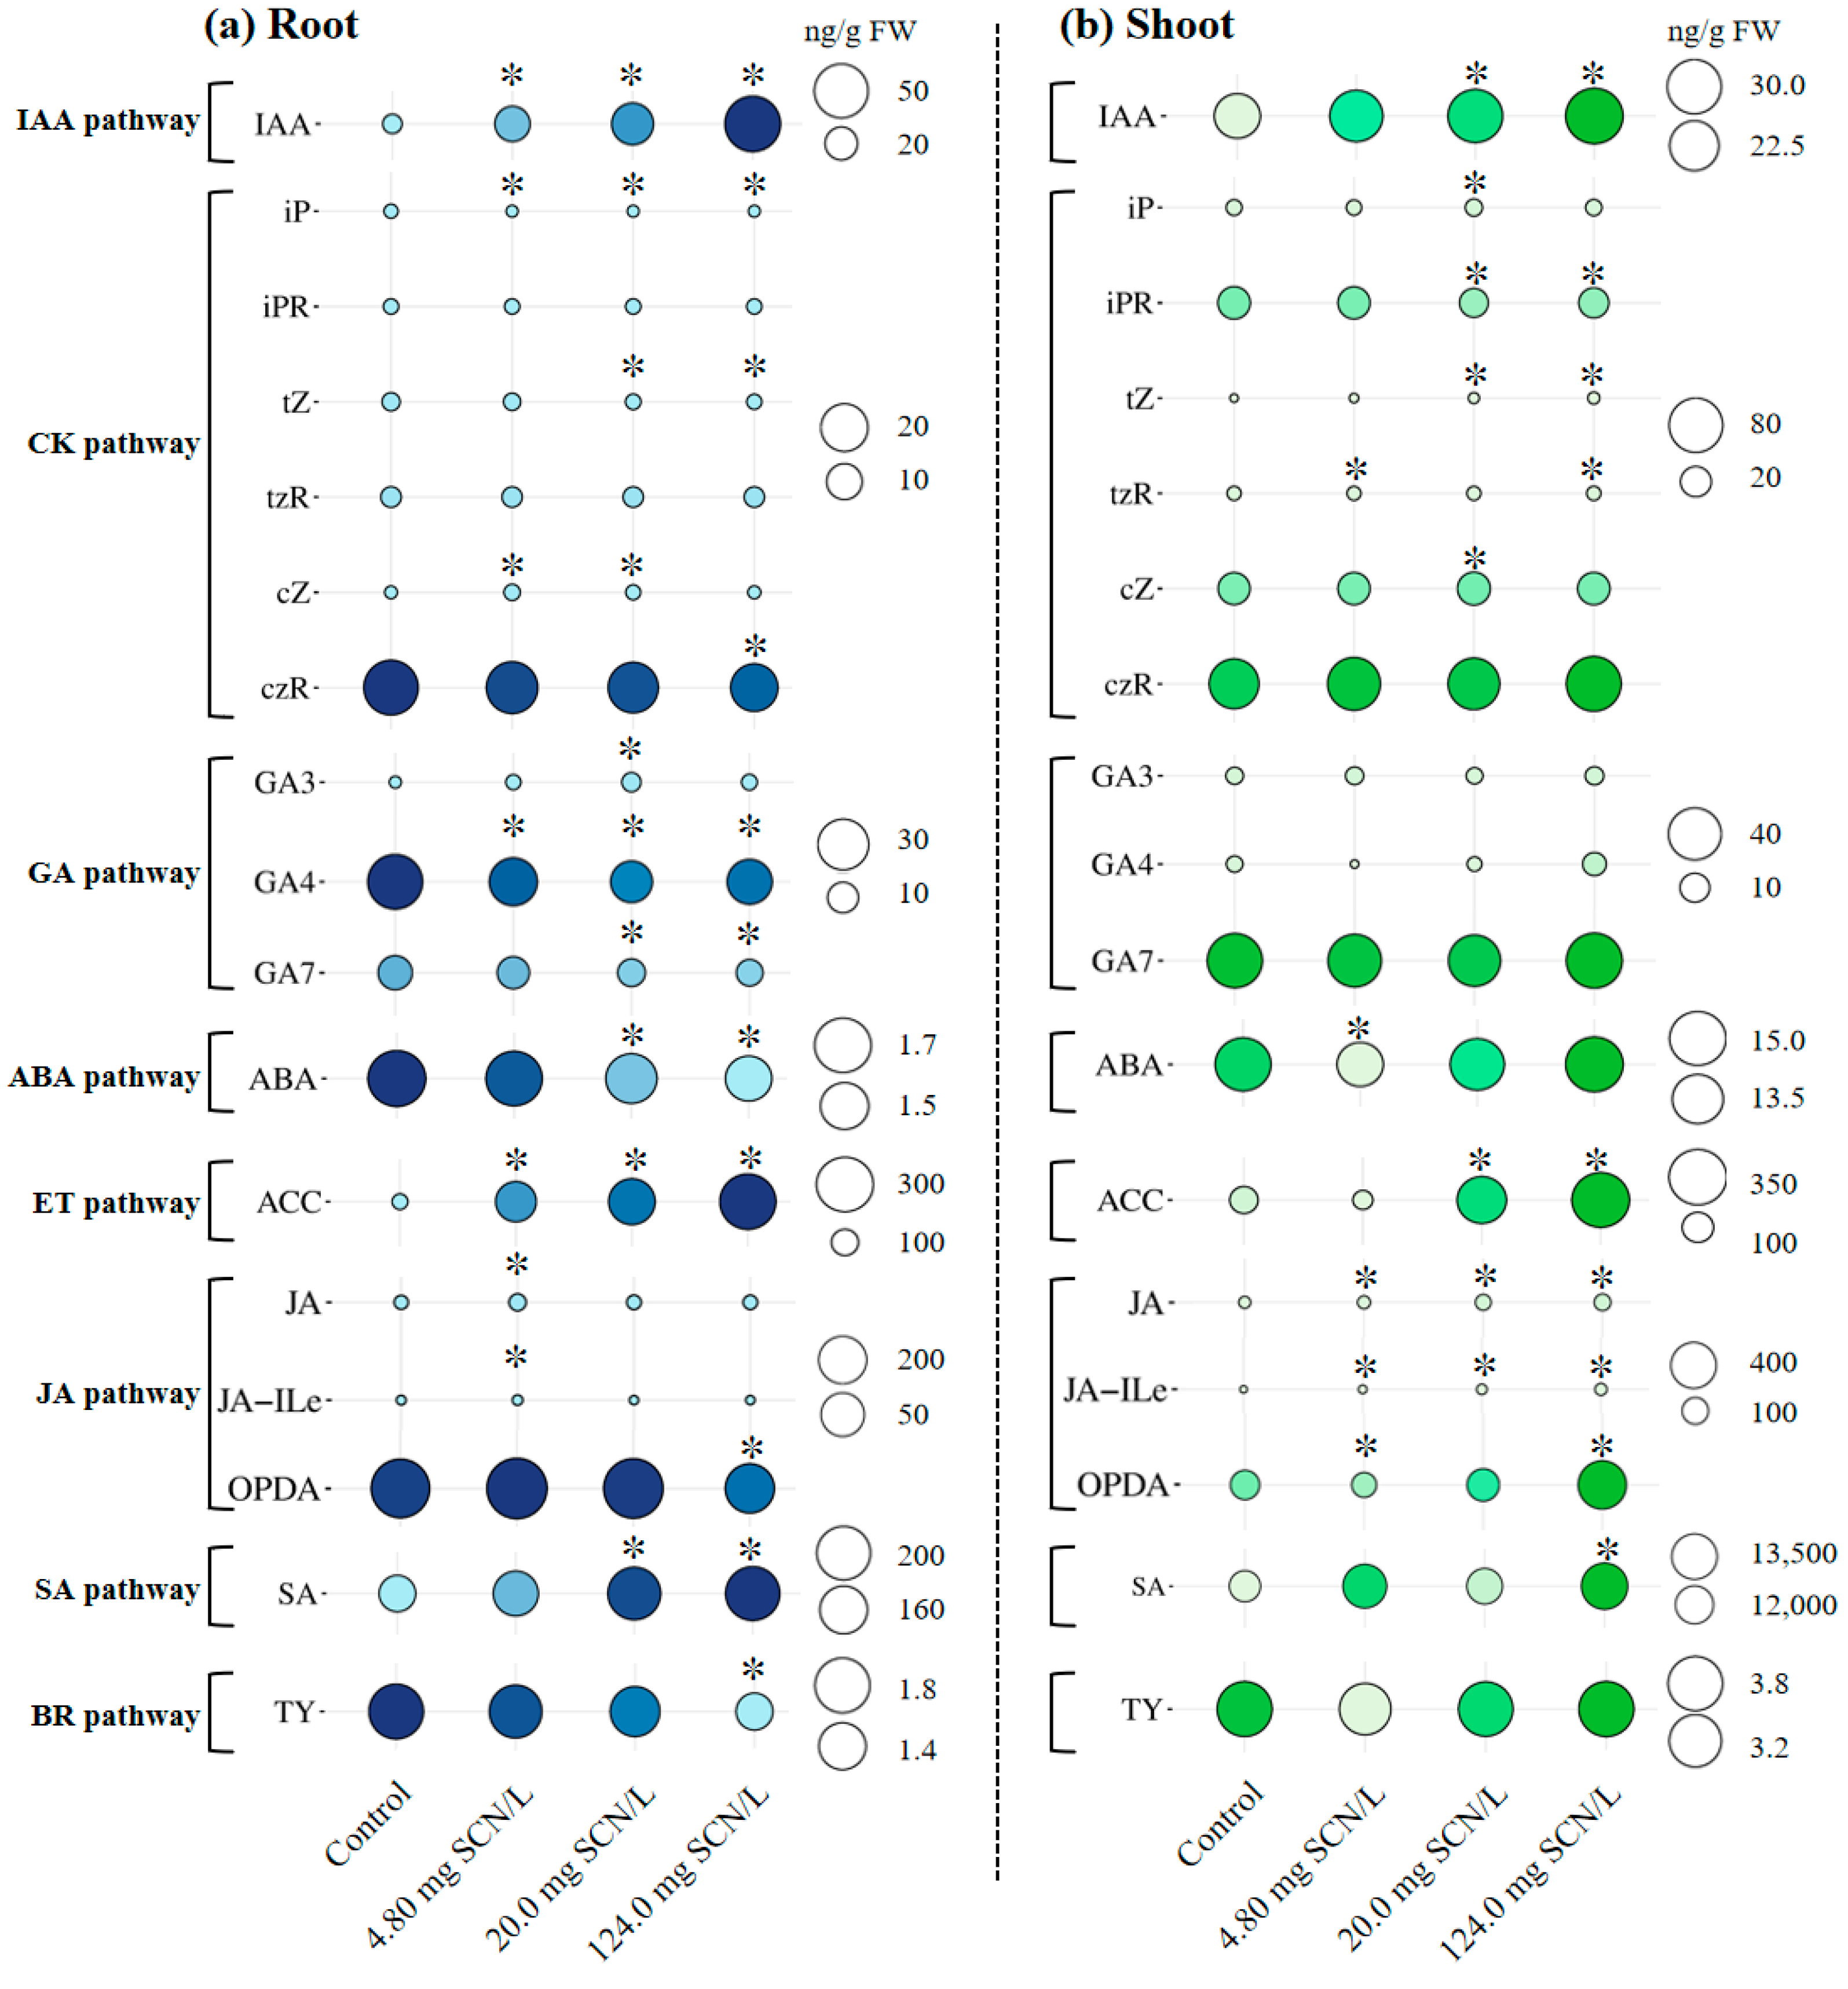
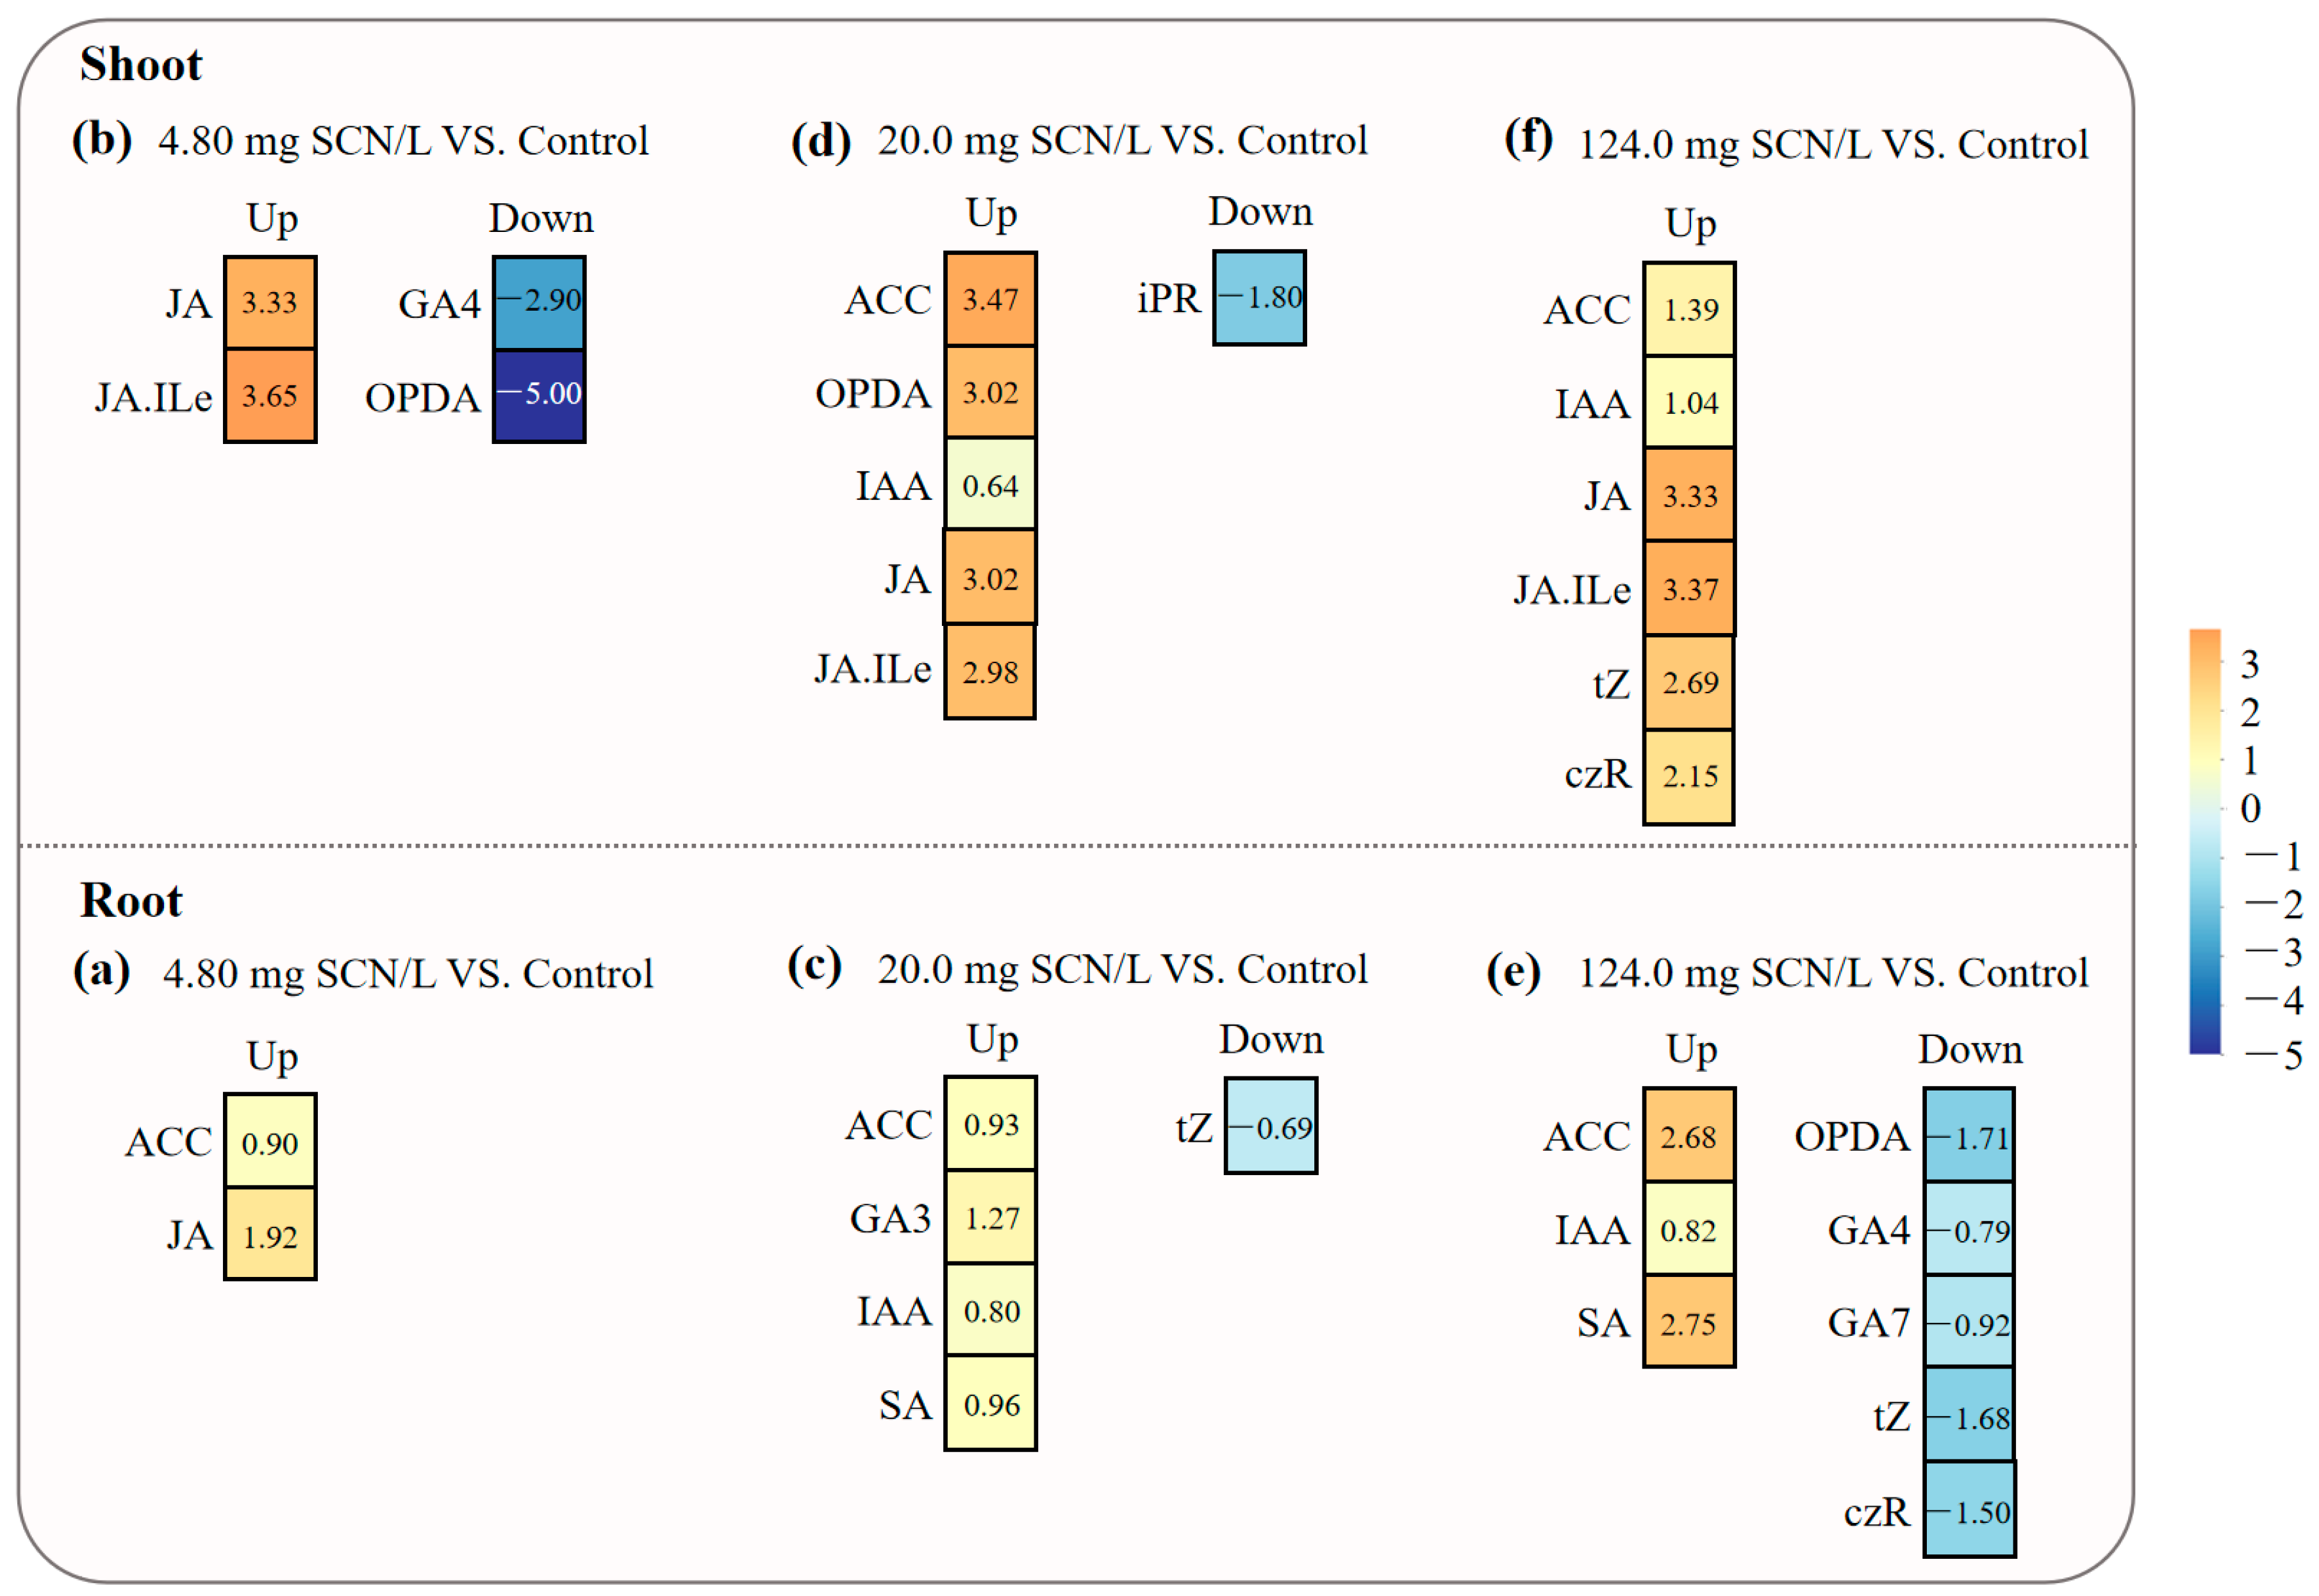
3.1. Concentrations of Phytohormones in SCN-Treated Rice Plants

Seventeen distinct phytohormones or related intermediates were identified in SCN-treated rice plants: abscisic acid (ABA), salicylic acid (SA), indole-3-acetic acid (IAA), 1-aminocyclopropanecarboxylic acid (ACC), jasmonic acid (JA), jasmonoyl-isoleucine (JA-Ile), oxo-phytodienoic acid (OPDA), isopentenyladenine (iP), isopentenyladenosine (iPR), trans-zeatin (tZ), trans-zeatin riboside (tZR), cis-zeatin (cZ), cis-zeatin riboside (cZR), gibberellin 3 (GA3), gibberellin 4 (GA4), gibberellin 7 (GA7), and typhasterol (TY). These compounds were classified into the following respective biosynthetic pathways: ACC (ET pathway); JA, JA-Ile, and OPDA (JA pathway); iP, iPR, tZ, tZR, cZ, and cZR (CK pathway); GA3, GA4, and GA7 (GA pathway); and TY (BR pathway).
Figure 1 illustrates the tissue-specific concentrations of these phytohormones across different SCN treatments. Notably, the hormonal profiles exhibited both tissue-dependent variations and concentration-dependent responses to SCN exposure.

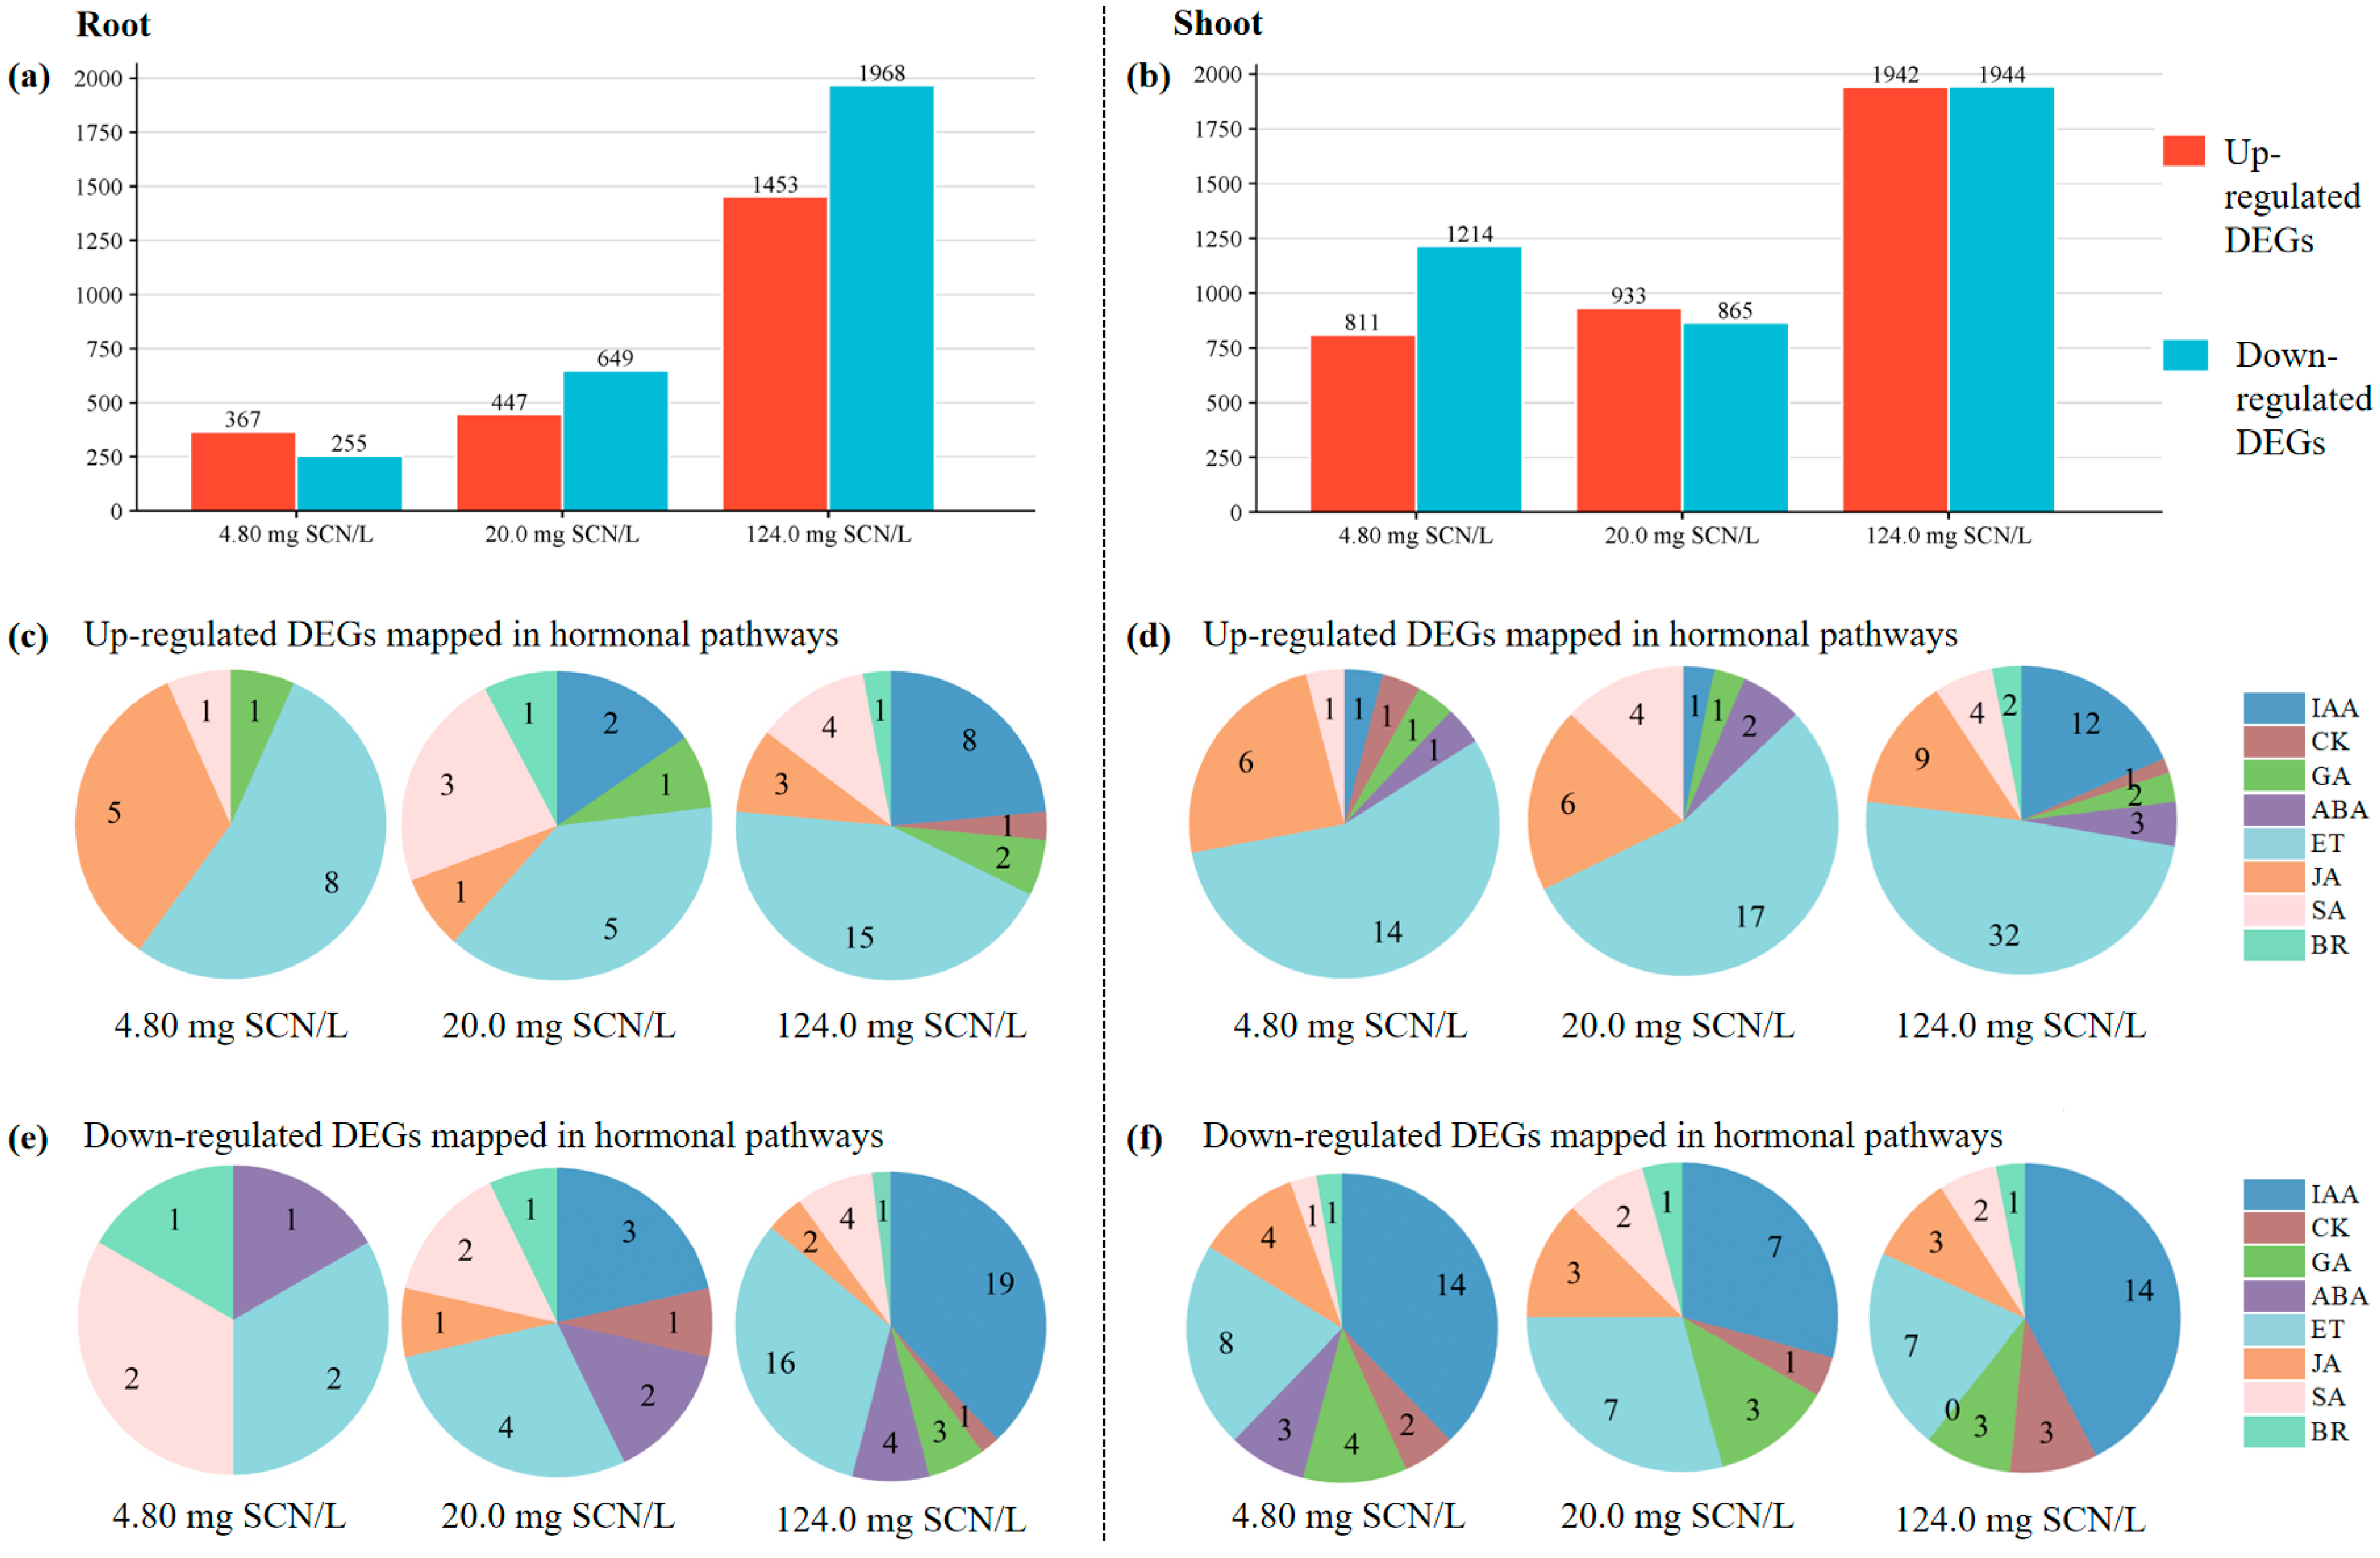
3.2. Identification of DEGs Activated in the Phytohormone Pathways

The transcriptional profiling of SCN-treated rice plants was performed using the Agilent Rice Genome Array. Differential gene expression analysis revealed 2647 (622 root/2025 shoot), 2898 (1096/1798), and 7307 (3421/3886) total DEGs at SCN concentrations of 4.80, 20.0, and 124.0 mg SCN/L, respectively (Figure 2). The following tissue-specific responses were observed: in roots, 367, 447, and 1453 genes were up-regulated versus 255, 649, and 1968 down-regulated genes across the three treatments (Figure 2a). Conversely, shoots exhibited 811, 933, and 1942 up-regulated genes compared to 1214, 865, and 1944 down-regulated genes (Figure 2b).
To confirm the validity of the microarray dataset, gene expressions across SCN treatment conditions were quantified through the calculation of log2-transformed fold-changes. Subsequent qRT-PCR validation revealed concordant transcriptional profiles between both analytical platforms for all interrogated genes. The Pearson correlation coefficient (R) derived from the comparative analysis of expression patterns served as a critical metric for statistical validation, judged by the critical R for a given n (α = 5%) [11], demonstrating statistically significant concordance (p < 0.05) between the microarray and qRT-PCR quantification results (Figure 3).
To better understand the DEGs associated with the phytohormone pathways, MapMan pathway enrichment analysis was performed. The number of hormone-related DEGs from different SCN treatments is presented in Figure 2c–f. For example, 8, 5, and 15 significantly up-regulated DEGs were mapped in the ET pathway in the roots of rice plants at 4.80, 20.0, and 124.0 mg SCN/L, respectively, while 2, 4, and 16 significantly down-regulated DEGs were mapped in the ET pathway in the roots at their respective SCN treatment concentrations. In the shoots of SCN-treated rice seedlings, 14, 17, and 32 significantly up-regulated DEGs were mapped in the ET pathway at 4.80, 20.0, and 124.0 mg SCN/L, respectively, while 8, 7, and 17 significantly down-regulated DEGs were mapped in the ET pathway in the roots at their respective SCN treatment concentration. We also noticed that more CK-related DEGs were identified, especially at 124.0 mg SCN/L.

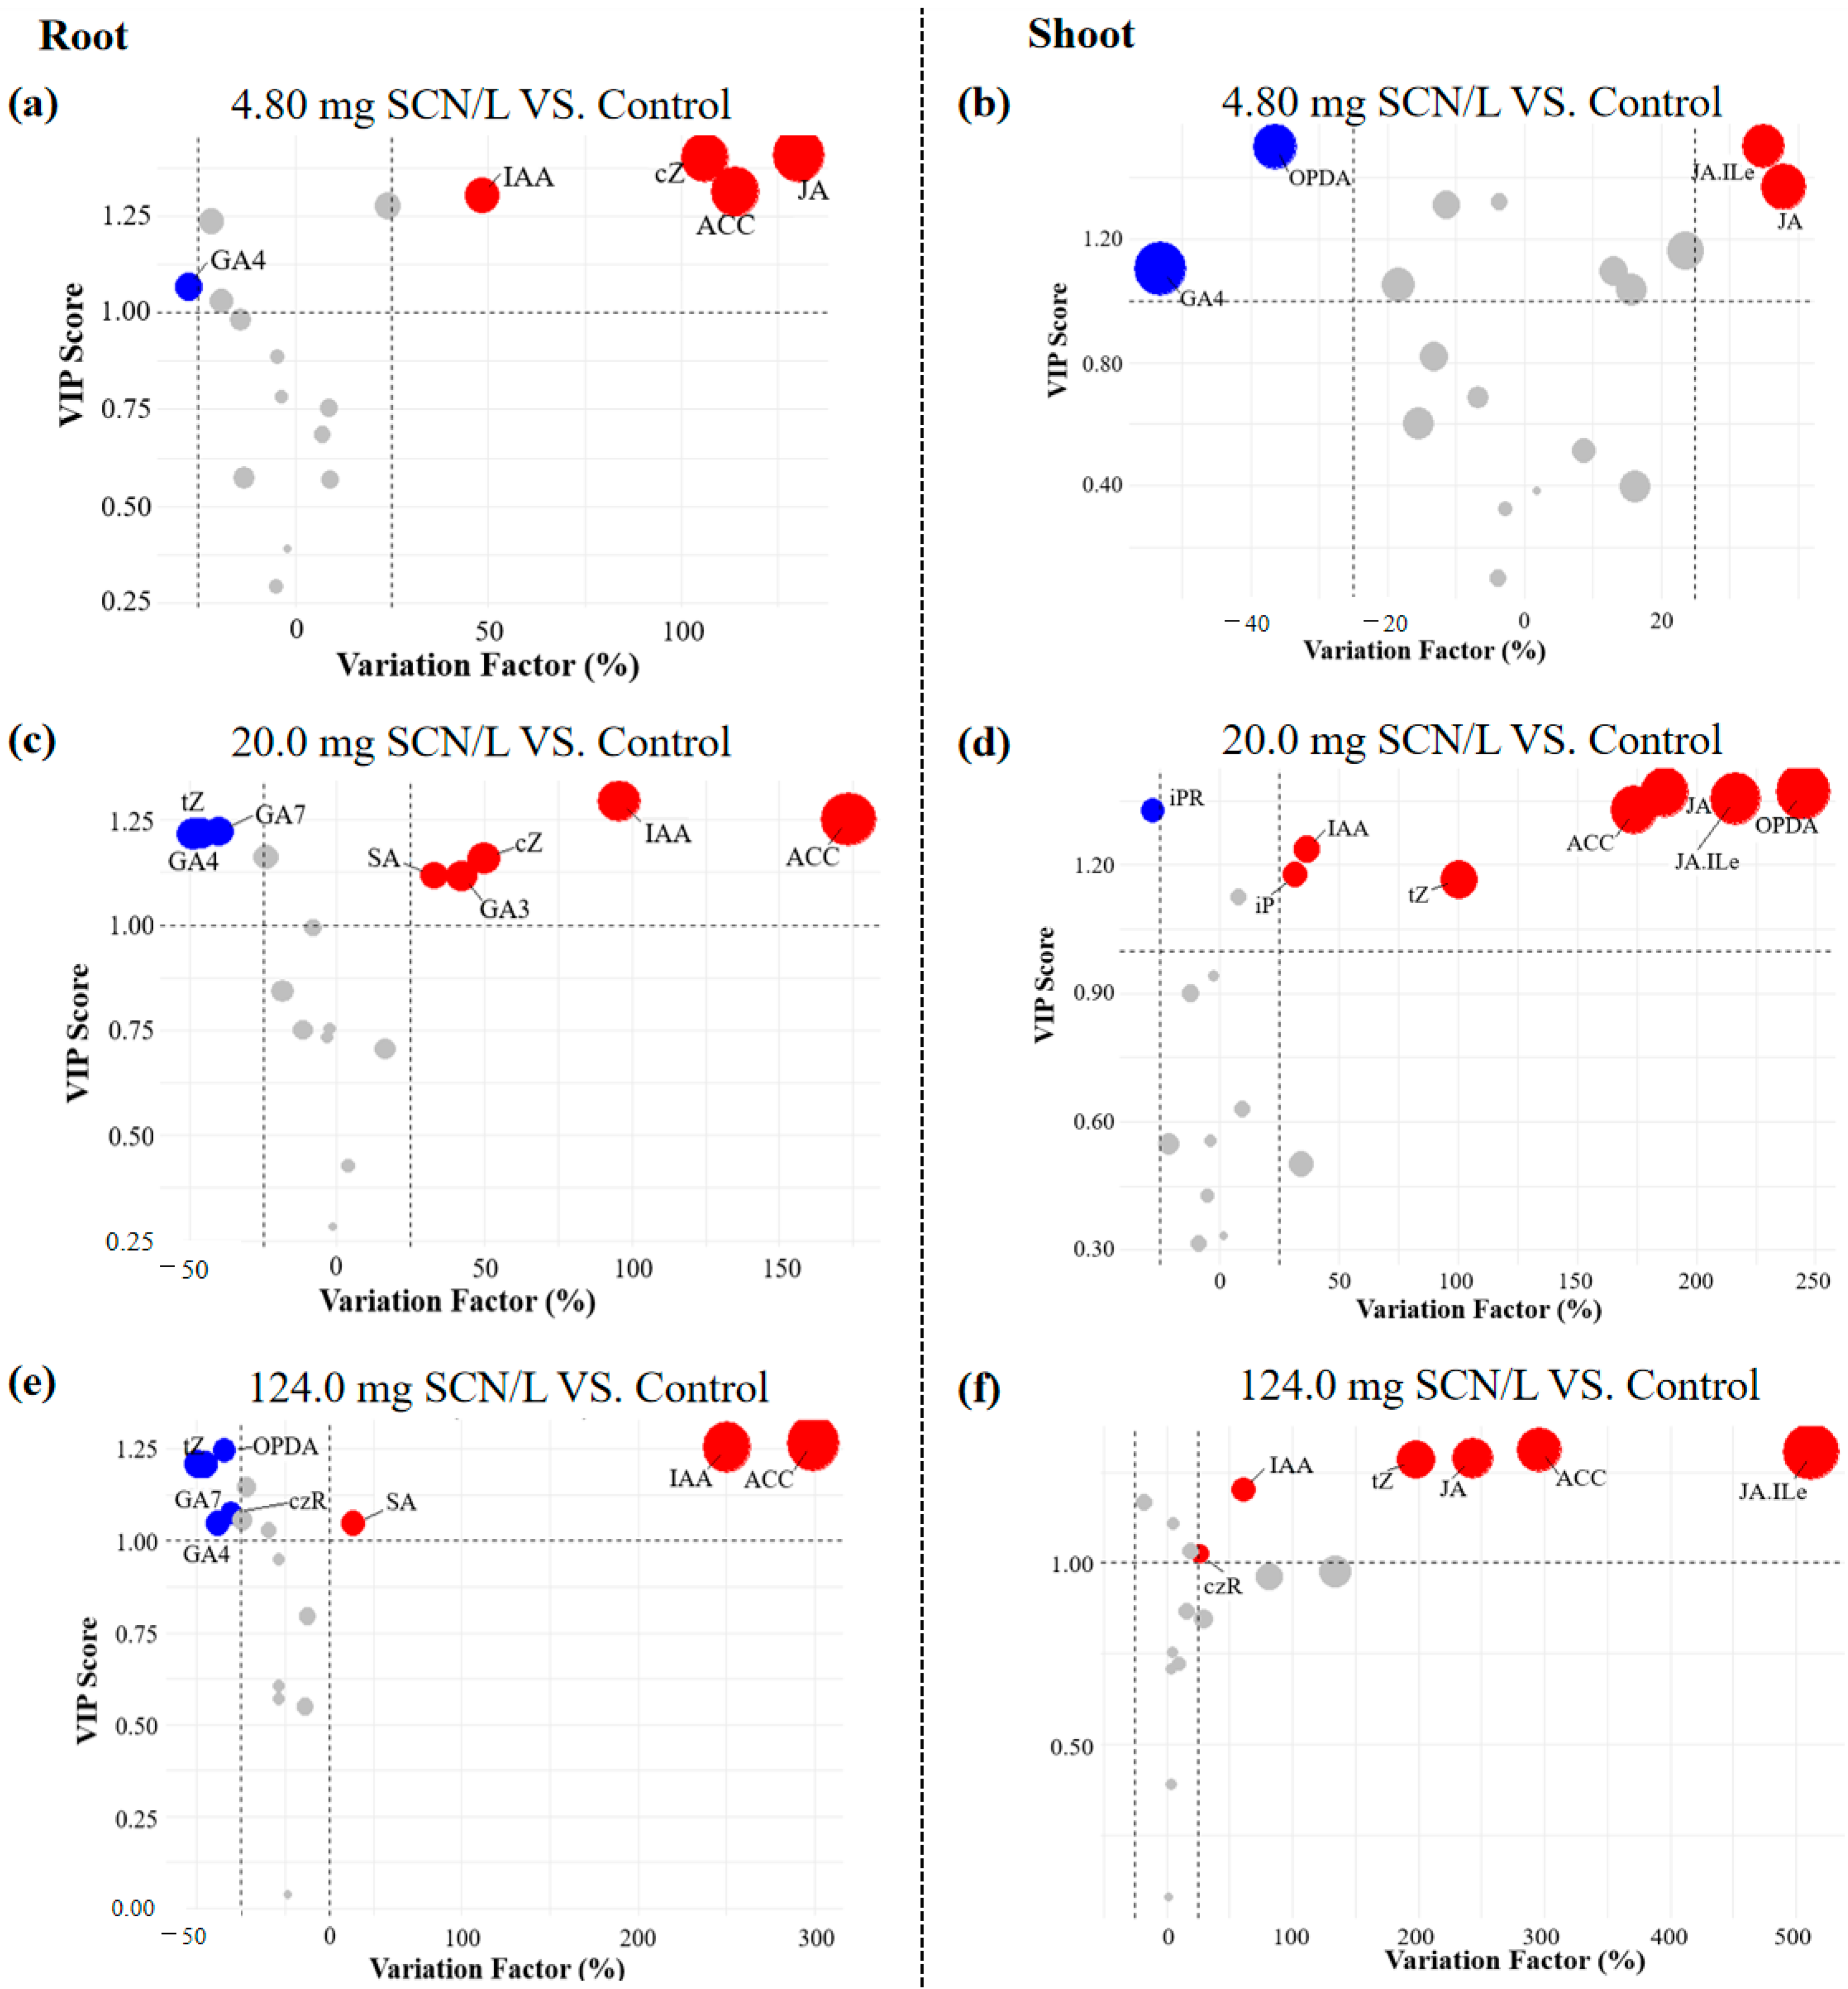
3.3. Selection of Significantly Altered Phytohormones

To identify significantly altered phytohormones and asses their tissue-specific concentrations under SCN exposure, we implemented partial least squares–discriminant analysis (PLS-DA): a supervised multivariate method for classification and dimensionality reduction [39].
As shown in Table 1, three key validation metrics of PLS-DA, i.e., R2x, R2y, and Q2, were higher than 0.5 [40], indicating that the modeling results demonstrated high reliability.
Furthermore, phytohormones with biologically meaningful impacts were identified using the Variable Importance in the Projection (VIP) index, in which the VIP threshold was established at >1 [41]. Shoot tissues exhibited 10, 9, and 9 VIP-significant phytohormones at 4.80, 20.0, and 124.0 mg SCN/L, respectively, compared to 8, 19, and 11 phytohormones in the roots.
To minimize false-positive identifications, we integrated VIP analysis with a variation in the factor (VF), which is calculated as follows:
V F = F C ( S C N ) F C ( C o n t r o l ) F C ( C o n t r o l ) × 100 %
where FC(SCN) and FC(Control) indicate the concentrations of phytohormones from the “SCN” treatment and the control, respectively. The VF threshold was >25% or <−25% (p < 0.05) [42]. This dual-criterion approach revealed distinct response patterns, judged by the VIP(m) values through VIP/VF integration (Figure 4). For instance, in the shoots of SCN-treated rice seedlings at 4.80 mg, SCN/L, OPDA, and GA4 showed significantly negative alterations, and JA and JA-Ile positively responded to SCN exposure, wherein the roots of SCN-treated rice seedlings showed a value of 4.80 mg SCN/L; GA4 showed a significantly negative alteration; and ACC, IAA, JA, and cZ responded positively to SCN exposure.

3.4. Estimation of the Total Weighted Contribution Score of Hormonal Pathways

MapMan pathway analysis revealed differential gene expression patterns across phytohormone pathways in SCN-treated rice plants. Notably, DEGs were categorized by their mechanistic relationships with phytohormone biosynthesis: (1) the direct effect of genes encoding biosynthetic enzymes or pathway regulators, and (2) the indirect effect of genes influencing hormonal pathways through secondary mechanisms, consistent with mediation analysis principles.
Then, the total weighted contribution score of genes (TWCS) for each phytohormone pathway was calculated as follows:
T W C S ( h o r m o n e ) = 1 n × g = 1 n log 2 ( F C g ( n ) ) × W ( 1.0 ) + 1 m × g = 1 m log 2 ( F C g ( m ) ) × W ( 0.5 )
where log2(FC) refers to the expression of DEGs. W(1.0) is the weight for direct-effect DEGs (n), and W(0.5) is the weight for indirect-effect DEGs (m).
Therefore, TWCS values quantifying pathway-specific regulatory impacts across SCN concentrations are summarized in Figure 5.

3.5. Selection of the Sensitive Phytohormones

Phytohormone concentrations in plant tissues are influenced by multifaceted regulatory mechanisms. To systematically evaluate hormonal responsiveness under SCN stress, we integrated VIP(m) and TWCS to derive Total Hormonal Sensitivity Indices (THSI), calculated as follows:
T H S I ( h o r m o n e ) = V I P ( m ) × T W C S h o r m o n e ( n )
THSI values for phytohormones across tissues and SCN concentrations are presented in Figure 6. We noticed that at a concentration of 4.80 mg SCN/L, JA was the most sensitive phytohormone in the roots of rice plants, followed by ACC, wherein both show a positive response to SCN stress. In the shoots of rice plants exposed to SCN at 4.80 mg SCN/L, JA-Ile showed the highest THSI, followed by JA, wherein both showed a positive response. At a concentration of 20.0 mg SCN/L, GA3 and ACC showed the highest THSI values in the roots and shoots of rice plants, respectively, demonstrating a positive response to SCN stress. At a concentration of 124.0 mg SCN/L, SA and JA-Ile had the highest THSI values in the roots and shoots of rice plants, respectively. Additionally, three critical patterns emerged: (1) consistently higher THSI values in shoots versus roots; (2) concentration-dependent sensitivity across all hormones; and (3) the tissue- and concentration-specific hierarchy of responsive phytohormones.

4. Discussions

Phytohormones are low-molecular-weight-signaling molecules that regulate plant growth, development, and stress adaptation [21]. Their crosstalk, particularly synergistic interactions between distinct hormonal pathways, plays a pivotal role in coordinating these processes. For example, ET regulates IAA metabolism, transport, and signaling during development; ET stabilizes the auxin efflux carrier PIN2 in Arabidopsis roots, redistributing auxin to inhibit primary root elongation while promoting lateral root initiation [43,44]. Stepanova et al. [45] further demonstrated that ET treatment (via its precursor ACC) upregulates YUC8 and YUC9 expression in roots, elevating IAA levels in the elongation zone. Notably, ET signaling mutants (ein2, ein3) fail to activate YUC8/9 or accumulate auxin under ET exposure, confirming ET’s essential role in auxin biosynthesis [45]. This interplay extends to stress adaptation. In maize roots, drought-induced auxin accumulation activates ACS6 (ACC synthase 6), increasing ACC/ET levels and inhibiting root elongation, which is a water-conserving feedback mechanism [46]. Conversely, auxin-insensitive Arabidopsis mutants (axr1) exhibit impaired ACS2/6 induction and reduced ET biosynthesis under drought, linking auxin signaling to osmotic stress tolerance [47]. Additionally, ARF7 stabilizes EIN3 by interacting with the EBF1/2 proteins, and auxin signaling via ARF7 suppresses EIN3 degradation, creating a feed-forward loop to amplify ET responses under stress, suggesting that the link between auxin and ethylene pathways enhances stress signal amplification [48]. In our study, ACC (ET precursor) and IAA exhibited a positive synergistic relationship in SCN-stressed rice plants, except in shoots at 4.80 mg SCN/L. This tissue-specific divergence aligns with the conserved yet context-dependent nature of IAA-ET crosstalk observed across species. Also, it can be seen that THSI estimation yielded more positive interactions between the ET, JA, and CK pathways in rice shoots. Therefore, more comprehensive work is needed to further clarify their coordination networks and mitigate SCN toxicity.
Thiocyanate (SCN), a phytotoxic pollutant, disrupts redox homeostasis by impairing antioxidant systems, thereby inducing ROS accumulation [8]. Biochemical and molecular studies further demonstrate its detrimental effects on rice physiology: SCN exposure disrupts carbon–nitrogen metabolic coordination [13] and inhibits anthocyanin transport from cytosol to vacuole in rice plants [49]. The results from Agilent 4X44K rice microarray data demonstrated that the higher concentrations of SCN stress caused more DEGs, and more DEGs were distributed in the shoots than roots, reflecting tissue-specific metabolic responses and systemic stress adaptation mechanisms. Notably, shoots, as primary photosynthetic hubs, show a marked regulation of oxidative defense and energy metabolism genes, which is consistent with their need to balance ROS mitigation with photosynthetic continuity [13,50,51]. The D1 protein serves as the core structural element of the photosystem II (PSII) reaction center in chloroplasts, exhibiting critical vulnerability to oxidative damage from ROS and ligand interactions [52,53,54]. Our data reveal that SCN exposure markedly downregulates OspsbA expression (the gene encoding D1) in rice shoots, indicating the SCN-induced suppression of D1 biosynthesis and consequent impairment of the photosynthetic electron transport chain [12,54]. Compounding these effects, stable isotope analysis revealed root–shoot metabolic divergence under SCN stress. The molar ratio of the 13C to 15N content in roots is 0.66, suggesting efficient cyanate (CNO)/carbonyl sulfide (COS) detoxification via cyanase (CYN) and carbonyl sulfide hydrolase (COSase), while the molar ratios of the 13C to 15N content in shoots is 0.98, implying a limited enzymatic capacity for CNO/COS degradation [9]. This metabolic bottleneck explains the shoot-specific accumulation of toxic intermediates (CNO/COS) and the corresponding transcriptional burden. Collectively, these findings delineate a tissue-partitioned adaptation strategy: shoots prioritize transcriptional plasticity to preserve photosynthesis, while roots rely on metabolic efficiency for direct toxin processing [12,54].
The results from THSI estimation revealed the significant downregulation of GA-related genes and hormones (i.e., GA4 and GA7) under SCN exposure. This inverse correlation between GA pathway activity and stress intensity reflects an adaptive trade-off, suppressing growth metabolism to prioritize stress resilience. Consistent with this pattern, GA concentrations exhibited negative VF values, aligning with the dose-dependent biomass reduction in SCN-treated rice seedlings [11], which is established by GA suppression mechanisms under abiotic stress [55]. The observed GA depletion corresponds to its dual role in development and stress adaptation, where tightly regulated GA levels modulate organ differentiation while maintaining stress responsiveness [56]. Mechanistically, stress-induced ROS activate SnRK2 kinases that phosphorylate DELLA proteins, stabilizing these GA signaling repressors [57]. Furthermore, the transcriptional control of GA biosynthesis genes serves as the primary regulatory node, in which DELLA proteins interface with other stress hormone pathways, enabling cross-pathway signal integration to regulate GA synthesis under stress conditions [58]. In fact, due to the involvement of different phytohormones and signaling molecules in the stress response, crosstalk among pathways is a complicated process that requires deep insights [59]. Our findings demonstrate tissue- and concentration-specific hormonal sensitivity profiles in SCN-treated rice seedlings, reflecting multi-hormonal coordination through synergistic/antagonistic interactions to neutralize SCN toxicity in plants and resource allocation prioritization initiating growth–stress trade-offs mediated through hormonal signaling modulation.

5. Conclusions

This study employed integrated multi-omics analysis and mathematical modeling to identify the phytohormones critical for stress adaptation and regulation in rice under SCN exposure. Tissue-specific metabolomic profiling revealed distinct hormonal responses across SCN concentrations. Mapman pathway enrichment analysis highlighted the activation of the ET pathway, with more DEGs mapped. The VIP/VF integration demonstrated that significantly altered phytohormones in SCN-treated rice plants are tissue- and dose-species. The TWCS estimation revealed pathway-specific regulatory impacts across SCN concentrations. Consistently higher THSI values in shoots versus roots indicated that shoots are major sites for phytohormones functioning in stress resilience, wherein positive regulation roles are chiefly associated with the ET and JA pathways. These findings systematically decode the hormonal networks coordinating stress mitigation in SCN-treated rice plants, revealing strategic resource reallocation via growth–stress tradeoffs and tissue-partitioned signaling strategies for toxin management.

Supplementary Materials

The following supporting information can be downloaded at https://www.mdpi.com/article/10.3390/life15030486/s1. Table S1: Sequences of forward and reverse primers used in PCR analysis. File S1: Total RNA sample QC report. File S2: DEGs mapped in different hormonal pathways in rice tissues under SCN exposure.

Author Contributions

Original draft, investigation, data analysis, and visualization, Y.K.; investigation, data analysis, and visualization, C.L.; conceptualization, funding acquisition, and reviewing: X.Y. All authors contributed to the final review of the manuscript. All authors have read and agreed to the published version of the manuscript.

Funding

This work is financially supported by the National Natural Science Foundation of China (No. 41761094).

Institutional Review Board Statement

Not applicable.

Informed Consent Statement

Not applicable.

Data Availability Statement

The data are available in the Supplementary Materials and the public databases mentioned in this study.

Conflicts of Interest

The authors declare that they have no known competing financial interests or personal relationships that could have appeared to influence the work reported in this paper.

References

  1. Katayama, Y.; Hashimoto, K.; Nakayama, H.; Mino, H.; Nojiri, M.; Ono, T.A.; Nyunoya, H.; Yohda, M.; Takio, K.; Odaka, M. Thiocyanate hydrolyase is a cobalt-containing metalloenzyme with a cysteine-sulfinic acid ligand. J. Am. Chem. Soc. 2006, 128, 728–729. [Google Scholar] [CrossRef] [PubMed]
  2. Jeong, Y.S.; Chung, J.S. Biodegradation of thiocyanate in biofilm reactor using fluidized-carriers. Process Chem. 2006, 41, 701–707. [Google Scholar] [CrossRef]
  3. Dash, R.R.; Gaur, A.; Balomajumder, C. Cyanide in industrial wastewaters and its removal: A review on biotreatment. J. Hazard. Mater. 2009, 163, 1–11. [Google Scholar] [CrossRef] [PubMed]
  4. Combarros, R.G.; Collado, S.; Laca, A.; Díaz, M. Understanding the simultaneous biodegradation of thiocyanate and salicylic acid by Paracoccus thiocyanatus and Pseudomonas putida. Int. J. Environ. Sci. Technol. 2016, 13, 649–662. [Google Scholar] [CrossRef]
  5. Rossinioliva, S.; Abreu, M.M.; Santos, E.S.; Leidi, E.O. Soil-plant system and potential human health risk of Chinese cabbage and oregano growing in soils from Mn- and Fe-abandoned mines: Microcosm assay. Environ. Geochem. Health 2020, 42, 4073–4086. [Google Scholar] [CrossRef]
  6. Gould, W.D.; King, M.; Mohapatra, B.R.; Cameron, R.; Kapoor, A.; Koren, D.W. A critical review on destruction of thiocyanate in mining effluents. Miner. Eng. 2012, 34, 38–47. [Google Scholar] [CrossRef]
  7. Sun, Z.; Xie, X.; Wang, P.; Hu, Y.; Cheng, H. Heavy metal pollution caused by small-scale metal ore mining activities: A case study from a polymetallic mine in South China. Sci. Total. Environ. 2018, 639, 217–227. [Google Scholar] [CrossRef]
  8. Lin, Y.J.; Yu, X.Z.; Li, Y.H.; Yang, L. Inhibition of the mitochondrial respiratory components (Complex I and Complex III) as stimuli to induce oxidative damage in Oryza sativa L. under thiocyanate exposure. Chemosphere 2020, 243, 125472. [Google Scholar] [CrossRef]
  9. Yu, X.Z.; Lin, Y.J.; Shen, P.P.; Zhang, Q.; Gupta, D.K. Molecular evidences on transport of thiocyanate into rice seedlings and assimilation by 13C and 15N labelling and gene expression analyses. Int. Biodeterior. Biodegrad. 2019, 139, 11–17. [Google Scholar] [CrossRef]
  10. Yu, X.Z.; Zhang, F.Z. Effects of exogenous thiocyanate on mineral nutrients, antioxidative responses and free amino acids in rice seedlings. Ecotoxicology 2013, 22, 752–760. [Google Scholar] [CrossRef]
  11. Lin, Y.J.; Yu, X.Z.; Zhang, Q. Transcriptome analysis of Oryza sativa in responses to different concentrations of thiocyanate. Environ. Sci. Pollut. Res. 2019, 26, 11696–11709. [Google Scholar] [CrossRef]
  12. Yang, L.; Feng, Y.X.; Lin, Y.J.; Yu, X.Z. Comparative effects of sodium hydrosulfide and proline on functional repair in rice chloroplast through the D1 protein and thioredoxin system under simulated thiocyanate pollution. Chemosphere 2021, 284, 131389. [Google Scholar] [CrossRef] [PubMed]
  13. Feng, Y.X.; Yang, L.; Lin, Y.J.; Song, Y.; Yu, X.Z. Merging the occurrence possibility into gene co-expression network deciphers the importance of exogenous 2-oxoglutarate in improving the growth of rice seedlings under thiocyanate stress. Front. Plant Sci. 2023, 14, 1086098. [Google Scholar] [CrossRef] [PubMed]
  14. Jiang, T.; Du, K.; Xie, J.; Sun, G.; Wang, P.; Chen, X.; Cao, Z.; Wang, B.; Chao, Q.; Li, X.; et al. Activated malate circulation contributes to the manifestation of light-dependent mosaic symptoms. Cell Rep. 2023, 42, 112333. [Google Scholar] [CrossRef]
  15. Erb, M.; Kliebenstein, D.J. Plant secondary metabolites as defenses, regulators, and primary metabolites: The blurred functional trichotomy. Plant Physiol. 2020, 184, 39–52. [Google Scholar] [CrossRef] [PubMed]
  16. Zulffqar, F.; Akram, N.A.; Ashraf, M. Osmoprotection in plants under abiotic stresses: New insights into a classical phenomenon. Planta 2020, 251, 3. [Google Scholar] [CrossRef]
  17. Kiba, T.; Kudo, T.; Kojima, M.; Sakakibara, H. Hormonal control of nitrogen acquisition: Roles of auxin, abscisic acid, and cytokinin. J. Exp. Bot. 2011, 62, 1399–1409. [Google Scholar] [CrossRef]
  18. Li, Z.; Ahammed, G.J. Hormonal regulation of anthocyanin biosynthesis for improved stress tolerance in plants. Plant Physiol. Biochem. 2023, 201, 107835. [Google Scholar] [CrossRef]
  19. Leng, Y.; Li, Y.; Ma, Y.H.; He, L.F.; Li, S.W. Abscisic acid modulates differential physiological and biochemical responses of roots, stems, and leaves in mung bean seedlings to cadmium stress. Environ. Sci. Pollut. Res. 2021, 28, 6030–6043. [Google Scholar] [CrossRef]
  20. Lymperopoulos, P.; Msanne, J.; Rabara, R. Phytochrome and phytohormones: Working in tandem for plant growth and development. Front. Plant Sci. 2018, 9, 1037. [Google Scholar] [CrossRef]
  21. Rahman, S.U.; Li, Y.; Hussain, S.; Hussain, B.; Khan, W.; Riaz, L.; Ashraf, M.N.; Muhammad Khaliq, A.; Du, Z.; Cheng, H. Role of phytohormones in heavy metal tolerance in plants: A review. Ecol. Indic. 2023, 146, 109844. [Google Scholar] [CrossRef]
  22. Jamla, M.; Khare, T.; Joshi, S.; Patil, S.; Penna, S.; Kumar, V. Omics approaches for understanding heavy metal responses and tolerance in plants. Curr. Plant Biol. 2021, 27, 100213. [Google Scholar] [CrossRef]
  23. Saini, S.; Kaur, N.; Pati, P.K. Phytohormones: Key players in the modulation of heavy metal stress tolerance in plants. Ecotoxicol. Environ. Saf. 2021, 223, 112578. [Google Scholar] [CrossRef] [PubMed]
  24. Ostrowski, M.; Ciarkowska, A.; Jakubowska, A. The auxin conjugate indole-3- acetyl-aspartate affects responses to cadmium and salt stress in Pisum sativum L. J. Plant Physiol. 2016, 191, 63–72. [Google Scholar] [CrossRef] [PubMed]
  25. Wang, Q.; Huang, D.; Niu, D.; Deng, J.; Ma, F.; Liu, C. Overexpression of auxin response gene MdIAA24 enhanced cadmium tolerance in apple (Malus domestica). Ecotoxicol. Environ. Saf. 2021, 225, 112734. [Google Scholar] [CrossRef] [PubMed]
  26. Iftikhar, A.; Ali, S.; Yasmeen, T.; Arif, M.S.; Zubair, M.; Rizwan, M.; Alhaithloul, H.A.S.; Alayaff, A.A.; Soliman, M.H. Effect of gibberellic acid on growth, photosynthesis and antioxidant defense system of wheat under zinc oxide nanoparticle stress. Environ. Pollut. 2019, 254, 113109. [Google Scholar] [CrossRef]
  27. Ahmad, P.; Raja, V.; Ashraf, M.; Wijaya, L.; Bajguz, A.; Alyemeni, M.N. Jasmonic acid (JA) and gibberellic acid (GA3) mitigated Cd-toxicity in chickpea plants through restricted Cd uptake and oxidative stress management. Sci. Rep. 2021, 11, 19768. [Google Scholar] [CrossRef]
  28. Chen, H.; Yang, R.; Zhang, X.; Chen, Y.; Xia, Y.; Xu, X. Foliar application of gibberellin inhibits the cadmium uptake and xylem transport in lettuce (Lactuca sativa L.). Sci. Hortic. 2021, 288, 110410. [Google Scholar] [CrossRef]
  29. Saltveit, M.E. Synthesis and metabolism of phenolic compounds. Fruit Veget. Phytochem. Chem. Human Health 2017, 2, 115. [Google Scholar]
  30. Bali, S.; Kaur, P.; Kohli, S.K.; Ohri, P.; Thukral, A.K.; Bhardwaj, R.; Wijaya, L.; Alyemeni, M.N.; Ahmad, P. Jasmonic acid induced changes in physio-biochemical attributes and ascorbate-glutathione pathway in Lycopersicon esculentum under lead stress at different growth stages. Sci. Total Environ. 2018, 645, 1344–1360. [Google Scholar] [CrossRef]
  31. Emamverdian, A.; Ding, Y.; Mokhberdoran, F. The role of salicylic acid and gibberellin signaling in plant responses to abiotic stress with an emphasis on heavy metals. Plant Signal. Behav. 2020, 15, 1777372. [Google Scholar] [CrossRef] [PubMed]
  32. Betti, C.; Della Rovere, F.; Piacentini, D.; Fattorini, L.; Falasca, G.; Altamura, M.M. Jasmonates, ethylene and brassinosteroids control adventitious and lateral rooting as stress avoidance responses to heavy metals and metalloids. Biomolecules 2021, 11, 77. [Google Scholar] [CrossRef]
  33. Esmaielzadeh, S.; Fallah, H.; Niknejad, Y.; Mahmoudi, M.; Tari, D.B. Methyl jasmonate increases aluminum tolerance in rice by augmenting the antioxidant defense system, maintaining ion homeostasis, and increasing nonprotein thiol compounds. Environ. Sci. Pollut. Res. 2022, 29, 46708–46720. [Google Scholar] [CrossRef]
  34. Alam, P.; Kaur Kohli, S.; Al Balawi, T.; Altalayan, F.H.; Alam, P.; Ashraf, M.; Bhardwaj, R.; Ahmad, P. Foliar application of 24-Epibrassinolide improves growth, ascorbate-glutathione cycle, and glyoxalase system in brown mustard (Brassica juncea (L.) Czern.) under cadmium toxicity. Plants 2020, 9, 1487. [Google Scholar] [CrossRef]
  35. Basit, F.; Chen, M.; Ahmed, T.; Shahid, M.; Noman, M.; Liu, J.; An, J.; Hashem, A.; Fahad Al-Arjani, A.B.; Alqarawi, A.A. Seed priming with brassinosteroids alleviates chromium stress in rice cultivars via improving ROS metabolism and antioxidant defense response at biochemical and molecular levels. Antioxidants 2021, 10, 1089. [Google Scholar] [CrossRef] [PubMed]
  36. Tadaiesky, L.B.; da Silva, B.R.; Batista, B.L.; Lobato, A.K.D.S. Brassinosteroids trigger tolerance to iron toxicity in rice. Physiol. Plant. 2021, 171, 371–387. [Google Scholar] [CrossRef] [PubMed]
  37. Feng, Y.X.; Lin, Y.J.; Tian, P.; Yu, X.Z. Proline interacts with Ca2+-dependent signaling to enhance chromium tolerance in rice by manipulating nitrate reductase and sucrose phosphate synthase. Int. J. Biol. Macromol. 2023, 253, 126655. [Google Scholar] [CrossRef]
  38. Kang, Y.; Lin, Y.J.; Ullah, A.; Zhang, F.F.; Yu, X.Z. Trivalent chromium stress trigger accumulation of secondary metabolites in rice plants: Integration of biochemical and transcriptomic analysis. Environ. Technol. Innov. 2024, 36, 103802. [Google Scholar] [CrossRef]
  39. Mahieu, B.; Qannari, E.M.; Jaillais, B. Extension and significance testing of Variable Importance in Projection (VIP) indices in Partial Least Squares Regression and Principal Components Analysis. Chemometr. Intell. Lab. Syst. 2023, 242, 104986. [Google Scholar] [CrossRef]
  40. Xiao, H.; Yang, X.; Huang, X.; Luo, H.; Liu, Y.; Li, J.; Dang, X.; Wang, S. Quality evaluation of Schisandra propinqua var. Sinensis based on HPLC fingerprint and multi-component content determination. Northwest Pharm. J. 2022, 37, 1–7. (In Chinese) [Google Scholar]
  41. Chong, L.G.; Jun, C.H. Performance of some variable selection methods when multicollinearity is present. Chemometr. Intell. Lab. Syst. 2005, 78, 103–112. [Google Scholar] [CrossRef]
  42. Li, C.Z.; Ullah, A.; Kang, Y.; Yu, X.Z. Amino acid metabolic shifts in rice: Responses to elevated CO2, cyanide, and nitrogen sources. Chem. Biol. Technol. Agric. 2024, 11, 170. [Google Scholar] [CrossRef]
  43. Li, J.; Tao, X.; Bu, J.; Ying, T.; Mao, L.; Luo, Z. Global transcriptome profiling analysis of ethylene-auxin interaction during tomato fruit ripening. Postharvest Biol. Technol. 2017, 130, 28–38. [Google Scholar] [CrossRef]
  44. Růžička, K.; Ljung, K.; Vanneste, S.; Podhorská, R.; Beeckman, T.; Friml, J.; Benková, E. Ethylene regulates root growth through effects on auxin biosynthesis and transport-dependent auxin distribution. Plant Cell 2007, 19, 2197–2212. [Google Scholar] [CrossRef] [PubMed]
  45. Stepanova, A.N.; Yun, J.; Likhacheva, A.V.; Alonso, J.M. Multilevel interactions between ethylene and auxin in Arabidopsis roots. Cell 2007, 19, 2169–2185. [Google Scholar]
  46. Wang, Y.; Wang, N.; Xu, H.; Jiang, S.; Fang, H.; Su, M.; Zhang, Z.; Zhang, T.; Chen, X. Auxin regulates anthocyanin biosynthesis through the Aux/IAA–ARF signaling pathway in apple. Hortic. Res. 2018, 5, 59. [Google Scholar] [CrossRef]
  47. Rowe, J.H.; Topping, J.F.; Liu, J.; Lindsey, K. Abscisic acid regulates root growth under osmotic stress conditions via an interacting hormonal network with cytokinin, ethylene, and auxin. New Phytol. 2016, 211, 225–239. [Google Scholar] [CrossRef]
  48. Li, W.; Ma, M.; Feng, Y.; Li, H.; Wang, Y.; Ma, Y.; Li, M.; An, F.; Guo, H. EIN2-directed translational regulation of ethylene signaling in Arabidopsis. Plant Cell 2015, 163, 670–683. [Google Scholar] [CrossRef]
  49. Ling, Q.L.; Feng, Y.X.; Lu, C.J.; Lin, Y.J.; Yu, X.Z. Genetic variation and gene expression of anthocyanin synthesis and transport related enzymes in Oryza sativa against thiocyanate. Plant Physiol. Biochem. 2021, 160, 18–26. [Google Scholar] [CrossRef]
  50. Zhu, J.K. Abiotic stress signaling and responses in plants. Cell 2016, 167, 313–324. [Google Scholar] [CrossRef]
  51. Zhao, Y.; Yu, H.; Zhou, J.; Smith, S.M.; Li, J. Malate circulation: Linking Chloroplast metabolism to mitochondrial ROS. Trends Plant Sci. 2020, 25, 446–454. [Google Scholar] [CrossRef] [PubMed]
  52. Aro, E.; Suorsa, M.; Rokka, A.; Allahverdiyeva, Y.; Paakkarinen, V.; Saleem, A.; Rintamaki, E. Dynamics of photosystem II: A proteomic approach to thylakoid protein complexes. J. Exp. Bot. 2024, 56, 347–356. [Google Scholar] [CrossRef] [PubMed]
  53. Alencar, V.T.C.B.; Lobo, A.K.M.; Carvalho, F.E.L.; Silveira, J.A.G. High ammonium supply impairs photosynthetic efffciency in rice exposed to excess light. Photosynth. Res. 2019, 140, 321–335. [Google Scholar] [CrossRef] [PubMed]
  54. Lin, Y.J.; Feng, Y.X.; Li, Y.H.; Yu, G.; Yu, X.Z. Fuzzy synthetic evaluation of the impact of plant growth regulators on the root phenotype traits of rice seedlings under thiocyanate stress. Plant Physiol. Biochem. 2021, 158, 182–189. [Google Scholar] [CrossRef]
  55. Hedden, P.; Thomas, S.G. Gibberellin biosynthesis and its regulation. Biochem. J. 2012, 444, 11–25. [Google Scholar] [CrossRef]
  56. Hedden, P. The current status of research on gibberellin biosynthesis. Plant Cell Physiol. 2020, 61, 1832–1849. [Google Scholar] [CrossRef]
  57. Achard, P.; Gong, F.; Cheminant, S.; Alioua, M.; Hedden, P.; Genschik, P. The cold-inducible CBF1 factor–dependent signaling pathway modulates the accumulation of the growth-repressing DELLA proteins via its effect on gibberellin metabolism. Plant Cell 2008, 20, 2117–2129. [Google Scholar] [CrossRef]
  58. Colebrook, E.H.; Thomas, S.G.; Phillips, A.L.; Hedden, P. The role of gibberellin signaling in plant responses to abiotic stress. J. Exp. Biol. 2014, 217, 67–75. [Google Scholar] [CrossRef]
  59. Sharma, L.; Priya, M.; Kaushal, N.; Bhandhari, K.; Chaudhary, S.; Dhankher, O.P.; Prasad, P.V.V.; Siddique, K.H.M.; Nayyar, H. Plant growth-regulating molecules as thermoprotectants: Functional relevance and prospects for improving heat tolerance in food crops. J. Exp. Bot. 2020, 71, 569–594. [Google Scholar] [CrossRef]
Figure 1. Concentrations (ng/g FW) of different phytohormones in the roots (a) and shoots (b) of rice seedlings under SCN exposure. The control is 0.0 mg Cr/L. Values are the mean of three independent biological replicates ± standard deviation. The asterisk (*) refers to the significant difference between the treatments and the control.
Life 15 00486 g001
Figure 2. The up- and down-regulated DEGs detected in the roots (a) and shoots (b) of SCN-treated rice seedlings. The number of up- and down-regulated DEGs mapped in the different hormonal pathways in the roots (c,e) and shoots (d,f) of rice seedlings at different SCN concentrations.
Life 15 00486 g002
Figure 3. Correlation analysis of microarray data and PCR results in roots of rice seedlings at different SCN treatments.
Life 15 00486 g003
Figure 4. The VIP/VF integration of significantly altered phytohormones in roots ((a): 4.80 mg/L vs. control; (c): 20.0 mg/L vs. control; (e): 124.0 mg/L vs. control) and shoots ((b): 4.80 mg/L vs. control; (d): 20.0 mg/L vs. control; (f): 124.0 mg/L vs. control) of SCN-treated rice seedlings. Red dots indicate the significantly positive alteration of phytohormones in responses to SCN exposure, while blue dots refer to a significantly negative alteration. Gray dots refer to no significant change.
Life 15 00486 g004
Figure 5. TWCS values quantifying pathway-specific regulatory impacts across rice tissues and different SCN concentrations.
Life 15 00486 g005
Figure 6. THSI values for phytohormones across rice tissues and different SCN concentrations.
Life 15 00486 g006
Table 1. Key variables yielded from the PLS-DA analysis.
Comparison GroupsVariables in ShootsVariables in Roots
R2xR2yQ2R2xR2yQ2
SCN (4.80 mg/L) vs. Control0.6360.9990.8380.7410.9840.909
SCN (20.0 mg/L) vs. Control0.6350.9950.8740.7610.9970.921
SCN (124.0 mg/L) vs. Control0.6840.9980.9500.7490.9990.963
Disclaimer/Publisher’s Note: The statements, opinions and data contained in all publications are solely those of the individual author(s) and contributor(s) and not of MDPI and/or the editor(s). MDPI and/or the editor(s) disclaim responsibility for any injury to people or property resulting from any ideas, methods, instructions or products referred to in the content.

