Abstract
Mitochondria play a central role in cell biological processes, functioning not only as producers of ATP but also as regulators of Ca2+ signaling. Mitochondrial calcium uptake occurs primarily through the mitochondrial calcium uniporter channel (mtCU), with the mitochondrial calcium uptake subunits 1, 2, and 3 (MICU1, MICU2, and MICU3) serving as the main regulatory components. Dysregulated mitochondrial calcium uptake is a hallmark of cellular degeneration. Sirtuin 1 (SIRT1), a key regulator of cellular metabolism, plays a critical role in aging and various neurodegenerative conditions. By blocking SIRT1 using EX527 or shSIRT1, we observed mitochondrial structural fragmentation as well as intensified and prolonged mitochondrial calcium overload. Our study revealed a direct interaction between SIRT1 and MICU1. Notably, SIRT1 inhibition resulted in reduced MICU1 expression, hence led to mitochondrial calcium overload, illustrating the unconventional role of SIRT1 in governing mitochondrial function.
1. Introduction
Mitochondria serve as the primary energy source within cells, responsible for powering cellular activities. In addition to their energy-generating function, mitochondria also act as a major cytosolic calcium buffering system, playing a critical role in regulating cellular metabolism. However, mitochondrial calcium overload resulting from the imbalance of calcium uptake and efflux leads to enhanced oxidative stress and the generation of reactive oxygen species (ROS), ultimately triggering the activation of apoptotic factors and promoting cell apoptosis [1,2].
The transport of calcium into mitochondria primarily occurs through the mitochondrial calcium uniporter channel (mtCU), comprised of the mitochondrial calcium uniporter (MCU), an inner-membrane protein responsible for channel formation, and the essential MCU regulator (EMRE). The activity of this channel is tightly controlled by the mitochondrial calcium uptake proteins 1, 2, and 3 (MICU1/2/3) [3,4,5]. In particular, MICU1 and MICU2 typically form a heterodimer and jointly regulate MCU activity. Cells maintain calcium uptake from the endoplasmic reticulum to mitochondria by modulating the MCU–MICU1 interaction to ensure a dynamic balance between calcium supply and utilization [6]. Disruption of the MICU1–MICU2 dimer structure or the deletion of MICU1 leads to an increase in mitochondrial calcium concentration, resulting in elevated ROS levels and heightened cellular susceptibility to death [7]. Dysregulation of mitochondrial calcium dynamics has been implicated in various neurodegenerative disorders, including Alzheimer’s disease (AD) and Parkinson’s disease (PD) [8,9,10,11].
Sirtuin1 (SIRT1), a nicotinamide adenine dinucleotide (NAD+)-dependent protein deacetylase, plays essential roles in cellular stress responses, metabolism, and aging. By regulating the acetylation of downstream genes, SIRT1 is involved in inflammatory responses and programmed cell death, thereby influencing the longevity of organisms [12]. In the central nervous system, SIRT1 promotes axon extension, dendritic growth, and synaptic plasticity, thereby influencing memory formation [13,14,15]. Studies have shown that activation of SIRT1 can ameliorate symptoms of neurodegenerative diseases such as AD and PD, and enhance the brain’s resilience to cerebral ischemia-reperfusion injury [16,17,18]. Currently, the regulatory effects of SIRT1 on mitochondria primarily involve the activation of PGC1α-mediated mitochondrial biogenesis, oxidative phosphorylation, and the modulation of nuclear and mitochondrial genes associated with energy production [19,20]. However, while it has been reported that SIRT1 regulates the expression of calcium regulatory genes and its deficiency can lead to disturbances in calcium flux, a thorough understanding of the direct regulatory effects of SIRT1 on mitochondrial function requires additional investigation [21,22,23].
In this study, we investigated the influence of SIRT1 on mitochondrial morphology and calcium uptake functionality in HeLa cells, as well as its downstream regulatory effects on the protein MICU1. Moreover, we sought to validate whether SIRT1 engages in the modulation of mitochondrial calcium uptake through MICU1. EX-527, which inhibits SIRT1 enzymatic activity by occupying the nicotinamide-binding site, was utilized as a pharmacological inhibitor of SIRT1 [24,25].
2. Materials and Methods
Studies were conducted in strict accordance with the recommendations outlined in the Guide for the Care and Use of Laboratory Animals of the National Institutes of Health. The protocol was approved by the Committee on the Ethics of Animal Experiments of Southern Medical University (Permit Number: 2016138).
2.1. Animals and Cells
SD rats at 17–18 days of gestation were purchased from the Laboratory Animal Center of Southern Medical University. HeLa cells were obtained from the US ATCC cell bank.
2.2. Cell Culture
HeLa cells stored in liquid nitrogen were thawed at 37 °C in a water bath, then transferred aseptically to a 15 mL centrifuge tube within a sterile laminar flow hood. Cells were gently resuspended in 5 mL (DMEM high-glucose base medium + 10% FBS) to recover the osmotic pressure before centrifugation at 900 rpm for 6 min. Following centrifugation, the supernatant was discarded, and 2 mL of the cell pellet was resuspended in medium. The cell suspension (1.0 mL) was added to a 60 mm culture dish, then cells were cultured at 37 °C in a 5% CO2 incubator. The culture medium was changed regularly based on cell growth rates, with cells being passaged when reaching 90% confluency using a 0.25% trypsin–0.02% EDTA working solution. To restrain the expression of SIRT1, EX527 (Sigma, St. Louis, MO, USA), an inhibitor of SIRT1, was dissolved in dimethyl-sulfoxide (DMSO, Sigma, St. Louis, MO, USA) and added to the cell culture to achieve a final concentration of 10 μM [26]. The control group received the same amount of DMSO.
Surgical instruments were sterilized in 75% alcohol, flame sterilized, and exposed to ultraviolet light. Pregnant SD rats at 17–18 days of gestation underwent aseptic surgery under anesthesia euthanasia with 10% pentobarbital sodium. Fetal mice were decapitated, and brain tissues were harvested. After removing blood vessels and meninges, the cerebral cortex was dissected, cut into 1 mm3 fragments, and digested with 0.25% trypsin at 37 °C. Following digestion, a single-cell suspension was prepared for culturing cortical neurons in a 5% CO2 incubator at 37 °C. Neurons were identified and utilized for experiments after 7 days of culture.
2.3. Mitochondrial Extraction
Mitochondrial extraction was performed using the KEYGEN Biologics mitochondrial extraction kit (KGA3106, Nanjing, China). Briefly, HeLa cells were lysed using Buffer and subjected to centrifugation to obtain the mitochondrial fraction. The obtained mitochondria were washed and stored at −80 °C for subsequent experiments.
2.4. Western Blot Analysis
HeLa cells were digested and lysed, and total cell proteins were extracted and quantified using a BCA protein quantification kit (Thermo Fisher Scientific, Eugene, OR, USA). The samples were loaded onto SDS-PAGE gels for electrophoresis, followed by transfer to PVDF membranes. Membranes were blocked and then probed with diluted primary antibodies. After overnight incubation at 4 °C, membranes were washed and incubated with secondary antibodies. The protein bands were visualized using chemiluminescent reagents. Anti-SIRT1 (1:1000, H-300: sc-15404, Santa Cruz Biotechnology, Santa Cruz, CA, USA), anti-LaminB (1:1000, BA1228, Boster, Wuhan, China), anti-α-tubulin (1:5000, T9026, Sigma, USA) and anti-COXIV (1:1000, 11242-1-AP, ProteinTech, Manchester, UK) were use to detect the expression of SIRT1 in mitochondria of HeLa cells. To detect the protein levels of MCU and MICU1 proteins in HeLa cells, anti-MCU (1:1000, 26312-1-AP, ProteinTech, Manchester, UK) and anti-MICU1 (1:1000, #12524, Cell Signaling, Danvers, MA, USA) were used.
2.5. Cell Immunofluorescence
After washing once in 1× Phosphate Buffered Saline (PBS), the experimental cells were fixed using a 4% paraformaldehyde solution (in 1× PBS) at room temperature for 15 min. Subsequently, the cells were permeabilized, blocked with a 0.3% Triton X-100 and 5% Bovine Serum Albumin (BSA) blocking solution (in 1× PBS) at room temperature for 30 min, and incubated with primary antibodies overnight. To detect SIRT1 in cells, anti-SIRT1 (1:200, 13161-1-AP, Proteintech, Wuhan, China) was employed. Following overnight incubation, the cells were washed in 1× PBS three times at room temperature and stained with secondary antibodies (1:200) at room temperature for 1 h. After washing, the cells were examined under a confocal fluorescence microscope. Cell experiments pre-treated with MitoTracker (100 nM for 20 min, Thermo Fisher Scientific, Eugene, OR, USA), a red fluorescent dye specifically targeting mitochondria, required complete darkness throughout the entire process. Images were taken using a Nikon Ti microscope with a 60 × 1.4 NA oil immersion objective, at Zoom 1, using a Nikon A1plus camera and controlled by NIS-Elements 5.3. Signals were captured sequentially into one or two channel modes. Manders’ colocalization coefficients (MCCs) were employed to quantify the degree of colocalization between SIRT1 and mitochondria, as well as between SIRT1 and MICU1. Background correction was performed using selected regions of interest (ROIs). An MCC value greater than 0.6 indicated significant colocalization [27]. To assess mitochondrial fragmentation, we utilized the Mitochondrial Network Analysis (MiNA) toolset in ImageJ 2.0.0 (National Institutes of Health, Stapleton, NY, USA), measuring the area occupied by mitochondrial structures (mitochondrial footprint) and the mean length of branches (mean branch length) [28].
2.6. RNA Interference
shNC, shSIRT1, and shSIRT2 were purchased from Gima Biology (Suzhou, China).
shSIRT1: 5′-GAAGTGCCTCAGATATTAA-3′,
shSIRT2: 5′-GACTCCAAGAAGGCCTACA-3′.
The interfering plasmid vector contained a GFP fluorescent reporter gene to evaluate transfection efficiency. When the cell density reached 70–80%, HeLa cells were transfected with shNC, shSIRT1, or shSIRT2 using Lipofectamine 2000 (Thermo Fisher Scientific, Eugene, OR, USA) in serum-free medium according to the manufacturer’s instructions.
2.7. Bacterial Plasmid Transformation
A total of 50 ng each of pCMV-HA, MICU1-HA, PCDNA3-CFP, and SIRT1-CFP was added into 50 μL of prepared Top10 competent cells and placed on ice for 30 min, then transferred to a metal bath at 42 °C for 90 s, and rapidly returned to ice for 2 min. Subsequently, 200 μL of antibiotic-free LB liquid medium was added to the bacterial solution and incubated at 37 °C with shaking for 1 h. The cultures were evenly spread on solid LB agar plates containing ampicillin and incubated at 37 °C for 12 to 16 h until single colonies were large enough to be selected for expansion culture. Plasmids were extracted using the Kangwei Century Endotoxin-Free Extraction Kit (Taizhou, China) following sequencing.
2.8. Cell Transfection
HeLa cells were transfected with liposomes followed by Lipofectamine 2000 manual. Before transfection, the culture medium was substituted with the DMEM high-glucose base medium without FBS or antibiotics. The plasmids and Lipofectamine 2000 (Thermo Fisher Scientific, Eugene, OR, USA) for transfection were diluted in Opti-MEM medium respectively and were mixed at a ratio of 1:1. After 5 min incubation at room temperature, the DNA–lipid complex was added into cells and incubated at room temperature for an additional 6 h. After this time, DMEM was replaced with complete medium for further culture. Cellular status was assessed 24 h post-transfection.
2.9. Glutathione S-Transferase (GST) Pull-Down Assay
The GST-SIRT1 and GST control proteins were induced and purified in Escherichia coli, then absorbed on the corresponding agarose beads. A single bacterial colony containing either the pGEX-4T-3 or pGEX-4T-3-SIRT1 plasmid was amplified overnight. On the second day, each bacterial solution was diluted into 50 mL of sterile LB liquid medium at a ratio of 1:100, and ampicillin was added to a final concentration of 50 μg/mL. Incubation continued at 37 °C for 4 h, and isopropyl-β-D-thiogalactopyranoside (IPTG) with a final concentration of 0.5 mM was added to the medium to induce the expression of GST-SIRT1 or GST control proteins. Then, 6–8 h later, the bacterial cultures were lysed ultrasonically on ice in PBS containing protease inhibitors. The resulting supernatants contained either GST-SIRT1 or GST control proteins. Glutathione Sepharose 4B (GE Healthcare, Camarillo, CA, USA) was added to the above solution, and the agarose microbeads combining with GST-SIRT1 or GST control proteins were obtained after mixing at room temperature. HeLa cells were transfected with MICU1-HA plasmid, and the cells were collected 24 h after transfection. After ultrasonic lysis, the cell lysates were mixed with the agarose beads. Bound proteins were analyzed via immunoblotting. Anti-HA (1:1000, 05-902R, Sigma, St. Louis, MO, USA) and anti-GST (1:1000, SAB2702378, Sigma, St. Louis, MO, USA) were used.
2.10. Co-Immunoprecipitation (Co-IP)
Protein A agarose beads (sc-2001, Santa Cruz Biotechnology, Santa Cruz, CA, USA) were added into the lysed cells and rotated at 4 °C for 1 h to bind non-specific proteins. In total, 2 μg of Flag or SIRT1 antibody was added to the cell lysate supernatant and rotated at 4 °C overnight. Protein A agarose beads were added to samples and rotated at 4 °C for 1 h. After boiling, the samples were detected by Western blot. Anti-Flag (1:1000, F1804, Sigma, St. Louis, MO, USA), anti-HA (1:1000, SAB4300603, Sigma, St. Louis, MO, USA), and anti-SIRT1 (1:1000, H-300: sc-15404, Santa Cruz Biotechnology, Santa Cruz, CA, USA) were used.
2.11. Mitochondrial Calcium Signal Detection
HeLa cells were incubated with 1 µM of rhodamine-2-acetoxymethyl ester (Rhod-2 AM; Thermo Fisher Scientific, Eugene, OR, USA) or transfected with mitochondrial calcium-targeting fluorescence plasmid CMV-mito-R-GECO1 to assess mitochondrial calcium levels. Changes in fluorescence signals were monitored using confocal microscopy after treatment with mitochondrial calcium influx inducers. Fluorescence observations were recorded and analyzed for calcium signal dynamics. Images were acquired as single frames every 4 s for a total duration of 300 s using a Nikon Ti microscope equipped with a 40 × 1.4 NA oil immersion objective at 1× zoom. The Nikon A1 Plus camera was used, controlled by NIS-Elements 5.3 (Nikon, Tokyo, Japan). Signals were captured sequentially in a single-channel mode. To induce calcium release from the endoplasmic reticulum into the cytoplasm, 100 μM histamine (Sigma, St. Louis, MO, USA) was applied at the 60 s time point.
2.12. Quantification and Statistical Analysis
All experiments were performed in 3 independent replicates, and all values were presented as mean ± standard deviation (SD). GraphPad Prism 9.0 software (San Diego, CA, USA) was used. The two groups were compared with Student’s t-test. The relative protein level in the Western blot were compared with the Mann–Whitney U Test. Data sets that involved more than two groups were assessed by one-way ANOVA, followed by least-significant difference (LSD) post hoc tests. Comparisons among four groups based on two variables were performed with two-way ANOVA, followed by Tukey’s multiple comparison post-tests for post hoc analysis. All statistical tests were two-sided, and p < 0.05 was considered statistically significant. Significance levels * p < 0.05; ** p < 0.01; *** p < 0.001; **** p < 0.0001.
3. Results
3.1. Long-Term Inhibition of SIRT1 Alters Mitochondrial Morphology in HeLa Cells
The expression of SIRT1 in mitochondria was initially examined. Western blot analysis confirmed the presence of SIRT1 in isolated mitochondria derived from HeLa cells (Figure 1a; full blots are shown in Supplementary Figure S1a). To evaluate colocalization between SIRT1 and mitochondria, anti-SIRT1 antibodies and MitoTracker were employed to visualize respective expression in HeLa cells, and Manders’ colocalization coefficients (MCCs) were used to quantify the colocalization. We observed a substantial proportion of MitoTracker signals demonstrating colocalization with SIRT1 immunosignals (MCC = 0.68 ± 0.1226, n = 36; Figure 1b,c, red bar). A smaller fraction of SIRT1 signals colocalized with MitoTracker signals (MCC = 0.57 ± 0.0959, n = 36; Figure 1b,c, black bar), likely attributable to the broader spatial distribution of SIRT1 within cellular environments (additional images are provided in Supplementary Figure S1b). Primary cultured SD fetal rat cortical neurons exhibited mitochondrial-SIRT1 colocalization patterns (SIRT1 to MitoTracker: MCC = 0.64 ± 0.1344, n = 28; Figure 1d,e, black bar. MitoTracker to SIRT1: MCC = 0.62 ± 0.1258, n = 28; Figure 1d,e, red bar. Additional images are provided in Supplementary Figure S1c). Furthermore, the inhibition of SIRT1 in HeLa cells using the specific inhibitor EX527 for 1 h led to pronounced mitochondrial fragmentation, with a decreased mitochondrial footprint and diminished mean branch length (Figure 1f–h; additional images are provided in Supplementary Figure S1d). These findings emphasize the localization of SIRT1 within mitochondria and its crucial role in maintaining mitochondrial morphology.
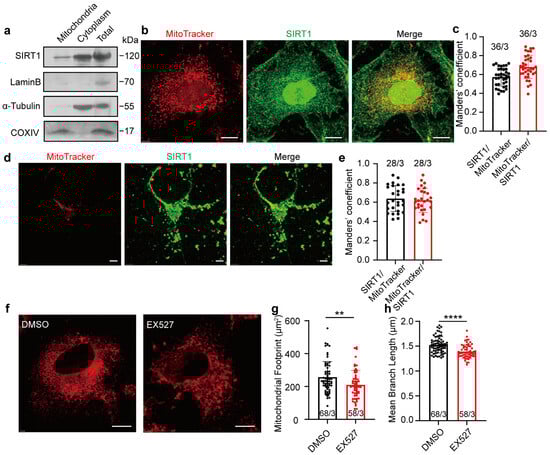
Figure 1.
Expression of SIRT1 in mitochondria of HeLa cells and rat cortical neurons. (a) Western blot analysis of SIRT1 expression in mitochondria, cytoplasm, and whole-cell lysates of HeLa cells. (b) Confocal microscopy determining the SIRT1 colocalization with mitochondria in HeLa cells. Red, MitoTracker; Green, SIRT1. Magnification is 60×. Scale bars, 5 μm. (c) The levels of colocalization between SIRT1 and mitochondria expressed as MCC for a fraction of SIRT1 pixels that are shared with mitochondria (black bar) or vice versa (red bar) in HeLa cells. (d) Confocal microscopy determining the SIRT1 colocalization with mitochondria in SD rat cortical neurons. Red, MitoTracker; Green, SIRT1; Blue, Dapi. Magnification is 60×. Scale bars, 5 μm. (e) The levels of colocalization between SIRT1 and mitochondria expressed as MCC for a fraction of SIRT1 pixels that are shared with mitochondria (black bar) or vice versa (red bar) in SD rat cortical neurons. (f) Representative images of confocal microscopy determining 10 μM of EX527 to mitochondrial morphology in HeLa cells. Red, MitoTracker. Magnification is 60×. Scale bars, 5 μm. (g,h) The footprint of mitochondria and mean branch length of HeLa cells treated with DMSO or EX527 for 1 h. Data presented as mean ± standard deviation (SD). ** p < 0.01, **** p < 0.0001. The number of cells analyzed/the number of independent experiments is indicated in the bars.
3.2. SIRT1 Inhibitor EX527 Enhanced Histamine-Induced Mitochondrial Calcium Overload in HeLa Cells
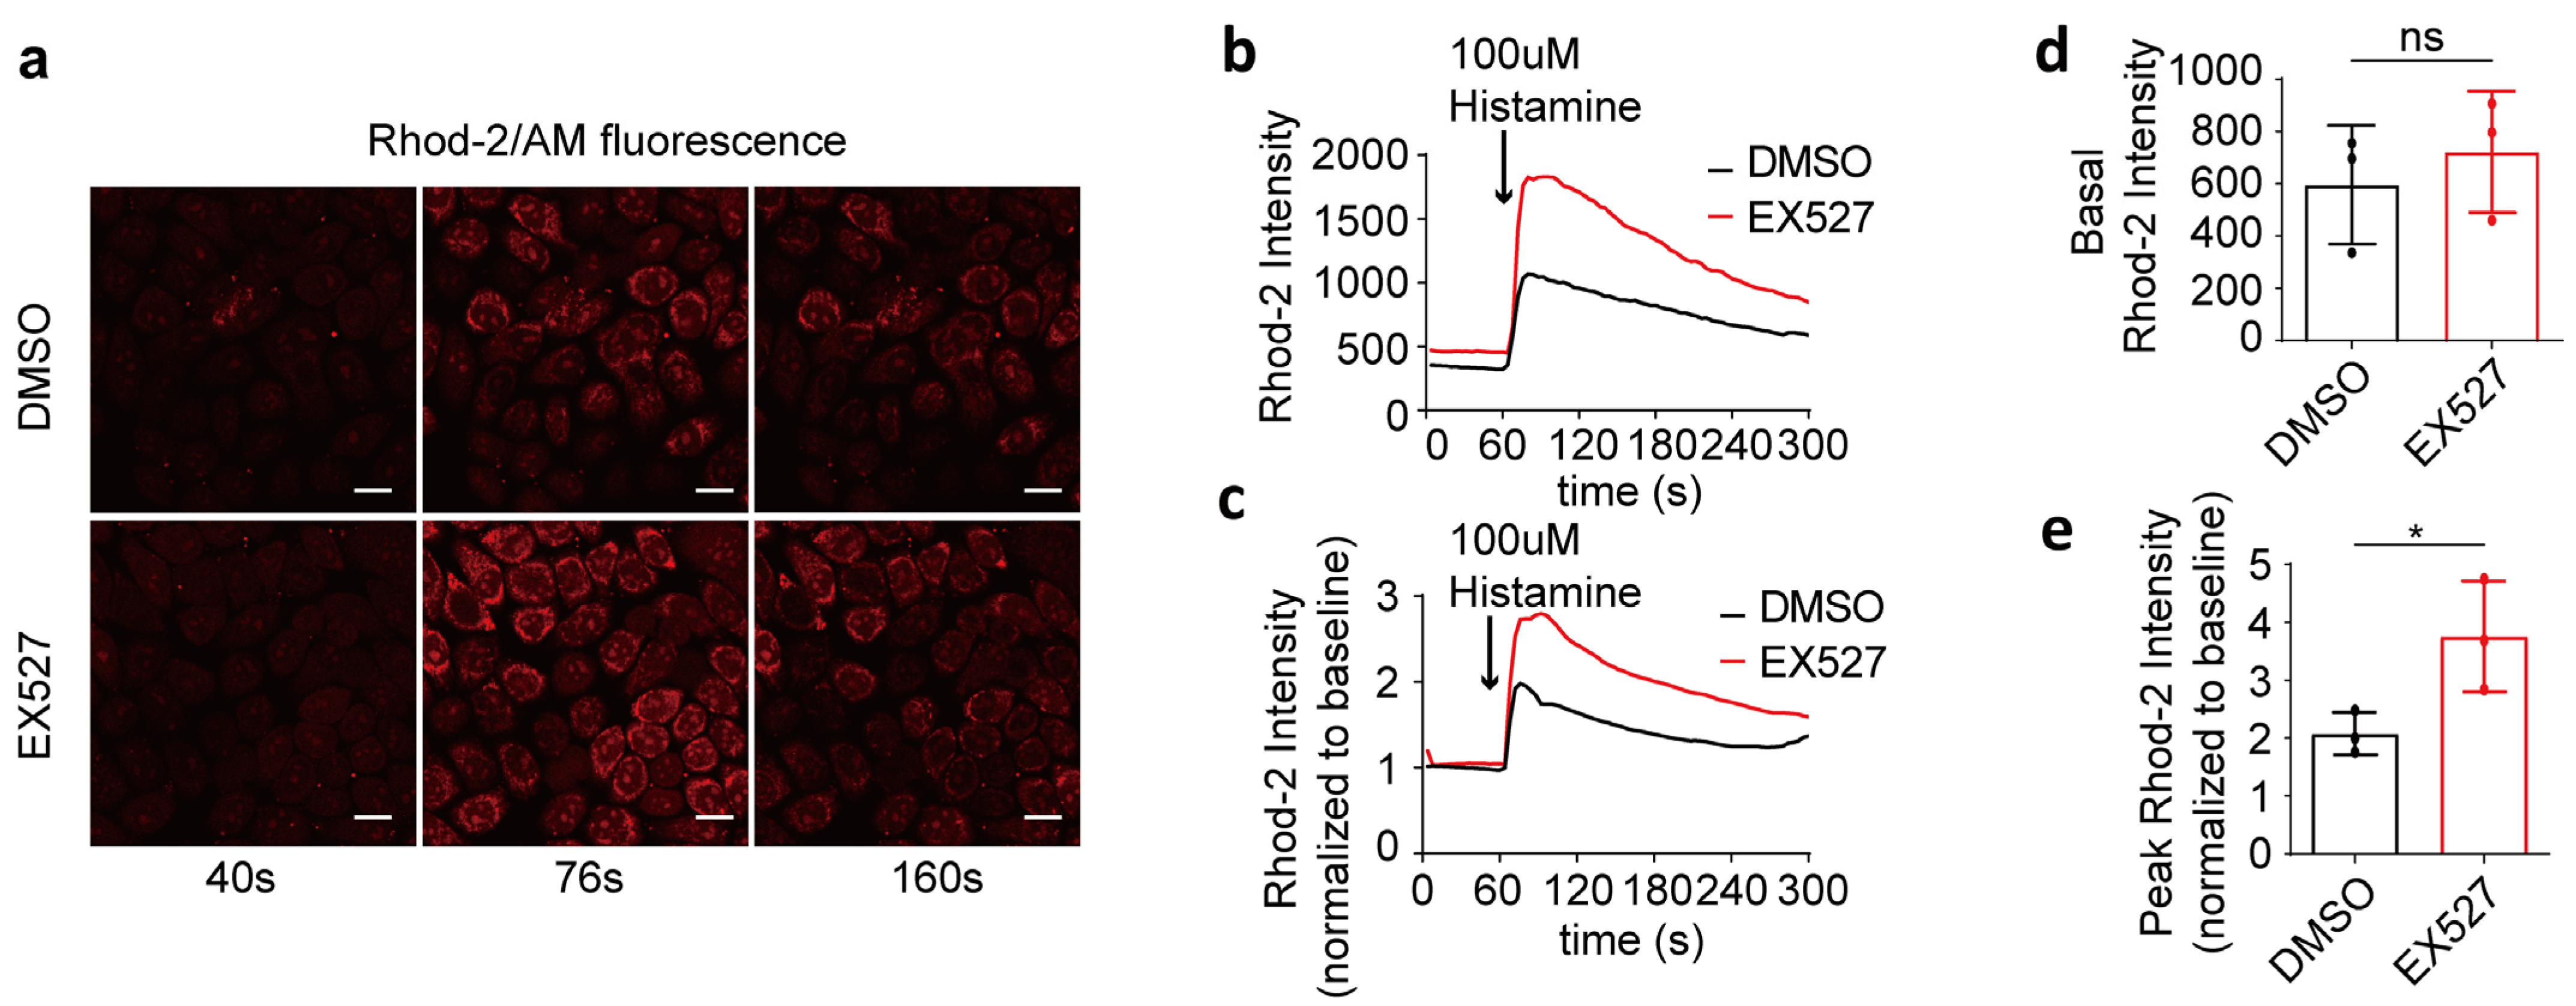
To investigate the impact of SIRT1 on mitochondrial calcium uptake, 100 μM of histamine was utilized to induce the release of calcium from the endoplasmic reticulum into the cytoplasm. The mitochondrial calcium levels were quantified by measuring the intensity of Rhod-2/AM fluorescence (Figure 2a–c). Prior to histamine stimulation, no significant differences in mitochondrial calcium concentrations were observed between the two groups (Figure 2d). Subsequent to histamine administration, the maximum fold change in mitochondrial calcium concentration in EX527-treated cells was markedly higher than that in the DMSO control group, indicating a mitochondrial calcium overload in EX527-treated HeLa cells (Figure 2e).
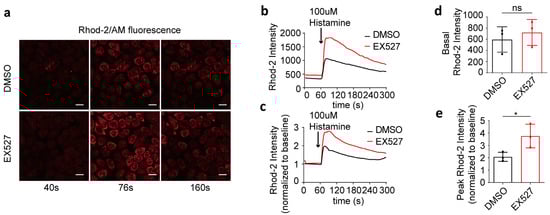
Figure 2.
EX527 affected mitochondrial calcium uptake in HeLa cells. (a) Representative confocal microscopy images acquired at 40 s, 76 s, and 160 s depict mitochondrial calcium levels in HeLa cells following treatment with either DMSO or 10 μM EX527 for 1 h. Continuous recording was performed, with one frame captured every 4 s. At the 60 s time point, 100 μM histamine was added. Rhod-2 AM; Magnification is 40×. Scale bars, 20 μm. (b) The mitochondrial calcium level in HeLa cells treated with DMSO or EX527 for 1 h was determined by Rhod-2 AM staining. Overall, 100 μM histamine was used to induce cellular calcium release. (c) The fold change in mitochondrial calcium level in HeLa cells treated with DMSO or EX527 for 1 h, normalized to baseline. (d) Average Rhod-2 AM fluorescence intensity before 100 μM histamine treatment. (e) Maximum fold change in Rhod-2/AM fluorescence intensity after 100 μM histamine treatment. For each group, 30 cells from three independent experiments were analyzed. The data are presented as mean values ± SD. ns, not significant; * p < 0.05.
3.3. SIRT1 shRNA Exacerbates Histamine-Induced Mitochondrial Calcium Overload in HeLa Cells
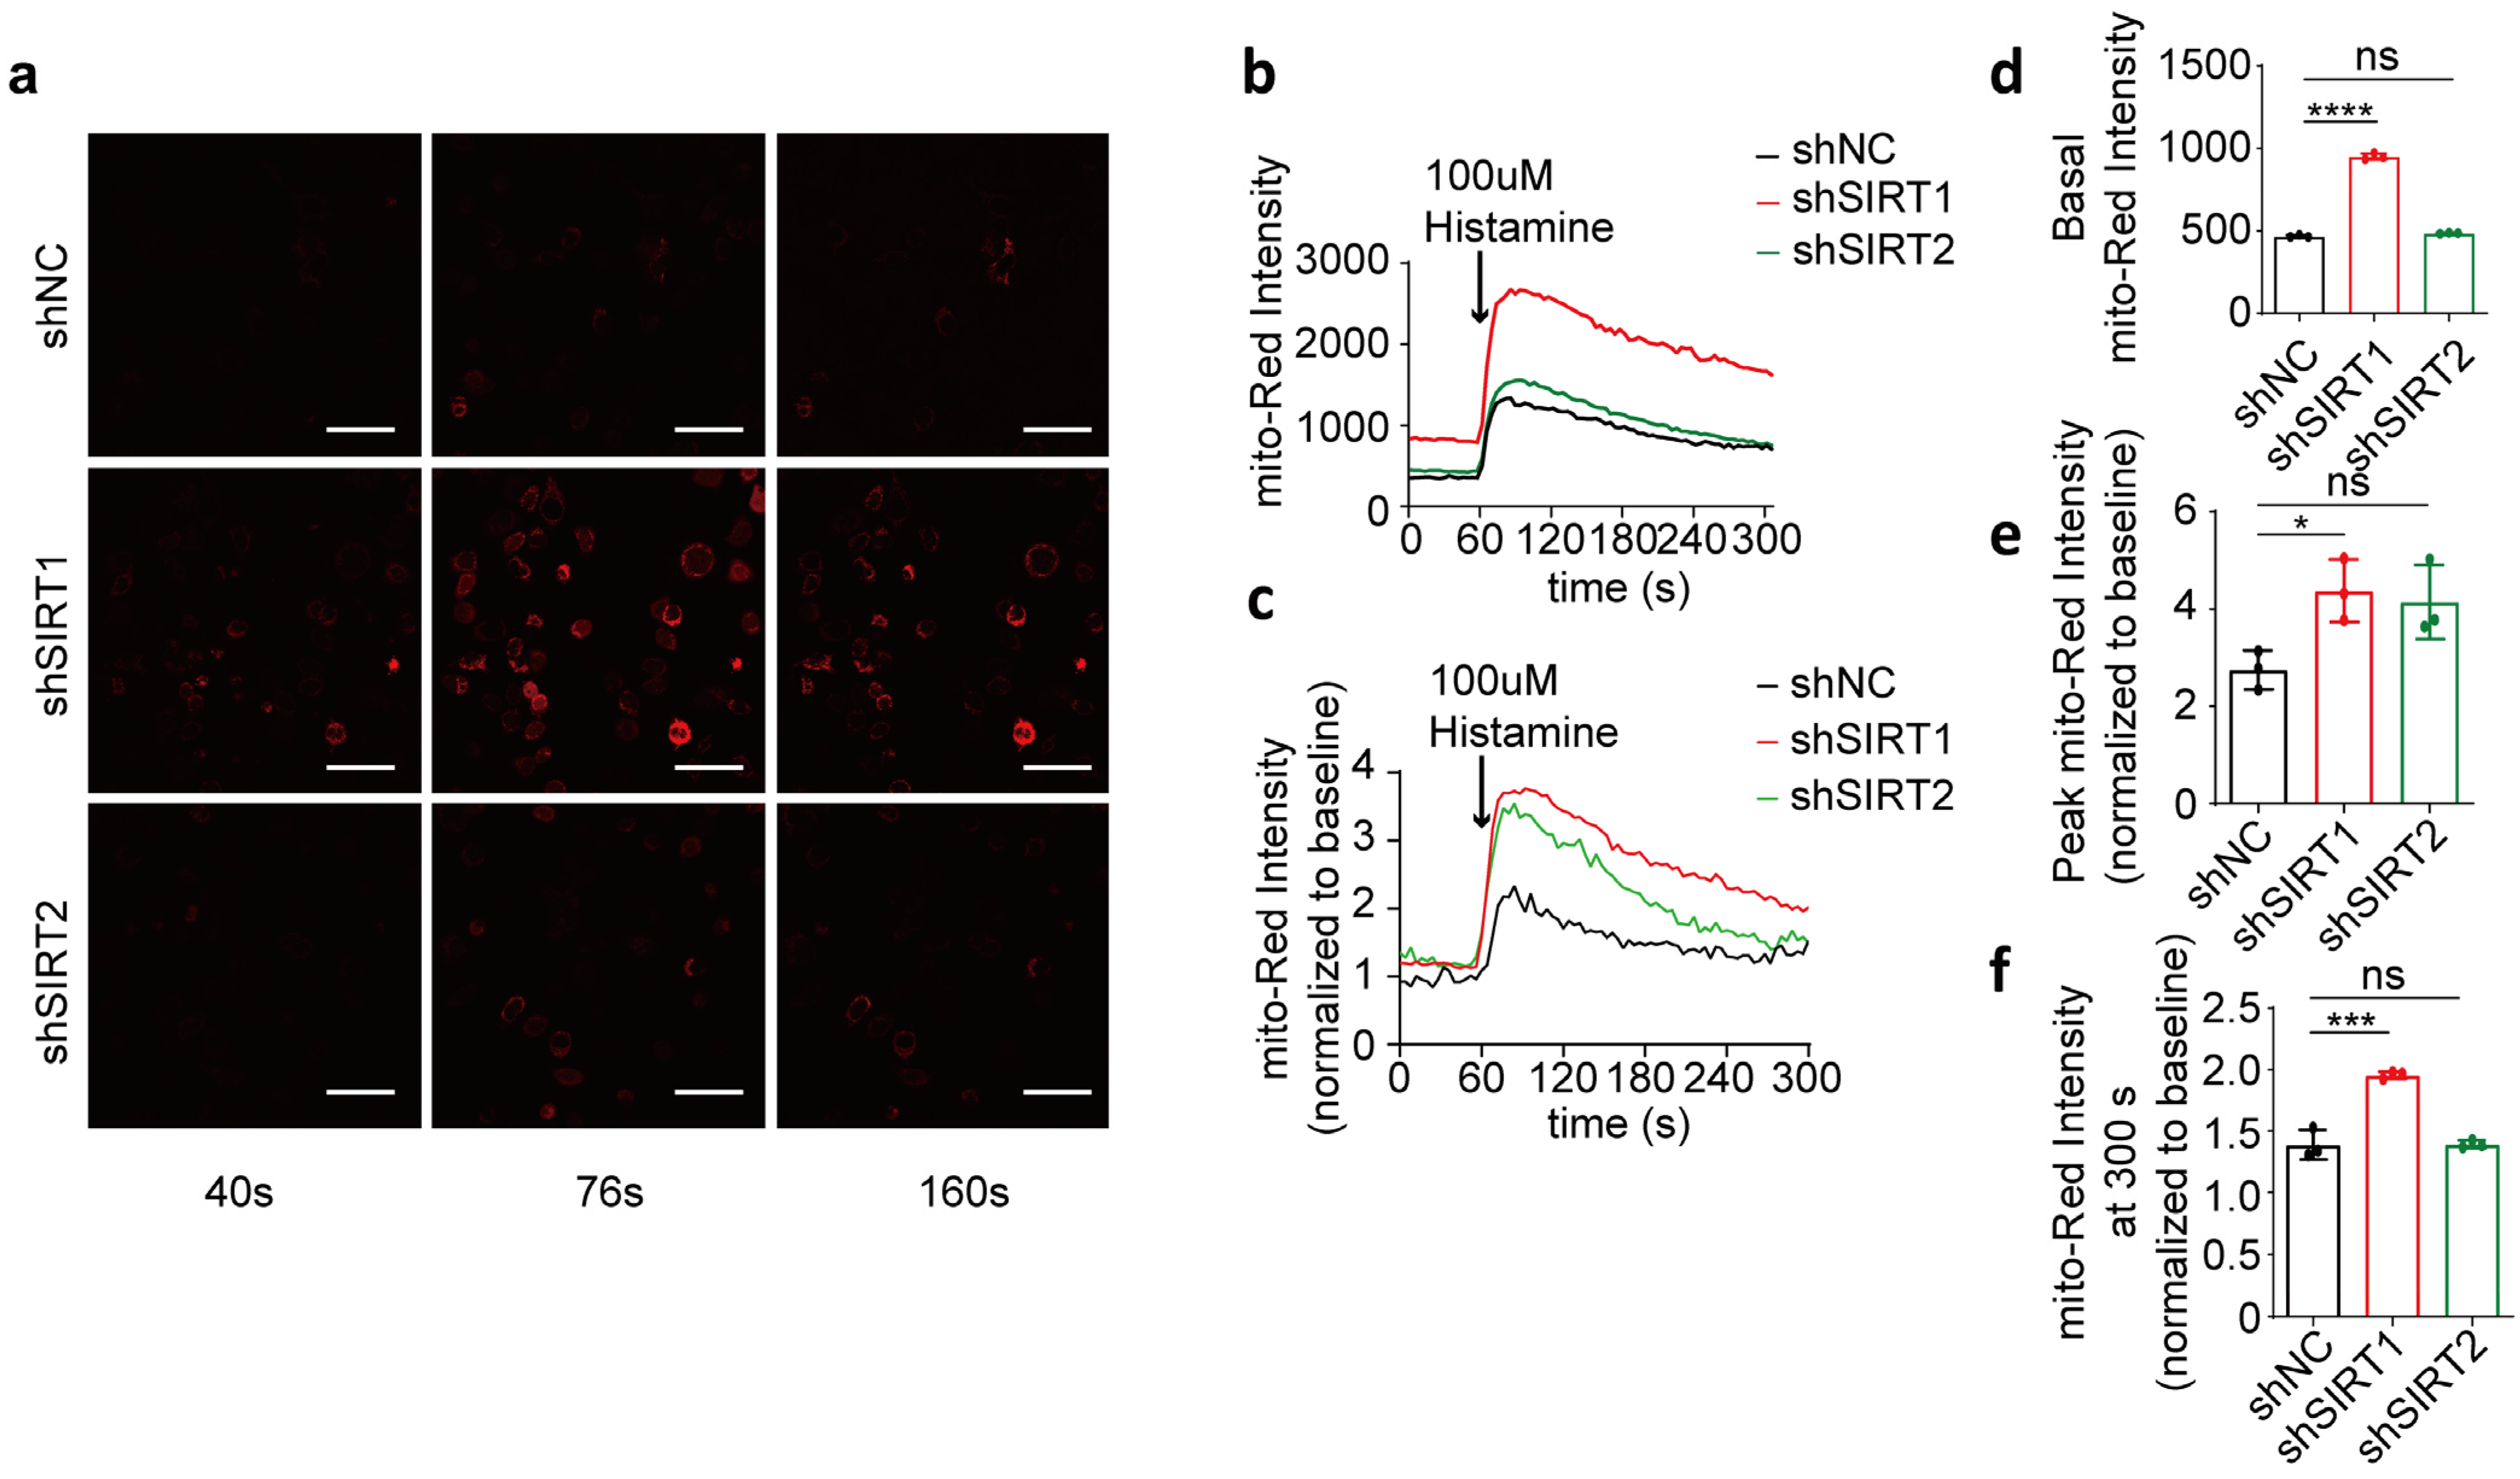
To assess the specific effect of SIRT1 on mitochondrial calcium uptake, we transiently suppressed the expression of SIRT1 or SIRT2 in HeLa cells using shRNA interference (Figure 3a–c; full blots are shown in Supplementary Figure S2b). Our findings revealed that the basal mitochondrial calcium concentration in the shSIRT1 group was significantly higher than in the shNC group 48 h after co-transfection, while the basal intensity of the shSIRT2 group did not show a significant difference compared to the shNC group (Figure 3d). Following histamine-induced calcium release from the endoplasmic reticulum, the increase in the mitochondrial calcium level in the shSIRT1 group was consistently higher than in the shNC group, characterized by a significantly higher rate of increase in mito-Red fluorescence intensity. In contrast, the shSIRT2 group did not show a significant increase (Figure 3e). Furthermore, the rate of reduction in mitochondrial calcium levels in the shSIRT1 group was slower compared to that in the shNC group, with a significantly higher fold change observed in mitochondrial calcium levels at 240 s post-histamine administration, whereas no significant differences were observed in the intensity within the shSIRT2 group relative to the shNC group (Figure 3f). This suggests that disruption of SIRT1 impairs mitochondrial regulation of basal calcium levels and enhances histamine-triggered calcium uptake. In contrast, SIRT2 interference does not elicit this response.
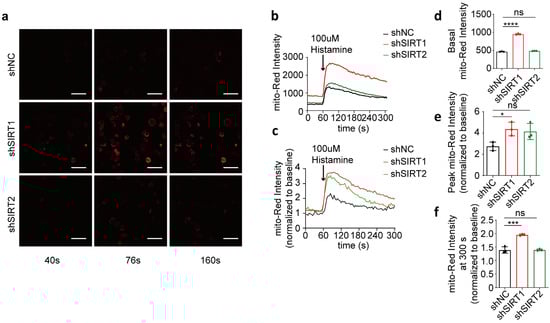
Figure 3.
shSIRT1 affected mitochondrial calcium uptake in HeLa cells. (a) Representative confocal images (40 s, 76 s, and 160 s) of mitochondrial calcium in HeLa cells co-transfected with shSIRT1 or shSIRT2 interference plasmids and the CMV-mito-R-GECO1 mitochondrial calcium-targeting fluorescence plasmid, followed by treatment with 100 μM histamine to induce cellular calcium release. Continuous recording was performed, with one frame captured every 4 s. At the 60 s time point, 100 μM histamine was added. Red, mito-Red; Magnification is 40×. Scale bars, 50 μm. (b) Mitochondrial calcium fluorescence intensity changes in HeLa cells determined by mito-Red intensity. Overall, 100 μM histamine was used to induce cellular calcium release. (c) The fold change in mitochondrial calcium level in HeLa cells normalized to baseline. (d) Average mitochondrial calcium fluorescence intensity before treatment with 100 μM histamine. (e) Maximum fold change in mitochondrial calcium fluorescence intensity after treatment with 100 μM histamine. (f) The fold change in mitochondrial calcium fluorescence intensity at 300 s. For each group, 30 cells from three independent experiments were analyzed. The data are presented as mean values ± SD. ns, not significant; * p < 0.05; *** p < 0.001; **** p < 0.0001.
3.4. MICU1 and SIRT1 Interacted with Each Other
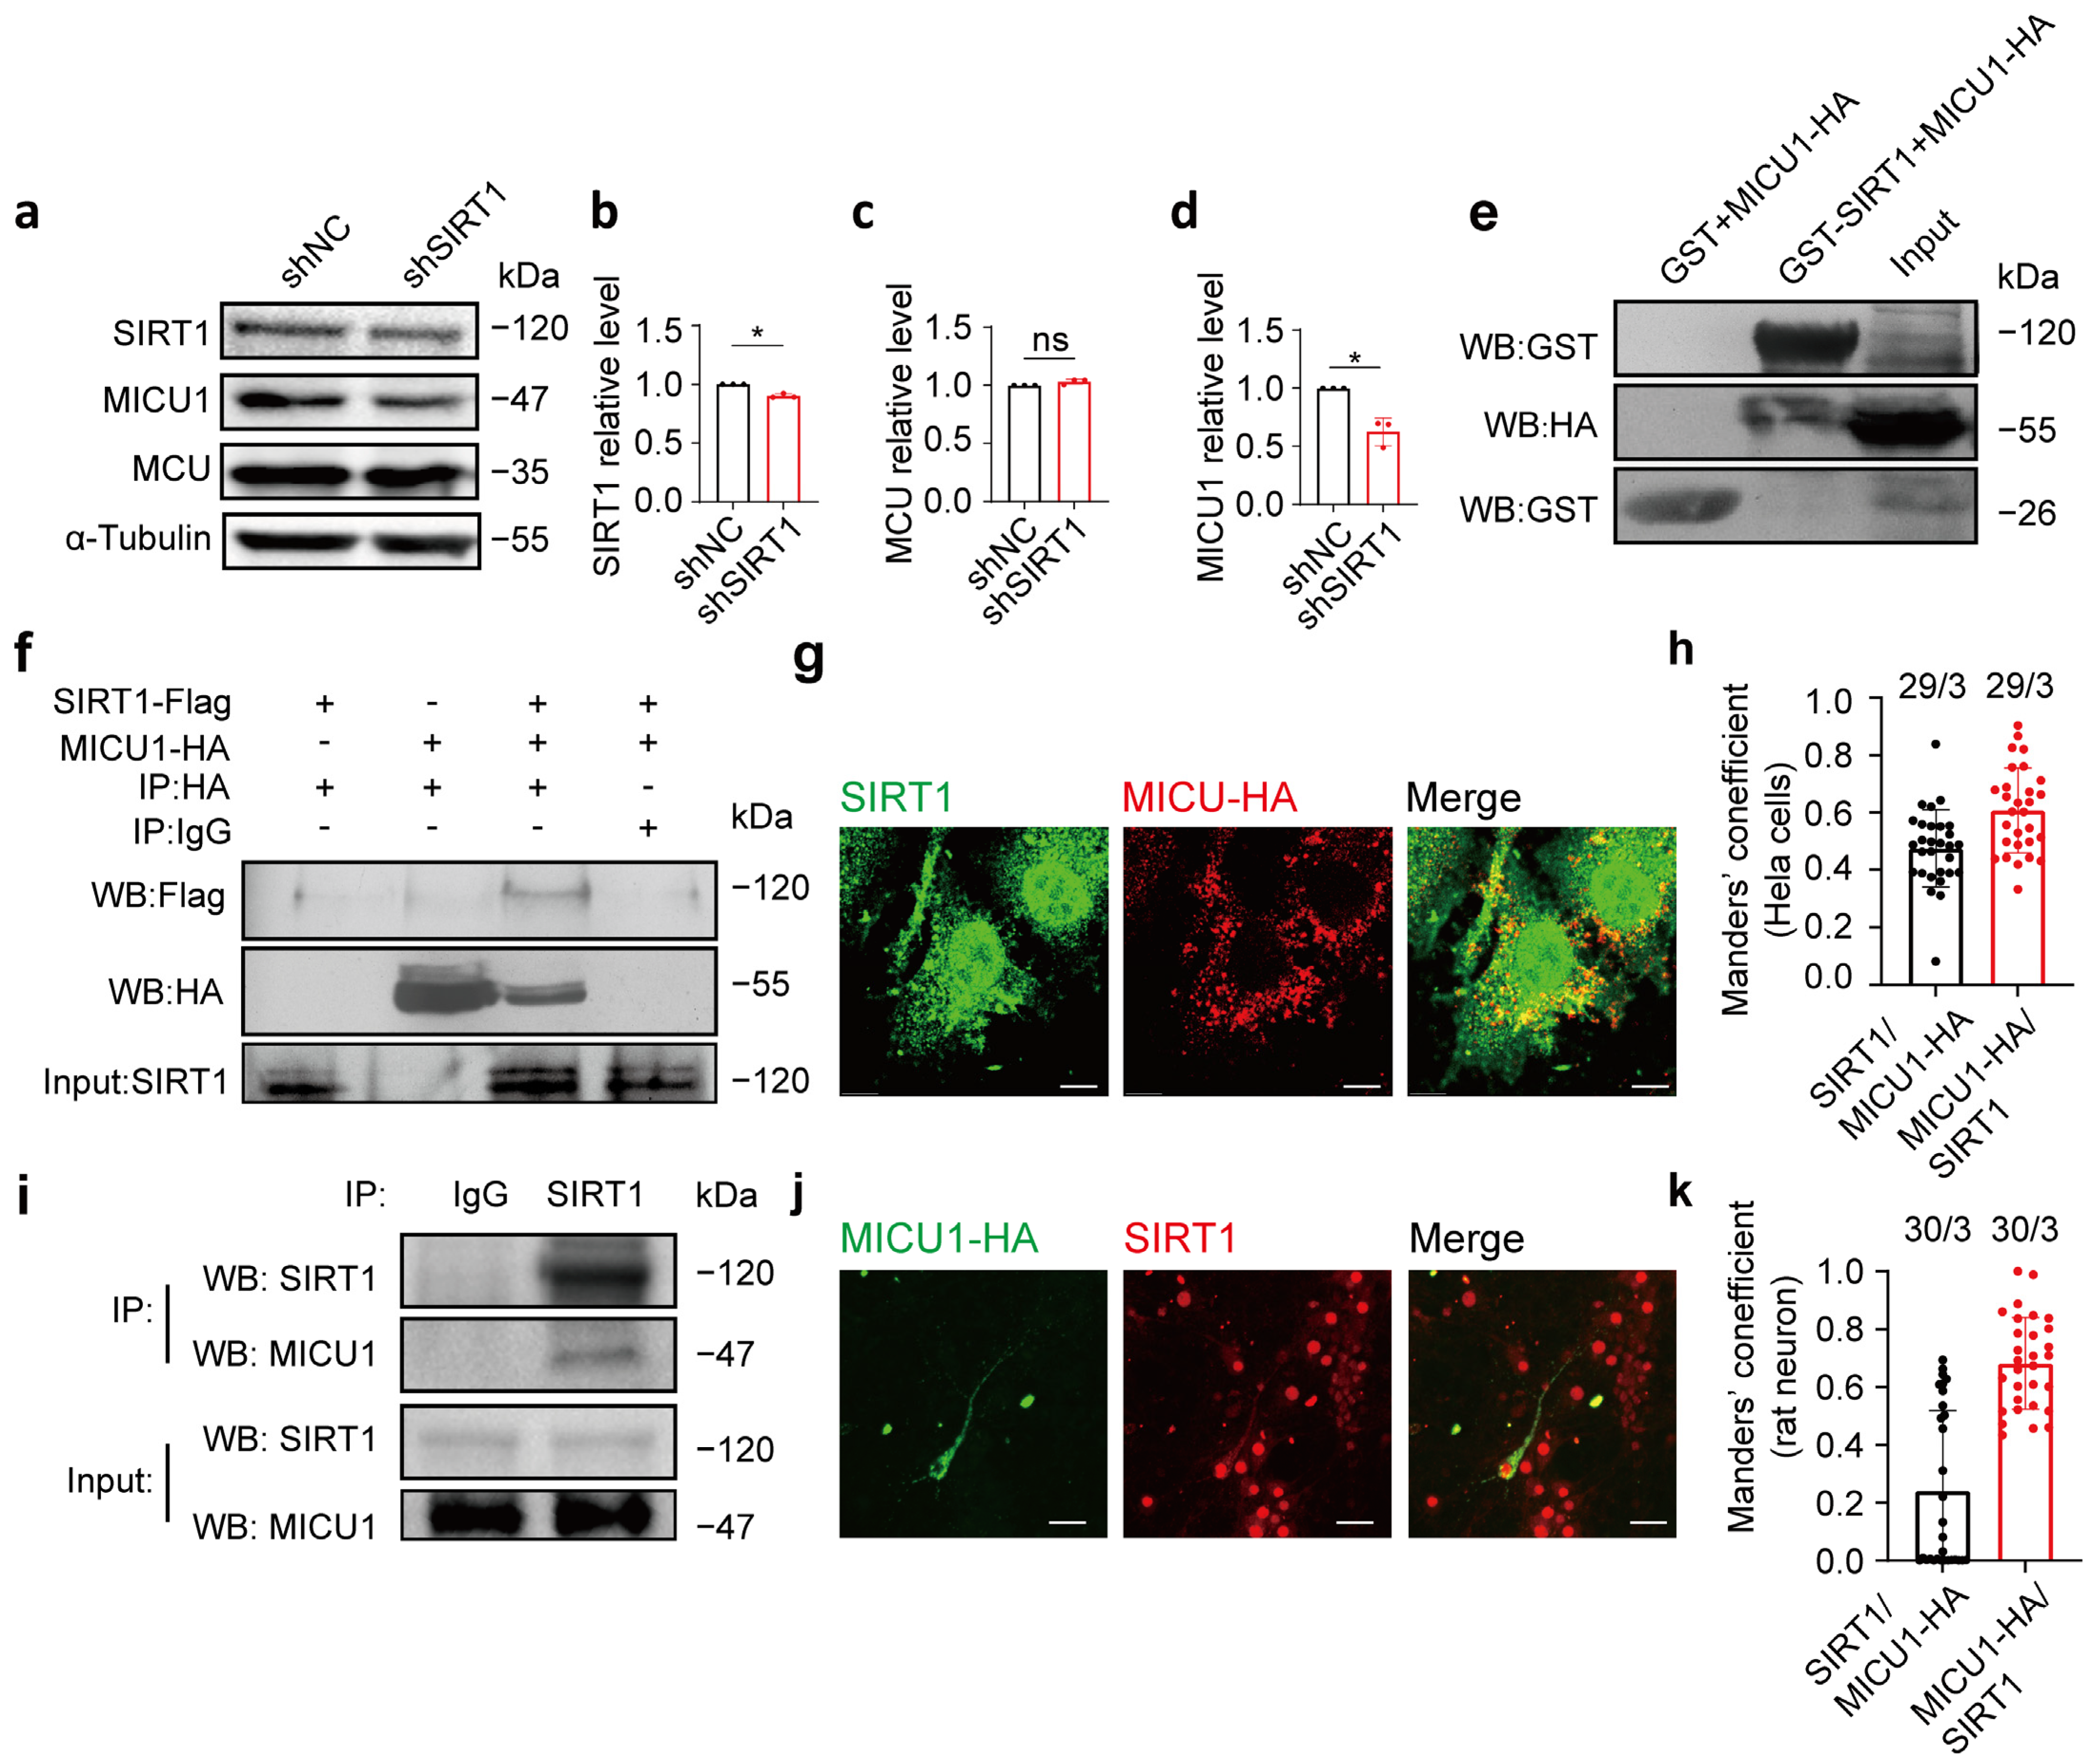
We subsequently examined whether SIRT1 modulates the protein level of MICU1. SIRT1 expression was knocked down using shSIRT1 in HeLa cells, and the protein levels of MICU1 and MCU were measured 48 h following transfection. The results indicated that after 48 h of transfection, the MICU1 protein level decreased in the shSIRT1 group, while the MCU protein level remained unaltered (Figure 4a–d; full blots are shown in Supplementary Figure S2a).

Figure 4.
MICU1 and SIRT1 interacted with each other. (a–d) SIRT1, MCU, and MICU1 protein expression levels after HeLa cells transfection of shSIRT1 (n = 3 biological replicates; three technical replicates were achieved). (e) GST assay was performed to determine the interaction of SIRT1 and MICU1. Purified GST and GST-SIRT1 proteins were incubated with cell lysate (Input) containing MICU1-HA proteins, followed by examination of the proteins bound to GST and GST-SIRT1 via Western blot analysis. (f) Co-IP was determined in SIRT1 immunoprecipitates by Western blot analysis. SIRT1-flag + pcmv-HA, pcmv-tag4a + MICU1-HA, SIRT1-flag + MICU1-HA, and SIRT1-flag + MICU1-HA constructs were expressed in HeLa cells, and anti-FLAG, anti-HA, and anti-SIRT1 antibodies were employed for immunoprecipitation. (g) SIRT1 and MICU1 exhibited colocalization in HeLa cells. Red, HA; Green, SIRT1. Magnification is 60×. Scale bars, 5 μm. (h) The levels of colocalization between SIRT1 and MICU1-HA expressed as MCC for a fraction of SIRT1 pixels that are shared with HA (black bar) or vice versa (red bar) in HeLa cells. (i) Lysates from rat neurons cultured for 7 days were collected. SIRT1 antibody was utilized for immunoprecipitation, and anti-SIRT1 and anti-MICU1 antibodies were used for Western blot analysis. (j) MICU1-HA was transfected into primary cultured rat neurons, and antibodies targeting HA and SIRT1 were applied as immunofluorescent co-labels. Red, SIRT1; Green, HA. Magnification is 60×. Scale bars, 50 μm. (k) The levels of colocalization between SIRT1 and mitochondria expressed as MCC for a fraction of SIRT1 pixels that are shared with HA (black bar) or vice versa (red bar) in SD rat cortical neurons. The data are presented as mean values ± SD. ns, not significant; * p < 0.05. Statistical analysis was carried out using the Mann–Whitney U Test (b–d). The number of cells analyzed/the number of independent experiments is indicated above the bars.
To investigate the interaction between SIRT1 and MICU1, we examined their binding both intracellularly and extracellularly. First, we overexpressed the MICU1-HA plasmid in HeLa cells, extracted cell lysates after lysis, and conducted a GST pull-down assay with GST and GST-SIRT1 expressed in bacteria. Following purification, GST-SIRT1 or GST was incubated with the cell lysate containing the MICU1-HA plasmid. The results demonstrated that GST-SIRT1 was bound to MICU1-HA, indicating an interaction between SIRT1 and MICU1 (Figure 4e; full blots are shown in Supplementary Figure S2b). Next, HeLa cells were transfected with SIRT1-flag plus pCMV-HA, pCMV-tag4a plus MICU1-HA, or SIRT1-flag plus MICU1-HA, and lysed after 24 h for co-immunoprecipitation. The results indicated an intracellular interaction between SIRT1 and MICU1 (Figure 4f; full blots are shown in Supplementary Figure S2c). Fluorescence localization analysis of SIRT1 and MICU1 indicated their colocalization in HeLa cells. A large proportion of HA signals colocalized with SIRT1 signals (MCC = 0.61 ± 0.1482, n = 29; Figure 4g,h, red bar). A smaller fraction of SIRT1 signals were found colocalized with HA signal (MCC = 0.47 ± 0.1349, n = 29; Figure 4g,h, black bar. Additional images are provided in Supplementary Figure S2d). To confirm the endogenous interaction between SIRT1 and MICU1, we performed co-immunoprecipitation experiments using primary cultures of rat cortical neurons. These results further confirmed the interaction between SIRT1 and MICU1 in primary cultured rat neurons (Figure 4i; full blots are provided in Supplementary Figure S2e). Fluorescence localization analysis of SIRT1 and MICU1 indicated their colocalization in primary cultured rat cortical neurons. A substantial fraction of HA signals colocalized with SIRT1 signals (MCC = 0.68 ± 0.1589, n = 30; Figure 4j,k, red bar). A smaller fraction of SIRT1 signals exhibited colocalization with MICU1-HA signals (MCC = 0.24 ± 0.2776, n = 30; Figure 4j,k, black bar. More images of transfected neurons are shown in the Supplementary Material Figure S2d. Additional images are provided in Supplementary Figure S2f). These findings collectively indicate an interaction between SIRT1 and MICU1, suggesting that MICU1 could play a role in SIRT1-mediated regulation of mitochondrial calcium homeostasis.
3.5. Overexpression of MICU1 Mitigated the Mitochondrial Calcium Overload Induced by SIRT1 Inhibition
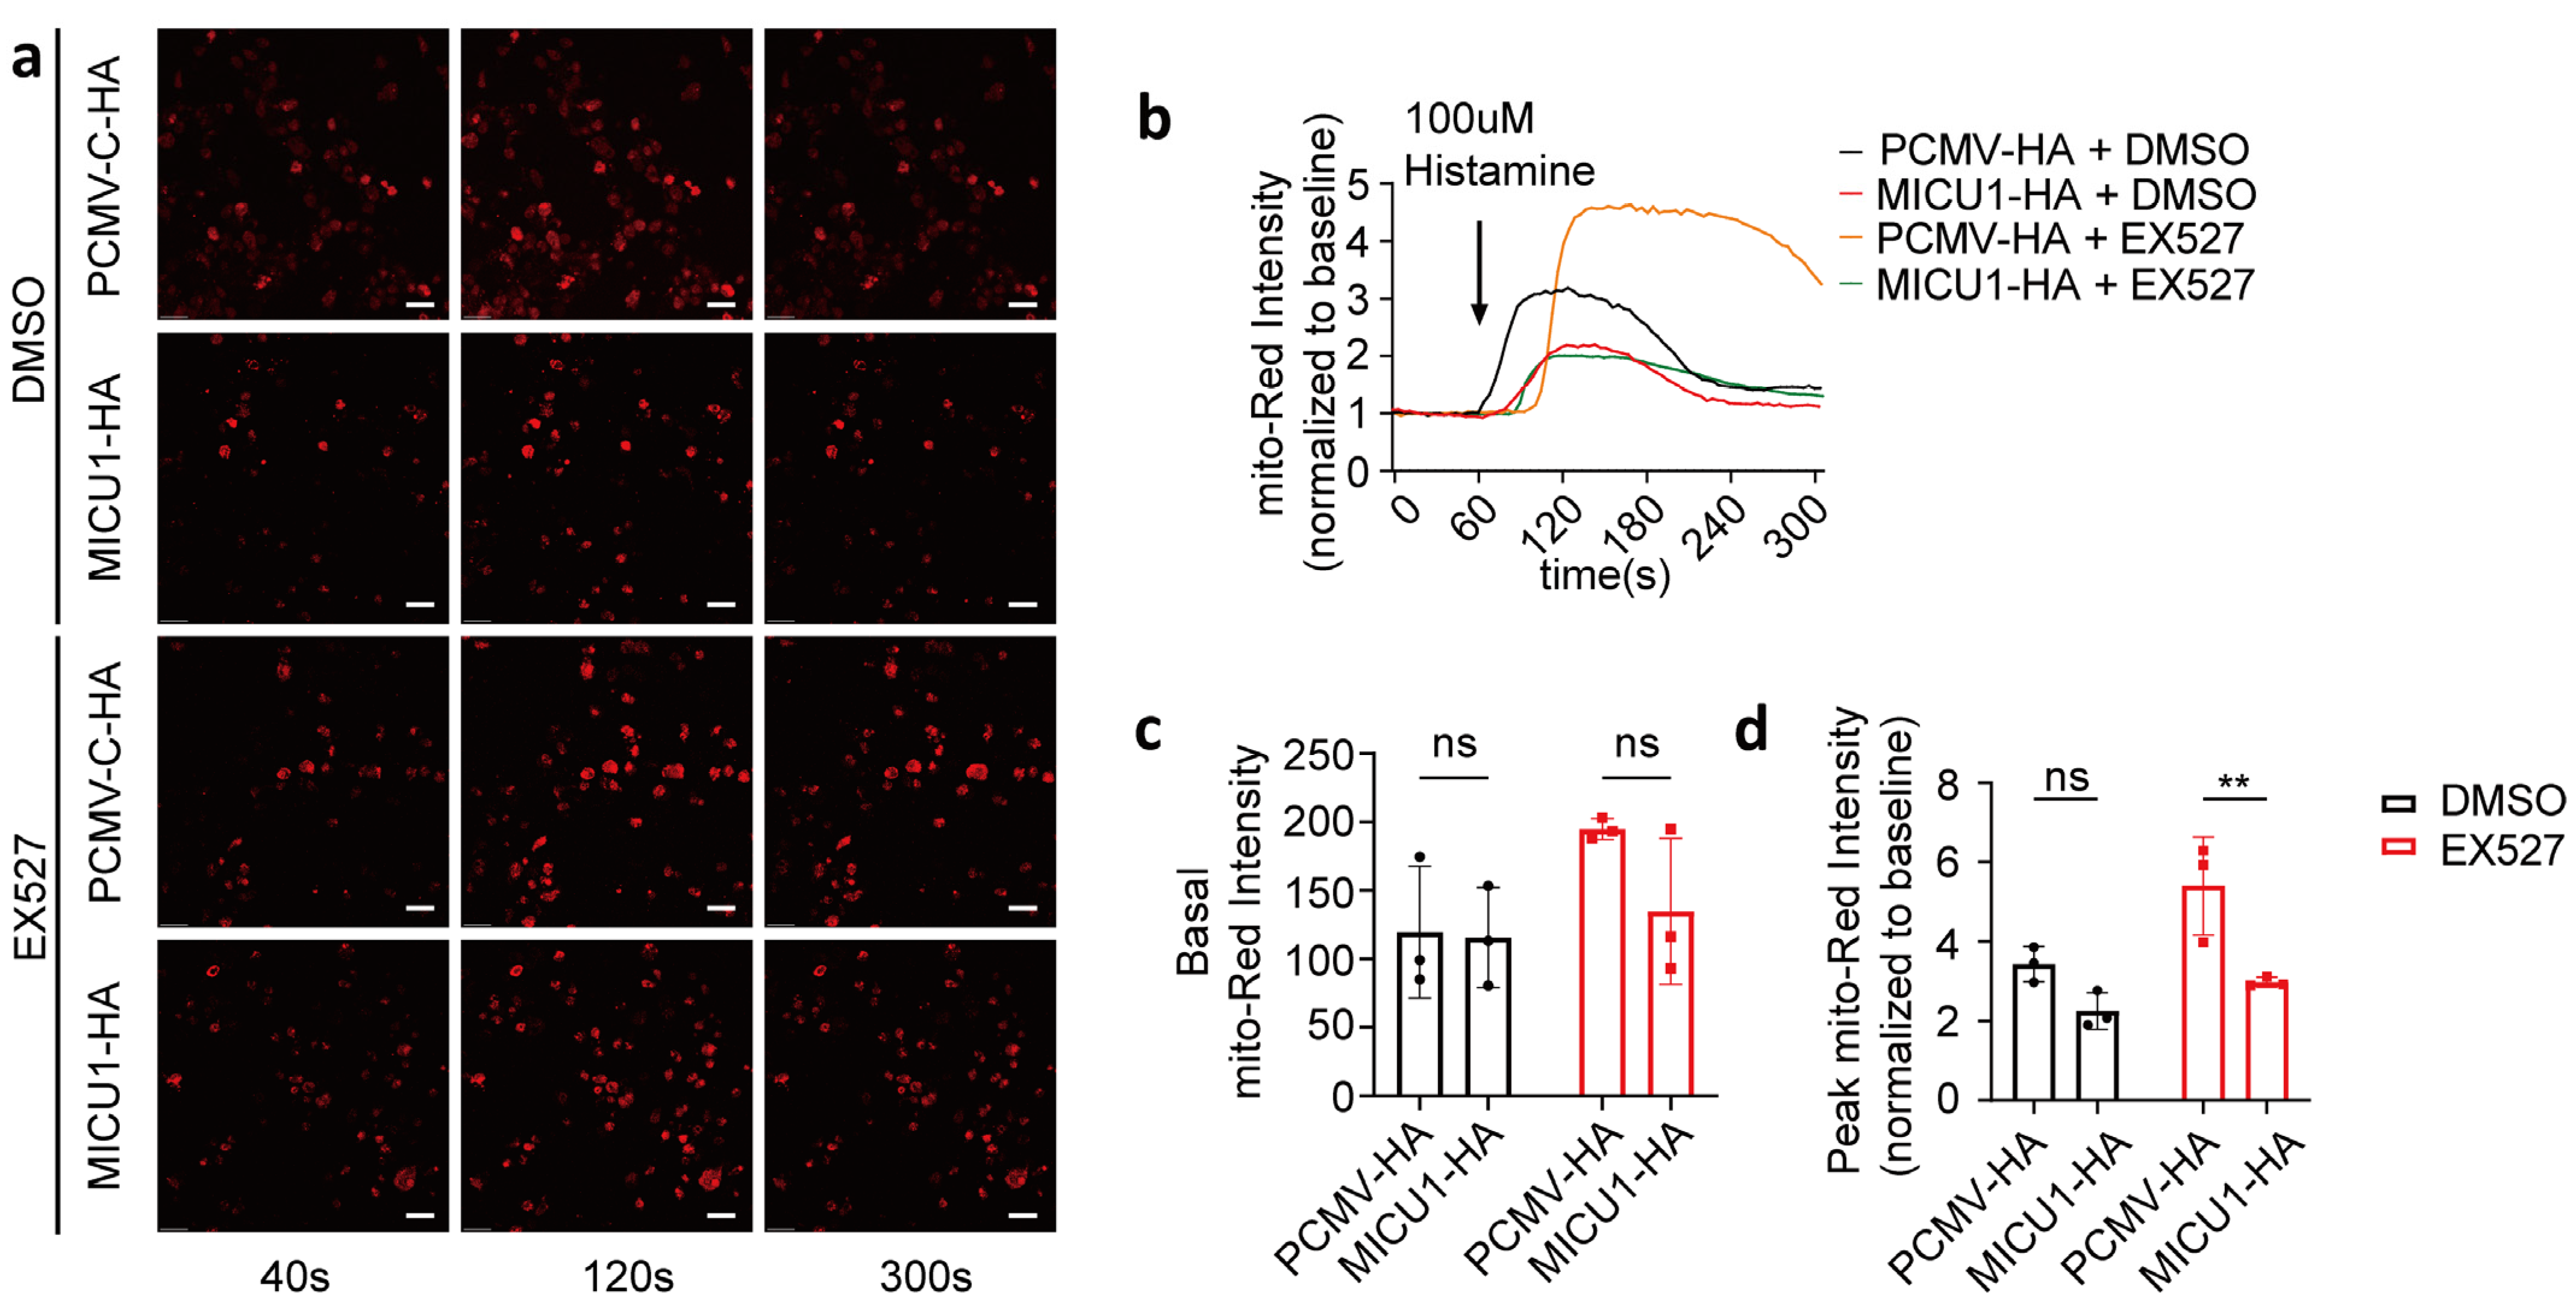
To investigate whether SIRT1 regulates mitochondrial calcium uptake via MICU1, we overexpressed MICU1 and assessed mitochondrial calcium uptake in the presence of EX527 (Figure 5a,b). Our results demonstrated that 1 h after EX527 treatment, the activation levels of mitochondrial calcium in HeLa cells overexpressing MICU1, following histamine-induced calcium release, were significantly lower compared to those transfected with the control vector. Conversely, no significant differences were detected in basal intensity or activation levels under DMSO conditions (Figure 5c,d). These findings suggest that MICU1 may serve as a regulatory factor in SIRT1-mediated mitochondrial calcium uptake.
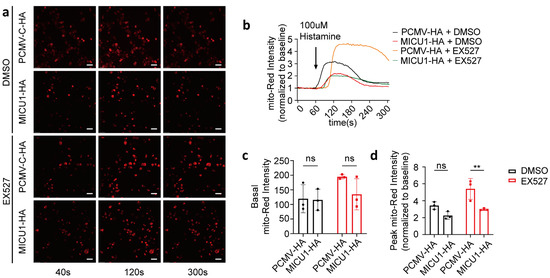
Figure 5.
SIRT1 regulated mitochondrial calcium uptake through MICU1. (a) HeLa cells were co-transfected with MICU1-HA or pCMV-C-HA, along with the mitochondrial calcium-targeting fluorescent plasmid CMV-mito-R-GECO1. Representative confocal images (40 s, 120 s, and 300 s) of mitochondrial calcium in HeLa cells treated with DMSO or 10 μM EX527 for 1 h. Overall, 100 μM Histamine was used to induce cellular calcium release. Red, mito-Red; Magnification is 40×. Scale bars, 50 μm. Continuous recording was performed, with one frame captured every 4 s. At the 60 s time point, 100 μM histamine was added. (b) The fold change in mitochondrial calcium levels in HeLa cells, normalized to baseline values. (c) Average mitochondrial calcium fluorescence intensity before treatment with 100 μM histamine. (d) The fold change in the peak mitochondrial calcium fluorescence intensity following treatment with 100 μM histamine. For each group, 30 cells from three independent experiments were analyzed (two-way ANOVA and Tukey’s post hoc test). The data are presented as mean values ± SD. ns, not significant; ** p < 0.01.
4. Discussion
Our study elucidated the role of SIRT1 in mitochondrial calcium uptake, highlighting that SIRT1 directly interacts with MICU1 to maintain mitochondrial integrity and Ca2+ homeostasis. The loss of SIRT1 function resulted in decreased MICU1 expression, which subsequently led to mitochondrial morphological fragmentation and reduced efficiency in regulating calcium uptake. Abnormal mitochondrial calcium metabolism may contribute to irregular cell discharge and cell death.
Mitochondrial dysfunction is considered one of the primary mechanisms underlying degenerative diseases. While SIRT3 to SIRT5 are known to be located in the mitochondrial matrix [29], only SIRT3 has been associated with neurodegenerative diseases through its regulation of calcium homeostasis [30,31]. SIRT1 has been found to play a key role in maintaining mitochondrial function, promoting mitochondrial biogenesis, and regulating the autophagy–lysosome pathway [32,33]. Previous studies have shown that SIRT1 maintains mitochondrial homeostasis through a variety of substrates. SIRT1 overexpression restores the structure and function of mitochondria by activating Sirtuin 3 (SIRT3) through increasing the deacetylation of SIRT3 [34]. SIRT1 activity decreases the lysine acetylation status in tuberous sclerosis complex 2 (TSC2), regulating mTORC1 signaling and the maintenance of the mitochondrial quality control [35]. Enhancement of the enzymatic activity of SIRT1 leads to increased expression of peroxisome proliferator-activated receptor-gamma coactivator-1alpha (PGC1α) and mitochondrial dynamics protein 18 (MTP18); consequently, this promotes mitochondrial biogenesis and fission, thereby preserving the mitochondrial population in oral cancer cells [36]. These findings together underscore SIRT1′s critical role in maintenance of the stability of mitochondrial structure and function. We found that SIRT1 deficiency induced mitochondria fragmentation and dysfunction in calcium uptake, which could be ameliorated by overexpression of MICU1. The results together suggest a protective role of SIRT1 in maintaining mitochondrial morphology and the function of calcium uptake through MICU1, which further proves the importance of SIRT1 in regulating mitochondrial function.
Our results indicate that SIRT1 interacts with MICU1 to regulate calcium uptake. MICU1, an MCU-mediated mitochondrial calcium uptake protein, acts as a crucial gatekeeper of cellular survival [37]. MICU1 defects can lead to alterations in mitochondrial morphology and calcium uptake kinetics [38,39]. In mice, silencing MICU1 expression in the heart, skeletal muscle, or liver leads to mCa2+ overload and impaired uptake, making these organs more susceptible to injury or regeneration impairment, thereby establishing MICU1’s indispensable role in calcium uptake [37,40,41]. Additionally, MCU and MICU1 expression levels are negatively correlated with age, potentially explaining the increased incidence of neurodegenerative diseases with aging [42]. Studies have demonstrated that SIRT1 inhibition could induce acetylation of MCU residue K332, leading to calcium overload and cell depolarization, culminating in cell death [43]. In our experimental work utilizing HeLa cells, interfering with SIRT1 expression did not alter MCU protein levels but significantly diminished MICU1 protein levels, which suggests that SIRT1 plays a crucial role in the maintenance of MICU1. Moreover, overexpression of MICU1 rescued the calcium overload caused by SIRT1 loss, suggesting that SIRT1 maintains mitochondrial calcium metabolism stability through MICU1. This underscores MICU1’s pivotal role in the calcium uptake process [37].
Our findings on the interaction between SIRT1 and MICU1 raise the question of whether SIRT1 exerts its protective effects in various neurodegenerative diseases through this pathway. Given that impairments in Ca2+ homeostasis have been documented in patients with neurodegenerative diseases such as AD [44], PD [45], and Huntington’s disease (HD) [46], and considering that neurons from MICU1 knockout (KO) mice and MICU1-deficient patient-derived cells exhibit increased susceptibility to mitochondrial Ca2+ overload, excitotoxicity, and cell death [47], it is warranted to further investigate whether the SIRT1-regulated pathway of mitochondrial calcium uptake via MICU1 plays a role in neuronal secondary injury or death in these conditions. This study opens new avenues for exploring the neuroprotective mechanisms of SIRT1.
Supplementary Materials
The following supporting information can be downloaded at: https://www.mdpi.com/article/10.3390/life15020174/s1, Supplementary Figure S1. a. Full blots of Western blot analysis of SIRT1 expression in mitochondria, cytoplasm and whole-cell lysates of Hela cells. b. Additional images of the colocalization of SIRT1 and MitoTracker in Hela cells. c. Additional images showing the colocalization of SIRT1 and MitoTracker in rat cortical neurons. d. Additional images showing the morphology of Hela cells treated with EX527. Supplementary Figure S2. a. Full blots of Western blot analysis of SIRT1, MCU and MICU1 protein expression levels. b. Full blots of Western blot analysis of the GST pull down assay. c. Full blots of Western blot analysis of the co-IP assay in HeLa cells. d. Additional images of the colocalization of SIRT1 and MICU1-HA. e. Full blots of Western blot analysis of the co-IP assay in primary cultured rat neurons. f. Supplementary images of primary cultured rat neurons transfected with MICU1-HA. Red, SIRT1; Green, HA. Magnification is 60×. Scale bars, 50 μm.
Author Contributions
Conceptualization, X.W.; Data curation, Y.S. and L.Z.; Funding acquisition, T.G. and X.W.; Investigation, X.Z., S.L., Y.S. and L.Z.; Methodology, S.L.; Project administration, T.G.; Resources, X.W.; Software, Y.S.; Supervision, X.W.; Validation, L.Z.; Writing—original draft, X.Z.; Writing—review and editing, X.W. All authors have read and agreed to the published version of the manuscript.
Funding
This research was funded by the National Key Research and Development Program of China (2023YFC3504300); Natural Science Foundation of Guangdong Province (Grant 2022A15150122); The Medical Scientific Research Foundation of Guangdong Province (A2023432); and Guangdong-Hong Kong Joint Laboratory for Psychiatric Disorders (2023B1212120004).
Institutional Review Board Statement
Studies were conducted in strict accordance with the recommendations outlined in the Guide for the Care and Use of Laboratory Animals of the National Institutes of Health. The protocol was approved by the Committee on the Ethics of Animal Experiments of Southern Medical University (Permit Number: 2016138; 10 October 2016).
Informed Consent Statement
Not applicable.
Data Availability Statement
The data are available from the corresponding author (xmwang@smu.edu.cn) on reasonable request.
Conflicts of Interest
The authors declare no conflicts of interest.
References
- Luongo, T.S.; Lambert, J.P.; Gross, P.; Nwokedi, M.; Lombardi, A.A.; Shanmughapriya, S.; Carpenter, A.C.; Kolmetzky, D.; Gao, E.; van Berlo, J.H.; et al. The mitochondrial Na+/Ca2+ exchanger is essential for Ca2+ homeostasis and viability. Nature 2017, 545, 93–97. [Google Scholar] [CrossRef] [PubMed]
- Dong, Z.; Shanmughapriya, S.; Tomar, D.; Siddiqui, N.; Lynch, S.; Nemani, N.; Breves, S.L.; Zhang, X.; Tripathi, A.; Palaniappan, P.; et al. Mitochondrial Ca2+ Uniporter Is a Mitochondrial Luminal Redox Sensor that Augments MCU Channel Activity. Mol. Cell 2017, 65, 1014–1028. [Google Scholar] [CrossRef]
- Bick, A.G.; Calvo, S.E.; Mootha, V.K. Evolutionary diversity of the mitochondrial calcium uniporter. Science 2012, 336, 886. [Google Scholar] [CrossRef]
- Pittis, A.A.; Goh, V.; Cebrian-Serrano, A.; Wettmarshausen, J.; Perocchi, F.; Gabaldon, T. Discovery of EMRE in fungi resolves the true evolutionary history of the mitochondrial calcium uniporter. Nat. Commun. 2020, 11, 4031. [Google Scholar] [CrossRef] [PubMed]
- Garbincius, J.F.; Elrod, J.W. Mitochondrial calcium exchange in physiology and disease. Physiol. Rev. 2022, 102, 893–992. [Google Scholar] [CrossRef]
- Fan, M.; Zhang, J.; Tsai, C.W.; Orlando, B.J.; Rodriguez, M.; Xu, Y.; Liao, M.; Tsai, M.F.; Feng, L. Structure and mechanism of the mitochondrial Ca2+ uniporter holocomplex. Nature 2020, 582, 129–133. [Google Scholar] [CrossRef]
- Tsai, C.W.; Rodriguez, M.X.; Van Keuren, A.M.; Phillips, C.B.; Shushunov, H.M.; Lee, J.E.; Garcia, A.M.; Ambardekar, A.V.; Cleveland, J.J.; Reisz, J.A.; et al. Mechanisms and significance of tissue-specific MICU regulation of the mitochondrial calcium uniporter complex. Mol. Cell 2022, 82, 3661–3676. [Google Scholar] [CrossRef]
- Liang, T.; Hang, W.; Chen, J.; Wu, Y.; Wen, B.; Xu, K.; Ding, B.; Chen, J. ApoE4 (Δ272–299) induces mitochondrial-associated membrane formation and mitochondrial impairment by enhancing GRP75-modulated mitochondrial calcium overload in neuron. Cell Biosci. 2021, 11, 50. [Google Scholar] [CrossRef] [PubMed]
- Marinho, D.; Ferreira, I.L.; Lorenzoni, R.; Cardoso, S.M.; Santana, I.; Rego, A.C. Reduction of class I histone deacetylases ameliorates ER-mitochondria cross-talk in Alzheimer’s disease. Aging Cell 2023, 22, e13895. [Google Scholar] [CrossRef]
- Apicco, D.J.; Shlevkov, E.; Nezich, C.L.; Tran, D.T.; Guilmette, E.; Nicholatos, J.W.; Bantle, C.M.; Chen, Y.; Glajch, K.E.; Abraham, N.A.; et al. The Parkinson’s disease-associated gene ITPKB protects against alpha-synuclein aggregation by regulating ER-to-mitochondria calcium release. Proc. Natl. Acad. Sci. USA 2021, 118, e2006476118. [Google Scholar] [CrossRef]
- Beccano-Kelly, D.A.; Cherubini, M.; Mousba, Y.; Cramb, K.; Giussani, S.; Caiazza, M.C.; Rai, P.; Vingill, S.; Bengoa-Vergniory, N.; Ng, B.; et al. Calcium dysregulation combined with mitochondrial failure and electrophysiological maturity converge in Parkinson’s iPSC-dopamine neurons. iScience 2023, 26, 107044. [Google Scholar] [CrossRef] [PubMed]
- Yang, Y.; Liu, Y.; Wang, Y.; Chao, Y.; Zhang, J.; Jia, Y.; Tie, J.; Hu, D. Regulation of SIRT1 and Its Roles in Inflammation. Front. Immunol. 2022, 13, 831168. [Google Scholar] [CrossRef]
- Qiu, L.L.; Tan, X.X.; Yang, J.J.; Ji, M.H.; Zhang, H.; Zhao, C.; Xia, J.Y.; Sun, J. Lactate Improves Long-Term Cognitive Impairment Induced by Repeated Neonatal Sevoflurane Exposures Through SIRT1-Mediated Regulation of Adult Hippocampal Neurogenesis and Synaptic Plasticity in Male Mice. Mol. Neurobiol. 2023, 60, 5273–5291. [Google Scholar] [CrossRef] [PubMed]
- Wang, R.; Wu, Z.; Bai, L.; Liu, R.; Ba, Y.; Zhang, H.; Cheng, X.; Zhou, G.; Huang, H. Resveratrol improved hippocampal neurogenesis following lead exposure in rats through activation of SIRT1 signaling. Environ. Toxicol. 2021, 36, 1664–1673. [Google Scholar] [CrossRef] [PubMed]
- Fan, W.; Tang, S.; Fan, X.; Fang, Y.; Xu, X.; Li, L.; Xu, J.; Li, J.L.; Wang, Z.; Li, X. SIRT1 regulates sphingolipid metabolism and neural differentiation of mouse embryonic stem cells through c-Myc-SMPDL3B. eLife 2021, 10, e67452. [Google Scholar] [CrossRef] [PubMed]
- Surya, K.; Manickam, N.; Jayachandran, K.S.; Kandasamy, M.; Anusuyadevi, M. Resveratrol Mediated Regulation of Hippocampal Neuroregenerative Plasticity via SIRT1 Pathway in Synergy with Wnt Signaling: Neurotherapeutic Implications to Mitigate Memory Loss in Alzheimer’s Disease. J. Alzheimer’s Dis. 2023, 94, S125–S140. [Google Scholar] [CrossRef] [PubMed]
- Marin, C.; Langdon, C.; Alobid, I.; Fuentes, M.; Bonastre, M.; Mullol, J. Recovery of Olfactory Function After Excitotoxic Lesion of the Olfactory Bulbs Is Associated with Increases in Bulbar SIRT1 and SIRT4 Expressions. Mol. Neurobiol. 2019, 56, 5643–5653. [Google Scholar] [CrossRef] [PubMed]
- Wang, K.J.; Zhang, W.Q.; Liu, J.J.; Cui, Y.; Cui, J.Z. Piceatannol protects against cerebral ischemia/reperfusion-induced apoptosis and oxidative stress via the Sirt1/FoxO1 signaling pathway. Mol. Med. Rep. 2020, 22, 5399–5411. [Google Scholar] [CrossRef]
- Li, L.; Zhi, D.; Cheng, R.; Li, J.; Luo, C.; Li, H. The neuroprotective role of SIRT1/PGC-1alpha signaling in limb postconditioning in cerebral ischemia/reperfusion injury. Neurosci. Lett. 2021, 749, 135736. [Google Scholar] [CrossRef] [PubMed]
- Hang, W.; Shu, H.; Wen, Z.; Liu, J.; Jin, Z.; Shi, Z.; Chen, C.; Wang, D.W. N-Acetyl Cysteine Ameliorates High-Fat Diet-Induced Nonalcoholic Fatty Liver Disease and Intracellular Triglyceride Accumulation by Preserving Mitochondrial Function. Front. Pharmacol. 2021, 12, 636204. [Google Scholar] [CrossRef] [PubMed]
- Stoyas, C.A.; Bushart, D.D.; Switonski, P.M.; Ward, J.M.; Alaghatta, A.; Tang, M.B.; Niu, C.; Wadhwa, M.; Huang, H.; Savchenko, A.; et al. Nicotinamide Pathway-Dependent Sirt1 Activation Restores Calcium Homeostasis to Achieve Neuroprotection in Spinocerebellar Ataxia Type 7. Neuron 2020, 105, 630–644. [Google Scholar] [CrossRef]
- Song, S.B.; Park, J.S.; Jang, S.Y.; Hwang, E.S. Nicotinamide Treatment Facilitates Mitochondrial Fission Through Drp1 Activation Mediated by SIRT1-Induced Changes in Cellular Levels of cAMP and Ca2+. Cells 2021, 10, 612. [Google Scholar] [CrossRef] [PubMed]
- Zhang, J.; He, Z.; Fedorova, J.; Logan, C.; Bates, L.; Davitt, K.; Le, V.; Murphy, J.; Li, M.; Wang, M.; et al. Alterations in mitochondrial dynamics with age-related Sirtuin1/Sirtuin3 deficiency impair cardiomyocyte contractility. Aging Cell 2021, 20, e13419. [Google Scholar] [CrossRef] [PubMed]
- Solomon, J.M.; Pasupuleti, R.; Xu, L.; McDonagh, T.; Curtis, R.; DiStefano, P.S.; Huber, L.J. Inhibition of SIRT1 catalytic activity increases p53 acetylation but does not alter cell survival following DNA damage. Mol. Cell. Biol. 2006, 26, 28–38. [Google Scholar] [CrossRef]
- Napper, A.D.; Hixon, J.; McDonagh, T.; Keavey, K.; Pons, J.F.; Barker, J.; Yau, W.T.; Amouzegh, P.; Flegg, A.; Hamelin, E.; et al. Discovery of indoles as potent and selective inhibitors of the deacetylase SIRT1. J. Med. Chem. 2005, 48, 8045–8054. [Google Scholar] [CrossRef] [PubMed]
- Guo, H.; Ding, H.; Tang, X.; Liang, M.; Li, S.; Zhang, J.; Cao, J. Quercetin induces pro-apoptotic autophagy via SIRT1/AMPK signaling pathway in human lung cancer cell lines A549 and H1299 in vitro. Thorac. Cancer 2021, 12, 1415–1422. [Google Scholar] [CrossRef]
- Zinchuk, V.; Zinchuk, O. Quantitative colocalization analysis of confocal fluorescence microscopy images. Curr. Protoc. Cell Biol. 2008, 39, 4.19.1–4.19.16. [Google Scholar] [CrossRef] [PubMed]
- Valente, A.J.; Maddalena, L.A.; Robb, E.L.; Moradi, F.; Stuart, J.A. A simple ImageJ macro tool for analyzing mitochondrial network morphology in mammalian cell culture. Acta Histochem. 2017, 119, 315–326. [Google Scholar] [CrossRef]
- Michishita, E.; Park, J.Y.; Burneskis, J.M.; Barrett, J.C.; Horikawa, I. Evolutionarily conserved and nonconserved cellular localizations and functions of human SIRT proteins. Mol. Biol. Cell 2005, 16, 4623–4635. [Google Scholar] [CrossRef]
- Dai, S.H.; Chen, T.; Wang, Y.H.; Zhu, J.; Luo, P.; Rao, W.; Yang, Y.F.; Fei, Z.; Jiang, X.F. Sirt3 protects cortical neurons against oxidative stress via regulating mitochondrial Ca2+ and mitochondrial biogenesis. Int. J. Mol. Sci. 2014, 15, 14591–14609. [Google Scholar] [CrossRef]
- Cheng, A.; Yang, Y.; Zhou, Y.; Maharana, C.; Lu, D.; Peng, W.; Liu, Y.; Wan, R.; Marosi, K.; Misiak, M.; et al. Mitochondrial SIRT3 Mediates Adaptive Responses of Neurons to Exercise and Metabolic and Excitatory Challenges. Cell Metab. 2016, 23, 128–142. [Google Scholar] [CrossRef]
- Price, N.L.; Gomes, A.P.; Ling, A.J.; Duarte, F.V.; Martin-Montalvo, A.; North, B.J.; Agarwal, B.; Ye, L.; Ramadori, G.; Teodoro, J.S.; et al. SIRT1 is required for AMPK activation and the beneficial effects of resveratrol on mitochondrial function. Cell Metab. 2012, 15, 675–690. [Google Scholar] [CrossRef] [PubMed]
- Ou, X.; Lee, M.R.; Huang, X.; Messina-Graham, S.; Broxmeyer, H.E. SIRT1 positively regulates autophagy and mitochondria function in embryonic stem cells under oxidative stress. Stem Cells 2014, 32, 1183–1194. [Google Scholar] [CrossRef] [PubMed]
- Chen, M.; Liu, J.; Wu, W.; Guo, T.; Yuan, J.; Wu, Z.; Zheng, Z.; Zhao, Z.; Lin, Q.; Liu, N.; et al. SIRT1 restores mitochondrial structure and function in rats by activating SIRT3 after cerebral ischemia/reperfusion injury. Cell Biol. Toxicol. 2024, 40, 31. [Google Scholar] [CrossRef]
- Marques, P.; Burillo, J.; Gonzalez-Blanco, C.; Jimenez, B.; Garcia, G.; Garcia-Aguilar, A.; Iglesias-Fortes, S.; Lockwood, A.; Guillen, C. Regulation of TSC2 lysosome translocation and mitochondrial turnover by TSC2 acetylation status. Sci. Rep. 2024, 14, 12521. [Google Scholar] [CrossRef] [PubMed]
- Behera, B.P.; Mishra, S.R.; Mahapatra, K.K.; Patil, S.; Efferth, T.; Bhutia, S.K. SIRT1-activating butein inhibits arecoline-induced mitochondrial dysfunction through PGC1alpha and MTP18 in oral cancer. Phytomedicine 2024, 129, 155511. [Google Scholar] [CrossRef] [PubMed]
- Mallilankaraman, K.; Doonan, P.; Cardenas, C.; Chandramoorthy, H.C.; Muller, M.; Miller, R.; Hoffman, N.E.; Gandhirajan, R.K.; Molgo, J.; Birnbaum, M.J.; et al. MICU1 is an essential gatekeeper for MCU-mediated mitochondrial Ca2+ uptake that regulates cell survival. Cell 2012, 151, 630–644. [Google Scholar] [CrossRef]
- Gottschalk, B.; Malli, R.; Graier, W.F. MICU1 deficiency alters mitochondrial morphology and cytochrome C release. Cell Calcium 2023, 113, 102765. [Google Scholar] [CrossRef] [PubMed]
- Logan, C.V.; Szabadkai, G.; Sharpe, J.A.; Parry, D.A.; Torelli, S.; Childs, A.M.; Kriek, M.; Phadke, R.; Johnson, C.A.; Roberts, N.Y.; et al. Loss-of-function mutations in MICU1 cause a brain and muscle disorder linked to primary alterations in mitochondrial calcium signaling. Nat. Genet. 2014, 46, 188–193. [Google Scholar] [CrossRef]
- Debattisti, V.; Horn, A.; Singh, R.; Seifert, E.L.; Hogarth, M.W.; Mazala, D.A.; Huang, K.T.; Horvath, R.; Jaiswal, J.K.; Hajnoczky, G. Dysregulation of Mitochondrial Ca2+ Uptake and Sarcolemma Repair Underlie Muscle Weakness and Wasting in Patients and Mice Lacking MICU1. Cell Rep. 2019, 29, 1274–1286. [Google Scholar] [CrossRef] [PubMed]
- Xue, Q.; Pei, H.; Liu, Q.; Zhao, M.; Sun, J.; Gao, E.; Ma, X.; Tao, L. MICU1 protects against myocardial ischemia/reperfusion injury and its control by the importer receptor Tom70. Cell Death Dis. 2017, 8, e2923. [Google Scholar] [CrossRef] [PubMed]
- Seegren, P.V.; Harper, L.R.; Downs, T.K.; Zhao, X.Y.; Viswanathan, S.B.; Stremska, M.E.; Olson, R.J.; Kennedy, J.; Ewald, S.E.; Kumar, P.; et al. Reduced mitochondrial calcium uptake in macrophages is a major driver of inflammaging. Nat. Aging 2023, 3, 796–812. [Google Scholar] [CrossRef] [PubMed]
- Sun, Y.; Yang, Y.M.; Hu, Y.Y.; Ouyang, L.; Sun, Z.H.; Yin, X.F.; Li, N.; He, Q.Y.; Wang, Y. Inhibition of nuclear deacetylase Sirtuin-1 induces mitochondrial acetylation and calcium overload leading to cell death. Redox Biol. 2022, 53, 102334. [Google Scholar] [CrossRef] [PubMed]
- Jadiya, P.; Kolmetzky, D.W.; Tomar, D.; Di Meco, A.; Lombardi, A.A.; Lambert, J.P.; Luongo, T.S.; Ludtmann, M.H.; Pratico, D.; Elrod, J.W. Impaired mitochondrial calcium efflux contributes to disease progression in models of Alzheimer’s disease. Nat. Commun. 2019, 10, 3885. [Google Scholar] [CrossRef] [PubMed]
- Matteucci, A.; Patron, M.; Vecellio, R.D.; Gastaldello, S.; Amoroso, S.; Rizzuto, R.; Brini, M.; Raffaello, A.; Cali, T. Parkin-dependent regulation of the MCU complex component MICU1. Sci. Rep. 2018, 8, 14199. [Google Scholar] [CrossRef] [PubMed]
- Oliveira, J.M.; Chen, S.; Almeida, S.; Riley, R.; Goncalves, J.; Oliveira, C.R.; Hayden, M.R.; Nicholls, D.G.; Ellerby, L.M.; Rego, A.C. Mitochondrial-dependent Ca2+ handling in Huntington’s disease striatal cells: Effect of histone deacetylase inhibitors. J. Neurosci. 2006, 26, 11174–11186. [Google Scholar] [CrossRef]
- Singh, R.; Bartok, A.; Paillard, M.; Tyburski, A.; Elliott, M.; Hajnoczky, G. Uncontrolled mitochondrial calcium uptake underlies the pathogenesis of neurodegeneration in MICU1-deficient mice and patients. Sci. Adv. 2022, 8, eabj4716. [Google Scholar] [CrossRef]

Disclaimer/Publisher’s Note: The statements, opinions and data contained in all publications are solely those of the individual author(s) and contributor(s) and not of MDPI and/or the editor(s). MDPI and/or the editor(s) disclaim responsibility for any injury to people or property resulting from any ideas, methods, instructions or products referred to in the content. |
© 2025 by the authors. Licensee MDPI, Basel, Switzerland. This article is an open access article distributed under the terms and conditions of the Creative Commons Attribution (CC BY) license (https://creativecommons.org/licenses/by/4.0/).