Abstract
Objective: This study aimed to evaluate the association between the triglyceride–glucose index (TGI) and the risk of cardiovascular disease in patients with type 2 diabetes mellitus. Methods: This study included 1348 type 2 diabetic patients who attended the endocrinology clinic at Jordan University Hospital between March 2023 and September 2023. Medical records were reviewed to identify patients with documented cardiovascular disease, and the triglyceride–glucose index (TGI) was calculated for each patient. Results: Our results showed that the TGI was higher among patients who developed any major adverse cardiovascular event (MACE), coronary artery disease (CAD), congestive heart failure (CHF), and/or myocardial infarction (MI) compared to those who did not (p < 0.001 for all comparisons). Significantly higher TGI values in males were associated with higher odds of a MACE, stroke, and CHF; higher TGI values in females were associated with higher odds of a MACE, CAD, and MI. Higher TGI values in patients younger than 60 were associated with higher odds of a MACE, CAD, CHF, and MI, while in patients older than 60, higher TGI values were associated with higher odds of CAD and MI. The TGI value that was the most predictive of a MACE in our population was >9.36, >9.39 for CAD, and >9.40 and >9.39 for CHF and MI, respectively. Conclusion: The TGI was shown to be associated with a significantly higher risk of a MACE, CAD, CHF, and MI in the whole population, along with stroke in males only. The TGI was more strongly associated with MACEs in patients younger than 60 years compared to older patients. In conclusion, the TGI was associated with cardiovascular outcomes in this diabetic cohort; however, its discriminative ability was modest (AUC 0.55–0.64). This indicates that the TGI alone is insufficient as a predictive tool and should be interpreted alongside established risk factors. Prospective studies are needed to clarify its incremental value in risk prediction.
1. Introduction
Cardiovascular diseases (CVDs) are the leading cause of death globally, with an estimated 19.8 million people dying from CVDs in 2022, representing 32% of all global deaths [1]. Furthermore, findings from a comprehensive Global Burden of Disease study covering the years 1990 through 2019 revealed that the burden of CVD, in terms of DALYs (disability-adjusted life years) and deaths, continues to increase globally. The number of prevalent cases of total CVD nearly doubled, from 271 million in 1990 to 523 million in 2019. Additionally, CVD deaths consistently rose, from 12.1 million in 1990 to 18.6 million by 2019. Moreover, global trends for DALYs and years of life lost increased significantly, while years lived with disability doubled [2]. Hypertension, smoking, dyslipidemia, and diabetes are well-established risk factors for developing CVD [3]. Consequently, the early identification of individuals at elevated risk for developing cardiovascular disease is crucial to implement measures to reduce mortality rates and the prevalence of cardiovascular disease.
The triglyceride–glucose index (TGI) is a biomarker that combines fasting triglyceride and fasting glucose levels. Previous research has shown that it serves as an effective alternative measure for detecting insulin resistance (IR) due to its high sensitivity and specificity [4]. The TGI has also been demonstrated to effectively predict adverse clinical outcomes, including coronary artery disease (CAD) [5], heart failure [6], ischemic stroke [7], atherosclerosis [8], non-alcoholic fatty liver disease (NAFLD) [9], and hypertension [10]. While the TGI and its association with major adverse cardiovascular events (MACEs) have been extensively investigated in other regions, there is limited data from the Middle East, making our study the first to address this gap. Importantly, Middle Eastern populations differ from Western and Asian cohorts in the distribution of cardiometabolic comorbidities, genetic susceptibility, and lifestyle-related risk factors. For example, rising obesity prevalence has been well-documented in Middle Eastern and North African (MENA) countries [11], and metabolic syndrome (MetS) has been reported to be highly prevalent among Arabian populations [12]. These differences highlight the importance of investigating the relationship between the TGI and CVD in this unique regional context.
Glucose and lipid metabolism disorders are key drivers in the development of type 2 diabetes mellitus (T2DM) [13]. The TGI has also been shown to demonstrate a strong link to the onset of type 2 diabetes and its complications [4]. CVD accounts for nearly 18.6 million deaths annually. Diabetes is a major contributor to these deaths, underscoring its role in cardiovascular mortality [14]. Approximately 537 million people worldwide between the ages of 20 and 79 were estimated to have diabetes mellitus (DM) in 2021; estimates suggest that number will increase to 643 million by 2030 and 783 million by 2045 [15]. In Jordan, the prevalence of diabetes has shown a significant rising trend, increasing from 14.2% in 1994 to 32.4% by 2017, highlighting the growing burden of the disease in the country [16]. Given this global context and the unique risk factor profile of Middle Eastern populations, our study aims to explore, for the first time, the relationship between the TGI and the risk of cardiovascular disease in patients with diabetes in Jordan.
2. Methods
2.1. Study Design and Population
A cross-sectional study was conducted at a single tertiary care center, the outpatient endocrinology clinic at Jordan University Hospital (JUH), between March 2023 and September 2023. A total of 1414 T2DM patients, aged between 30 and 84 years, were initially considered for inclusion. Participants were enrolled regardless of the presence or absence of a history of cardiovascular events, including major adverse cardiovascular events (MACEs). All participants provided written informed consent prior to enrollment. Patients were excluded if they had a known advanced malignancy, incomplete clinical data (particularly data required to calculate the triglyceride–glucose index (TGI)), or if they declined consent. Based on these criteria, 66 patients were excluded, resulting in a final sample size of 1348 participants. The study protocol was reviewed and approved by the Institutional Review Board (IRB) of Jordan University Hospital (approval reference number: 10/2025/5593), and all procedures complied with the ethical standards.
2.2. Assessment of Triglyceride–Glucose Index
The TGI was computed using the following formula: (Ln [triglycerides (mg/dL) × fasting glucose (mg/dL)/2]) [17]. Both triglyceride and fasting glucose concentrations were determined via an enzymatic assay using an automated biochemistry analyzer (Atellica CI Analyzer, Siemens Healthineers AG, Forchheim, Germany) in our hospital’s central laboratory.
2.3. Assessment of Cardiovascular Risk
Cardiovascular risk assessment focused on identifying patients with a documented history of major cardiovascular (CV) comorbidities, including one or more of the following: myocardial infarction (MI), congestive heart failure (CHF), coronary artery disease (CAD), and stroke. For this study, these events were grouped as major adverse cardiovascular events (MACEs).
MI and CAD were defined based on cardiology-confirmed diagnoses, including electrocardiographic changes, elevation of cardiac biomarkers, and/or imaging evidence of coronary artery disease. CHF was defined via echocardiographic findings of reduced ejection fraction or a documented cardiology-confirmed diagnosis of heart failure. Stroke was confirmed via neurology documentation supported by CT or MRI findings.
Only cardiovascular events that occurred within the 10 years preceding enrollment (March 2013–September 2023) were considered.
All classifications relied on the electronic medical record (EMR) system at JUH, including physician notes, laboratory data, and imaging reports. Two trained clinical staff members independently reviewed records to minimize misclassification.
Stroke cases were recorded as a single category without distinction between ischemic and hemorrhagic subtypes, as this level of detail was inconsistently available in the EMRs.
Patients with a confirmed diagnosis of any of these conditions were classified as having a MACE and were included in the relevant subgroup analysis.
2.4. Assessment of Diabetes
DM was defined as either being on pharmacological treatment for diabetes mellitus or having a diagnosis with hemoglobin A1c ≥ 6.5%, fasting plasma glucose (FPG) ≥ 126 mg/dL, or a 2 h blood glucose ≥ 200 mg/dL, consistent with the American Diabetes Association guidelines [18].
2.5. Section of Covariates
Data on various demographic and health-related factors were collected through the medical record system at Jordan University Hospital by trained clinical staff. The collected covariates included age, gender, duration of diabetes, presence of diabetic complications (such as neuropathy, nephropathy, and retinopathy), smoking status, body weight, body mass index (BMI), and systolic and diastolic blood pressure. Laboratory measurements included hemoglobin A1c, serum creatinine, low-density lipoprotein cholesterol (LDL-C), high-density lipoprotein cholesterol (HDL-C), triglycerides, vitamin D, parathyroid hormone, serum calcium, serum phosphorus, albumin, alkaline phosphatase, and magnesium. Renal function was assessed using the estimated glomerular filtration rate (eGFR), calculated through the Chronic Kidney Disease Epidemiology Collaboration (CKD-EPI) and Modification of Diet in Renal Disease (MDRD) equations. Additionally, medication history was documented, including the use of anti-diabetic agents (metformin, insulin, and other oral hypoglycemics), aspirin, angiotensin receptor blockers (ARBs), angiotensin-converting enzyme inhibitors (ACEIs), statins, beta blockers, diuretics, calcium channel blockers (CCBs), and proton pump inhibitors (PPIs).
2.6. Statistical Analysis
Categorical variables were presented using counts and percentages, while continuous variables were presented using means and standard deviations. The Chi-square test and t-test were used to determine the association between categorical and continuous variables, respectively, and cardiovascular events.
Regression analysis was used to evaluate the association between the TGI and CV events while adjusting for confounding variables. The partially adjusted model included sex, age, body mass index, and smoking status. The fully adjusted model included the partially adjusted variables along with hypertension, creatinine, systolic and diastolic blood pressure, parathyroid hormone, calcium, albumin, HbA1c, low-density lipoprotein, high-density lipoprotein, insulin, aspirin, angiotensin receptor blockers, angiotensin-converting enzyme inhibitors, statins, beta blockers, diuretics, metformin, calcium channel blockers, proton pump inhibitors, and oral anti-diabetic medication. Analysis for Variance Inflation Factor (VIF) was performed to ensure the stability of the interpretation and associations derived from the fully adjusted model. VIF values were calculated and were all below 5, which was not concerning. Subsequent subgroup analysis was conducted according to sex (males vs. females) and age (<60 years vs. ≥60 years). False discovery rate (FDR) p-values were reported for subgroup analyses to correct for multiple comparisons. The odds ratio (OR) and its associated 95% confidence interval (95%-CI) were reported.
Receiver operating characteristics (ROC) analysis was used to determine the optimal cut-off points for the TGI. Sensitivity, specificity, and area under the curve (AUC) values were reported. IBM SPSS v.25 was used to conduct the analysis. A p-value < 0.050 was considered statistically significant for all analyses.
3. Results
3.1. Characteristics of Included Patients
A total of 1348 participants were included in the final analysis, of whom 22.2% had experienced a MACE (299/1348). A detailed look at those who had any MACE outcome reveals that 6.8% developed stroke, 10.8% developed CAD, 9.6% developed CHF, and 11.2% developed MI, as some individuals had more than one complication. Supplementary Table S1 demonstrates the characteristics of the included cohort. Table 1 demonstrates the characteristics of participants according to their MACE status. Males (31.02%) were more likely to develop a MACE compared to females (15.88%) (p < 0.001). Diabetes duration was higher among patients with a MACE compared to those who did not (p < 0.001). Smoking and hypertension were both associated with MACEs (p < 0.001). Higher average creatine (p = 0.012) and diastolic blood pressure (p < 0.001) were also significantly associated with MACEs. The average glomerular filtration rate was estimated using the MDRD and CKD-EPI equations, and scores were lower among patients with a MACE (p < 0.001). HbA1c (p = 0.001) and PTH (p = 0.008) were higher, while HDL (p < 0.001) and calcium (p = 0.001) were lower among patients with a MACE. Albumin (p < 0.001) was lower while alkaline phosphatase (p = 0.031) was higher among patients with a MACE. The use of insulin (p = 0.010), aspirin (p < 0.001), angiotensin-converting enzyme inhibitors (p = 0.002), statins (p = 0.002), beta blockers (p < 0.001), diuretics (p < 0.001), metformin (p < 0.001), calcium channel blockers (p = 0.001), and proton pump inhibitors (p < 0.001) was higher among patients with a MACE.

Table 1.
Characteristics of the included patients according to their MACE status.
Supplementary Tables S1–S4 demonstrate the distribution of the patients’ characteristics according to MACE components: stroke, CAD, CHF, and MI, respectively.
3.2. Triglyceride–Glucose Index and Cardiovascular Events
T-test analysis demonstrated that the TGI was higher among patients who developed a MACE, CAD, CHF, or MI compared to those who did not (p < 0.001 for all comparisons). There was no difference in the TGI between patients with and without stroke (p = 0.106) (Table 2).
Table 2.
The association between the TGI and cardiovascular events.
The unadjusted model (Table 3) demonstrated that a higher TGI was associated with higher odds of a MACE (OR = 1.80; 95%CI: 1.48–2.19), CAD (OR = 2.01; 95%CI: 1.56–2.60), CHF (OR = 1.66; 95%CI: 1.27–2.17), and MI (OR = 2.09; 95%CI: 1.63–2.69). Partially and fully adjusted models also showed significant associations between a higher TGI and a MACE, CAD, CHF, or MI.
Table 3.
Regression analysis of the association between the TGI and cardiovascular events.
Analysis per quartiles demonstrated that the third and fourth quartiles were associated with higher odds of a MACE compared to the first quartile in the unadjusted model. Similar results were obtained among the components of MACEs, including CAD, CHF, and MI. Table 4 demonstrates the detailed results of this analysis.
Table 4.
Regression analysis for the association between TG-Glu index per quartile and MACE.
3.3. Triglyceride–Glucose Index Performance
ROC analysis demonstrated that TGI AUC for MACE was the highest using a cut-off > 9.36 (Figure 1A: AUC = 0.61, p < 0.001). the TGI AUC for CAD was the highest using a cut-off > 9.39 (Figure 1B: AUC = 0.63, p < 0.001). The cut-off points that achieved the highest performance for CHF (Figure 1C: AUC = 0.60, p < 0.001) and MI (Figure 1D: AUC = 0.64, p < 0.001) were >9.40 and >9.39, respectively. The sensitivity, specificity, and AUC values are described in detail in Table 5.
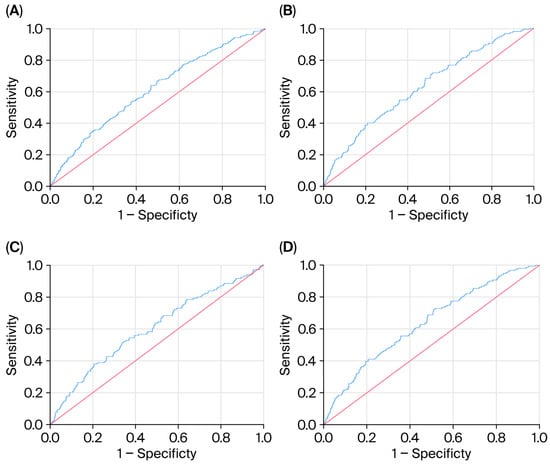
Figure 1.
(A–D) ROC analysis for highest TGI AUC for MACE.
Table 5.
ROC analysis results.
3.4. Subgroup Analysis
Subgroup analysis among males demonstrated that a higher TG-Glu index was associated with higher odds of a MACE (OR = 2.57; 95%CI: 1.29–5.12), stroke (OR = 2.47; 95%CI: 1.08–5.65), and CHF (OR = 3.06; 95%CI: 1.30–3.86). After correction for multiple comparisons, the TG-Glu index remained associated with MACEs (FDR-p = 0.031) and CHF (FDR-p = 0.046). In contrast, subgroup analysis among females demonstrated that a higher TG-Glu index was associated with higher odds of a MACE (OR = 1.98; 95%CI: 1.43–2.53), CAD (OR = 3.44; 95%CI: 2.62–4.26), and MI (OR = 4.21; 95%CI: 3.39–5.03). After correction for multiple comparisons, the TG-Glu index remained associated with the same outcomes.
Subgroup analysis among patients younger than 60 demonstrated that a higher TG-Glu index was associated with higher odds of a MACE (OR = 3.52; 95%CI: 2.58–4.46), CAD (OR = 5.28; 95%CI: 3.89–6.67), CHF (OR = 4.27; 95%CI: 2.95–5.65), and MI (OR = 7.26; 95%CI: 5.83–8.69). After correction for multiple comparisons, the TG-Glu index remained associated with CAD (FDR-p = 0.042) and MI (FDR-p = 0.033).
Among patients older than 60, a higher TG-Glu index was associated with higher odds of CAD (OR = 1.91; 95%CI: 1.30–2.52) and MI (OR = 1.82; 95%CI: 1.23–2.41). After correction for multiple comparisons, the TG-Glu index was not associated with any of the aforementioned outcomes. These subgroup findings should be considered exploratory and interpreted with caution. they serve as hypothesis-generating results that require validation in future prospective cohorts.
Table 6 demonstrates the detailed results of subgroup analysis according to age and sex.
Table 6.
Regression analysis of the association between the TGI and cardiovascular events according to gender and age *.
4. Discussion
The prevalence of metabolic syndrome in Jordan remains alarmingly high, as previously documented by Obeidat et al. [19]. Furthermore, data from the PACT-MEA study reported a substantial burden of atherosclerotic cardiovascular disease (ASCVD) among patients with type 2 diabetes in Jordan [20]. Given the well-established relationship between diabetes and cardiovascular disease (CVD), there is a growing need for simple and effective biomarkers to better stratify cardiovascular risk in diabetic populations.
Our data showed that the TGI was significantly higher in patients who developed major adverse cardiovascular events (MACEs) compared to those who did not, which is consistent with previous work [4,5,6,7,8]. We further analyzed the association of the index and its utility in different age, gender groups, and in individual MACE variables.
4.1. TG Index and Age
In our cohort, higher triglyceride–glucose index (TGI) values were observed among both younger (<60 years) and older (≥60 years) participants with major adverse cardiovascular events (MACEs), with stronger associations noted in the younger group (OR = 3.52 vs. 1.53). Baseline characteristics may partly explain this pattern: younger adults had higher HbA1c (7.91 ± 1.72 vs. 7.54 ± 1.46%), a greater prevalence of current smoking (22.6% vs. 12.5%, p < 0.001), and slightly lower HDL (44.1 ± 21.2 vs. 45.7 ± 19.9 mg/dL). ROC analysis also suggested that thresholds above 9.36 were linked with a MACE, although discriminative performance was modest (AUC 0.60–0.64).
Comparable trends have been described in other populations. An Iranian study reported stronger associations between the TGI and CVD incidence in younger adults [21]. U.S. data have similarly indicated that the TGI is linearly related to mortality risk in younger cohorts, whereas in older individuals, the association appeared weaker or U-shaped [22,23,24].
Overall, these findings suggest that age may influence how the TGI relates to cardiovascular outcomes, with younger patients showing more consistent patterns of association. However, the observed links remain modest, and in older adults, the relationship is less clear. Given the cross-sectional nature of our study, these results should be interpreted cautiously and validated in prospective settings before being considered for clinical application.
4.2. TG Index and Gender
In our fully adjusted sex-stratified models, a higher TGI remained associated with major adverse cardiovascular events (MACEs) and congestive heart failure (CHF) among men (false discovery rate p = 0.031 and 0.046, respectively), and with MACEs, coronary artery disease (CAD), and myocardial infarction (MI) among women (FDR p = 0.044, 0.015, and 0.006, respectively).
To contextualize these findings, our cohort data revealed that women had a substantially higher BMI compared to men (34.3 vs. 30.8 kg/m2), whereas age and diabetes duration were nearly identical between the two groups. In a large Thai cohort of type 2 diabetes patients, Lertsakulbunlue et al. [25] found that the TGI was significantly associated with predicted 10-year cardiovascular risk among both males and females, with very similar effect sizes and modest discriminative ability (AUC ≈ 0.57) between sexes. This aligns with our observation that the TGI is associated with CVD outcomes in both sexes. However, our results should be interpreted with caution as they are exploratory in nature and require validation in future prospective studies.
4.3. TG Index and Heart Failure
In our diabetic cohort, patients who experienced congestive heart failure (CHF) had significantly higher TGI values compared to those without CHF (mean: 9.52 vs. 9.29; p < 0.001). In unadjusted and partially adjusted models, this association persisted; however, after full adjustment for age, sex, BMI, hypertension, HbA1c, creatinine, and lipid parameters, the relationship attenuated and was no longer statistically significant (p = 0.076). This suggests that while the TGI may be related to CHF risk, the association in our cohort is less stable and may have been influenced by confounding and limited statistical power.
Our findings are directionally consistent with a recent analysis of U.S. National Health and Nutrition Examination Survey (NHANES) data (2007–2018), which reported a significant independent association between a higher TGI and incident heart failure in the general population [26]. Mechanistically, insulin resistance has been implicated in pathways contributing to heart failure, including chronic hyperinsulinemia, impaired glucose utilization, dyslipidemia, and myocardial fibrosis, all of which may predispose individuals to CHF in high-risk groups [27]. Validation in larger diabetic cohorts is needed to clarify whether the TGI independently predicts CHF risk after full covariate adjustment.
4.4. TG Index and Stroke Risk: Focus on Ischemic Stroke
Our data did not demonstrate a statistically significant association between a higher TGI and stroke incidence. Although patients with stroke exhibited slightly elevated TGI values (mean: 9.42 ± 0.65) compared to those without stroke (mean: 9.30 ± 0.67), this difference did not reach significance (p = 0.106). Similar results were observed across our partially and fully adjusted models. It is important to note that our analysis grouped both ischemic and hemorrhagic stroke subtypes together, which may have attenuated any potential associations.
Several studies with large cohorts, such as the Kailuan Study, a study on rural Chinese populations, the ARIC Study, and meta-analyses [28,29,30,31,32] have reported a positive association between the TGI and ischemic stroke, but not hemorrhagic stroke. Our lack of significant findings could be due to the absence of subgroup analyses by stroke subtype and the relatively low number of stroke events within our cohort.
4.5. Optimal Cut-Off Value of TG Index for Predicting CV Events and Global Perspective
Our data showed that the TGI threshold most strongly associated with the risk of developing a MACE in patients with type 2 diabetes was >9.36, based on ROC analysis (AUC = 0.61). Similarly, the optimal cut-off values were >9.39 for both CAD and MI, and >9.40 for CHF. These relatively high thresholds may reflect the greater metabolic burden among diabetic patients. Despite Jordan’s high burden of CVD and diabetes, no published studies to date have examined TGI performance in Jordanian or Middle Eastern cohorts, highlighting a key research gap that our study begins to address.
Comparable thresholds have been reported in studies on similar populations. For example, Wang et al. identified a cut-off of 9.323 for predicting 3-year MACEs in diabetic patients with acute coronary syndrome [33]. In contrast, Zhu et al. reported a lower threshold of 8.83 in diabetic patients’ post-percutaneous coronary intervention (PCI), yielding higher sensitivity but lower specificity [34]. On the other hand, the Brazilian PROCARDIO-UFV Study identified a lower cut-off of 9.04 for predicting intermediate/high cardiovascular risk in adults with cardiometabolic features [35]. Similarly, in the Spanish VMCUN cohort, increased cardiovascular risk was observed at TGI levels corresponding to the fourth and fifth quintiles, which translated to a lower average threshold compared to ours [36].
Meanwhile, in Italy, elevated TGI values were linked to increased carotid intima-media thickness in primary prevention populations, although associations with plaque formation varied [37].
Data from Sweden suggest that higher TGI values are associated with increased arterial stiffness—measured by carotid–femoral pulse wave velocity—and are predictive of elevated cardiovascular risk, including cardiovascular mortality. In two large prospective cohorts (Malmö Diet and Cancer Study–Cardiovascular Cohort and Malmö Preventive Project), participants in the highest TGI quartile faced a 37% greater risk of cardiovascular death compared to the lowest quartile (HR 1.37, 95%CI: 1.26–1.49) [38].
Limited data is available from the Middle East. The Tehran Lipid and Glucose Study in Iran concluded that a higher TGI is significantly associated with increased risk of CVD/CHD incidence; this association was more prominent among the younger population [18].
In Asia, an Eastern Chinese cohort showed that the TGI significantly improved long-term CVD risk prediction compared to traditional models, particularly among patients in the highest quartile [28]. Though not directly comparable, Korean pediatric studies linked the TGI to early metabolic abnormalities; however, adult studies in Korea align more closely with diabetes-driven cardiovascular outcomes [39,40].
These differences may reflect population-specific factors, including the prevalence of type 2 diabetes, background cardiovascular risk, and metabolic profile. Moreover, the relatively higher thresholds we observed compared to Asian and Latin American cohorts [33,34,35] may be attributable to earlier diabetes onset, higher obesity rates, and adverse lipid profiles characteristic of Jordanian populations [17,18]. Our findings reinforce the notion that cut-off values derived from non-Middle Eastern or non-diabetic cohorts may underestimate cardiovascular risk in diabetic populations from regions with a high metabolic burden.
Collectively, these results underscore the importance of generating locally derived data and establishing regionally calibrated thresholds prior to clinical adoption, particularly in underrepresented regions like the Middle East and North Africa. It should be mentioned, however, that the cut-off values reported in our study are still exploratory and not validated yet for clinical application at this time, as more local and regional data are needed.
4.6. Addressing the Middle Eastern Evidence Gap
Our study provides one of the first large-scale assessments of the TGI in a Middle Eastern diabetic population, helping to address a critical regional research gap. Moreover, this study is novel as it provides locally derived TGI cut-off values and evaluates age- and sex-specific associations in a Middle Eastern cohort, offering insights not previously reported in other populations.
Furthermore, our suggested optimal TGI cut-off for MACE association likely reflects the elevated cardiometabolic burden in Jordanian populations. The interaction between the TGI and locally prevalent risk factors, such as high smoking rates and low HDL-C levels, may amplify the index’s association value beyond insulin resistance alone.
From a health systems perspective, the TGI offers a low-cost, easily calculated screening tool (AUC = 0.61–0.64 for CVD outcomes in our study) that can be easily implemented in resource-limited Jordanian clinics. Its integration into national guidelines could improve early cardiovascular risk detection among high-risk diabetic patients, aligning with the World Health Organization (WHO) recommendations for low- and middle-income countries [41].
Our study also lays the groundwork for broader application in the MENA region. Given the similarity in metabolic risk profiles across countries like Saudi Arabia and Egypt, these findings may inform regional screening strategies and stimulate further validation studies in Arab populations. While these results contribute valuable regional evidence, the cross-sectional design limits causal inference due to a lack of temporality and potential reverse causation, highlighting the need for regional prospective validation studies.
5. Conclusions
Cardiovascular disease remains a pressing global health challenge, with diabetes and prediabetes markedly increasing its risks. The triglyceride–glucose index (TGI) is an accessible surrogate for insulin resistance that has shown associations with cardiovascular outcomes in our Jordanian cohort of adults with T2DM. Importantly, while the TGI was significantly associated with MACEs, CAD, MI, and CHF in unadjusted and partially adjusted models, its discriminative performance was modest (AUC 0.55–0.64). This likely reflects the multifactorial nature of cardiovascular disease and the fact that TGI captures only one aspect of metabolic risk. Accordingly, the TGI should be considered a supportive rather than a standalone tool, with potential value when combined with traditional risk factors in multivariable risk models.
The concerning rise in diabetes and CVD prevalence in Jordan and the broader region underscores the urgent need for locally driven research. By providing cohort-specific evidence on the relationship between the TGI and CVD in Jordanian adults with T2DM, this study contributes to clarifying an important knowledge gap and may help guide targeted strategies to reduce cardiovascular complications in high-risk populations. Prospective studies are needed to validate these findings and assess the incremental predictive and clinical utility, and the optimal cut-off values of the TGI in regional and global contexts.
Supplementary Materials
The following supporting information can be downloaded at: https://www.mdpi.com/article/10.3390/life15101519/s1, Table S1: Characteristics of the included patients according to their stroke status; Table S2: Characteristics of the included patients according to their CAD status; Table S3: Characteristics of the included patients according to their CHF status; Table S4: Characteristics of the included patients according to their MI status.
Author Contributions
Conceptualization, M.S.M. and D.S.; methodology, K.S.M. and D.S.; software, A.T.; validation, M.S.M. and Z.S.; formal analysis, A.T.; investigation, M.S.M., D.S., R.D., O.R.A. and Y.M.M.; resources, M.S.M.; data curation, M.S.M. and A.T.; writing—original draft preparation, Z.S., D.S., R.D., K.S.M., A.T., Y.M.M. and O.R.A.; writing—review and editing, M.S.M., Z.S. and Y.M.M.; visualization, M.S.M. and D.S.; supervision, M.S.M.; project administration, M.S.M.; funding acquisition, M.S.M. All authors have read and agreed to the published version of the manuscript.
Funding
This research was funded by the University of Jordan, Deanship of Scientific Research.
Institutional Review Board Statement
The study was conducted in accordance with the Declaration of Helsinki, the study protocol was reviewed and approved by the Institutional Review Board (IRB) of Jordan University Hospital (Approval reference number: 10/2025/5593, dated 26 February 2025), and all procedures complied with the ethical standards.
Informed Consent Statement
Informed consent was obtained from all subjects involved in this study.
Data Availability Statement
The data presented in this study are available on request from the corresponding author due to privacy and legal reasons.
Acknowledgments
The authors appreciate the administrative support of Nuha Suleiman from the internal medicine department office for her help.
Conflicts of Interest
The authors declare no conflicts of interest.
Abbreviations
MACE: Major Adverse Cardiovascular Event, CAD: Coronary Artery Disease, CHF: Congestive Heart Failure, MI: Myocardial Infarction.
References
- World Health Organization. Cardiovascular Diseases (CVDs) Fact Sheet. 2022. Available online: https://www.who.int/news-room/fact-sheets/detail/cardiovascular-diseases-(cvds) (accessed on 27 June 2025).
- Roth, G.A.; Mensah, G.A.; Johnson, C.O.; Addolorato, G.; Ammirati, E.; Baddour, L.M.; Barengo, N.C.; Beaton, A.Z.; Benjamin, E.J.; Benziger, C.P.; et al. Global Burden of Cardiovascular Diseases and Risk Factors, 1990–2019: Update from the GBD 2019 Study. J. Am. Coll. Cardiol. 2020, 76, 2982–3021. [Google Scholar] [CrossRef]
- National Health Service. Cardiovascular Disease. NHS 2017. Available online: https://www.nhs.uk/conditions/cardiovascular-disease/ (accessed on 27 June 2025).
- Sun, Y.; Ji, H.; Sun, W.; An, X.; Lian, F. Triglyceride–Glucose (TyG) Index: A Promising Biomarker for Diagnosis and Treatment of Different Diseases. Eur. J. Intern. Med. 2025, 131, 3–14. [Google Scholar] [CrossRef]
- Liang, S.; Wang, C.; Zhang, J.; Liu, Z.; Bai, Y.; Chen, Z.; Huang, H.; He, Y. Triglyceride–Glucose Index and Coronary Artery Disease: A Systematic Review and Meta-Analysis of Risk, Severity, and Prognosis. Cardiovasc. Diabetol. 2023, 22, 170. [Google Scholar] [CrossRef]
- Huang, R.; Wang, Z.; Chen, J.; Bao, X.; Xu, N.; Guo, S.; Gu, R.; Wang, W.; Wei, Z.; Wang, L. Prognostic Value of Triglyceride–Glucose (TyG) Index in Patients with Acute Decompensated Heart Failure. Cardiovasc. Diabetol. 2022, 21, 88. [Google Scholar] [CrossRef] [PubMed]
- Huang, Z.; Ding, X.; Yue, Q.; Wang, X.; Chen, Z.; Cai, Z.; Li, W.; Cai, Z.; Chen, G.; Lan, Y.; et al. Triglyceride–Glucose Index Trajectory and Stroke Incidence in Patients with Hypertension: A Prospective Cohort Study. Cardiovasc. Diabetol. 2022, 21, 141. [Google Scholar] [CrossRef] [PubMed]
- Lu, Y.W.; Chang, C.C.; Chou, R.H.; Tsai, Y.L.; Liu, L.K.; Chen, L.K.; Huang, P.-H.; Lin, S.-J. Gender Difference in the Association between TyG Index and Subclinical Atherosclerosis: Results from the I-Lan Longitudinal Aging Study. Cardiovasc. Diabetol. 2021, 20, 206. [Google Scholar] [CrossRef] [PubMed]
- Rivière, B.; Jaussent, A.; Macioce, V.; Faure, S.; Builles, N.; Lefebvre, P.; Géraud, P.; Picot, M.-C.; Rebuffat, S.; Renard, E.; et al. The Triglycerides and Glucose (TyG) Index: A New Marker Associated with Nonalcoholic Steatohepatitis (NASH) in Obese Patients. Diabetes Metab. 2022, 48, 101345. [Google Scholar] [CrossRef]
- Yang, C.; Song, Y.; Wang, X.; Yang, Y.; Zhou, Y.; Wang, D.; Hou, J.; Wang, P. Association of Hypertension with the Triglyceride–Glucose Index and Its Associated Indices in the Chinese Population: A 6-Year Prospective Cohort Study. J. Clin. Hypertens. 2024, 26, 53–62. [Google Scholar] [CrossRef]
- Nikoloski, Z. Obesity in Middle East. In Metabolic Syndrome; Springer: Cham, Switzerland, 2023; pp. 1–16. [Google Scholar]
- Afshin, A.; Forouzanfar, M.H.; Reitsma, M.B.; Sur, P.; Estep, K.; Lee, A.; Marczak, L.; Mokdad, A.H.; Moradi-Lakeh, M.; Naghavi, M.; et al. Health Effects of Overweight and Obesity in 195 Countries over 25 Years. N. Engl. J. Med. 2017, 377, 13–27. [Google Scholar]
- Song, G.; Zhang, Y.; Jiang, Y.; Zhang, H.; Gu, W.; Xu, X.; Yao, J.; Chen, Z. Circular RNA PIP5K1A Promotes Glucose and Lipid Metabolism Disorders and Inflammation in Type 2 Diabetes Mellitus. Mol. Biotechnol. 2024, 66, 3549–3558. [Google Scholar] [CrossRef]
- Wu, S.; Xu, W.; Guan, C.; Lv, M.; Jiang, S.; Jinhua, Z. Global Burden of Cardiovascular Disease Attributable to Metabolic Risk Factors, 1990–2019: An Analysis of Observational Data from a 2019 Global Burden of Disease Study. BMJ Open 2023, 13, e069397. [Google Scholar] [CrossRef]
- Sun, H.; Saeedi, P.; Karuranga, S.; Pinkepank, M.; Ogurtsova, K.; Duncan, B.B.; Stein, C.; Basit, A.; Chan, J.C.; Mbanya, J.C.; et al. IDF Diabetes Atlas: Global, Regional and Country-Level Diabetes Prevalence Estimates for 2021 and Projections for 2045. Diabetes Res. Clin. Pract. 2022, 183, 109119. [Google Scholar] [CrossRef] [PubMed]
- Ajlouni, K.; Batieha, A.; Jaddou, H.; Khader, Y.; Abdo, N.; El-Khateeb, M.; Hyassat, D.; Al-Louzi, D. Time Trends in Diabetes Mellitus in Jordan between 1994 and 2017. Diabet. Med. 2019, 36, 1176–1182. [Google Scholar] [CrossRef]
- Low, S.; Khoo, K.C.J.; Irwan, B.; Sum, C.F.; Subramaniam, T.; Lim, S.C.; Wong, T.K.M. Triglyceride–Glucose Index in the Development of Type 2 Diabetes Mellitus. Diabetes Res. Clin. Pract. 2018, 143, 43–49. [Google Scholar] [CrossRef] [PubMed]
- American Diabetes Association Professional Practice Committee. 2. Diagnosis and Classification of Diabetes: Standards of Care in Diabetes—2025. Diabetes Care 2025, 48 (Suppl. 1), S27–S49. [Google Scholar] [CrossRef]
- Obeidat, A.A.; Ahmad, M.N.; Haddad, F.H.; Azzeh, F.S. Alarming High Prevalence of Metabolic Syndrome among Jordanian Adults. Pak. J. Med. Sci. 2015, 31, 1377–1382. [Google Scholar] [CrossRef] [PubMed]
- Haddad, J.A.; Annabi, F.O.A.; Abbasi, H.; AlSamen, M.A.A.; Ammari, F.L.; Haddad, F.H.; Haddad, S.E.; Jaradat, M.; Khassawneh, A.; Khatib, N.; et al. The Prevalence of Atherosclerotic Cardiovascular Disease in Patients with Type 2 Diabetes in Jordan: The PACT-MEA Study. Diabetes Ther. 2025, 16, 899–913. [Google Scholar] [CrossRef]
- Barzegar, N.; Tohidi, M.; Hasheminia, M.; Azizi, F.; Hadaegh, F. The Impact of Triglyceride–Glucose Index on Incident Cardiovascular Events during 16 Years of Follow-Up: Tehran Lipid and Glucose Study. Cardiovasc. Diabetol. 2020, 19, 155. [Google Scholar] [CrossRef]
- Zhao, M.; Xiao, M.; Tan, Q.; Lu, F. Triglyceride–Glucose Index as a Predictor of Mortality in Middle-Aged and Elderly Patients with Type 2 Diabetes in the US. Sci. Rep. 2023, 13, 16478. [Google Scholar] [CrossRef]
- Dang, K.; Wang, X.; Hu, J.; Zhang, Y.; Cheng, L.; Qi, X.; Liu, L.; Ming, Z.; Tao, X.; Li, Y. The Association between Triglyceride–Glucose Index and Its Combination with Obesity Indicators and Cardiovascular Disease: NHANES 2003–2018. Cardiovasc. Diabetol. 2024, 23, 8. [Google Scholar] [CrossRef]
- Cui, C.; Qi, Y.; Song, J.; Shang, X.; Han, T.; Han, N.; Yue, S.; Zha, Y.; Xu, Z.; Li, J.; et al. Comparison of Triglyceride–Glucose Index and Modified Triglyceride–Glucose Indices in Prediction of Cardiovascular Diseases in Middle Aged and Older Chinese Adults. Cardiovasc. Diabetol. 2024, 23, 185. [Google Scholar] [CrossRef]
- Lertsakulbunlue, P.; Sobhonslidsuk, A.; Charoensuk, K.; Kanjanahattakij, N.; Nathisuwan, S. Trends in Baseline Triglyceride–Glucose Index and Association with Predicted 10-Year Cardiovascular Disease Risk among Type 2 Diabetes Patients in Thailand. Sci. Rep. 2023, 13, 13819. [Google Scholar] [CrossRef]
- Zhang, F.; Hou, X. Association between the Triglyceride–Glucose Index and Heart Failure: Analysis of NHANES 2007–2018. Front. Endocrinol. 2023, 14, 1322445. [Google Scholar] [CrossRef]
- Aroor, A.R.; Mandavia, C.; Sowers, J.R. Insulin Resistance and Heart Failure: Molecular Mechanisms. Heart Fail. Clin. 2012, 8, 609–617. [Google Scholar] [CrossRef]
- Wang, A.; Wang, G.; Liu, Q.; Zuo, Y.; Chen, S.; Tao, B.; Tian, X.; Wang, P.; Meng, X.; Wu, S.; et al. Triglyceride–Glucose Index and the Risk of Stroke and Its Subtypes in the General Population: An 11-Year Follow-Up. Cardiovasc. Diabetol. 2021, 20, 46. [Google Scholar] [CrossRef]
- Li, X.; Hao, J.; Han, Q.; Wang, D.; Lu, Y.; Tu, J.; Wang, L.; Wang, J.; Ning, X.; Yang, C.; et al. Triglyceride–Glucose Index Prediction of Stroke Incidence Risk in Low-Income Chinese Population: A 10-Year Prospective Cohort Study. Front. Endocrinol. 2024, 15, 1444030. [Google Scholar] [CrossRef]
- Wang, X.; Liu, Q.; Wang, T.; Tian, W.; Chen, X.; Zhang, J.; Li, Q.; Ma, D.; Zhao, L.; Chen, Z.; et al. Triglyceride–Glucose Index and the Risk of Stroke in American Adults: Findings from the Atherosclerosis Risk in Communities Study. Diabetol. Metab. Syndr. 2023, 15, 187. [Google Scholar] [CrossRef] [PubMed]
- Liao, C.; Xu, H.; Jin, T.; Xu, K.; Xu, Z.; Zhu, L.; Liu, M. Triglyceride–Glucose Index and the Incidence of Stroke: A Meta-Analysis of Cohort Studies. Front. Neurol. 2023, 13, 1033385. [Google Scholar] [CrossRef]
- Wu, M.; Li, C.; Yu, Y.; Zeng, L.; Qiu, Y.; Liu, J.; Yang, F.; Han, Y. Association between the triglyceride-glucose (TyG) index and stroke risk in Chinese normal-weight adults: A population-based study. Diabetol. Metab. Syndr. 2024, 16, 176. [Google Scholar] [CrossRef] [PubMed]
- Wang, L.; Cong, H.L.; Zhang, J.X.; Hu, Y.-C.; Wei, A.; Zhang, Y.-Y.; Yang, H.; Ren, L.-B.; Qi, W.; Li, W.-Y.; et al. Triglyceride–Glucose Index Predicts Adverse Cardiovascular Events in Patients with Diabetes and Acute Coronary Syndrome. Cardiovasc. Diabetol. 2020, 19, 80. [Google Scholar] [CrossRef] [PubMed]
- Tao, S.; Yu, L.; Li, J.; Xie, Z.; Huang, L.; Yang, D. Prognostic Value of Triglyceride–Glucose Index in Patients with Chronic Coronary Syndrome Undergoing Percutaneous Coronary Intervention. Cardiovasc. Diabetol. 2023, 22, 322. [Google Scholar] [CrossRef]
- Da Silva, A.P.S.; Caldas, A.P.S.; Hermsdorff, H.H.M.; Bersch-Ferreira, Â.C.; Torreglosa, C.R.; Weber, B.; Bressan, J. TyG Index Predicts Intermediate/High Cardiovascular Risk in Adults with Cardiometabolic Features: A PROCARDIO-UFV Trial. Nutr. Sci. 2022, 10, 51. [Google Scholar]
- Sánchez-Íñigo, L.; Navarro-González, D.; Fernández-Montero, A.; Pastrana-Delgado, J.; Martínez, J.A.; VMCUN Cohort Investigators. The TyG Index Predicts Development of Cardiovascular Events: A 10-Year Prospective Study. Eur. J. Clin. Investig. 2016, 46, 189–197. [Google Scholar] [CrossRef]
- Pavanello, C.; Ruscica, M.; Castiglione, S.; Mombelli, G.G.; Alberti, A.; Calabresi, L.; Sirtori, C.R. Triglyceride–Glucose Index: Carotid Intima-Media Thickness and Cardiovascular Risk in a European Population. Cardiovasc. Diabetol. 2025, 24, 17. [Google Scholar] [CrossRef]
- Muhammad, I.F.; Bao, X.; Nilsson, P.M.; Zaigham, S. Triglyceride–Glucose (TyG) Index Is a Predictor of Arterial Stiffness, Incidence of Diabetes, Cardiovascular Disease, and All-Cause and Cardiovascular Mortality: A Longitudinal Two-Cohort Analysis. Front. Cardiovasc. Med. 2023, 9, 1035105. [Google Scholar] [CrossRef] [PubMed]
- Yoon, J.S.; Shim, Y.S.; Lee, H.S.; Hwang, I.T.; Hwang, J.S. A Population-Based Study of TyG Index Distribution and Its Relationship to Cardiometabolic Risk Factors in Children and Adolescents. Sci. Rep. 2021, 11, 23660. [Google Scholar] [CrossRef] [PubMed]
- Moon, S.; Park, J.S.; Ahn, Y. The Cut-Off Values of Triglycerides and Glucose Index for Metabolic Syndrome in American and Korean Adolescents. J. Korean Med. Sci. 2017, 32, 427–433. [Google Scholar] [CrossRef]
- Marcus, M.E.; Manne-Goehler, J.; Theilmann, M.; Farzadfar, F.; Moghaddam, S.S.; Keykhaei, M.; Hajebi, A.; Tschida, S.; Lemp, J.M.; Aryal, K.K.; et al. Use of Statins for the Prevention of Cardiovascular Disease in 41 Low-Income and Middle-Income Countries: A Cross-Sectional Study of Nationally Representative, Individual-Level Data. Lancet Glob. Health 2022, 10, e369–e379. [Google Scholar] [CrossRef] [PubMed]
Disclaimer/Publisher’s Note: The statements, opinions and data contained in all publications are solely those of the individual author(s) and contributor(s) and not of MDPI and/or the editor(s). MDPI and/or the editor(s) disclaim responsibility for any injury to people or property resulting from any ideas, methods, instructions or products referred to in the content. |
© 2025 by the authors. Licensee MDPI, Basel, Switzerland. This article is an open access article distributed under the terms and conditions of the Creative Commons Attribution (CC BY) license (https://creativecommons.org/licenses/by/4.0/).