
Ventilation-Based Strategy to Manage Intraoperative Aerosol Viral Transmission in the Era of SARS-CoV-2

 , , ,
, , , 
Abstract
1. Introduction
2. Materials and Methods
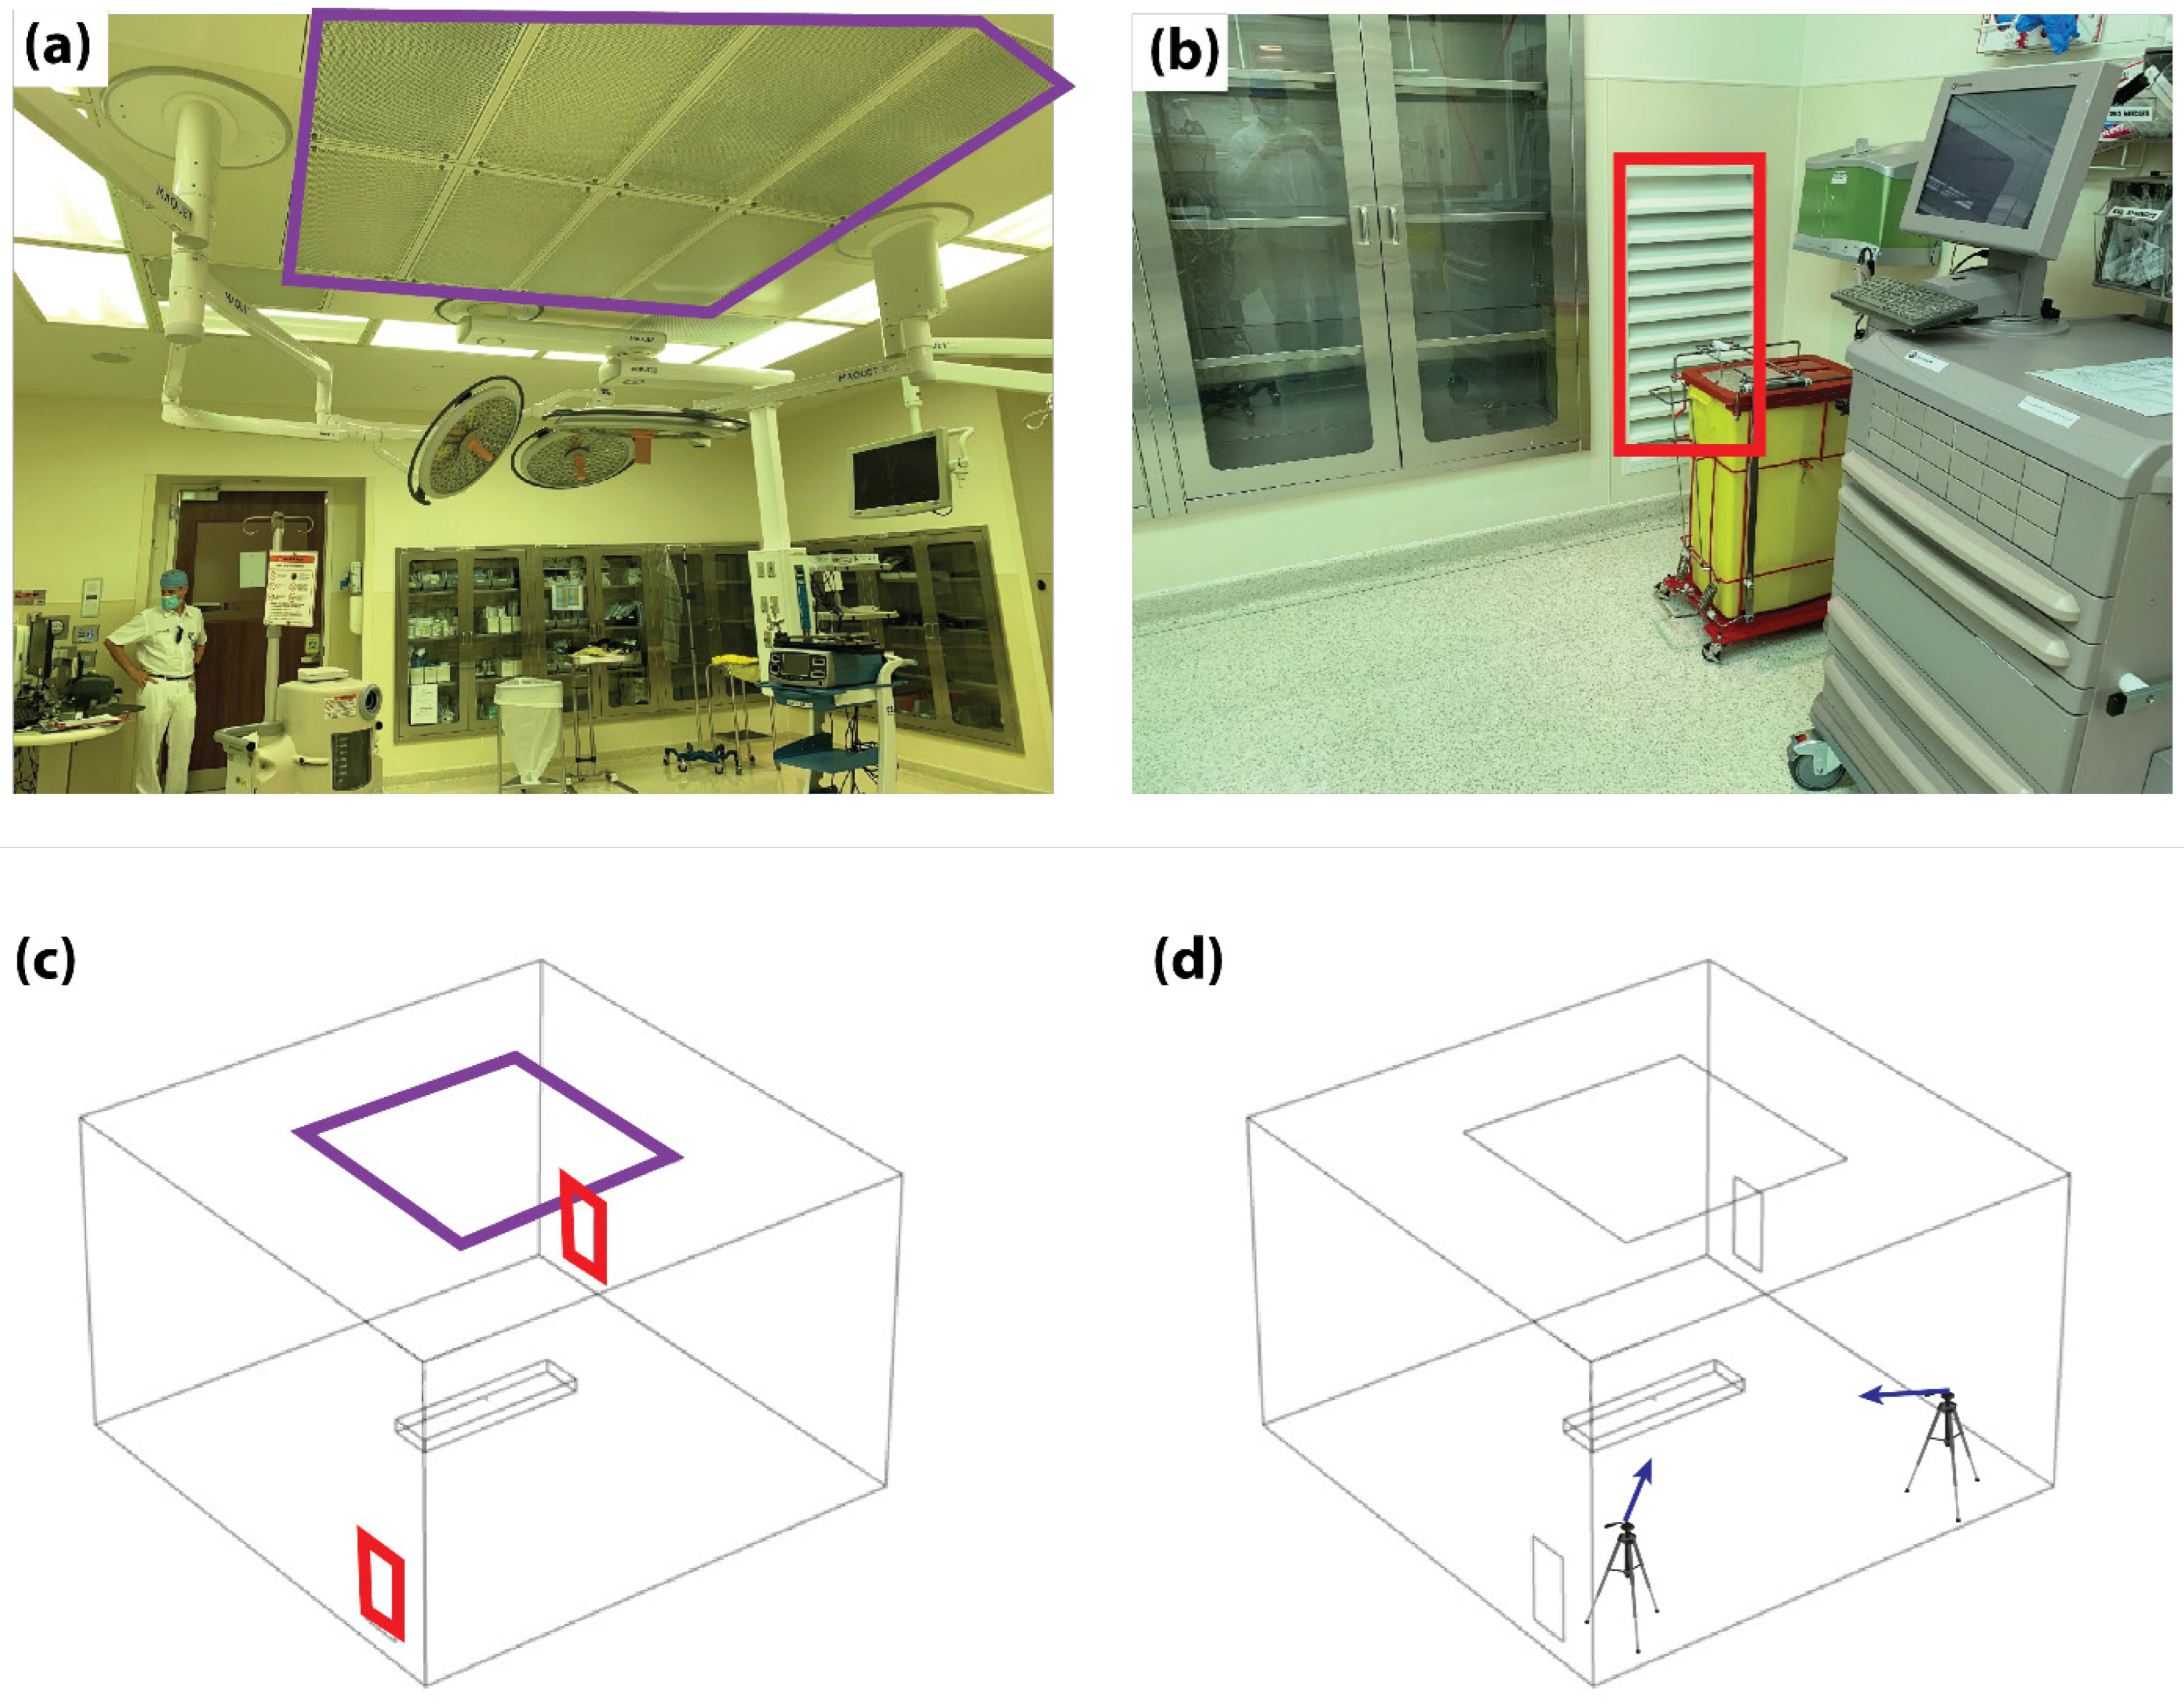
2.1. Operating Room Settings
2.2. CFD Model
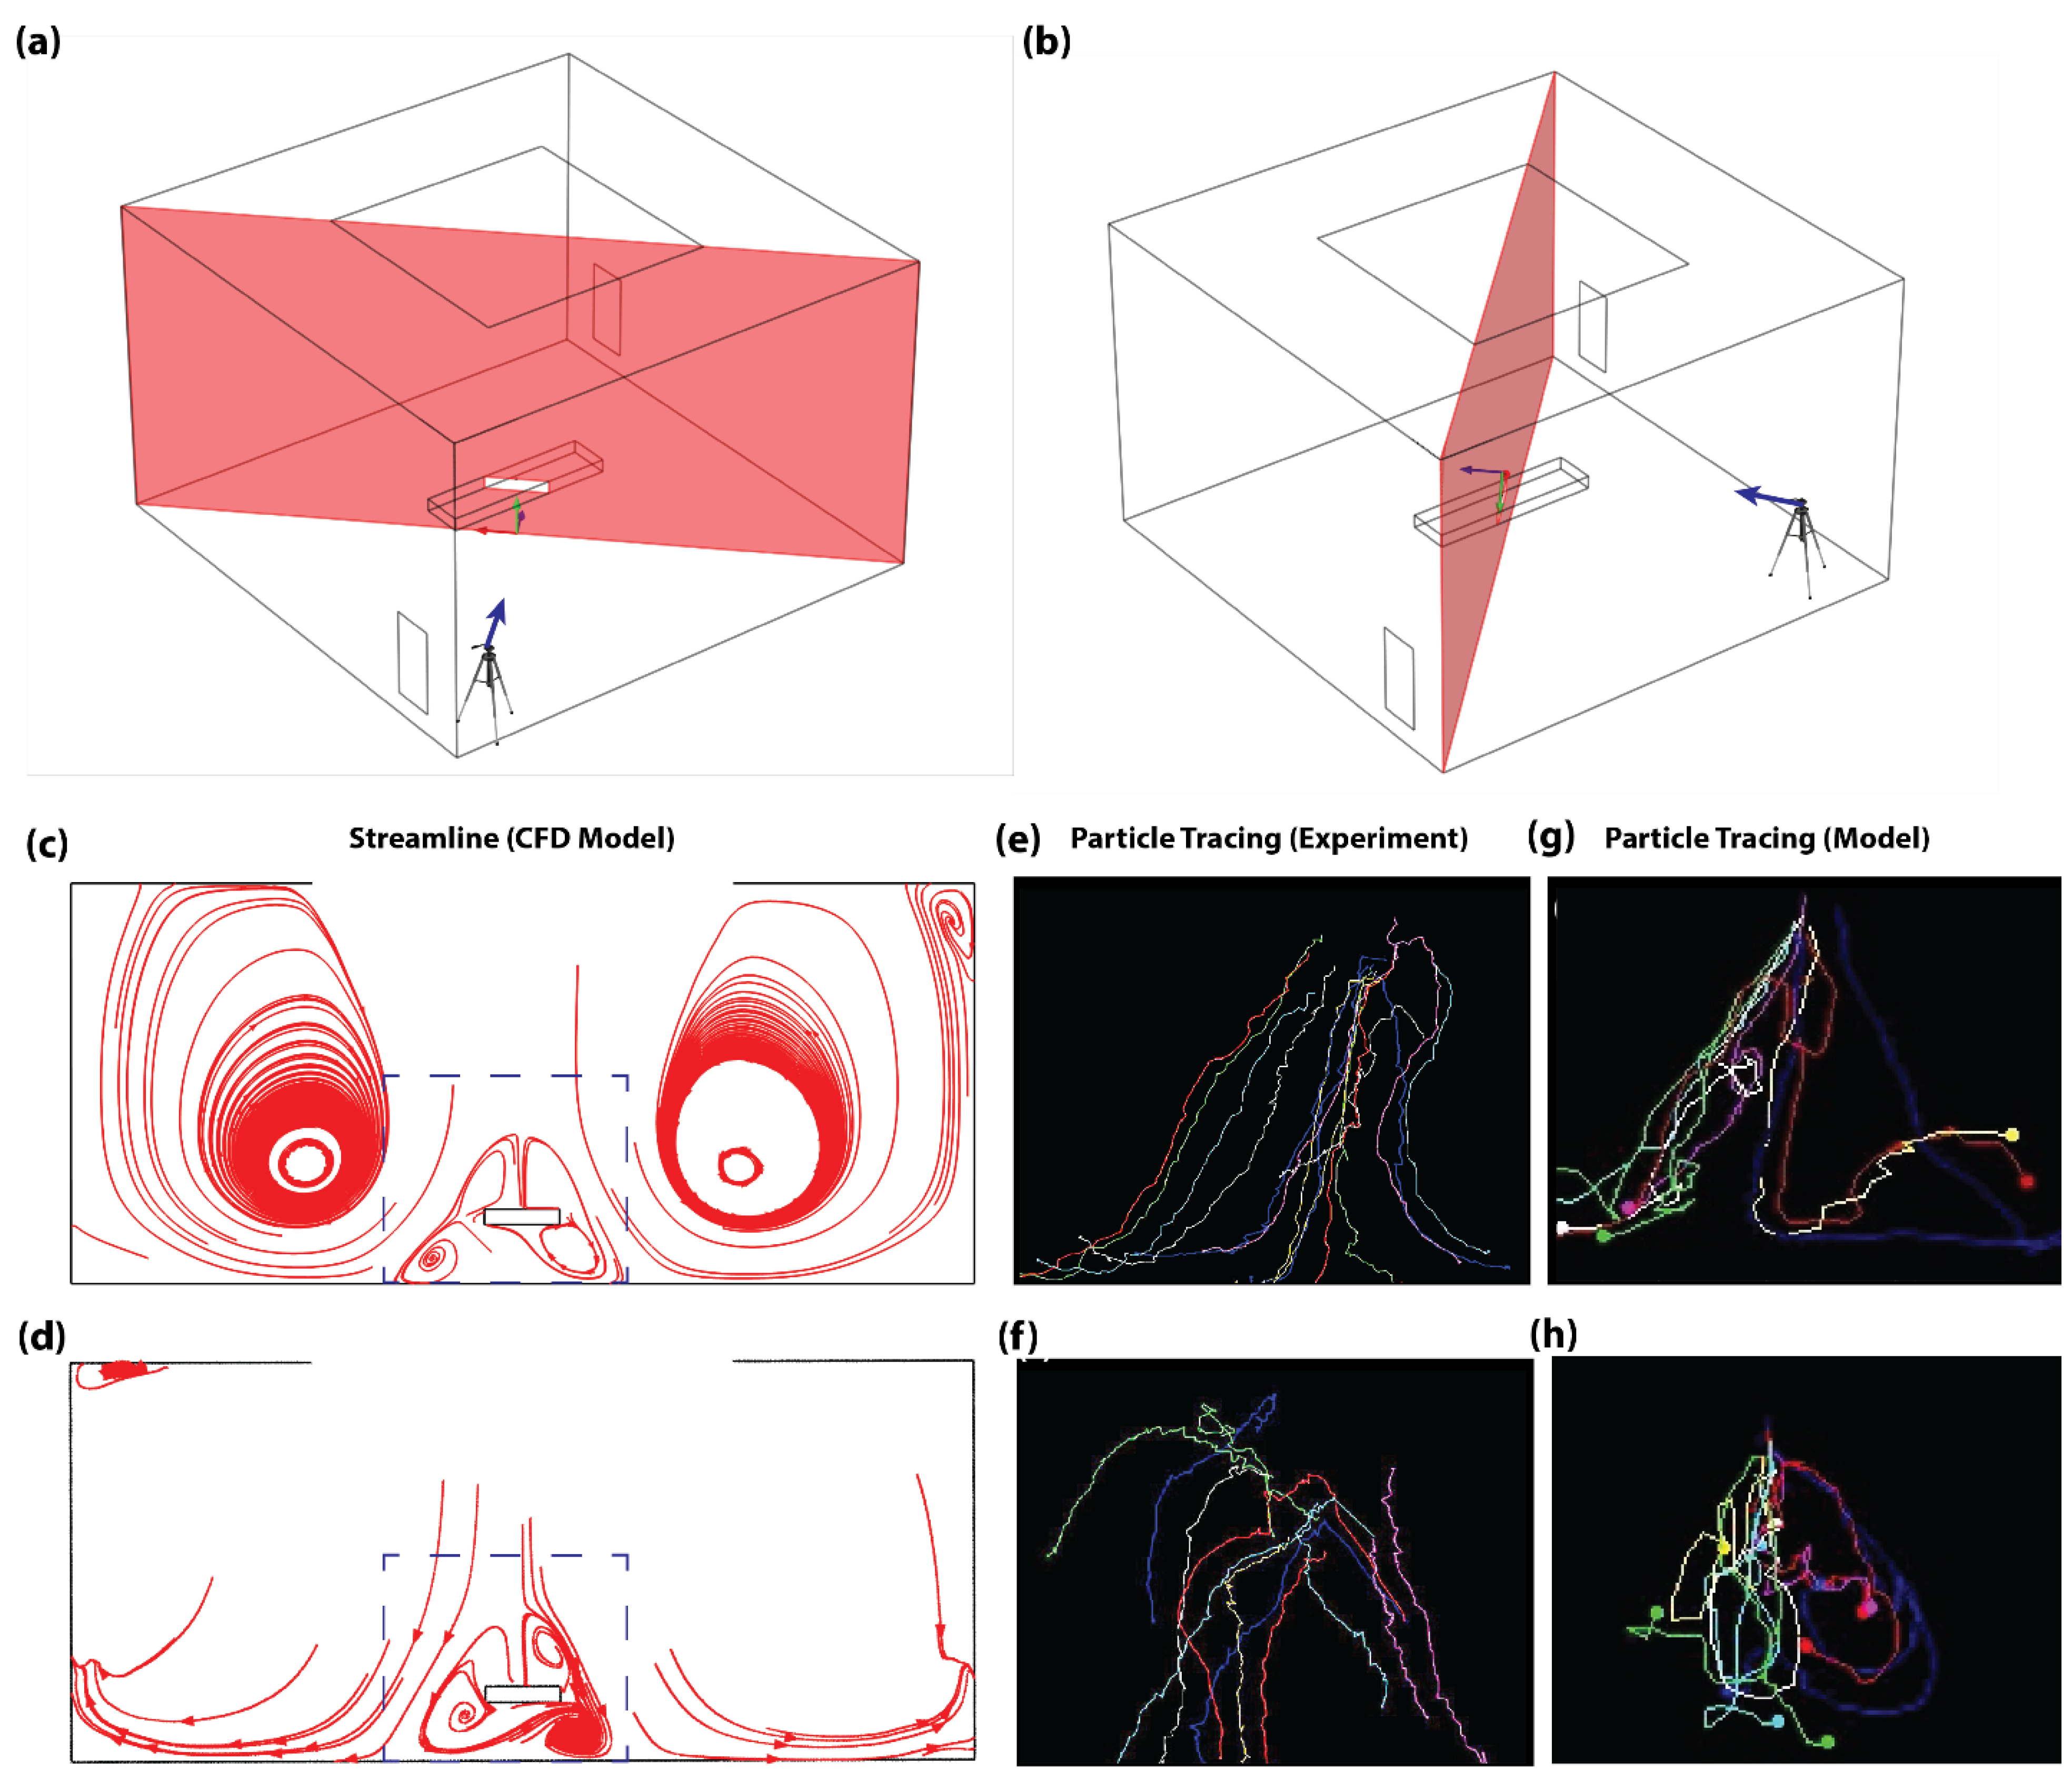
2.3. Model Validation
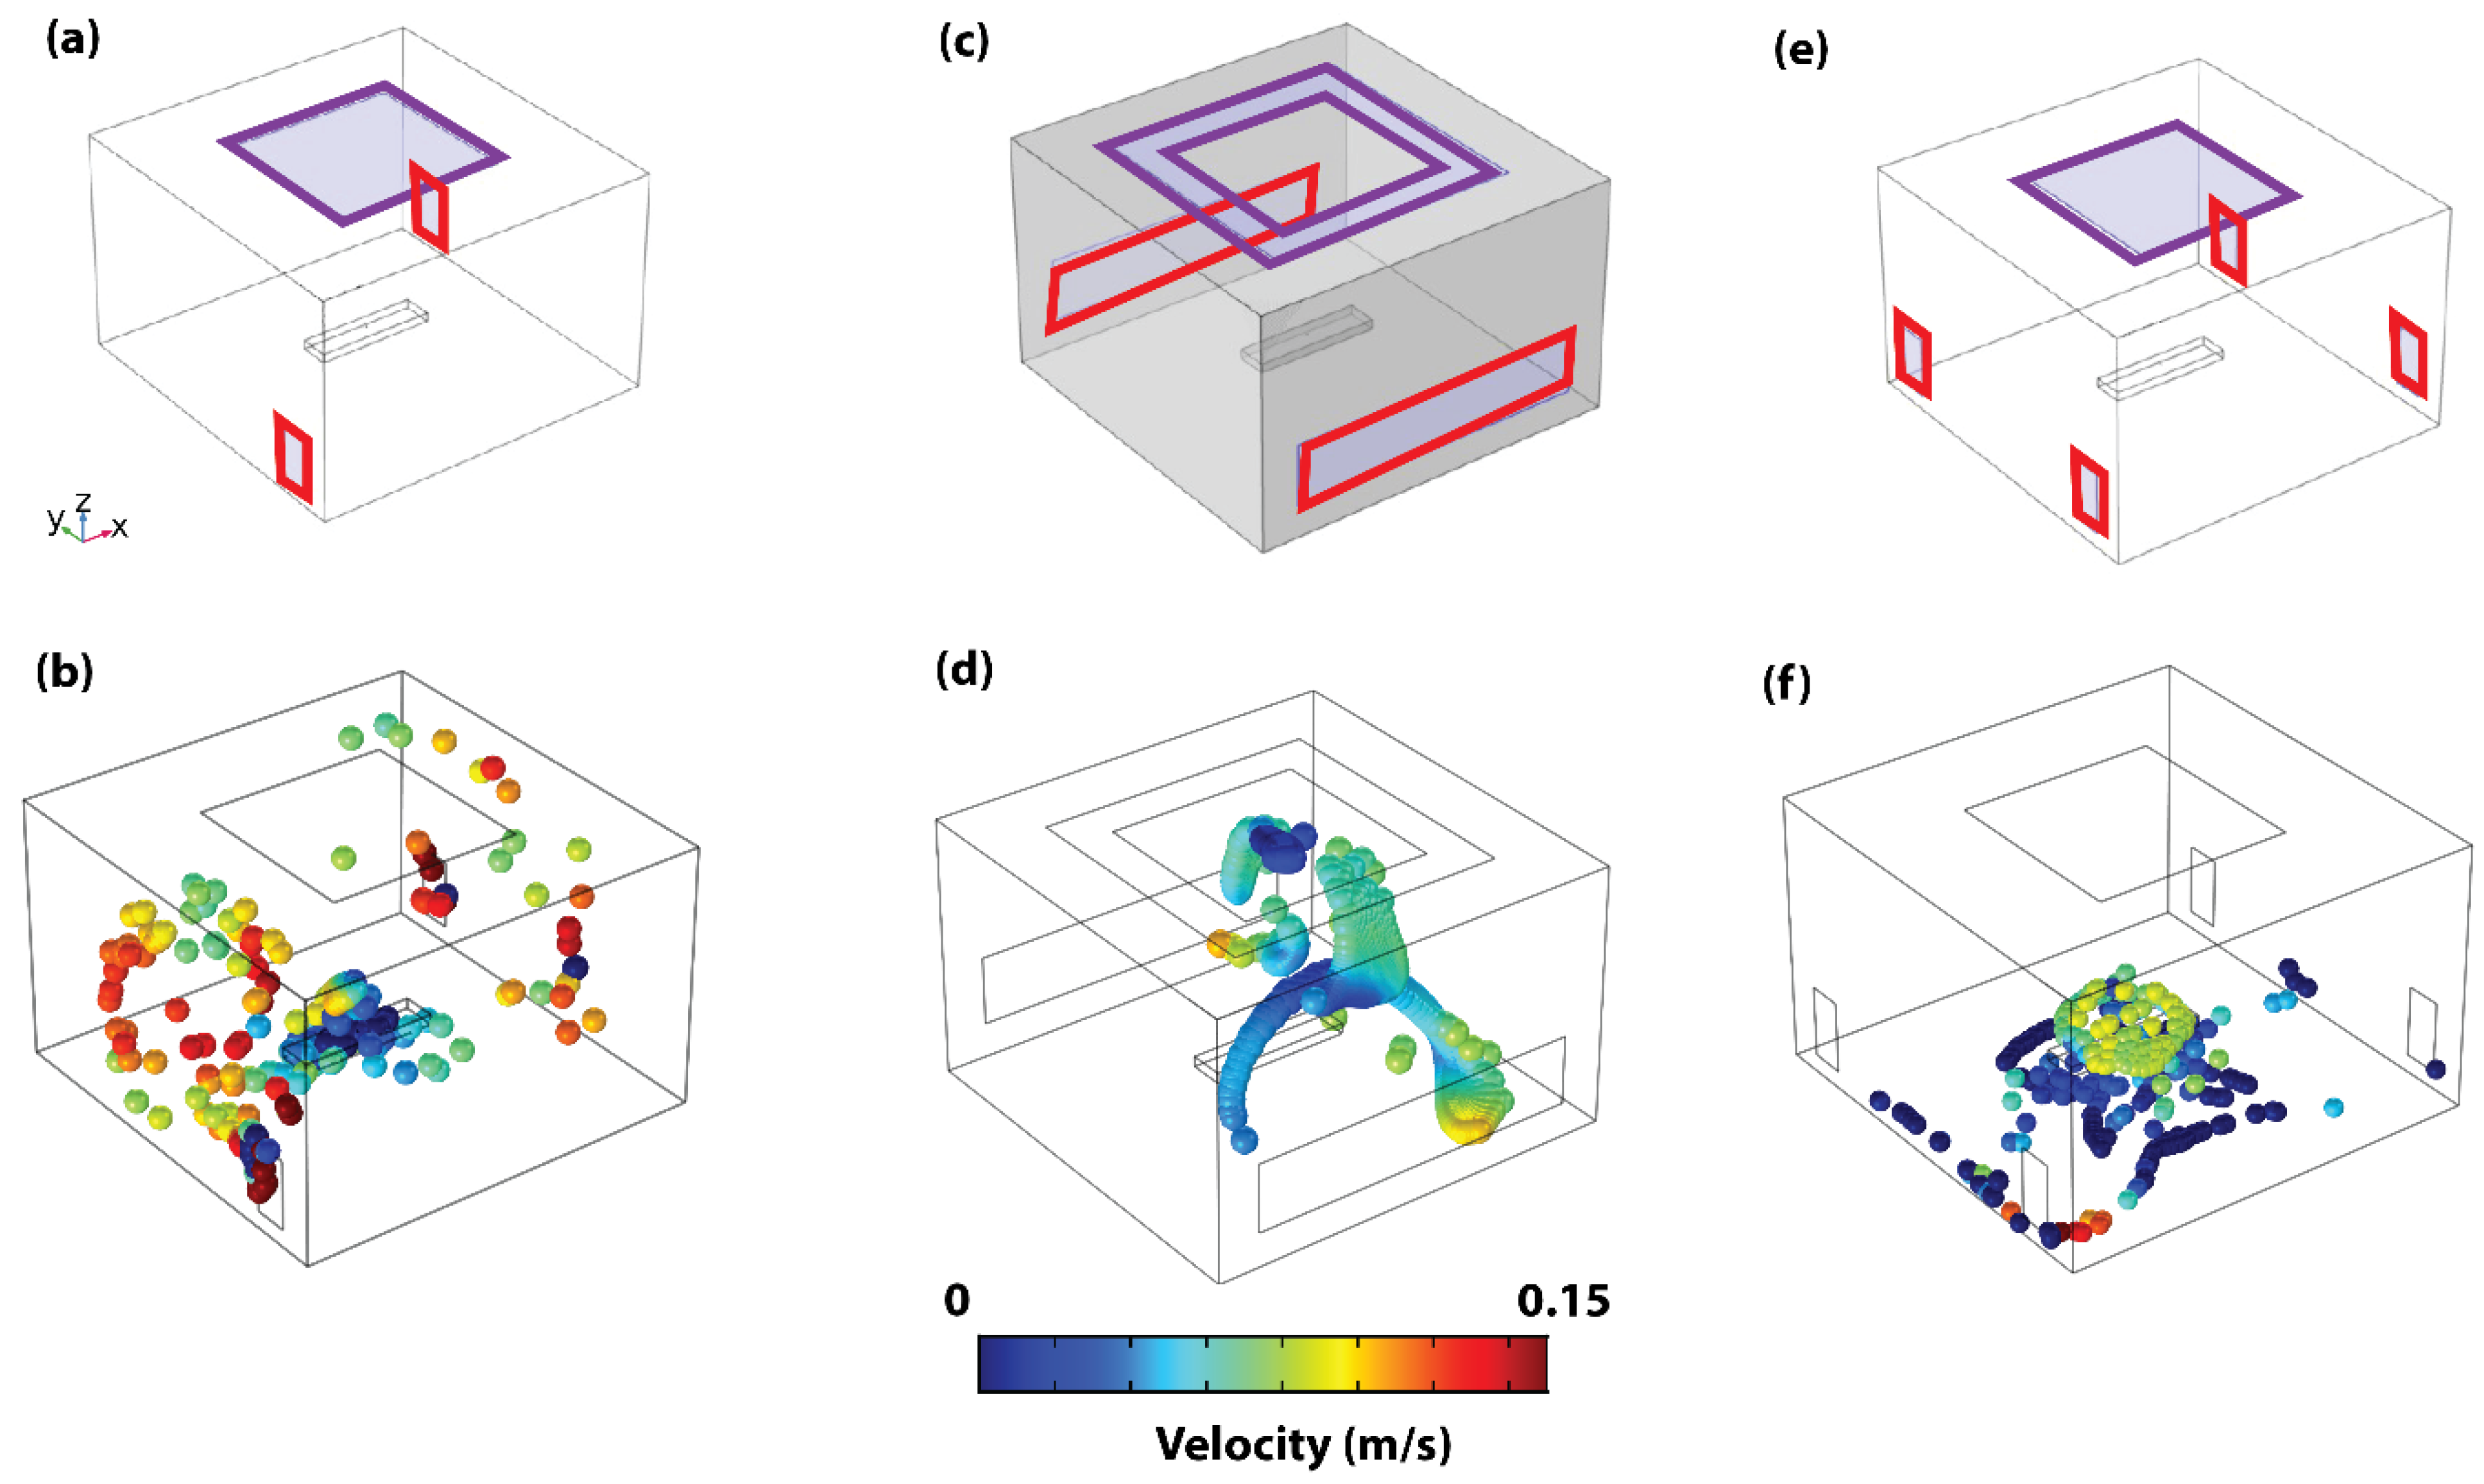
2.4. VS Configurations
2.5. Measurements
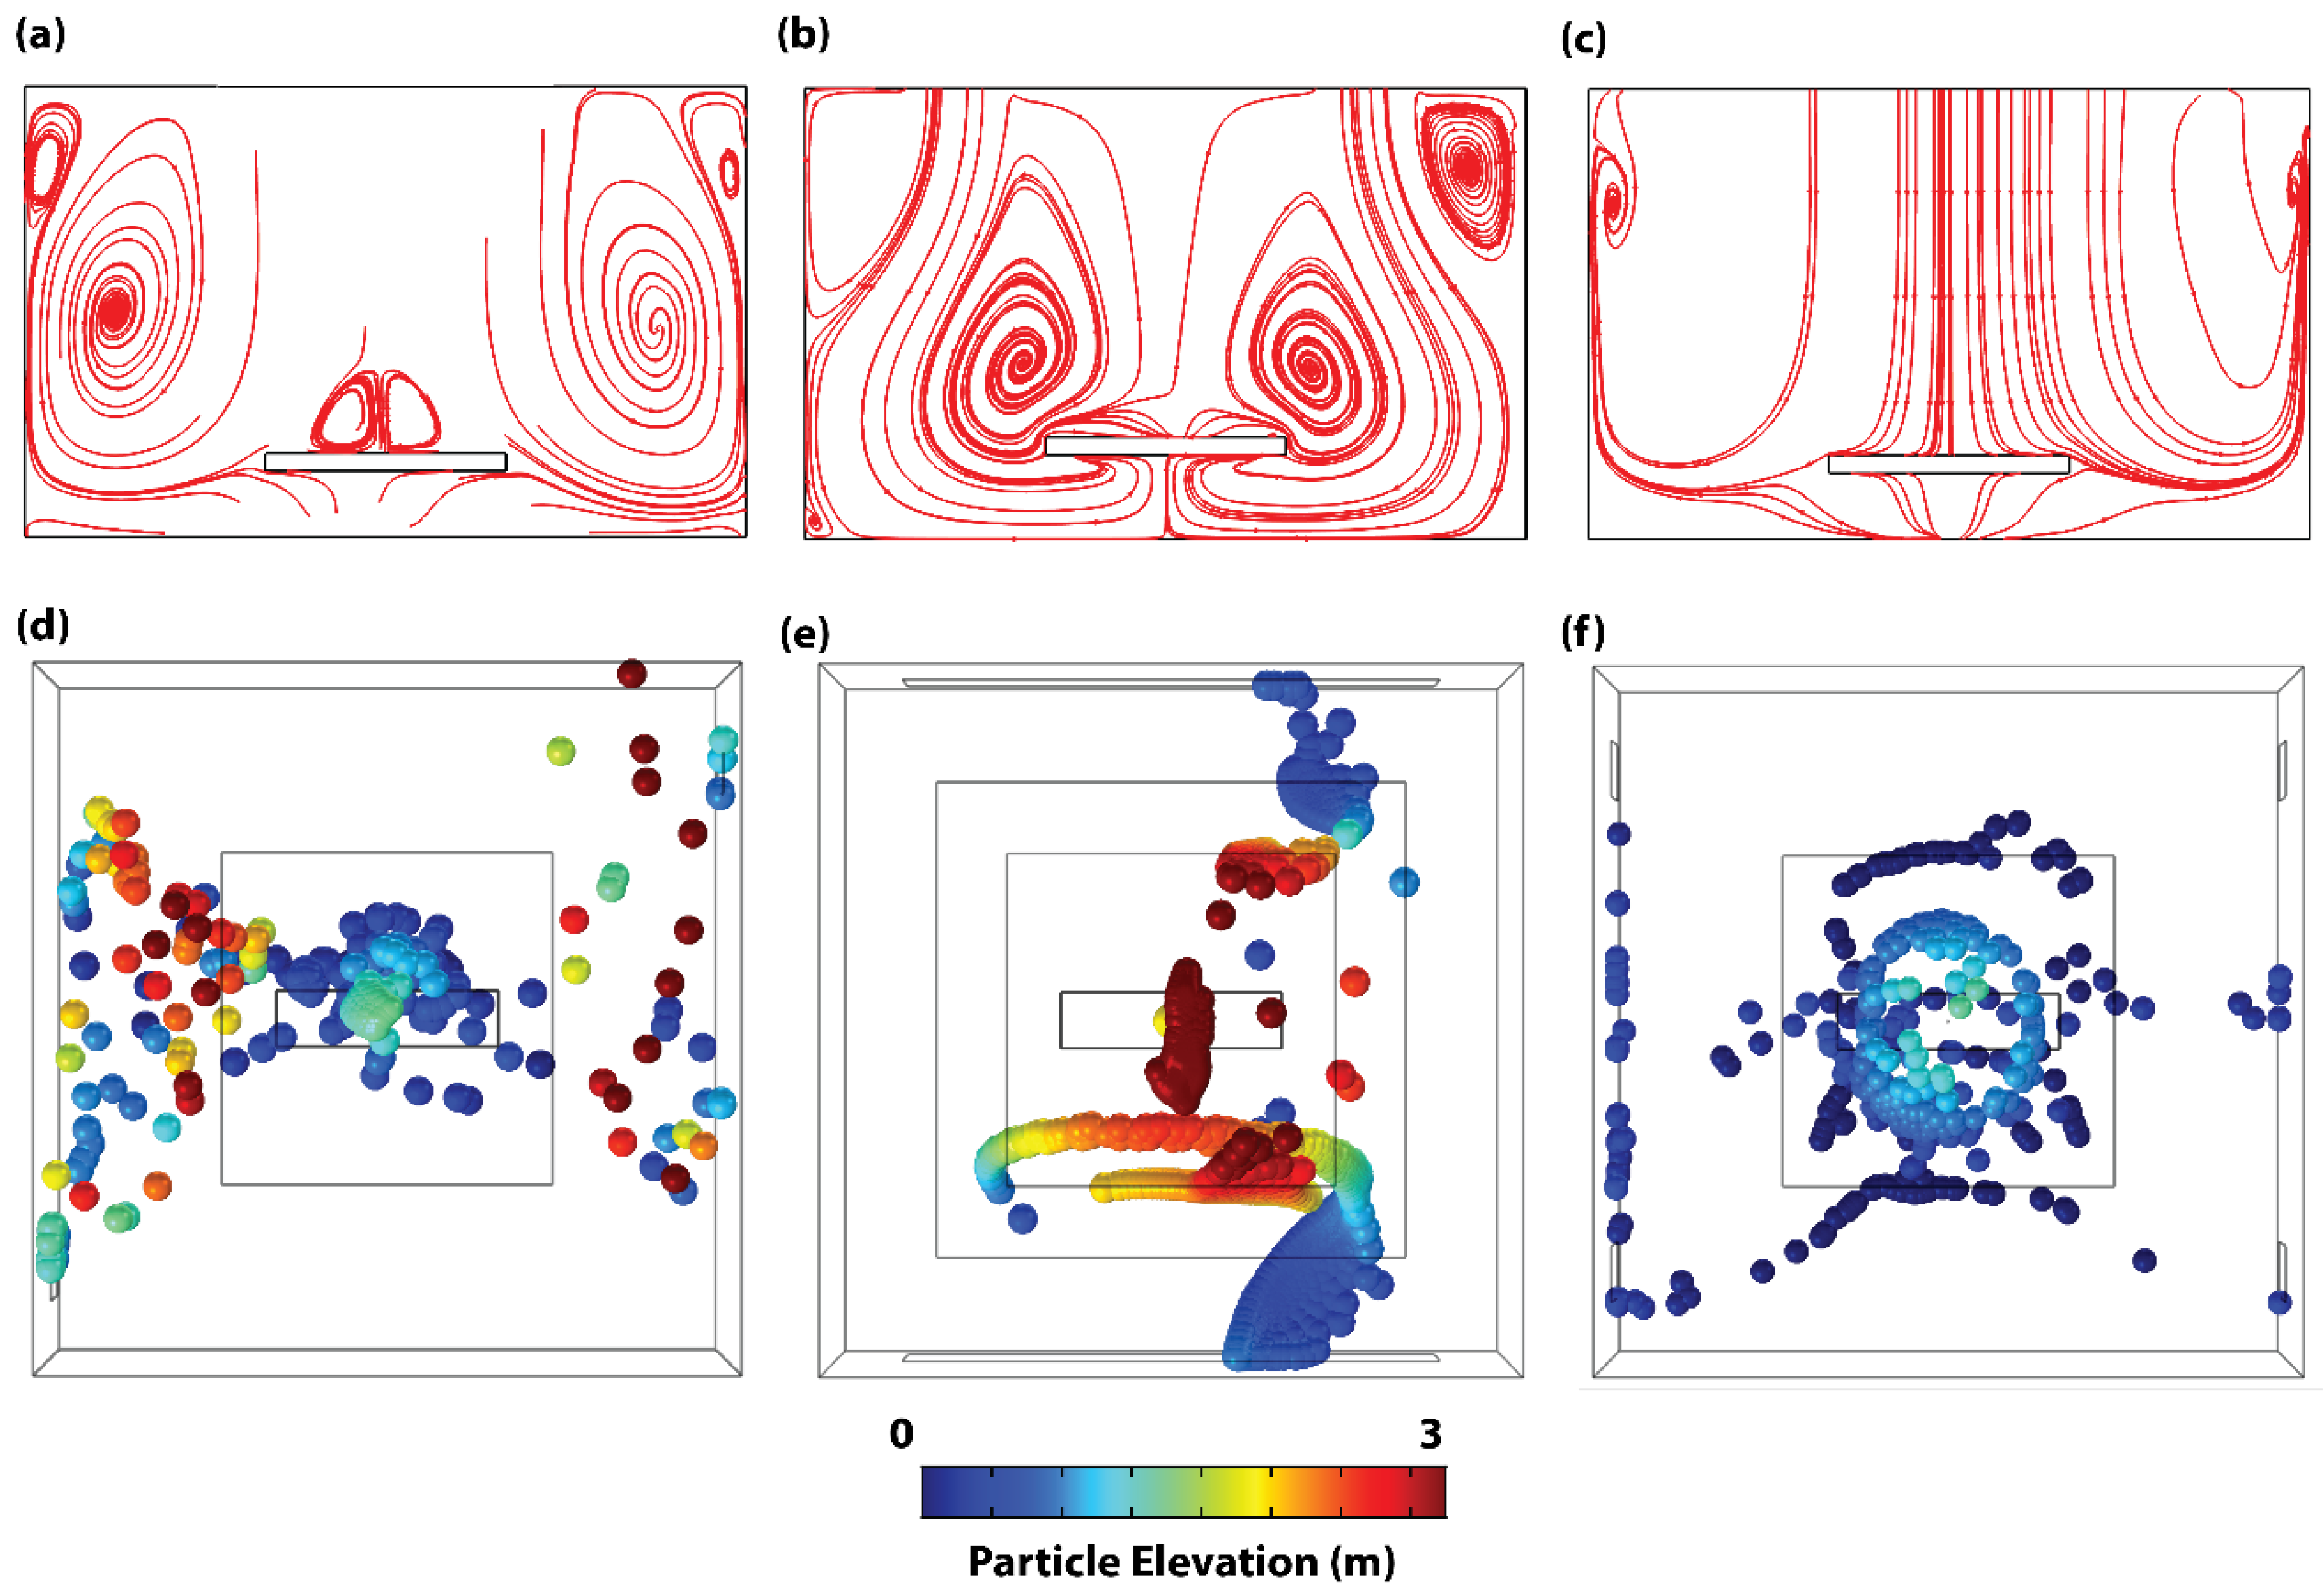
3. Results
4. Discussion
5. Conclusions
Supplementary Materials
Author Contributions
Funding
Institutional Review Board Statement
Informed Consent Statement
Data Availability Statement
Acknowledgments
Conflicts of Interest
References
- Bourdillon, R.B.; Colebrook, L. Air hygiene in dressing-rooms for burns or major wounds. Lancet 1946, 6400, 561–565. [Google Scholar] [CrossRef]
- Stacey, A.; Humphreys, H. A UK historical perspective on operating theatre ventilation. J. Hosp. Infect. 2002, 52, 77–80. [Google Scholar] [CrossRef]
- Holton, J.; Ridgway, G.L. Commissioning operating theatres. J. Hosp. Infect. 1993, 23, 153–160. [Google Scholar] [CrossRef] [PubMed]
- Charnley, J. Postoperative infection after total hip replacement with special reference to air contamination in the operating room. Clin. Orthop. Relat. Res. 1972, 87, 167–187. [Google Scholar] [CrossRef] [PubMed]
- Gosden, P.E.; MacGowan, A.P.; Bannister, G.C. Importance of air quality and related factors in the prevention of infection in orthopaedic implant surgery. J. Hosp. Infect. 1998, 39, 173–180. [Google Scholar] [CrossRef] [PubMed]
- Humphreys, H.; Taylor, E.W. Operating theatre ventilation standards and the risk of postoperative infection. J. Hosp. Infect. 2002, 50, 85–90. [Google Scholar] [CrossRef] [PubMed]
- Wagner, J.A.; Schreiber, K.J. Improving Operating Room Contamination Control. Ashrae J. 2014, 56, 18–22, 24, 26–27. [Google Scholar]
- Essex-Lopresti, M. Operating theatre design. Lancet 1999, 353, 1007–1010. [Google Scholar] [CrossRef]
- Department of Health/Estates and Facilities Division. Health Technical Memorandum 03–01: Specialised ventilation for Healthcare Premises, Part B. 2021. Available online: https://www.england.nhs.uk/publication/specialised-ventilation-for-healthcare-buildings/ (accessed on 1 September 2021).
- Chow, T.T.; Yang, X.Y. Ventilation performance in the operating theatre against airborne infection: Numerical study on an ultra-clean system. J. Hosp. Infect. 2005, 59, 138–147. [Google Scholar] [CrossRef]
- Hoffman, P.N.; Williams, J.; Stacey, A.; Bennett, A.M.; Ridgway, G.L.; Dobson, C.; Fraser, I.; Humphreys, H. Microbiological commissioning and monitoring of operating theatre suites. J. Hosp. Infect. 2002, 52, 1–28. [Google Scholar] [CrossRef]
- Alp, E.; Bijl, D.; Bleichrodt, R.P.; Hansson, B.; Voss, A. Surgical smoke and infection control. J. Hosp. Infect. 2006, 62, 1–5. [Google Scholar] [CrossRef]
- Champault, G.; Taffinder, N.; Ziol, M.; Riskalla, H.; Catheline, J.M.C. Cells are present in the smoke created during laparoscopic surgery. J. Br. Surg. 1997, 84, 993–995. [Google Scholar] [CrossRef]
- Baggish, M.S.; Polesz, B.J.; Joret, D.; Williamson, P.; Refai, A. Presence of human immunodeficiency virus DNA in laser smoke. Lasers Surg. Med. 1991, 11, 197–203. [Google Scholar] [CrossRef] [PubMed]
- Taravella, M.J.; Weinberg, A.; May, M.; Stepp, P. Live virus survives excimer laser ablation. Ophthalmology 1999, 106, 1498–1499. [Google Scholar] [CrossRef] [PubMed]
- Sood, A.K.; Bahrani-Mostafavi, Z.; Stoerker, J.; Stone, I.K. Human papillomavirus DNA in LEEP plume. Infect. Dis. Obstet. Gynecol. 1994, 2, 167–170. [Google Scholar] [CrossRef] [PubMed]
- Kwak, H.D.; Kim, S.-H.; Seo, Y.S.; Song, K.-J. Detecting hepatitis B virus in surgical smoke emitted during laparoscopic surgery. Occup. Environ. Med. 2016, 73, 857–863. [Google Scholar] [CrossRef] [PubMed]
- Barrett, W.L.; Garber, S.M. Surgical smoke: A review of the literature. Surg. Endosc. 2003, 17, 979–987. [Google Scholar] [CrossRef] [PubMed]
- Hallmo, P.; Naess, O. Laryngeal papillomatosis with human papillomavirus DNA contracted by a laser surgeon. Eur. Arch. Oto-rhino-Laryngol. 1991, 248, 425–427. [Google Scholar] [CrossRef]
- Rioux, M.; Garland, A.; Webster, D.; Reardon, E. HPV positive tonsillar cancer in two laser surgeons. J. Otolaryngol. Neck Surg. 2013, 42, 54. [Google Scholar] [CrossRef]
- Carr, A.; Smith, J.A.; Camaradou, J.; Prieto-Alhambra, D. Growing backlog of planned surgery due to COVID-19. BMJ 2021, 372, n339. [Google Scholar] [CrossRef]
- Serban, D.; Smarandache, C.G.; Tudor, C.; Duta, L.N.; Dascalu, A.M.; Aliuș, C. Laparoscopic Surgery in COVID-19 Era—Safety and Ethical Issues. Diagnostics 2020, 10, 673. [Google Scholar] [CrossRef] [PubMed]
- Safari, S.; Keyvani, H.; Alamdari, N.M.; Dehghanian, A.; Hashemi, M.R.; Honar, B.N.; Aminian, A. Abdominal surgery in patients with COVID-19, detection of SARS-CoV-2 in abdominal and adipose tissues. Ann. Surg. 2020, 272, e253. [Google Scholar] [CrossRef] [PubMed]
- Coccolini, F.; Tartaglia, D.; Puglisi, A.; Giordano, C.; Pistello, M.; Lodato, M.; Chiarugi, M. SARS-CoV-2 is present in peritoneal fluid in COVID-19 patients. Ann. Surg. 2020, 272, e240. [Google Scholar] [CrossRef] [PubMed]
- Annino, F.; Topazio, L.; Autieri, D.; Verdacchi, T.; De Angelis, M.; Asimakopoulos, A.D. Robotic partial nephrectomy performed with Airseal versus a standard CO 2 pressure pneumoperitoneum insufflator: A prospective comparative study. Surg. Endosc. 2017, 31, 1583–1590. [Google Scholar] [CrossRef] [PubMed]
- Leppert, J.T.; Breda, A.; Harper, J.D.; Schulam, P.G. Laparoendoscopic single-site porcine nephrectomy using a novel valveless trocar system. J. Endourol. 2011, 25, 119–122. [Google Scholar] [CrossRef] [PubMed]
- Megadyne. Megadyne Mega Vac Smoke Evacuator. Available online: https://www.jnjmedicaldevices.com/sites/default/files/user_uploaded_assets/pdf_assets/2019-10/MEGADYNE-Mega-Vac-Smoke-Evacuator-Brochure-086348-171226.pdf (accessed on 1 September 2021).
- Ansell, J.; Warren, N.; Wall, P.; Cocks, K.; Goddard, S.; Whiston, R.; Stechman, M.; Scott-Coombes, D.; Torkington, J. Electrostatic precipitation is a novel way of maintaining visual field clarity during laparoscopic surgery: A prospective double-blind randomized controlled pilot study. Surg. Endosc. 2014, 28, 2057–2065. [Google Scholar] [CrossRef] [PubMed]
- da Costa, K.M.; Saxena, A.K. Coronavirus disease 2019 pandemic and identifying insufflators with desufflation mode and surgical smoke evacuators for safe CO2 removal. Asian J. Endosc. Surg. 2021, 14, 165–169. [Google Scholar] [CrossRef] [PubMed]
- Gallo, O.; Locatello, G.; Orlando, P.; Bruno, C.; Maggiore, G.; Signorini, P.; Adembri, C. A New Solution for Routine Endoscopic Aerosol-Generating Procedures (AGPs) in the COVID-19 Pandemic. J. Craniofacial Surg. 2021, 32, e309–e311. [Google Scholar] [CrossRef]
- Bianco, F.; Incollingo, P.; Grossi, U.; Gallo, G. Preventing transmission among operating room staff during COVID-19 pandemic: The role of the Aerosol Box and other personal protective equipment. Updates Surg. 2020, 72, 907–910. [Google Scholar] [CrossRef]
- Wilcox, D.C. Turbulence Modeling for CFD; DCW Industries: La Canada, CA, USA, 1998. [Google Scholar]
- Wagner, J.A.; Dexter, F.; Greeley, D.G.; Schreiber, K. Operating room air delivery design to protect patient and surgical site results in particles released at surgical table having greater concentration along walls of the room than at the instrument tray. Am. J. Infect. Control 2021, 49, 593–596. [Google Scholar] [CrossRef]
- Kek, H.Y.; Saupi, S.B.M.; Tan, H.; Othman, M.H.D.; Nyakuma, B.B.; Goh, P.S.; Altowayti, W.A.H.; Qaid, A.; Wahab, N.H.A.; Lee, C.H.; et al. Ventilation Strategies for Mitigating Airborne Infection in Healthcare Facilities: A Review and Bibliometric Analysis (1993 to 2022). Energy Build. 2023, 295, 113323. [Google Scholar] [CrossRef]
- Puthussery, J.V.; Ghumra, D.P.; McBrearty, K.R.; Doherty, B.M.; Sumlin, B.J.; Sarabandi, A.; Mandal, A.G.; Shetty, N.J.; Gardiner, W.D.; Magrecki, J.P.; et al. Real-time environmental surveillance of SARS-CoV-2 aerosols. Nat. Commun. 2023, 14, 3692. [Google Scholar] [CrossRef]
- Carducci, A.; Federigi, I.; Verani, M. COVID-19 airborne transmission and its prevention: Waiting for evidence or applying the precautionary principle? Atmosphere 2020, 11, 710. [Google Scholar] [CrossRef]
- Peng, S.; Chen, Q.; Liu, E. The role of computational fluid dynamics tools on investigation of pathogen transmission: Prevention and control. Sci. Total Environ. 2020, 746, 142090. [Google Scholar] [CrossRef] [PubMed]
- Rodríguez Reveggino, B.; Becerra-Bolaños, Á. Transitional Justice after the COVID-19 Pandemic. Int. J. Environ. Res. Public Health 2022, 19, 12388. [Google Scholar] [CrossRef]
- Wagner, J.A.; Schreiber, K.J. Comparing Air Delivery Methods in an Operating Theater: Cleanroom Technology Can Improve Contaminant Control and Removal; HVAC&R Research: Philadelphia, PA, USA, 2013. [Google Scholar]
- Bronshtein, I.N.; Semendyayev, K.A.; Musiol, G.; Mühlig, H. Handbook of Mathematics; Springer: Berlin/Heidelberg, Germany, 2015. [Google Scholar]
- Saad, Y.; Schultz, M.H. GMRES: A generalized minimal residual algorithm for solving nonsymmetric linear systems. SIAM J. Sci. Stat. Comput. 1986, 7, 856–869. [Google Scholar] [CrossRef]
- Sun, C.; Zhai, Z. The efficacy of social distance and ventilation effectiveness in preventing COVID-19 transmission. Sustain. Cities Soc. 2020, 62, 102390. [Google Scholar] [CrossRef]
- Tang, J.W.; Li, Y.; Eames, I.; Chan, P.K.S.; Ridgway, G.L. Factors involved in the aerosol transmission of infection and control of ventilation in healthcare premises. J. Hosp. Infect. 2006, 64, 100–114. [Google Scholar] [CrossRef] [PubMed]


| Particle Half-Life (s) | Particle Maximum Elevation (m) | |
|---|---|---|
| Existing Configuration C1 | 217 | 3.43 |
| Existing Configuration C2 | 413 | 3.75 |
| Proposed Configuration C3 | 58 | 1.45 |
Disclaimer/Publisher’s Note: The statements, opinions and data contained in all publications are solely those of the individual author(s) and contributor(s) and not of MDPI and/or the editor(s). MDPI and/or the editor(s) disclaim responsibility for any injury to people or property resulting from any ideas, methods, instructions or products referred to in the content. |
© 2024 by the authors. Licensee MDPI, Basel, Switzerland. This article is an open access article distributed under the terms and conditions of the Creative Commons Attribution (CC BY) license (https://creativecommons.org/licenses/by/4.0/).
Share and Cite
Brimmo, A.T.; Glia, A.; Barajas-Gamboa, J.S.; Abril, C.; Rodríguez, J.; Kroh, M.; Qasaimeh, M.A. Ventilation-Based Strategy to Manage Intraoperative Aerosol Viral Transmission in the Era of SARS-CoV-2. Life 2024, 14, 313. https://doi.org/10.3390/life14030313
Brimmo AT, Glia A, Barajas-Gamboa JS, Abril C, Rodríguez J, Kroh M, Qasaimeh MA. Ventilation-Based Strategy to Manage Intraoperative Aerosol Viral Transmission in the Era of SARS-CoV-2. Life. 2024; 14(3):313. https://doi.org/10.3390/life14030313
Chicago/Turabian StyleBrimmo, Ayoola T., Ayoub Glia, Juan S. Barajas-Gamboa, Carlos Abril, John Rodríguez, Matthew Kroh, and Mohammad A. Qasaimeh. 2024. "Ventilation-Based Strategy to Manage Intraoperative Aerosol Viral Transmission in the Era of SARS-CoV-2" Life 14, no. 3: 313. https://doi.org/10.3390/life14030313
APA StyleBrimmo, A. T., Glia, A., Barajas-Gamboa, J. S., Abril, C., Rodríguez, J., Kroh, M., & Qasaimeh, M. A. (2024). Ventilation-Based Strategy to Manage Intraoperative Aerosol Viral Transmission in the Era of SARS-CoV-2. Life, 14(3), 313. https://doi.org/10.3390/life14030313