Article

Associations Between Sprint Mechanical Properties and Change of Direction Ability and Asymmetries in COD Speed Performance in Basketball and Volleyball Players

1
Sport Science School, Beijing Sport University, Beijing 100084, China
2
China Volleyball College, Beijing Sport University, Beijing 100084, China
3
College of Physical Education and Arts Humanities, China University of Petroleum, Beijing 100100, China
4
China Institute of Sport and Health Science, Beijing Sport University, Beijing 100084, China
5
Caofeidian College of Technology, Tangshan 063205, China
6
China Basketball College, Beijing Sport University, Beijing 100084, China
7
Beijing Key Laboratory of Sports Performance and Skill Assessment, Beijing 100084, China
8
Key Laboratory for Performance Training & Recovery of General Administration of Sport, Beijing 100084, China
*
Author to whom correspondence should be addressed.
Life 2024, 14(11), 1434; https://doi.org/10.3390/life14111434
Submission received: 20 September 2024 / Revised: 28 October 2024 / Accepted: 2 November 2024 / Published: 6 November 2024
(This article belongs to the Special Issue Focus on Exercise Physiology and Sports Performance)

Abstract

:
This study aimed to assess the associations between sprint force–velocity profile variables with change of direction (COD) performance and to investigate the impact of these variables on asymmetries in COD speed performance. Ninety-nine participants (volleyball players: n = 44, basketball players: n = 55) performed 40 m sprints for Fv relationship calculation, two COD tests (Modified Agility T-test and 505 test). A partial least squares (PLS) regression analysis was conducted to determine the relationships between the variables. The V0 was the most influential variable; it was negatively associated with COD performance variables (β = −0.260, −0.263 and −0.244 for MAT, 505-D and 505-ND, respectively), and F0 (β = 0.169, 0.163) was associated with the COD performance variables (COD deficit D and COD deficit ND, respectively), slightly larger than the effects of Fvslope (β = −0.162, −0.146), DRF (β = −0.159, −0.142) and Pmax (β = −0.162, −0.146). For COD deficit imbalance, the DRF (β = −0.070) was the most influential variable followed by Fvslope (β = −0.068), F0 (β = 0.046) and gender (β = 0.031). V0 and RFmax were the critical variables for improving COD performance that includes linear sprints, while DRF, Fvslope, F0 and Pmax collectively influence 180° COD performance. Meanwhile, DRF and Fvslope were important factors for asymmetries in COD speed performance. It is recommended to use the Fv profile to diagnose different COD movement patterns and then develop training plans accordingly for team sports played on smaller courts, such as basketball and volleyball.

1. Introduction

Team sports players must frequently perform change of direction (COD) movements such as running back and forth repeatedly. Compared to linear sprinting, COD movements involve additional acceleration and deceleration to overcome inertia and quickly generate propulsive forces in new directions. The ability to change direction is particularly critical in basketball and volleyball [1,2,3]. Characteristic gameplay in basketball involves short and rapid offenses, with an average maximum movement distance of 9.48 m [4]. In volleyball, 83.7% of game durations are less than 10 s. Regarding covered distance, 45.7% of movements range between 5 and 10 m, while 85.3% are less than 15 m [5]. In both aforementioned sports, due to the small area of the competition court and the frequent changes in competition intensity, athletes are required to repeatedly engage in high-intensity exercise accompanied by frequent COD movements [4,5].
Due to the similarity between the movement patterns of the Modified Agility Test (MAT) and the sprinting and lateral movement demands in volleyball and basketball, as well as its ability to better replicate the typical multi-directional, high-intensity movement distances in team sports, a series of studies have used the MAT to assess the COD performance of basketball and volleyball players [6,7,8,9]. The 505 COD test also widely used to measure COD performance for each leg in volleyball and basketball [10,11]. Time is recorded at the 10-m mark of the sprint and ends with the 5-m sprint following the turn. This timing omits the acceleration process from a stationary start, reflecting the phase where athletes move at higher speeds during a game [10]. However, the relevance of the total time of the 505 COD test in evaluating COD ability has recently been questioned, as literature shows that only 31% of the 505 COD test time is devoted to changing direction [12,13]. Therefore, to minimize the influence of physical fitness (body weight, size and body’s center of gravity), linear speed and acceleration on 505 COD test results, a COD deficit, which is an evaluation method for COD ability—where a participant’s 10 m time is subtracted from the 505 COD time—is considered an effective method to independently assess COD ability while avoiding these confounding factors [2,5,14,15]. The MAT and 505 COD test provide a comprehensive assessment of multidirectional (90° and 180°) movement, such as a 180° backdoor cut to sprint away from defensive pressure, with performance influenced by the linear and lateral speeds [10]. Conversely, COD deficit offers an isolated evaluation of COD performance [16].
In recent years, studies of lower limb asymmetry in sports performance have garnered considerable attention. The COD deficit is an effective indicator for assessing lower limb asymmetry [14,17]. It appears that team sports players who demonstrate greater limb symmetry (assessed via unilateral vertical jump or distance reached during a dynamic balance test) are faster than their asymmetrical counterparts during COD sprint tests [18]. Spiteri et al. reported that professional female basketball players demonstrate better lower limb balance than collegiate female basketball players [19]. Additionally, the injured side of recreational team sport players was found to be 2% slower than the healthy side in the 505 COD test [18]. Among basketball players, combined unilateral training effectively reduced lower limb asymmetry and enhanced COD capability [20]. It has also been observed that during double-leg landing tasks, volleyball athletes may be predisposed to unilaterally higher ground reaction or muscle forces, ultimately increasing the risk of injury during landing [21]. These findings underscore the importance of reducing lower limb imbalances to execute more proficient on-court movements.
Samozino et al. have recently developed a method to assess the entire force–velocity (Fv) spectrum during sprint acceleration (sprint Fv profile), profiling the mechanical capabilities of the neuromuscular system [22,23]. Since the sprint Fv relationship is linearity, the maximal capacities of muscles to produce force (F0), velocity (V0), power (Pmax), Fvslope (the ratio between F0 and V0), maximal ratio of force (RFmax), maximum speed during a sprint (Vmax) and the index of force application technique (DRF) can be determined within a linear regression model [23,24]. The sprint Fv profile has already been established as a reliable theoretical basis for devising personalized training guidance for athletes [22,25,26,27,28]. An athlete engaged in sports with lower speed demands may benefit from more maximal speed sprint training, while those exhibiting lower horizontal force outputs may require additional horizontal force training [29]. Additionally, studies have indicated that sprint Fv profile variables contribute independently to explaining COD performance in basketball and volleyball [30,31]. Thus far, only three studies have explored the relationship between COD ability and the Fv profile variables in volleyball and basketball. One study found that the F0, Fvslope and RFmax had low to moderate correlations (0.32–0.54) with the COD deficit in volleyball players [30]. Another study revealed a moderate to strong negative correlation (r = −0.569 to −0.794) between the 505 COD test times of the dominant and non-dominant legs and the variables F0, V0, Pmax and F0 within the Fv profile in 15 basketball players [31]. Furthermore, research on basketball players showed that F0, RFmax and Pmax are the most determinant sprint Fv profile variables for greater COD performance and minimizing the COD deficit [32]. Studies on the association between COD performance and sprint Fv profile variables in basketball players have produced varying conclusions. In contrast, the limited number of studies on volleyball players has left the relationship between COD performance and sprint Fv profile variables unclear and inconclusive. Meanwhile, currently no research has examined the connection between asymmetries in COD speed performance and the sprint Fv profile in basketball and volleyball players. However, improving COD ability and reducing lower limb imbalance during the COD performance are crucial for volleyball and basketball players. The purpose of this study was to assess the associations between sprint Fv profile variables with COD performance and to investigate the impact of these variables on the asymmetries in COD speed performance.

2. Materials and Methods

2.1. Participants

Ninety-nine team sports collegiate players were selected, including forty-four volleyball players (age: 20.55 ± 1.88 years; height: 176.56 ± 5.21 cm; body mass: 82.55 ± 9.20 kg; BMI: 23.24 ± 2.55; training years: 7.64 ± 1.56) and fifty-five basketball players (age: 20.32 ± 2.41 years; height: 179.95 ± 8.41 cm; body mass: 75.89 ± 10.15 kg; BMI: 23.38 ± 2.10; training years: 8.48 ± 2.83). All the participants participated in an average of 10 h per week of combined team practice and technical skills, plus one competitive match per week. Additionally, they participated as key players in provincial-level or higher competitions in China, achieving top-three finishes. Exclusion criteria were musculoskeletal injuries within the last 6 months and traumatic surgeries within the last 12 months. None of the participants had any injuries or limitations that could affect their testing performance. Written informed consent was obtained from all subjects, and the study was approved by the ethics committee of Beijing Sport University (approval number 2023211H).

2.2. Study Design

A descriptive cross-sectional design was used to determine the relationships between the sprint Fv profile (F0, V0, Pmax, Fvslope, RFmax, DRF and Vmax) and COD performance. Before the testing, all participants were familiarized with the experimental procedures and completed two tests separated by at least 24 h and no more than 7 days. During the first test, participants performed the sprint Fv profile test. During test two, participants performed the COD performance test (the order of the COD performance tests was randomized, and sufficient rest was ensured between each test). All tests were performed indoors at a similar time of day to avoid effect of the circadian rhythm and under controlled conditions (i.e., temperature: min 20 °C, max 33 °C; atmospheric pressure: 1016 hPa). Participants were required not to engage in strenuous exercise within the 24-h period preceding the testing (i.e., no professional practice; only dynamic mobility was allowed). All participants completed three 40 m sprints, three MATs and six attempts of 505 COD tests with both the dominant and non-dominant legs. Before testing, all participants performed a standardized warm-up, starting with a 5-min jog, followed by 5 min of low-intensity sprints and ending with 5 min of dynamic stretching.

2.3. Sprint Force–Velocity Profile Test

A standardized warm-up was performed before the test. Six pairs of photocells (Smart Speed; Fusion Sport, Brisbane, Australia) were positioned at the starting line and at distances of 10, 20, 25, 30 and 40 m at approximately 1.2 m high, to measure the intervals of 0–10 m, 0–20 m, 0–25 m, 0–30 m and 0–40 m [24,33]. The sprint test was conducted on an indoor running track. Participants started from a standing position 0.5 m behind the starting gate and then sprinted at full effort through the finish line, performing the test three times with a 5 min rest interval between each, and the time was recorded to the nearest 0.001 s. The sprint Fv profile characteristics (F0, V0, Pmax, Fvslope, RFmax, DRF, Vmax) were computed with the mean of three sprint split times according to Samozino’s specific spreadsheet [23,24]. The mean 0–10 m split time was used to calculated the COD deficit and asymmetry index, the process of which will be detailed later.

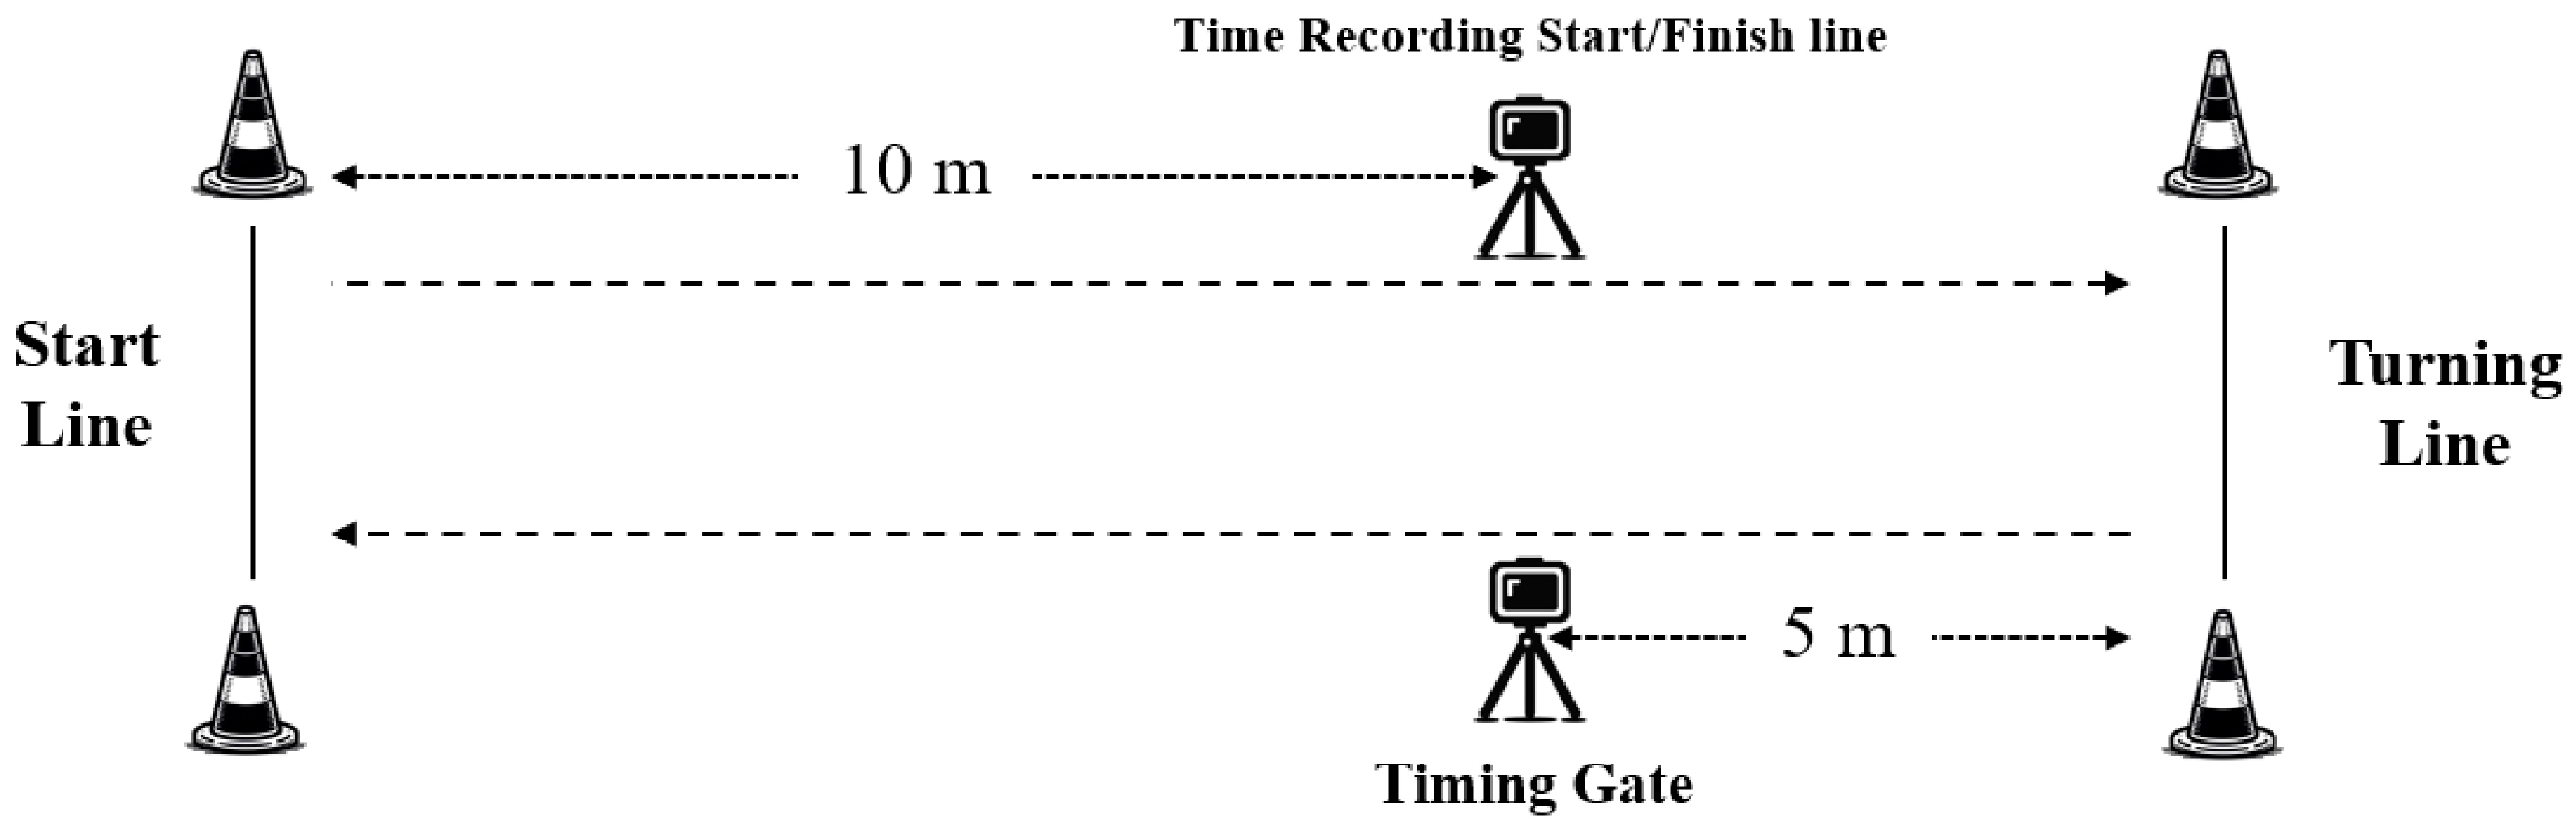
2.4. COD Performance Tests

2.4.1. Modified Agility T-Test (MAT)

A pair of photocells (Smart Speed; Fusion Sport, Brisbane, Australia) was positioned at the start line. Participants started from 0.5 m behind the starting gate and performed the MAT, which included liner sprinting and multidirectional running (Figure 1) [7]. Initially, participants completed a forward 5 m linear sprint to touch the landmark by hand, followed by a lateral, leftward shuffle for 2.5 m to touch the landmark, then a lateral, rightward shuffle for 5 m to touch the landmark, a lateral, leftward shuffle for 2.5 m to touch the middle landmark and, finally, a linear backpedal for 5 m. Each test was performed three times, and a 2 min rest interval was allowed between tests; the time was recorded to the nearest 0.001 s. The fastest times to complete the test were used for the subsequent analysis.

2.4.2. 505 COD Test

The participants were required to sprint with full effort to a line placed 15 m from the start line and performed a 180° turn, and then sprint 5 m through the finish line (Figure 2). Each participant completed six trials with 2 min of recovery between trials (three turning off the right leg and three off the left leg); the order of trials was randomized amongst the participants [16]. A pair of photocells (Smart Speed; Fusion Sport, Brisbane, Australia) was positioned at the 10 m mark, and time was recorded to the nearest 0.001 s. Participants started from 0.5 m behind the starting line, sprinted at full speed to the turning line, then performed a 180° turn with either the left or right leg randomly, and sprinted at full speed to the 5 m finish line to complete the trial. If a participant changed direction or turned off the incorrect foot before reaching the turning line, the result of that attempt would be disregarded. Participants were required to fully rest before beginning the test again [14]. The fastest times to complete the distance with each leg were calculated for the COD deficit and asymmetry index.

2.5. Data Processing

The COD deficit was calculated by subtracting the 10 m sprint from the 505 COD test time [14].The dominant (D) COD speed performance was defined as the leg side with the fastest completion time, while the non-dominant (ND) COD speed performance was the leg side with the slower completion time [14]. The COD deficit for dominant and non-dominant limbs was calculated using the following formula: 505 COD test time—10 m sprint time; the 10 m sprint time was taken from the 40 m split (the 0–10 m split time) [15,17,34]. Meanwhile, the asymmetry index was determined via the COD deficit of each leg. The COD deficit imbalance were asymmetry indices to evaluate lower limb balance during COD in participants. Calculated using the COD deficits of the D and ND limbs, the asymmetry index calculation formula is as follows: (D − ND)/D × 100 [14,34,35].

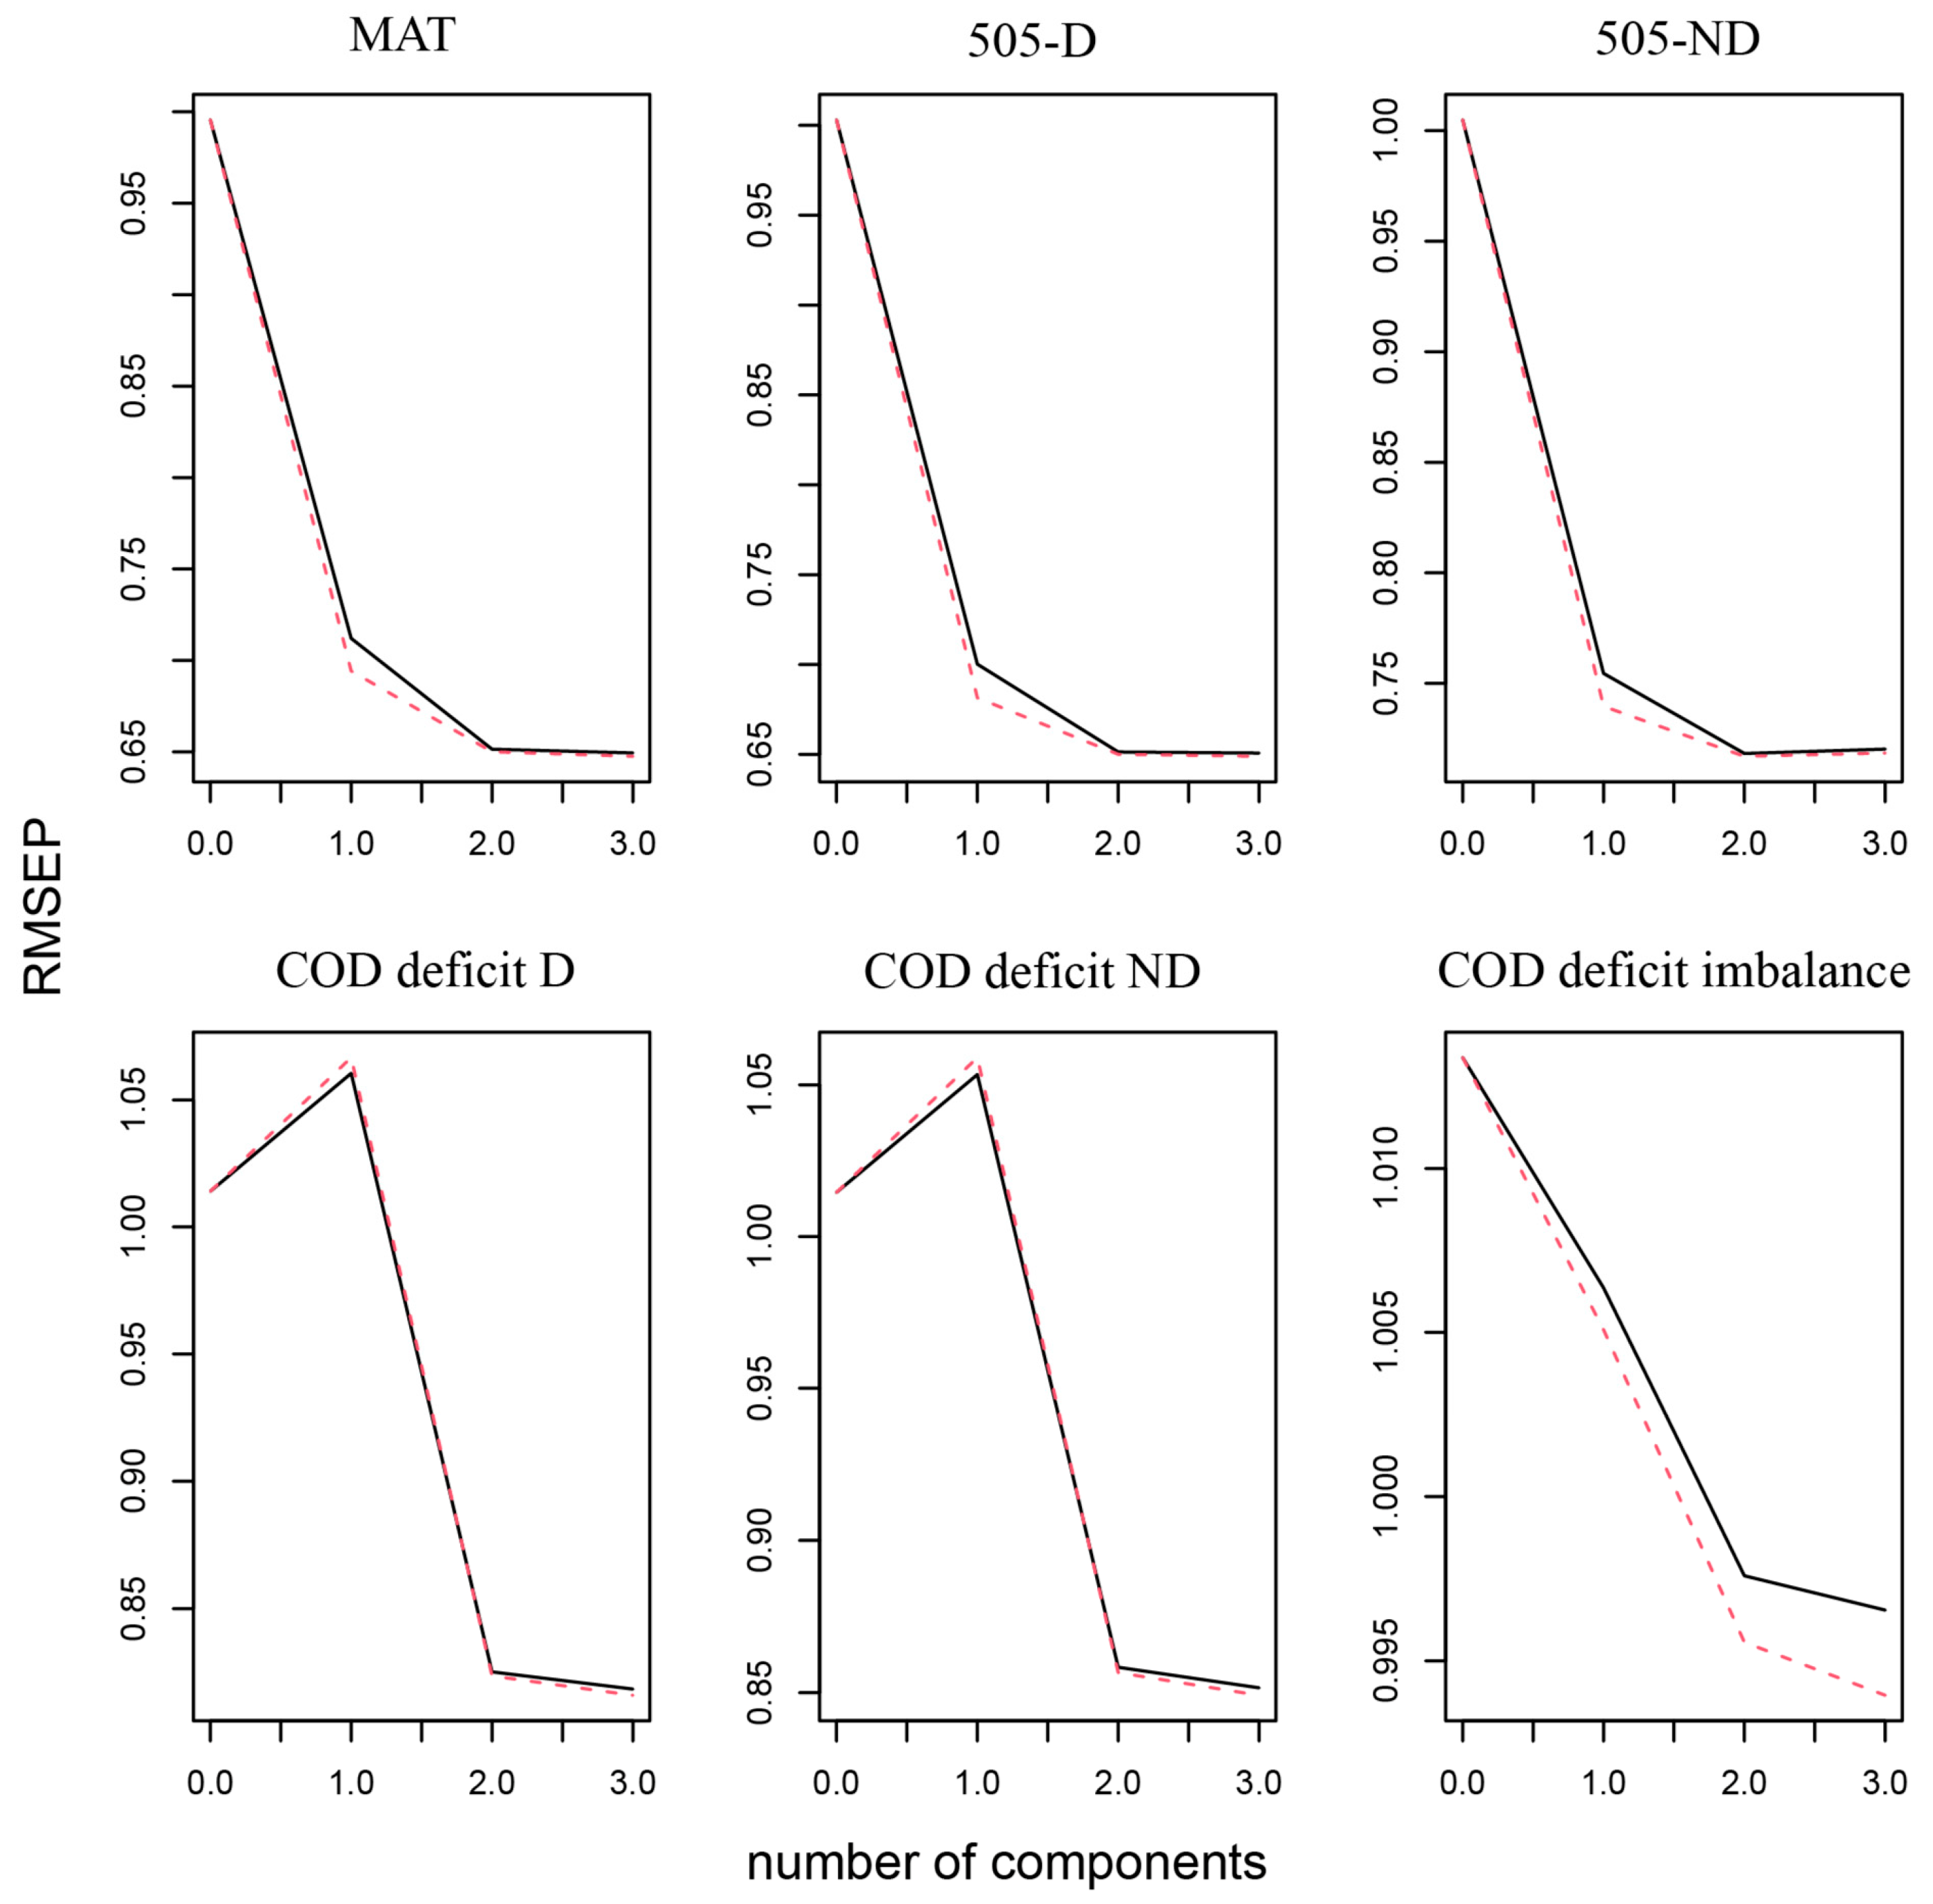
2.6. Statistical Analyses
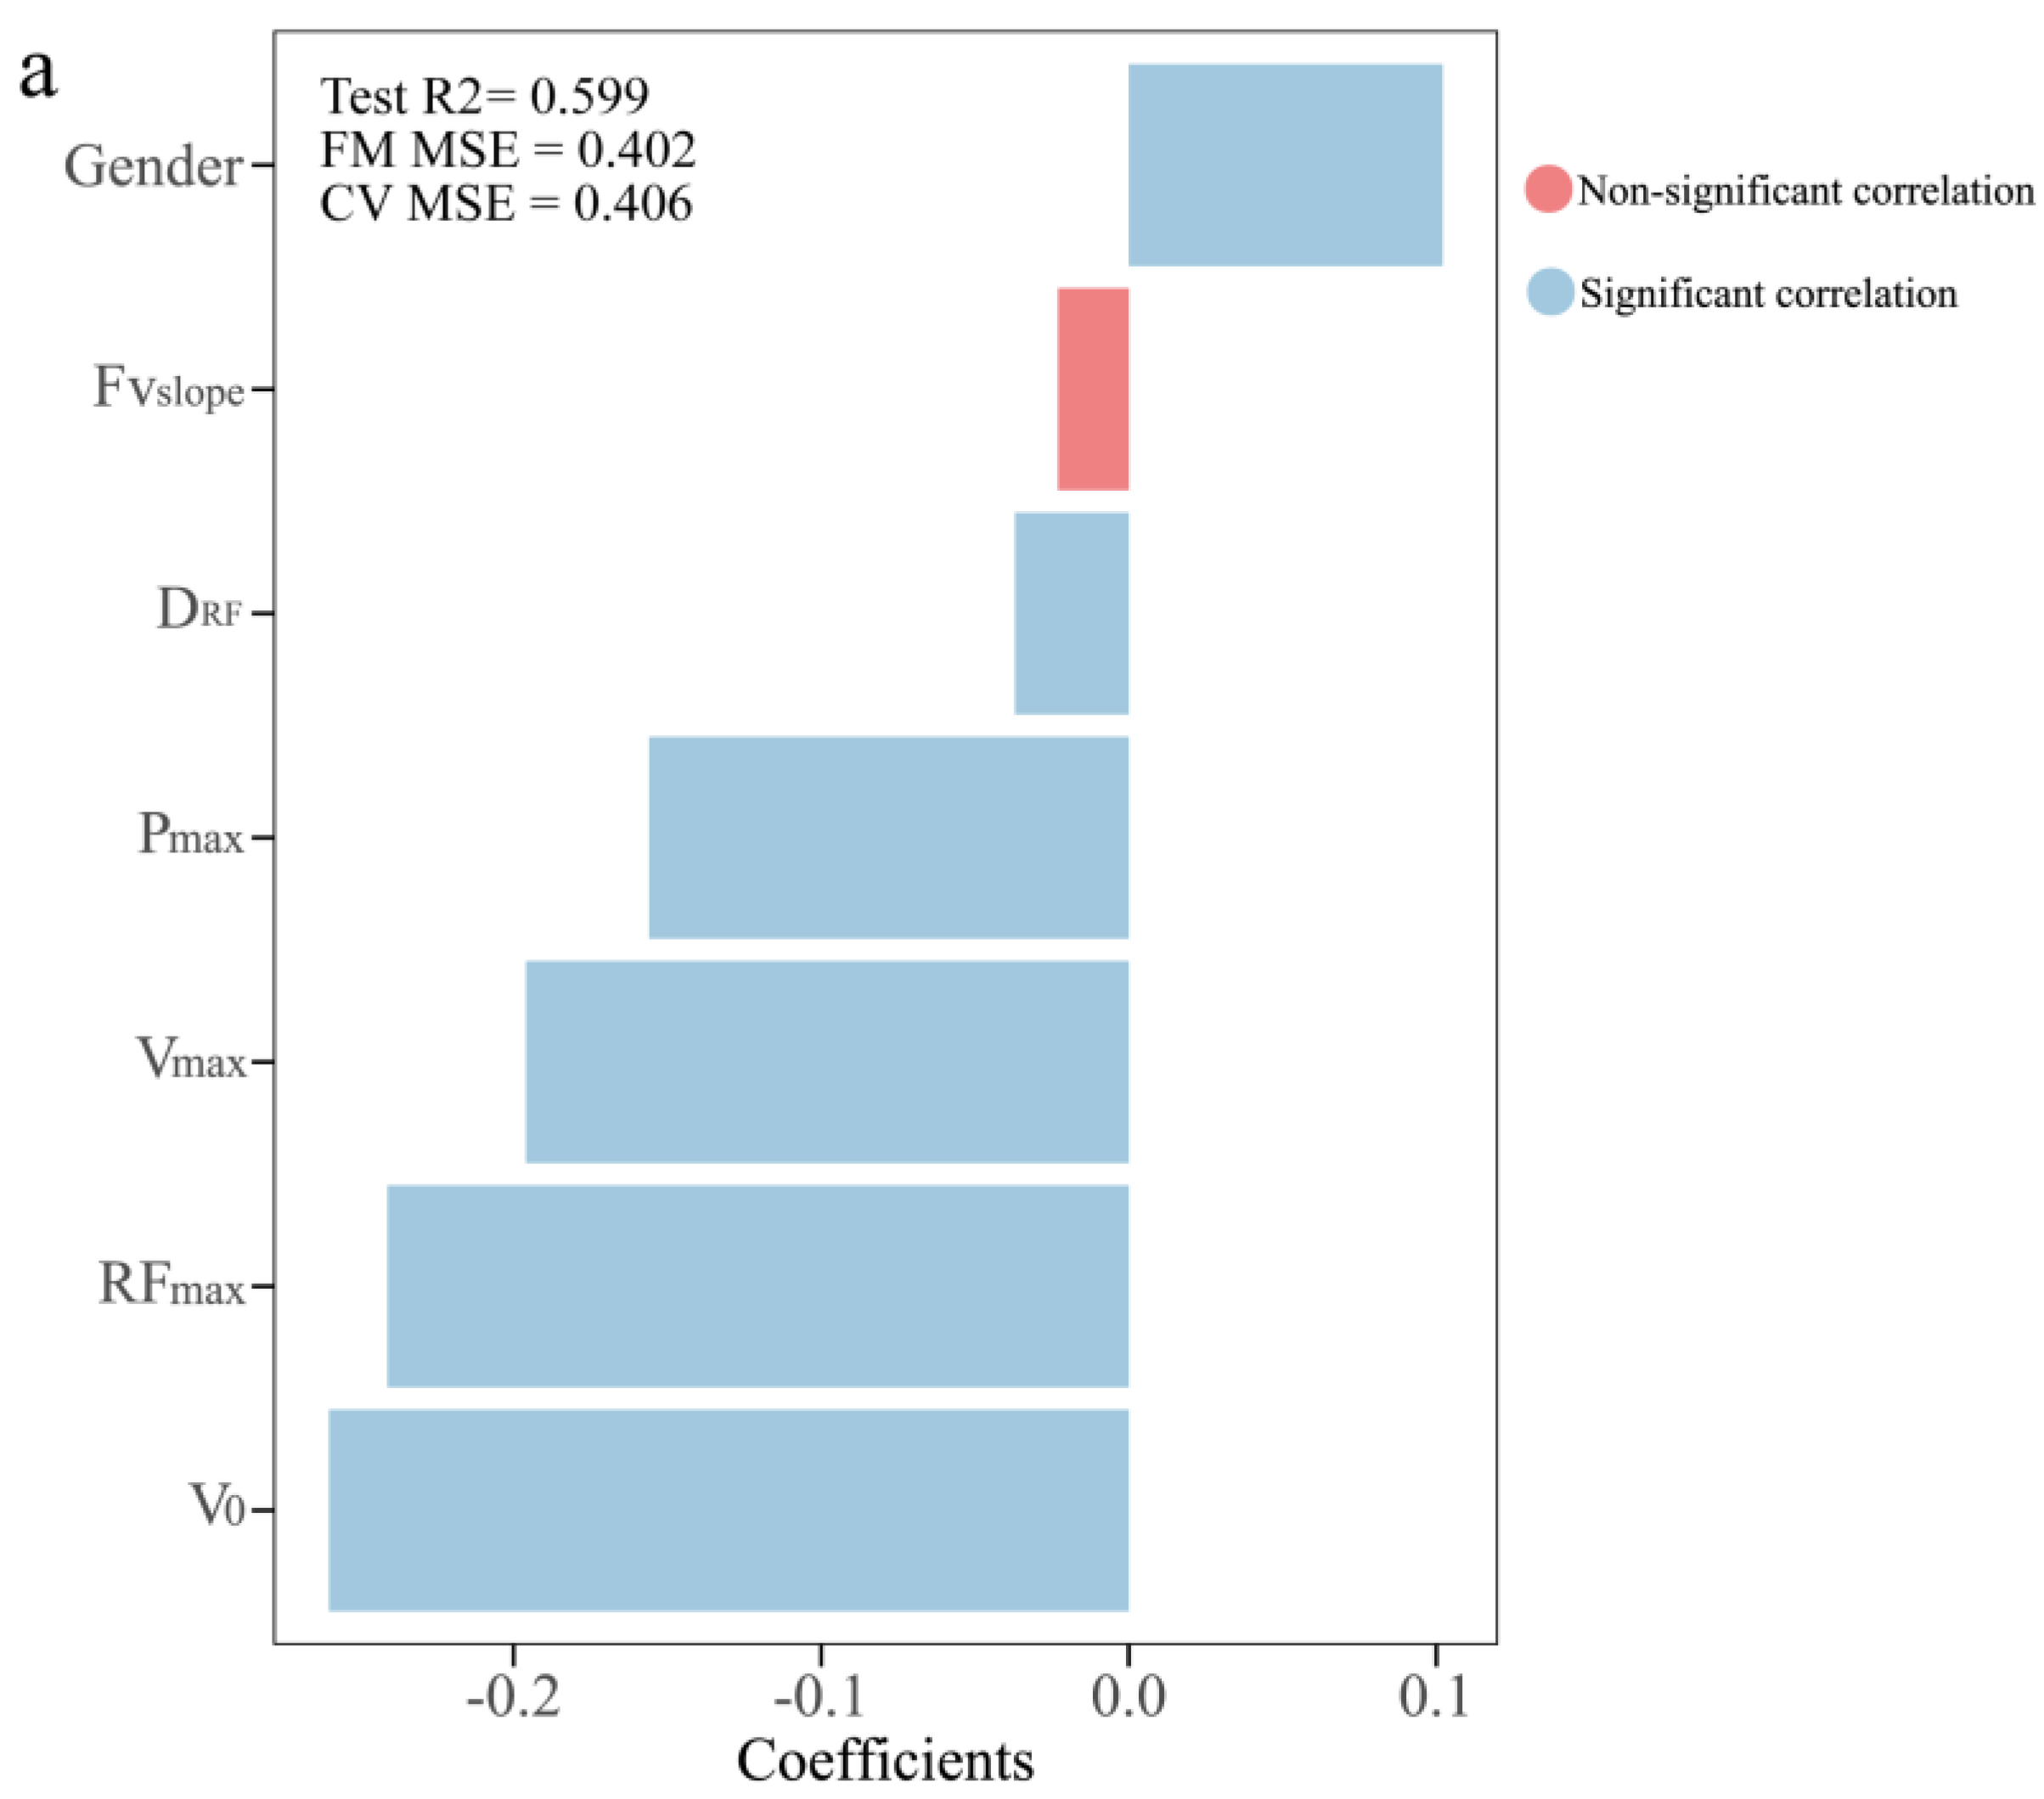
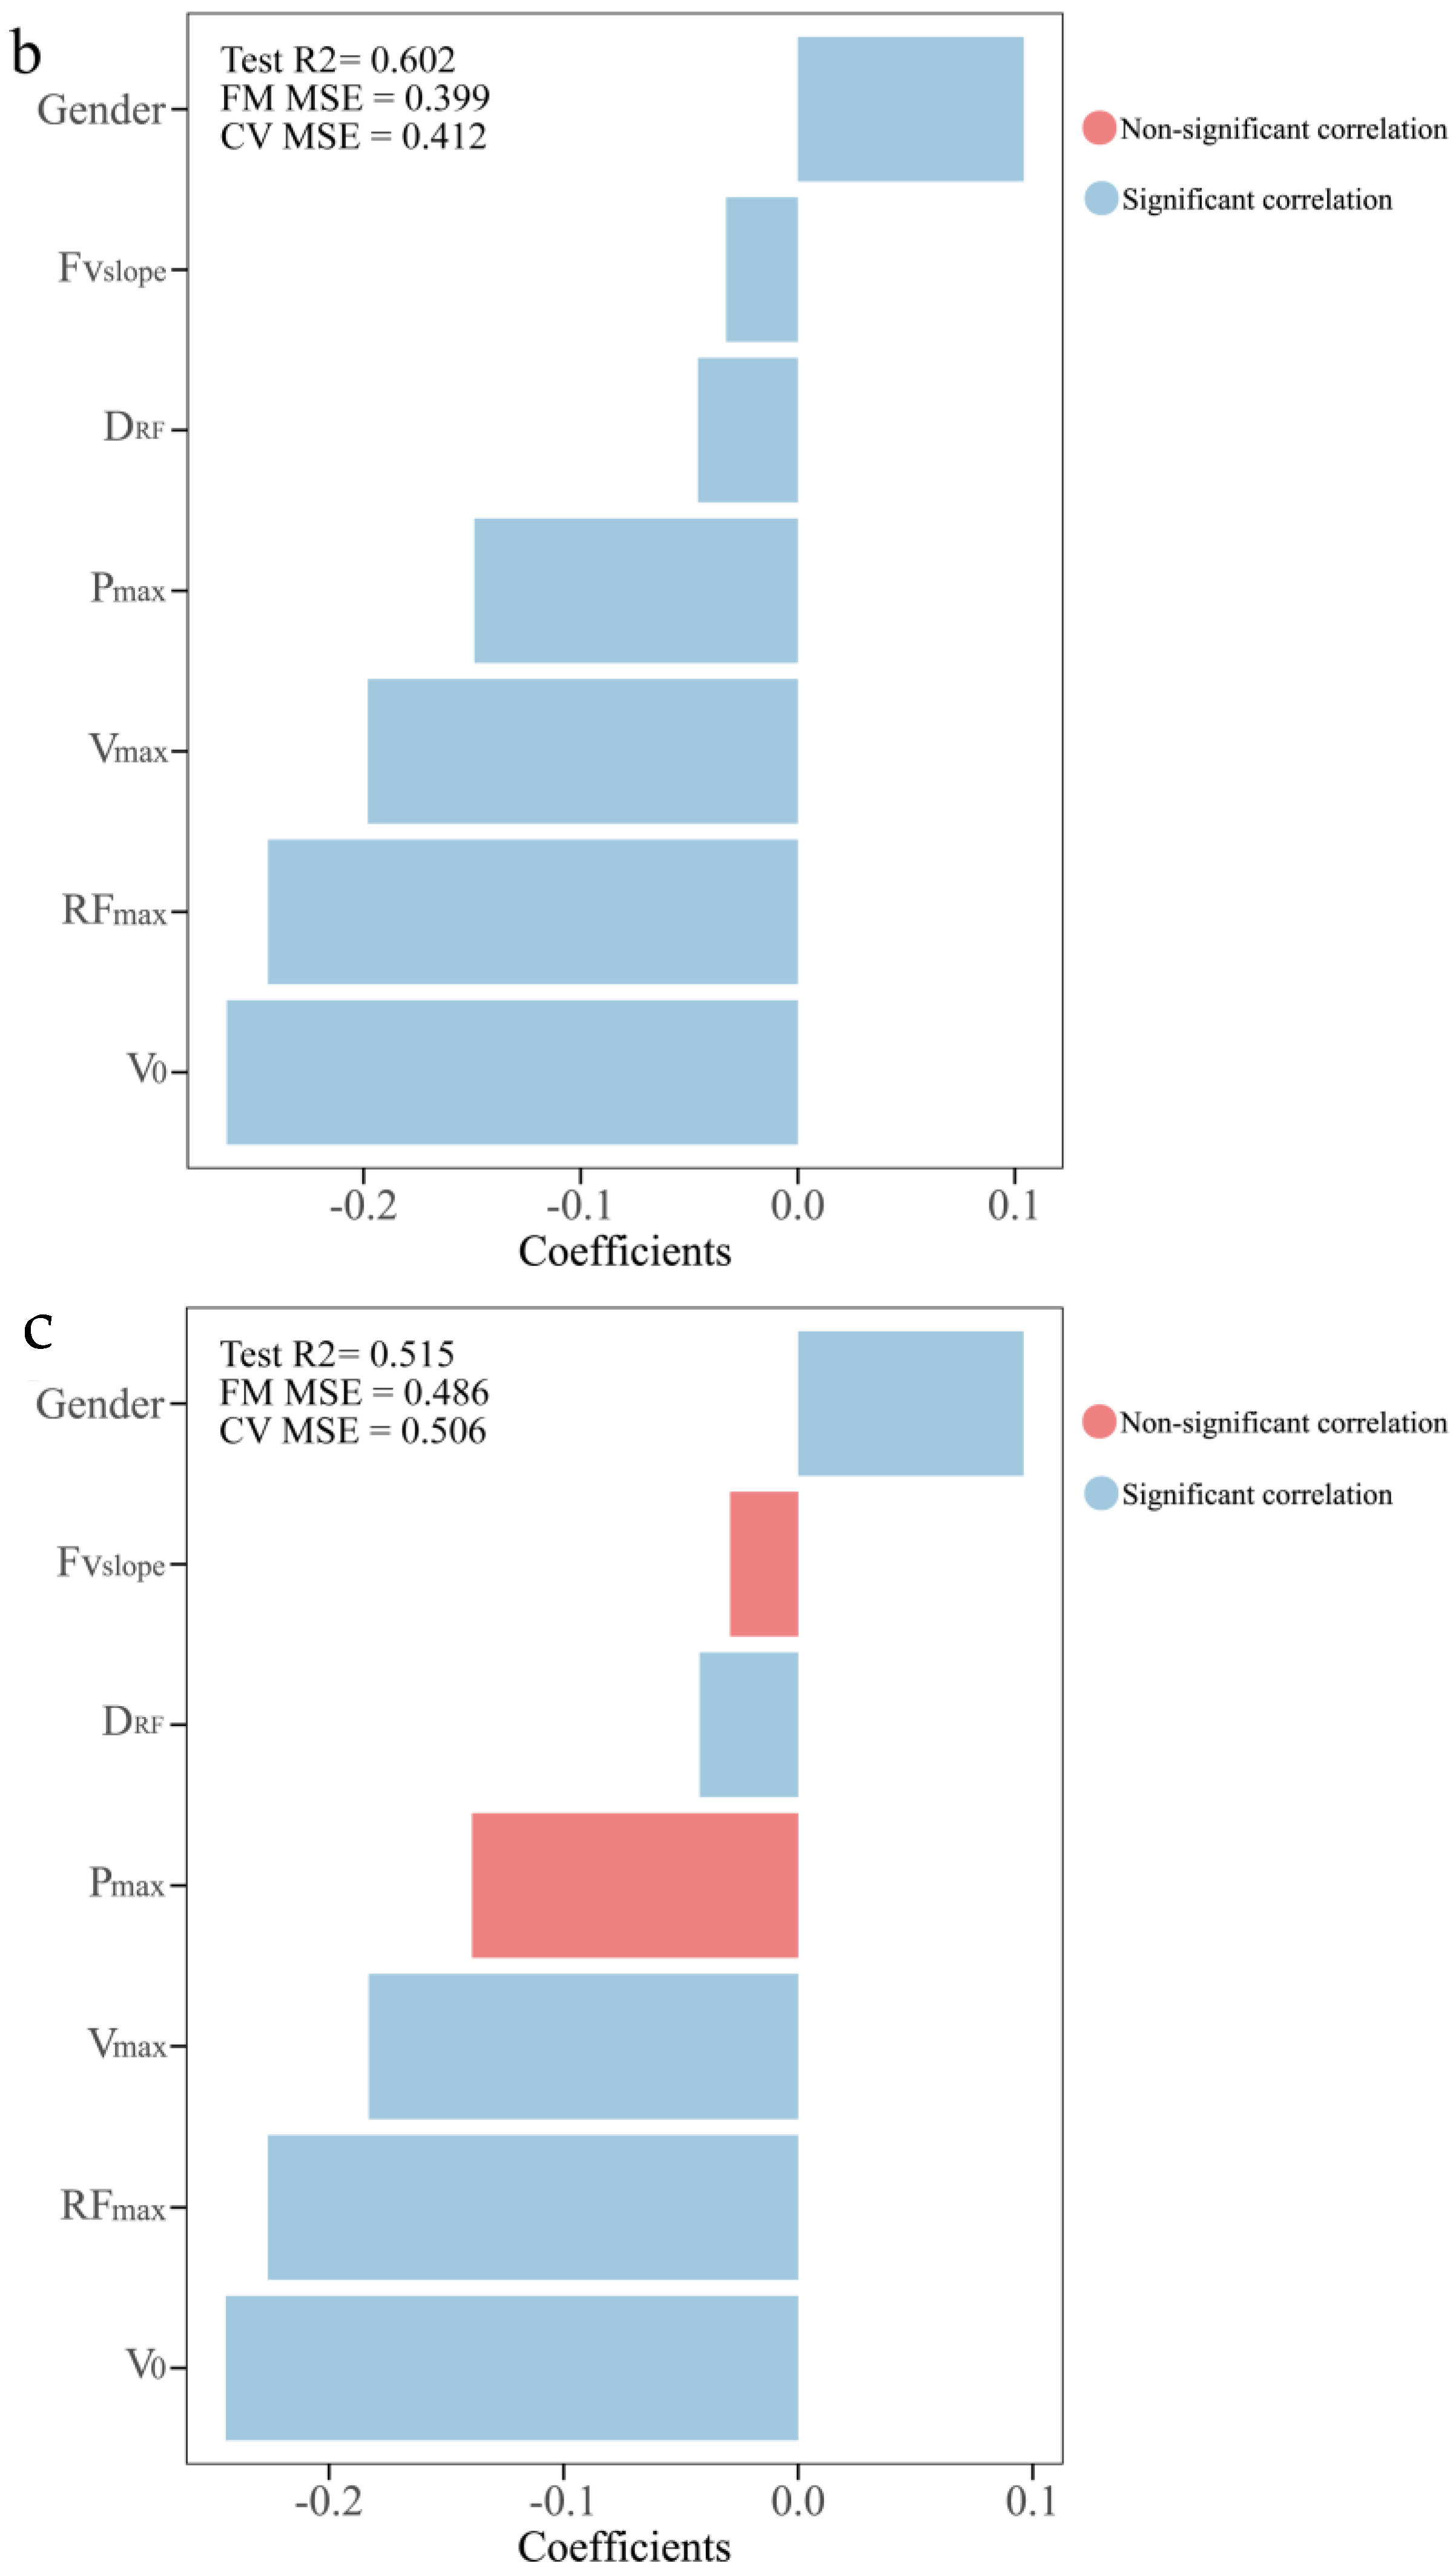
Participants’ baseline data were reported as mean ± standard deviation (SD), and other continuous variables were presented as medians with interquartile range (IQR) depending on the distribution of the data. The Shapiro–Wilk test was used to assess the normality of the variables. Collinearity was evaluated for each variable using the variance inflation factor (VIF), and variables with VIF ≥ 10 were considered collinear [36].
Due to the non-normality and multicollinearity of the datasets, a partial least squares (PLS) regression analysis was conducted. This analysis included explanatory variables from the mechanical characteristics of the Fv sprint profile (F0, V0, Pmax, RFmax, DRF, Fvslope and Vmax) and gender. It also considered COD performance indicators such as COD deficit imbalance and the completion times of the MAT, 505-D, 505-ND, COD deficit D and COD deficit ND tests as different response variables. This approach aimed to explore the deeper relationship between the Fv sprint profile and COD performance. Composite variables constructed by PLS were used to build a linear regression model to identify which of these composite variables, encompassing different potential variables, significantly predict COD performance, with a p-value < 0.050 considered significant for composite variables [37].
Different composite variables significantly predicted various response variables for COD performance. The PLS regression coefficients (β) for the original explanatory variables within these composite variables were then estimated, along with standard error (SE) and bias-corrected and accelerated (bca) 95% confidence intervals (Cls) after bootstrapping. The SE and 95%CIs for coefficients in the PLS regression were estimated using the bootstrap method, an agnostic estimation method that does not rely on model form assumptions [38,39,40]. The number of bootstrap iterations was set to 2000 [41,42]. Explanatory variables were considered significant if zero was not included in the 95% bcaCIs [43,44]. The larger the absolute value of the coefficient of an explanatory variable, the greater the influence on the response variable relative to other Fv profile explanatory variables in the composite variable [45]. The optimal number of components in the PLS regression was determined by comparing the cross-validation root mean square error of prediction (RMSEP) across different numbers of components [45]. Statistical analyses were performed using the R (version 4.3.2). The following packages were utilized:pls, ggplot2, showtext, gridExtra.

3. Results

Table 1 shows the variables within the sprint Fv and COD performance tests.
The RMSEP was plotted against the number of components used in the PLS regression analysis in Figure 3, which suggested that two components should be included in the PLS regression model (Figure 3); meanwhile, two components were chosen because adding a third component did not lead to an increased adjusted R2. Component 1 comprised a linear combination of gender, V0, Pmax, RFmax, DRF, Fvslope and Vmax, while component 2 was formed from a linear combination of F0, Pmax, RFmax, DRF and Fvslope.
Table 2 presents results from a linear model predicting COD performance using two PLS components. The results revealed that the effect of component 1 was significantly negatively associated with the performance of MAT, 505-D and 505-ND (p < 0.05). The effect of component 2 was significantly positively associated with COD deficit D and COD deficit ND (p < 0.05). Additionally, the effects of components 1 and 2 were both significantly correlated with COD deficit imbalance (p < 0.05).
Figure 4 and Figure 5 present the relationship between the sprint Fv profile variables and COD performance in PLS regression. Figure 4 displays the correlations between the response variables significantly related to component 1 and the explanatory variables that composed component 1 in the PLS model. Gender (95% bcaCl = [0.08 to 0.13], [0.08 to 0.13], [0.07 to 0.12]) was significantly correlated with COD performance variables (MAT, 505-D and 505-ND). In contrast, V0 (95% bcaCl = [−0.30 to −0.21], [ −0.30 to −0.21], [−0.29 to −0.19]), RFmax (95% bcaCl = [−0.28 to −0.20], [−0.29 to −0.20], [−0.27 to −0.17]), Vmax (95% bcaCl = [−0.23 to −0.16], [−0.23 to −0.16], [−0.22 to −0.15]) and DRF (95% bcaCl = [−0.07 to −0.01], [−0.08 to −0.02], [−0.08 to −0.02]) showed significant negative correlations with COD performance variables (MAT, 505-D and 505-ND). The V0 was the most influential variable negatively associated with COD performance variables (β = −0.260, −0.263 and −0.244 for MAT, 505-D and 505-ND, respectively), followed by RFmax, Vmax, gender and DRF.
Figure 5a,b show the correlations between the response variables significantly related to component 2 and the explanatory variables that comprised component 2 in the PLS model. Except for RFmax, all the variables had significant associations with COD performance. F0 (95% bcaCl = [0.13 to 0.22], [0.12 to 0.22]) and Pmax (95% bcaCl = [0.11 to 0.21], [0.11 to 0.22]) were significantly positively associated with COD performance variables (COD deficit D and COD deficit ND), while DRF (95% bcaCl = [−0.21 to −0.12], [−0.19 to −0.10]) and Fvslope (95% bcaCl = [−0.21 to −0.13], [−0.20 to −0.11]) were negatively significant associated with COD performance variables (COD deficit D and COD deficit ND). The effect of F0 (β = 0.169, 0.163) on the COD performance variables (COD deficit D and COD deficit ND) was slightly larger than the effects of Fvslope (β = −0.162, −0.146), DRF (β = −0.159, −0.142) and Pmax (β = −0.162, −0.146).
Figure 5c displays the correlations between the response variables significantly related to two components and the explanatory variables that comprised these two components in the PLS model. Gender (95% bcaCl = [0.00 to 0.60]) and F0 (95% bcaCl = [0.00 to 0.10]) were significantly positively associated with COD deficit imbalance, while DRF (95% bcaCl = [−0.12 to −0.03]) and Fvslope (95% bcaCl = [−0.11 to −0.02]) were significantly negatively associated with COD deficit imbalance. The DRF (β = −0.070) was the most influential variable followed by Fvslope (β = −0.068), F0 (β = 0.046) and gender (β = 0.031).

4. Discussion

This aim of this study was to evaluate associations between sprint force–velocity profile variables and COD performance and to investigate the impact of these variables on the asymmetries in COD speed performance for basketball and volleyball players using PLS regression analysis. The main findings indicated that, within the Fv profile variables, V0 and RFmax were significant predictors affecting performance in COD movement patterns that included linear sprints, while F0, Pmax, DRF and Fvslope were significant predictors impacting COD deficit. DRF and Fvslope were significant predictors for assessing asymmetry in COD speed performance using the COD deficit time. Sprint Fv profile variables appeared to be helpful in explaining COD capability.
The MAT and 505 COD test involved athletes performing a linear sprint before initiating a COD movement at angles of 90° and 180°, followed by a subsequent linear sprint [7,14]. The COD deficit was calculated by subtracting the time for a 10 m sprint from the total 505 COD test time, which independently evaluates the performance of the COD movement [16]. This might also have been the reason why the predictive variables for COD deficit and 505 COD test time differ in this study. Studies have shown that the speeds of 10 m and 30 m linear sprints significantly impacted the total time of the 505 COD test. Meanwhile, in the MAT, both COD speed and linear sprinting jointly determine the final MAT time [16,46]. Linear sprinting involves the movement of the body’s center of mass (CoM); the forward acceleration of the CoM from one step to another is directly related to the net force developed by the athlete onto the ground in the horizontal, anteroposterior direction. Research has shown that greater agility and T-test athletes demonstrated significantly greater propulsive impulse compared with slower athletes. Faster athletes during the modified 505 test produced greater horizontal propulsive force in shorter ground contact times, and under constant conditions, the greater the net horizontal force relative to body weight, the higher the forward acceleration of the body, and the anteroposterior force was identified as a critical factor in enhancing sprint acceleration and related performance metrics [47,48,49]. Studies indicated that while the acceleration phase was highly related to V0, as well as to averaged velocity and power measured in the forward direction obtained in the Fv relationship, F0 was not significantly correlated with performance parameters during the acceleration phase. Additionally, the Fv relationship showed that elite sprinters are able to produce higher horizontal force than sub-elite sprinters at any velocity [50]. Therefore, RFmax and V0 were particularly important factors affecting the performance of COD movement patterns that included linear sprints.
In badminton, boys performed better than girls in the modified 505 test [51]. And in rugby, male athletes significantly outperformed female athletes in all COD tests (5-10-5, L-drill) [52]. Similar to these findings, we found that the times for the MAT as well as the 505 COD tests for dominant and non-dominant legs showed a significant positive correlation with gender, with males having shorter times than females; this may be related to differences between males and females in muscle cross-sectional area and the capacity to recruit muscle fibers [53,54]. Another study examining the impact of gender on the correlation between sprint Fv variables and COD capability in basketball players indicated that F0, RFmax and Pmax affected the 505-D and 505-ND performance of both male and female basketball players, and V0 was also significantly correlated with 505-D and 505-ND performance in female basketball players [32]. In a study examining the relationship between the Fv profile and linear sprint and COD performance across multiple sports (soccer, tennis and basketball), the 505-D and 505-ND times were significantly negatively correlated with sprint Fv-related variables F0, V0 and Pmax [31]. These results were generally consistent with the findings of the present experiment, except for the correlation with the variable F0, which may be due to differences in the team sports, as the sports in this study focused on team sports with intensive directional changes on smaller fields.
When independently evaluating the 180° COD ability using the COD deficit metric, it was found that F0 and Pmax were negatively correlated with COD capability, while DRF and Fvslope were positively correlated. When changing direction, athletes had to rapidly apply force during the braking phase (eccentric), plant phase (isometric) and propulsive phase (concentric) of movement [47]. Braking and propulsive forces are crucial factors affecting the performance of 180° COD movements. In the COD 505 test, faster athletes produced significantly greater braking and propulsive force compared with slower athletes [47]. Increasing force application during the braking and propulsive phases of COD movements has been shown to increase exit and starting velocities during the COD movement because muscles initially underwent eccentric contractions and were passively elongated to do negative work, which increased the storage of mechanical energy in their elastic components. Subsequently, they performed concentric contractions, enabling the muscles to provide significant braking and propulsive force during COD movements [49]. Moreover, studies have shown that compared to 90° changes of direction, 180° changes require more braking and propulsive time [47]. Consequently, in 180° COD movements, athletes need to maintain sufficient braking and propulsive force over a longer contact time (braking time and propulsive time) to ensure a smooth 180° COD. Thus, a smaller absolute value of DRF can reduce COD deficit, improving performance in 180° COD movements. In basketball players, DRF was significantly negatively correlated with the COD deficit in female basketball players and the dominant leg COD deficit in male basketball players, which is generally consistent with the findings of this study [32].
Research has found that faster youth netball athletes had longer COD deficit times and may not have had the capability to efficiently decelerate, change direction by 180° and reaccelerate, and that eccentric strength was essential for COD ability, especially during the braking phase [15,55]. While F0 may optimize performance in linear sprints, it is not entirely applicable to COD movements. Additionally, a higher F0 might lead to propulsive force exceeding braking force, thus requiring athletes to recruit more neuromuscular fibers during the braking phase to generate greater eccentric force for deceleration, which, in turn, increases COD deficit time. Furthermore, an increase in F0 also increases Pmax; hence, higher values of both F0 and Pmax were associated with a higher COD deficit. One study indicated that a higher F0 was associated with a lower COD deficit, while another study showed that a higher F0 was associated with a higher COD deficit on the right leg [30,32]. This discrepancy could be due to differences in the COD techniques of the participants in the experiments. Training should focus on both strength and skill enhancement to increase the utilization rate of F0 during a 180° COD. The Fvslope indicates an athlete’s acceleration performance, with a theoretical optimal slope that can maximize acceleration performance and thus minimize COD time. An Fvslope that is too high compared to the optimal slope can reduce the ability to maintain horizontal force, while too low a slope can decrease the average horizontal output power, both affecting the athlete’s performance [33]. In this study, a smaller absolute value of Fvslope was associated with a better COD deficit. This result aligns with the significant correlation found between higher F0 and poorer COD deficit, as a higher F0 corresponds to a larger absolute value of Fvslope. One possible explanation is that, although a high F0 increases output force, it lacks the capacity to maintain force under high-intensity output.
A study examining the association between Fv profile variables and specific performance metrics in volleyball players indicated that F0, Fvslope and RFmax were significantly correlated with COD deficit performance. COD right deficit was significantly correlated with DRF, and Pmax obtained during sprints was closely related to 505 left performance, but not significantly related to 505 right [30]. This was generally consistent with our results; however, in our study, the predictors for dominant and non-dominant legs under COD deficit assessment showed better uniformity. Similarly, another study found that female collegiate soccer athletes performing a COD (cutting) task with their dominant and non-dominant legs exhibited similar movement patterns [55]. Meanwhile, our findings revealed the predictors for the dominant and non-dominant sides showed differences in Pmax during the total 505 COD time evaluation, reflecting the variations in the ability of the two legs to generate horizontal force across the entire speed range. This discrepancy may have been caused by uneven force production by the legs during linear sprints.
COD deficit asymmetries, which independently evaluate asymmetries in COD speed performance, could be interpreted as a deficiency in COD ability on one side, indicating that an athlete has a faster or slower side when performing a 180° COD [15]. This is disadvantageous for multidirectional sports, as proficiently changing direction from both limb directions equally could enhance performance in gameplay like basketball and volleyball. Our findings revealed that COD deficit asymmetries were significantly negatively correlated with DRF and Fvslope. However, the effect size of the PLS regression was insufficient. Currently, only one study has investigated the relationship between lower limb asymmetry in jumping and the force–velocity profile. The study indicated that there was no or a very low linear relationship between the isokinetic knee force–velocity profile and unilateral jumps in basketball players [56]. Assessments should consider specific COD in gameplay, including angles and whether they include certain short-distance linear sprints, to determine the asymmetry in COD speed performance and influencing factors [2]. Currently, no studies have reported on the relationships between asymmetries in COD speed performance and Fv profile variables. A study on lower limb injuries has reported that gender plays a significant role in knee joint mechanics during COD tasks (cutting and pivoting) and was one of the risk factors for knee injuries [57]. Consistent with the results of this study, gender was a significant predictor affecting COD deficit imbalance.
This study has limitations that must be highlighted. Firstly, it is a cross-sectional study, and these results require further comparison in future prospective studies to assess whether COD performance can be enhanced by optimizing Fv profile-related variables. Secondly, COD movements on the sports field are complex processes. Our finding has already explored the association between maximum force and maximum horizontal force produced during sprints and COD performance. Future research can combine biomechanical analysis to explore the relationships between mechanical characteristics, such as the penultimate and final foot contacts in COD performance, and the sprint Fv profile variables. Lastly, we conducted a preliminary analysis of the relationships between asymmetries in COD speed performance and sprint Fv profile variables. Future research can refine the analysis of Fv profile variables and asymmetries by incorporating biomechanical analysis.

5. Conclusions

Investigating the relationships between COD ability and sprint Fv profile variables in team sports played on smaller courts, such as basketball and volleyball, can provide new insights for personalized training based on sprint mechanical characteristics to enhance COD performance. According to our findings, RFmax and V0 among the sprint Fv profile variables are significantly associated with COD performance that includes linear sprints, while DRF, Fvslope, F0 and Pmax collectively affect the 180° COD performance. Concurrently, the DRF and Fvslope within sprint Fv profile variables can partly explain asymmetries in COD speed performance. In the future, training interventions could be tailored by identifying the specific COD performance patterns, including the angle of change and the distance of the linear sprint, by determining the related sprint Fv profile variables, thereby providing guidance for enhancing specific COD performance.

6. Practical Application

Current research evidence suggests that developing personalized training based on force–velocity (Fv) profile variables to improve change of direction (COD) performance in basketball and volleyball players may be an effective option for coaches and researchers. This study also innovatively explores the correlation between sprint lower limb asymmetry and the sprint force–velocity profile in basketball and volleyball athletes. Among the assessed subjects, asymmetries in COD performance were indeed present. The results of this study provide preliminary theoretical evidence supporting the use of Fv profile-based personalized training by coaches to reduce asymmetries in COD performance.

Author Contributions

Z.Z. conceived and designed the study, conducted testing, collected and analyzed the data and drafted the manuscript. M.J. and Y.J. recruited participants, conducted testing and collected and analyzed the data. M.L. recruited participants, conducted testing and assisted in drafting the manuscript. X.Y. contributed to the conception and design of the study and critically reviewed the manuscript. Y.L. contributed to the writing and revision of the manuscript and approved the final version for submission. All authors have read and agreed to the published version of the manuscript.

Funding

Funding for this study was provided by the Hebei Sport University Project on Technology Innovation Platform Construction for the Integration of Sports and Health (No. 285748) and the Central University Basic Research Fund of China (No. 2024TNJN010).

Institutional Review Board Statement

The study was conducted in accordance with the Declaration of Helsinki, and was approved by the ethics committee of Beijing Sport University (approval number 2023211H, and the approval date was 10 October 2023).

Informed Consent Statement

Informed consent was obtained from all subjects involved in the study.

Data Availability Statement

The data of this study are available from the author upon request.

Acknowledgments

The author would like to thank Xiaolin Yang for assistance with experimental testing and data collecting.

Conflicts of Interest

The authors have no conflicts of interest to declare, and this study complies with the current laws of the country where it was conducted.

References

  1. Scanlan, A.T.; Madueno, M.C.; Guy, J.H.; Giamarelos, K.; Spiteri, T.; Dalbo, V.J. Measuring Decrement in Change-of-Direction Speed Across Repeated Sprints in Basketball: Novel vs. Traditional Approaches. J. Strength Cond. Res. 2021, 35, 841–845. [Google Scholar] [CrossRef] [PubMed]
  2. Gonzalo-Skok, O.; Dos’Santos, T.; Bishop, C. Assessing Limb Dominance and Interlimb Asymmetries Over Multiple Angles During Change of Direction Speed Tests in Basketball Players. J. Strength Cond. Res. 2023, 37, 2423–2430. [Google Scholar] [CrossRef] [PubMed]
  3. Lockie, R.G.; Dawes, J.J.; Callaghan, S.J. Lower-body power, linear speed, and change-of-direction speed in division I collegiate women’s volleyball players. Biol. Sport 2020, 37, 423–428. [Google Scholar] [CrossRef]
  4. Scanlan, A.; Dascombe, B.; Reaburn, P. A comparison of the activity demands of elite and sub-elite Australian men’s basketball competition. J. Sports Sci. 2011, 29, 1153–1160. [Google Scholar] [CrossRef]
  5. Willberg, C.; Kohler, A.; Zentgraf, K. Construct Validity and Applicability of a Team-Sport-Specific Change of Direction Test. J. Hum. Kinet. 2023, 85, 115–126. [Google Scholar] [CrossRef]
  6. Williams, M.N.C.; Wen, N.; Pyne, D.B.; Ferioli, D.; Conte, D.; Dalbo, V.J.; Scanlan, A.T. Anthropometric and Power-Related Attributes Differ Between Competition Levels in Age-Matched Under-19-Year-Old Male Basketball Players. Int. J. Sports Physiol. Perform. 2022, 17, 562–568. [Google Scholar] [CrossRef]
  7. Scanlan, A.T.; Wen, N.; Pyne, D.B.; Stojanović, E.; Milanović, Z.; Conte, D.; Vaquera, A.; Dalbo, V.J. Power-Related Determinants of Modified Agility T-test Performance in Male Adolescent Basketball Players. J. Strength Cond. Res. 2021, 35, 2248–2254. [Google Scholar] [CrossRef]
  8. Martín-López, J.; Sedliak, M.; Valadés, D.; Muñoz, A.; Buffet-García, J.; García-Oviedo, R.; Rodríguez-Aragón, M.; Pérez-López, A.; López-Samanes, Á. Impact of time-of-day and chronotype on neuromuscular performance in semi-professional female volleyball players. Chronobiol. Int. 2022, 39, 1006–1014. [Google Scholar] [CrossRef]
  9. Sekulic, D.; Spasic, M.; Mirkov, D.; Cavar, M.; Sattler, T. Gender-Specific Influences of Balance, Speed, and Power on Agility Performance. J. Strength Cond. Res. 2013, 27, 802–811. [Google Scholar] [CrossRef]
  10. Wen, N.; Dalbo, V.J.; Burgos, B.; Pyne, D.B.; Scanlan, A.T. Power Testing in Basketball: Current Practice and Future Recommendations. J. Strength Cond. Res. 2018, 32, 2677–2691. [Google Scholar] [CrossRef]
  11. Pleša, J.; Kozinc, Ž.; Šarabon, N. Bilateral Deficit in Countermovement Jump and Its Influence on Linear Sprinting, Jumping, and Change of Direction Ability in Volleyball Players. Front. Physiol. 2022, 13, 768906. [Google Scholar] [CrossRef] [PubMed]
  12. Nimphius, S.; Spiteri, T.; Geib, G.; Carlisle, D. “Change of direction deficit” measurement in Division I American football players. J. Aust. Strength Cond. 2013, 21, 115–117. [Google Scholar]
  13. Amoako-Sakyi, D.; Obiri-Yeboah, D.; Ofosu, A.; Kusi, K.A.; Osei, K.; Adade, R.; Aniakwaa-Bonsu, E.; Quansah, R.; Arko-Mensah, J.; Amoah, B.Y.; et al. Preponderance of vaccine-preventable diseases hotspots in northern Ghana: A spatial and space-time clustering analysis from 2010 to 2014. BMC Public Health 2022, 22, 1899. [Google Scholar] [CrossRef]
  14. Henríquez, M.; Peña-González, I.; Albaladejo-García, C.; Sadarangani, K.P.; Reina, R. Sex differences in change of direction deficit and asymmetries in footballers with cerebral palsy. Scand. J. Med. Sci. Sports 2023, 33, 1519–1530. [Google Scholar] [CrossRef]
  15. DosʼSantos, T.; Thomas, C.; Jones, P.A.; Comfort, P. Assessing Asymmetries in Change of Direction Speed Performance: Application of Change of Direction Deficit. J. Strength Cond. Res. 2019, 33, 2953–2961. [Google Scholar] [CrossRef]
  16. Nimphius, S.; Callaghan, S.J.; Spiteri, T.; Lockie, R.G. Change of Direction Deficit: A More Isolated Measure of Change of Direction Performance Than Total 505 Time. J. Strength Cond. Res. 2016, 30, 3024–3032. [Google Scholar] [CrossRef]
  17. Bishop, C.; Weldon, A.; Hughes, J.; Brazier, J.; Loturco, I.; Turner, A.; Read, P. Seasonal Variation of Physical Performance and Inter-limb Asymmetry in Professional Cricket Athletes. J. Strength Cond. Res. 2021, 35, 941–948. [Google Scholar] [CrossRef]
  18. Lockie, R.G.; Callaghan, S.J.; Berry, S.P.; Cooke, E.R.A.; Jordan, C.A.; Luczo, T.M.; Jeffriess, M.D. Relationship Between Unilateral Jumping Ability and Asymmetry on Multidirectional Speed in Team-Sport Athletes. J. Strength Cond. Res. 2014, 28, 3557–3566. [Google Scholar] [CrossRef]
  19. Spiteri, T.; Binetti, M.; Scanlan, A.T.; Dalbo, V.J.; Dolci, F.; Specos, C. Physical Determinants of Division 1 Collegiate Basketball, Women’s National Basketball League, and Women’s National Basketball Association Athletes: With Reference to Lower-Body Sidedness. J. Strength Cond. Res. 2019, 33, 159–166. [Google Scholar] [CrossRef]
  20. Gonzalo-Skok, O.; Tous-Fajardo, J.; Suarez-Arrones, L.; Arjol-Serrano, J.L.; Casajús, J.A.; Mendez-Villanueva, A. Single-Leg Power Output and Between-Limbs Imbalances in Team-Sport Players: Unilateral Versus Bilateral Combined Resistance Training. Int. J. Sports Physiol. Perform. 2017, 12, 106–114. [Google Scholar] [CrossRef]
  21. Taylor, J.B.; Nguyen, A.-D.; Westbrook, A.E.; Trzeciak, A.; Ford, K.R. Women’s College Volleyball Players Exhibit Asymmetries During Double-Leg Jump Landing Tasks. J. Sport Rehabil. 2023, 32, 85–90. [Google Scholar] [CrossRef] [PubMed]
  22. Haugen, T.A.; Breitschädel, F.; Seiler, S. Sprint mechanical variables in elite athletes: Are force-velocity profiles sport specific or individual? PLoS ONE 2019, 14, e0215551. [Google Scholar] [CrossRef] [PubMed]
  23. Samozino, P.; Rabita, G.; Dorel, S.; Slawinski, J.; Peyrot, N.; Saez De Villarreal, E.; Morin, J.B. A simple method for measuring power, force, velocity properties, and mechanical effectiveness in sprint running. Scand. J. Med. Sci. Sports 2016, 26, 648–658. [Google Scholar] [CrossRef]
  24. Haugen, T.A.; Breitschädel, F.; Samozino, P. Power-Force-Velocity Profiling of Sprinting Athletes: Methodological and Practical Considerations When Using Timing Gates. J. Strength Cond. Res. 2020, 34, 1769–1773. [Google Scholar] [CrossRef]
  25. Barrera-Domínguez, F.J.; Almagro, B.J.; Sáez De Villarreal, E.; Molina-López, J. Effect of individualised strength and plyometric training on the physical performance of basketball players. Eur. J. Sport Sci. 2023, 23, 2379–2388. [Google Scholar] [CrossRef]
  26. Lindberg, K.; Lohne-Seiler, H.; Fosstveit, S.H.; Sibayan, E.E.; Fjeller, J.S.; Løvold, S.; Kolnes, T.; Vårvik, F.T.; Berntsen, S.; Paulsen, G.; et al. Effectiveness of individualized training based on force–velocity profiling on physical function in older men. Scand. J. Med. Sci. Sports 2022, 32, 1013–1025. [Google Scholar] [CrossRef]
  27. Baena-Raya, A.; Rodríguez-Pérez, M.A.; Jiménez-Reyes, P.; Soriano-Maldonado, A. Maximizing Acceleration and Change of Direction in Sport: A Case Series to Illustrate How the Force-Velocity Profile Provides Additional Information to That Derived from Linear Sprint Time. Int. J. Environ. Res. Public Health 2021, 18, 6140. [Google Scholar] [CrossRef]
  28. Zhang, Q.; Pommerell, F.; Owen, A.; Trama, R.; Martin, C.; Hautier, C.A. Running patterns and force-velocity sprinting profiles in elite training young soccer players: A cross-sectional study. Eur. J. Sport Sci. 2021, 21, 1718–1726. [Google Scholar] [CrossRef]
  29. Morin, J.-B.; Samozino, P. Interpreting Power-Force-Velocity Profiles for Individualized and Specific Training. Int. J. Sports Physiol. Perform. 2016, 11, 267–272. [Google Scholar] [CrossRef]
  30. Pleša, J.; Kozinc, Ž.; Šarabon, N. The Association Between Force-Velocity Relationship in Countermovement Jump and Sprint With Approach Jump, Linear Acceleration and Change of Direction Ability in Volleyball Players. Front. Physiol. 2021, 12, 763711. [Google Scholar] [CrossRef]
  31. Baena-Raya, A.; Soriano-Maldonado, A.; Conceição, F.; Jiménez-Reyes, P.; Rodríguez-Pérez, M.A. Association of the vertical and horizontal force-velocity profile and acceleration with change of direction ability in various sports. Eur. J. Sport Sci. 2021, 21, 1659–1667. [Google Scholar] [CrossRef] [PubMed]
  32. Andr’, A.; Baena-Raya, A.; Jiménez, P.; Jiménez-Reyes, J.; Salinas Romea, E.; Soriano-Maldonado, A.; Rodríguez-Pérez, M.A. Gender-Specific Association of the Sprint Mechanical Properties With Change of Direction Performance in Basketball. J. Strength Cond. Res. 2021, 36, 2868–2874. [Google Scholar]
  33. Samozino, P.; Peyrot, N.; Edouard, P.; Nagahara, R.; Jimenez-Reyes, P.; Vanwanseele, B.; Morin, J.B. Optimal mechanical force-velocity profile for sprint acceleration performance. Scand. J. Med. Sci. Sports 2022, 32, 559–575. [Google Scholar] [CrossRef] [PubMed]
  34. Asimakidis, N.D.; Dalamitros, A.A.; Ribeiro, J.; Lola, A.C.; Manou, V. Maturation Stage Does Not Affect Change of Direction Asymmetries in Young Soccer Players. J. Strength Cond. Res. 2022, 36, 3440–3445. [Google Scholar] [CrossRef] [PubMed]
  35. Bishop, C.R.P.; Lake, J.; Chavda, S.; Turner, A. Interlimb asymmetries: Understanding how to calculate differences from bilateral and unilateral tests. Strength Cond. J. 2019, 40, 1–6. [Google Scholar] [CrossRef]
  36. Pralle, R.S.; Weigel, K.W.; White, H.M. Predicting blood β-hydroxybutyrate using milk Fourier transform infrared spectrum, milk composition, and producer-reported variables with multiple linear regression, partial least squares regression, and artificial neural network. J. Dairy Sci. 2018, 101, 4378–4387. [Google Scholar] [CrossRef]
  37. Liu, C.; Zhang, X.; Nguyen, T.T.; Liu, J.; Wu, T.; Lee, E.; Tu, X.M. Partial least squares regression and principal component analysis: Similarity and differences between two popular variable reduction approaches. Gen. Psychiatry 2022, 35, e100662. [Google Scholar] [CrossRef]
  38. Efron, B. Bootstrap Methods: Another Look at the Jackknife. Ann. Stat. 1979, 7, 1–26. [Google Scholar] [CrossRef]
  39. Aguirre-Urreta, M.I.; Rönkkö, M. Statistical Inference with PLSc Using Bootstrap Confidence Intervals Statistical Inference with PLSC Using Bootstrap Confidence Intervals 1. Source: MIS Q. 2018, 42, 1001–1020. [Google Scholar]
  40. Efron, B.; Narasimhan, B. The automatic construction of bootstrap confidence intervals. J. Comput. Graph. Stat. A Jt. Publ. Am. Stat. Assoc. Inst. Math. Stat. Interface Found. N. Am. 2020, 29, 608. [Google Scholar] [CrossRef]
  41. Chowdhury, S.; Lin, Y.; Liaw, B.; Kerby, L. Evaluation of Tree Based Regression over Multiple Linear Regression for Non-normally Distributed Data in Battery Performance. In Proceedings of the 2022 International Conference on Intelligent Data Science Technologies and Applications (IDSTA), San Antonio, TX, USA, 5–7 September 2022. [Google Scholar]
  42. Morozova, O.; Levina, O.; Uusküla, A.; Heimer, R. Comparison of subset selection methods in linear regression in the context of health-related quality of life and substance abuse in Russia. BMC Med. Res. Methodol. 2015, 15, 71. [Google Scholar] [CrossRef] [PubMed]
  43. Miller, C.L.; Strachan, S.M. Understanding the role of mother guilt and self-compassion in health behaviors in mothers with young children. Women Health 2020, 60, 763–775. [Google Scholar] [CrossRef] [PubMed]
  44. Varley, I.; Sale, C.; Greeves, J.P.; Morris, J.G.; Sunderland, C.; Saward, C. Relationship between Football-Specific Training Characteristics and Tibial Bone Adaptation in Male Academy Football Players. Sports 2023, 11, 86. [Google Scholar] [CrossRef] [PubMed]
  45. Kabir, A.; Rahman, M.J.; Shamim, A.A.; Klemm, R.D.W.; Labrique, A.B.; Rashid, M.; Christian, P.; West, K.P. Identifying maternal and infant factors associated with newborn size in rural Bangladesh by partial least squares (PLS) regression analysis. PLoS ONE 2017, 12, e0189677. [Google Scholar] [CrossRef]
  46. Sassi, R.H.; Dardouri, W.; Yahmed, M.H.; Gmada, N.; Mahfoudhi, M.E.; Gharbi, Z. Relative and Absolute Reliability of a Modified Agility T-test and Its Relationship With Vertical Jump and Straight Sprint. J. Strength Cond. Res. 2009, 23, 1644–1651. [Google Scholar] [CrossRef]
  47. Spiteri, T.; Newton, R.U.; Binetti, M.; Hart, N.H.; Sheppard, J.M.; Nimphius, S. Mechanical Determinants of Faster Change of Direction and Agility Performance in Female Basketball Athletes. J. Strength Cond. Res. 2015, 29, 2205–2214. [Google Scholar] [CrossRef]
  48. Dos’Santos, T.; McBurnie, A.; Thomas, C.; Comfort, P.; Jones, P.A. Biomechanical Determinants of the Modified and Traditional 505 Change of Direction Speed Test. J. Strength Cond. Res. 2020, 34, 1285–1296. [Google Scholar] [CrossRef]
  49. Cavagna, G.A.; Komarek, L.; Mazzoleni, S. The mechanics of sprint running. J. Physiol. 1971, 217, 709–721. [Google Scholar] [CrossRef]
  50. Rabita, G.; Dorel, S.; Slawinski, J.; Sàez-De-Villarreal, E.; Couturier, A.; Samozino, P.; Morin, J.B. Sprint mechanics in world-class athletes: A new insight into the limits of human locomotion. Scand. J. Med. Sci. Sports 2015, 25, 583–594. [Google Scholar] [CrossRef]
  51. Fernandez-Fernandez, J.; Herrero-Molleda, A.; Álvarez-Dacal, F.; Hernandez-Davó, J.L.; Granacher, U. The Impact of Sex and Biological Maturation on Physical Fitness in Adolescent Badminton Players. Sports 2023, 11, 191. [Google Scholar] [CrossRef]
  52. Freitas, T.T.; Alcaraz, P.E.; Calleja-González, J.; Arruda, A.F.S.; Guerriero, A.; Kobal, R.; Reis, V.P.; Pereira, L.A.; Loturco, I. Differences in Change of Direction Speed and Deficit Between Male and Female National Rugby Sevens Players. J. Strength Cond. Res. 2021, 35, 3170–3176. [Google Scholar] [CrossRef] [PubMed]
  53. Nuzzo, J.L. Sex differences in skeletal muscle fiber types: A meta-analysis. Clin. Anat. 2024, 37, 81–91. [Google Scholar] [CrossRef] [PubMed]
  54. Herda, T.J.; Trevino, M.A.; Sterczala, A.J.; Miller, J.D.; Wray, M.E.; Dimmick, H.L.; Gallagher, P.M.; Fry, A.C. Muscular strength and power are correlated with motor unit action potential amplitudes, but not myosin heavy chain isoforms in sedentary males and females. J. Biomech. 2019, 86, 251–255. [Google Scholar] [CrossRef] [PubMed]
  55. Greska, E.K.; Cortes, N.; Ringleb, S.I.; Onate, J.A.; Van Lunen, B.L. Biomechanical differences related to leg dominance were not found during a cutting task. Scand. J. Med. Sci. Sports 2017, 27, 1328–1336. [Google Scholar] [CrossRef]
  56. Kozinc, Ž.; Marković, G.; Hadžić, V.; Šarabon, N. Relationship between force-velocity-power profiles and inter-limb asymmetries obtained during unilateral vertical jumping and singe-joint isokinetic tasks. J. Sports Sci. 2021, 39, 248–258. [Google Scholar] [CrossRef]
  57. Sigward, S.M.; Pollard, C.D.; Havens, K.L.; Powers, C.M. Influence of Sex and Maturation on Knee Mechanics during Side-Step Cutting. Med. Sci. Sports Exerc. 2012, 44, 1497–1503. [Google Scholar] [CrossRef]
Figure 1. The structure of the Modified Agility T-test, m = meters.
Life 14 01434 g001
Figure 2. The structure of the 505 Change of Direction test, m = meters.
Life 14 01434 g002
Figure 3. Root mean square error of prediction (RMSEP) for different numbers of components of partial least squares (PLS) regression.
Life 14 01434 g003
Figure 4. PLS regression coefficients between sprint Fv profile variables and COD performance. (a) MAT time, (b) 505−D time, (c) 505−ND time. R2: coefficient of determination; FM MSE: folded mean square error; CV MSE: cross-validated mean square error.
Life 14 01434 g004aLife 14 01434 g004b
Figure 5. PLS regression coefficients between sprint Fv profile variables and COD performance. (a) COD deficit D time; (b) COD deficit ND time; (c) COD deficit imbalance time. R2: coefficient of determination; FM MSE: folded mean square error; CV MSE: cross-validated mean square error.
Life 14 01434 g005aLife 14 01434 g005b
Table 1. Descriptive statistics for COD performance variables and Fv sprint profile variables (n = 99).
VariablesMedians (IQR)
Sprint Fv profile
F0 (N·kg−1)12.96 (8.33, 28.12)
V0 (m·s−1)7.97 (5.47, 9.33)
Pmax (W·kg−1)26.43 (12.17, 56.10)
RFmax 0.50 (0.37, 0.55)
DRF −0.15 (−0.35, −0.10)
Fvslope (N·s·m−1kg−1)−1.64 (−3.61, −1.09)
Vmax (m/s−1)7.84 (5.41, 9.02)
COD Performance tests
Time to 10 m (s)1.82 (1.50, 2.41)
MAT (s)5.73 (4.84, 7.67)
505-D (s)2.36 (1.99, 2.94)
505-ND (s)2.43 (2.11, 3.02)
COD deficit D (s)0.53 (0.23, 1.07)
COD deficit ND (s)0.61 (0.24, 1.08)
505 COD imbalance (%)−2.58 (−7.4, −0.04)
COD deficit imbalance (%)−11.22 (−34.89, −0.12)
IQR: interquartile range; F0: theoretical maximal force production; V0: theoretical maximal running velocity; Pmax: theoretical maximal mechanical power in the horizontal direction; Fvslope: force–velocity slope; RFmax: maximum ratio value of horizontal component to resultant force; DRF: index of force application technique; Vmax: maximal velocity; COD: change of direction; D: dominant; ND: non-dominant; m: meters.
Table 2. Coefficients from linear regression model of partial least squares (PLS) composite variables predicting COD performance.
β (SE)Tp-Valueadj-R2
MATIntercept−0.034 (0.06)−0.5350.5940.59
Comp1−0.451 (0.04)−11.94<0.001 *
Comp2−0.028 (0.03)−0.8420.402
505-DIntercept−0.019 (0.06)−0.2940.7700.59
Comp1−0.456 (0.04) −12.053<0.001 *
Comp2−0.010 (0.03)−0.3030.763
505-NDIntercept−0.017 (0.07)−0.2390.8120.50
Comp1−0.423 (0.04) −10.083<0.001 *
Comp2−0.011 (0.04)−0.3050.761
COD deficit DIntercept−0.005 (0.08)−0.0570.9540.36
Comp10.004 (0.05)0.0890.929
Comp20.322 (0.04) 7.571<0.001 *
COD deficit NDIntercept−0.002 (0.08)−0.0250.9800.31
Comp10.050 (0.05)1.010.315
Comp20.297 (0.04) 6.727<0.001 *
505 COD imbalanceIntercept−0.008 (0.10)−0.0810.9350.05
Comp1−0.151 (0.06) −2.5820.011 *
Comp2−0.005 (0.05)−0.0980.922
COD deficit imbalanceIntercept−0.009 (0.10)−0.0880.9300.07
Comp1−0.122 (0.06) −2.1150.037 *
Comp20.109 (0.05) 2.1030.038 *
Comp: component; β: standardized regression coefficient; SE: standard error; adj-R2: adjusted coefficient of determination; COD: change of direction; D: dominant; ND: non-dominant. * Significant correlation (0 was not included in the 95% bcaCI).
Disclaimer/Publisher’s Note: The statements, opinions and data contained in all publications are solely those of the individual author(s) and contributor(s) and not of MDPI and/or the editor(s). MDPI and/or the editor(s) disclaim responsibility for any injury to people or property resulting from any ideas, methods, instructions or products referred to in the content.

