Abstract
In many plant species, flowering is promoted by the cold treatment or vernalization. The mechanism of vernalization-induced flowering has been extensively studied in Arabidopsis but remains largely unknown in legumes. The orthologs of the FLC gene, a major regulator of vernalization response in Arabidopsis, are absent or non-functional in the vernalization-sensitive legume species. Nevertheless, the legume integrator genes FT and SOC1 are involved in the transition of the vernalization signal to meristem identity genes, including PIM (AP1 ortholog). However, the regulatory contribution of these genes to PIM activation in legumes remains elusive. Here, we presented the theoretical and data-driven analyses of a feed-forward regulatory motif that includes a vernalization-responsive FT gene and several SOC1 genes, which independently activate PIM and thereby mediate floral transition. Our theoretical model showed that the multiple regulatory branches in this regulatory motif facilitated the elimination of no-sense signals and amplified useful signals from the upstream regulator. We further developed and analyzed four data-driven models of PIM activation in Medicago trancatula in vernalized and non-vernalized conditions in wild-type and fta1-1 mutants. The model with FTa1 providing both direct activation and indirect activation via three intermediate activators, SOC1a, SOC1b, and SOC1c, resulted in the most relevant PIM dynamics. In this model, the difference between regulatory inputs of SOC1 genes was nonessential. As a result, in the M. trancatula model, the cumulative action of SOC1a, SOC1b, and SOC1c was favored. Overall, in this study, we first presented the in silico analysis of vernalization-induced flowering in legumes. The considered vernalization network motif can be supplemented with additional regulatory branches as new experimental data become available.
Keywords:
vernalization; legumes; gene networks; dynamical model; feed-forward loop; Medicago trancatula; FT; SOC1; PIM 1. Introduction
In many plant species, flowering is induced by the cold treatment or vernalization [1,2]. Vernalization inhibits precocious reproductive development during winter and ensures that flowering occurs in the milder spring conditions [3].
The mechanisms of vernalization response are best studied in Arabidopsis [4]. In Arabidopsis, the FLOWERING LOCUS T (FT) and SUPPRESSOR OF OVEREXPRESSION OF CONSTANS 1 (SOC1) genes are the major hubs collecting regulatory inputs from many signaling pathways (Photoperiod/circadian clock, Vernalization, Ambient temperature, Gibberellins/cytokinins, Autonomous, Sugar, and Aging) to transmit this information to the meristem identity genes, including APETALA1 (AP1), a master regulator of flower development [5,6,7,8,9,10] (Figure 1A). The major regulator of the vernalization pathway is the FLOWERING LOCUS C (FLC) gene [3,11,12,13], while the information on photoperiod and circadian clock is integrated by the CONSTANS (CO) regulator [14]. In the non-inductive conditions, FLC represses FT and SOC1 integrator genes by binding to the first intron of FT and the promoter region of SOC1 in a complex with SHORT VEGETATIVE PHASE (SVP) [9,15,16,17]. The vernalization treatment switches an epigenetic mechanism of FLC silencing, which leads to the de-repression of the FT and SOC1 [6]. Upon de-repression, the FT gene becomes activated in leaves by the CO protein, which binds to the cis-element in the FT promoter [18]. Then, the FT protein moves to the shoot apex to activate the expression of the meristem identity genes and promote floral transition [7] (Figure 1A). A mechanism of the vernalization-induced silencing of the floral repressor is generally conserved in cereals [4].
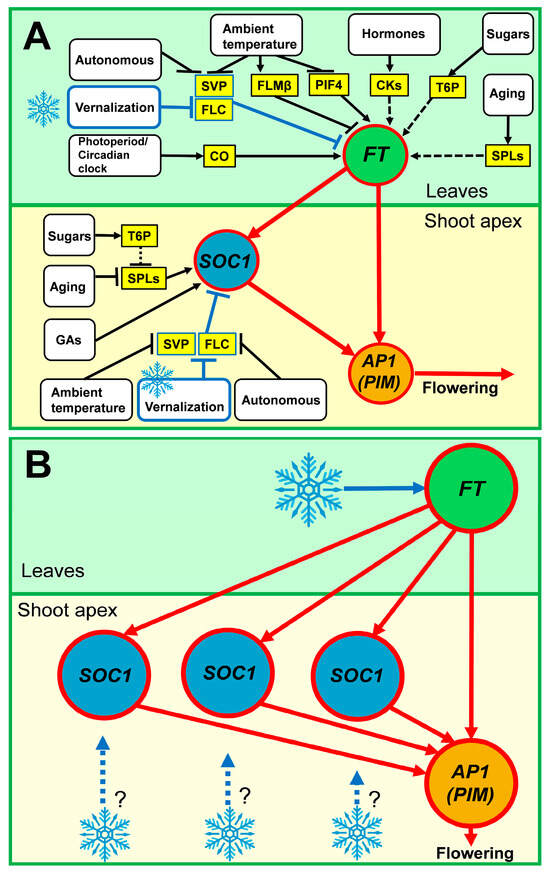
Figure 1.
A core regulatory motif responsible for flowering activation by vernalization in (A) Arabidopsis and (B) legumes. (A) In Arabidopsis, the FT and SOC1 genes integrate regulatory inputs from multiple signaling pathways. In the non-inductive conditions, these integrators are repressed by the FLC gene. Cold treatment leads to FLC repression and activation of FT and SOC1, which in turn activate the meristem identity genes, including AP1 (PIM). This turns on floral transition. FT activates meristem identity genes both directly and via SOC1. The scheme is based on the pathway overview from the Flor-ID database (http://www.phytosystems.ulg.ac.be/florid/, accessed on 4 December 2023) and a previously published summary on mechanisms of floral transition in Arabidopsis [19,20]. Arrows and T-bars show positive and negative regulatory interactions, respectively. Dashed lines correspond to indirect/putative mechanisms. GAs, Gibberellins; CKs, cytokinins. (B) In legumes, the mechanisms of vernalization-induced flowering have not yet been sufficiently studied. Each legume species has several FT genes, but often only one FT gene is involved in the vernalization response. Upon cold treatment, the FT gene activates SOC1 genes, which are present in two or three copies of the legume genomes. It is largely unknown whether the vernalization signal transduction from FT to the AP1 (PIM) is direct or indirect and whether the legume SOC1 genes perceive any vernalization signal directly. The blue snowflakes and arrows denote the vernalization signaling pathway, whose components are well characterized in Arabidopsis but remain unknown in legumes.
In legumes, the molecular bases of vernalization response are still largely unexplored [21]. The available data suggest significant differences in the mechanisms of vernalization response between legumes and Arabidopsis. The FLC orthologs are missing in many vernalization-sensitive legume species, including Medicago truncatula, Cicer arietinum, Pisum sativum, and Lupinus angustifolius [22,23]. An overexpression of SVP genes in transgenic M. trancatula did not alter flowering time [24]. Moreover, the studies in M. truncatula and P. sativum suggested that COL genes, the legume orthologs of the Arabidopsis CO gene, may not be involved in the regulation of photoperiodic flowering [25,26].
Despite differences in response to vernalization and photoperiod, the function of integrator and meristem identity genes is generally conserved in legumes. The legume FT genes are proposed to be the main targets of vernalization [21,22,27]. Unlike Arabidopsis, temperate legumes have four to six FT genes arranged in three subclades, but not all of these genes are involved in the vernalization response [27]. For example, the FTa1 gene has been reported to be a vernalization target in M. trancatula and P. sativum [28,29,30], while the FTc1 gene plays a major role in vernalization response of L. angustifolius and L. luteus [31,32]. In C. arietinum, the candidate vernalization targets have not yet been reported.
The SOC1 genes are usually present in two or three copies in the legume genomes, and their expression is vernalization-sensitive [33,34]. However, it is unclear whether they perceive the vernalization signal directly or indirectly and whether their function is redundant (Figure 1B). For meristem identity genes, the number of known orthologs varies between legume species; however, one of the major genes involved in the floral transition is the PROLIFERATING INFLOWERING MERISTEM (PIM), an ortholog of the Arabidopsis AP1 gene [35,36,37].
During the floral transition, the FT and SOC1 genes function as pathway integrators [5,6], and given the absence of detailed information on their upstream regulators in legumes, these genes can be considered inputs of the regulatory network. According to this concept, the core regulatory motif promoting vernalization in legumes should include an FT gene and two or three SOC1s, which regulate the target meristem identity genes (Figure 1B). It is still unknown how vernalization triggers flowering in legumes or how the positive environmental signals propagate within this network motif. We studied this motif using mathematical modeling based on both theoretical assumptions and gene expression data.
Since the studies on vernalization-induced flowering in legumes are only beginning to unfold, the data on expression dynamics of the integrator genes during vernalization are available only for M. trancatula. In M. trancatula, the FTa1 gene is the main target of vernalization and the long day (LD) photoperiod. The fta1 mutants lose the vernalization response [28]. In addition, M. trancatula has three SOC1 genes (SOC1a, SOC1b, and SOC1c), whose expression is up-regulated by vernalization [33,38]. These genes are suggested to be downstream of FTa1 as their expression declines significantly in the fta1 mutants. Nevertheless, the vernalized fta1 mutant plants still flower in the LD conditions, although with a delay. This is accompanied by an increase in SOC1s expression [38]. Each SOC1 gene may have a specific function during floral transition. In M. trancatula, the mutations in the SOC1a gene led to delayed flowering in all examined conditions, while the mutation in SOC1b did not affect flowering time [38]. The data on SOC1c mutants are not yet available [33,38]. Thus, many questions remain unanswered. It is unclear whether the vernalization signal transmission from the vernalization-responsive FTa1 gene to the shoot apex requires cumulative input from the SOC1 genes or whether each SOC1 gene has its own role. If the flowering still occurs in the fta1 mutants, do the SOC1 genes perceive any vernalization signal independently of FTa1?
Mathematical modeling is an effective tool to analyze interactions within gene networks. Various kinds of models have been applied to infer the mechanisms of floral transition in Arabidopsis [39,40,41,42]. Models based on ordinary differential equations (ODEs) mostly considered a core gene network that included an activator FT and a repressor TERMINAL FLOWER1 (TFL1), both mediated by the FD gene, as well as their target meristem identity genes AP1 (PIM) and LFY [40,41]. It has been shown that the floral transition networks include the major hubs, which can be expanded by additional hubs and interactions [40]. In line with these assumptions, a more sophisticated model, including SOC1 and AGAMOUS-LIKE24 (AGL24) regulators, has been elaborated [43]. Recently, the ODE models were successfully applied to analyze the networks of floral transition in legumes. The interactions between the FT, FD, TFL1, LFY, and AP1 (PIM) orthologs were modeled in C. arietinum [44] and P. sativum [45]. However, no mathematical models of vernalization-induced flowering in legumes have yet been developed.
In the first part of the present study, we theoretically analyzed a core network motif shown in Figure 2. We investigated a possible biological benefit that the presence of several regulatory branches in the motif may provide in the target regulation. In the second part, we considered four models with different combinations of FTa1, SOC1a, SOC1b, and SOC1c in the regulation of PIM in M. trancatula. The model solutions were fit to the gene expression data with and without vernalization in wild-type and fta1-1 mutants. The weights of different regulation branches of the network in other legumes may differ from those in M. trancatula. Our approach allows the model to be extended by adding new branches and hubs as the new experimental data become available.
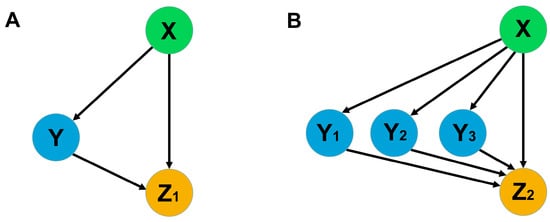
Figure 2.
The scheme of network motifs with one and three mediated activators. The left (A) motif represents the coherent FFL of type 1, as classified elsewhere [46], and the right (B) one is its modified version. In the context of our study, Zi stands for target genes, while X, Y, and Yi are transcription and mobile factors.
2. Materials and Methods
2.1. Mathematical Model for the Feed-Forward Loop of PIM Activation
PIM activation by an FT homolog (FTa1) directly and via three intermediate activators (SOC1a, SOC1b, and SOC1c) represents a variation of a feed-forward loop (FFL), which is simple but very widespread in biological networks [47]. It consists of one target Z that is activated by X both directly and indirectly via Y (Figure 2A). A biological function of this FFL is well characterized for various assumptions about possible ways to combine regulatory interactions and regulatory parameters, and this function can be described as a delayed response in target activity to a variation of X [46]. The appearance of several intermediate activators in this FFL, which is characteristic of legumes, leads to the general problem of studying this model network motif and comparing the modified loop with the simple one (Figure 2B).
For simplicity, we assume that indirect branches act independently, and there is no competition for the target between them. Admitting no essential influence of Yi on the activation of Zi by X, we can use kinetic equations with “OR logic” in combining all regulations, as described elsewhere [46]. In this case, the model describing the FFL with three intermediate activators is as follows:
where are the maximal synthesis rate; are degradation coefficients; the production rates are represented by the Hill functions with the dissociation coefficients . All parameter values were set equal to 1 in this analysis. We assume no cooperative effects in Z regulation. The summation in Equation (1) occurs over the indirect branches in the FFL. Such systems of differential equations have unique solutions [48].
2.2. Mathematical Modeling of the Medicago trancatula Data
To obtain numerical data from the plots published in Ref. [33], we used WebPlotDigitizer software (https://automeris.io/WebPlotDigitizer Version 4.6, accessed on 4 December 2023). This web-based tool demonstrated high validity and reliability in extraction of digital data from a variety of plots [49].
The data represented the expression dynamics of genes PIM, FTa1, SOC1a, SOC1b, and SOC1c during M. trancatula development (5–25 days after sowing) with and without vernalization and under the long-day (LD) growing conditions (Figure 3). All gene expression time courses were measured for wild-type and fta1-1 mutant genotypes. Therefore, the data included mRNA concentrations (mean ± s.d.) of five genes at five time points in four cases (with/without vernalization, wild/mutant genotype). FTa1 expression was significantly activated by vernalization and LD photoperiod in the leaves. It reached maximum by day 20 and declined thereafter. The expression levels of SOC1a, SOC1b, SOC1c, and PIM in the shoot apex also demonstrated a substantial induction by vernalization; however, this induction was observed later than for FTa1. The expression levels of these genes in fta1-1 late flowering mutants were much lower compared to wild type, and no activation by vernalization was detected in the considered time interval [33] (Figure 3).
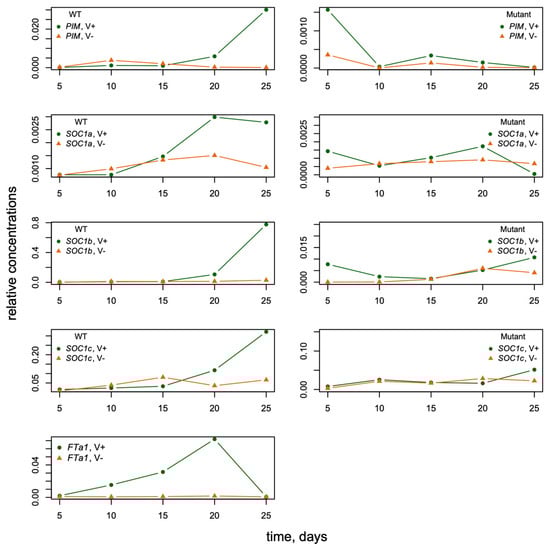
Figure 3.
The dynamics of FTa1 expression in leaves and SOC1a, SOC1b, SOC1c, and PIM expression in the shoot apexes of M. trancatula obtained by qRT-PCR (modified from ([33], Figure 4)). The dynamics of mean expression levels are shown for wild-type and fta1-1 mutant plants with and without vernalization (“V+“ and “V−,“ respectively) and LD photoperiod. The data are normalized to the PDF2 reference gene expression [33].
We elaborated dynamical models to fit these data, which were based on the kinetic equations with the Michaelis–Menten kinetics. Due to the limited amount of data, we assumed no cooperative effects in regulation to reduce the number of free parameters in the model equations.
We used mathematical modeling to test four hypotheses (H1–H4) about how the FT and SOC1 genes combined in the activation of PIM. Different possible types of this combination were associated with different mathematical representations of the model equations, as described further separately for each hypothesis.
The H1 hypothesis represents the model where all activators regulate PIM, and the SOC1 transcription factors are functionally identical in terms of this regulation. The latter means that the contribution of the SOC1 activators can be presented via the sum of their concentration in the PIM synthesis rate, with the same kinetic parameters for all SOC1-like genes. The model for the PIM dynamics then has the following form:
where PIM and SOC1i are protein concentrations coded by PIM and the SOC1 genes, respectively, in the apical meristem, FTa1 is the protein concentration coded by FTa1 in leaves, are the maximal synthesis rates, is the degradation constant for PIM, and are the Michaelis constants (dissociation constants for the interaction between transcription factors and PIM’s regulatory region). We assume that it takes τ days to transport the FTa1 protein to the apical meristem, so we represent the FTa1 concentration in the apex at time t as FTa1(t − τ) in the model equations.
The H2 hypothesis suggests that the sum of the SOC1 proteins fully determines the PIM dynamics, and FTa1 does not participate in the direct PIM activation. The model for the PIM dynamics in this hypothesis takes the following form:
The H3 hypothesis again suggests that FTa1 has no sufficient effect on the PIM dynamics but additionally assumes that the SOC1 proteins are functionally different in the PIM activation. This means that each SOC1i(t) is associated with its own regulatory parameters in the equation for PIM. The model in this hypothesis has the following form:
where the kinetic parameters vi and Ki are different for different SOC1 proteins.
H4 assumes that all regulators have different contributions in the PIM activation and, hence, different kinetic parameters, so the model takes the following form:
Since fta1 mutants still showed delayed flowering in the vernalized LD conditions, we did not consider fifth hypothesis that only FTa1 is involved in PIM regulation.
We find values of all parameters (maximal synthesis rates, degradation constants, dissociation constants, and time delay τ) by fitting models H1–H4 to the Medicago data, minimizing the following cost function V:
where i is the number of time point, Yi and yi represent average data values and model solutions, respectively, ‘+/−’ in superscripts, mark the presence or absence of vernalization, the presence/absence of ‘mut’ in superscripts denotes the mutant/wild type genotype, respectively, and σ’s are the data values of the standard deviations for data values at ith time point. We use mRNA concentrations from the data in Equation (6), assuming that protein concentrations are proportional to mRNA concentrations for simplicity. The summation in Equation (6) starts from i = 2 since data from the first time point are used as the initial conditions in the models. We ran the numerical minimization process 1000 times from different initial points using simulated anneal algorithm in MATLAB and selected the best result.
To choose between hypotheses, we used the Akaike information criterion (AIC) adjusted for small data samples to compare the models:
where k is the number of optimized parameters, m is the number of data points, is the maximal value of the log-likelihood function expressed in terms of the minimal value of the minimized cost function [44]. AIC takes into account both the proximity of the model solution to data and the number of free parameters, as more sophisticated hypotheses possess larger numbers of free parameters and, thus, are prone to overfitting. More preferable hypotheses correspond to smaller AIC values.
3. Results
3.1. Multiple SOC1 Genes in the FFL of PIM Activation Ensure Buffering of FT Variation
To study the features of the general model, we compared models of two simple feed-forward loops shown in Figure 2. The first loop consisted of regulator X, which activated target Z1 directly and indirectly through the activation of regulator Y. In the second loop, in addition to the direct activation of target Z2 by X, there existed three intermediate branches with activators Y1, Y2, and Y3. These FFLs were modeled using simple mathematical models with Equation (1). Here, we had no interest in absolute concentration values and considered relative values. In the motif with three intermediate regulation branches, we suggested that all three regulators were similar, with the same kinetic parameters.
Figure 4 shows the relative concentrations of all players in the stationary state in the two regulatory motifs. As one can see, the total concentration of regulators is the same for both FFLs, but the target concentration is higher for the second FFL. Three independent branches in this regulatory motif provide more effective activation of the target, and this effect is most noticeable if these branches have approximately the same impact on regulation.
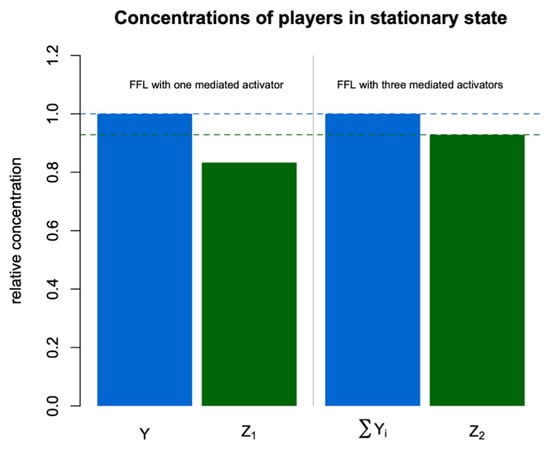
Figure 4.
Stationary values of all concentrations relative to Y in the FFLs from Figure 2.
Another evident advantage of three independent intermediate regulators instead of one is buffering against possible deleterious mutations in some Yi so that other Yi can still fulfill regulation. Figure 5 demonstrates how changes in the intermediate regulators affect the target concentration. For the second FFL, a threefold variation of one regulator, Y1, leads to a smaller variation of the target Z2 as compared to the target Z1 and a similar variation of Y in the first FFL. To force noticeable changes in Z2, we need to activate or suppress all three intermediate activators simultaneously, which we can do by perturbing the upstream regulator X. In other words, the target in the FFL with three intermediate regulators essentially responds only to a ‘real signal’ that has the form of the perturbed upstream regulator X and filters variational signals from any single intermediate regulator Yi.
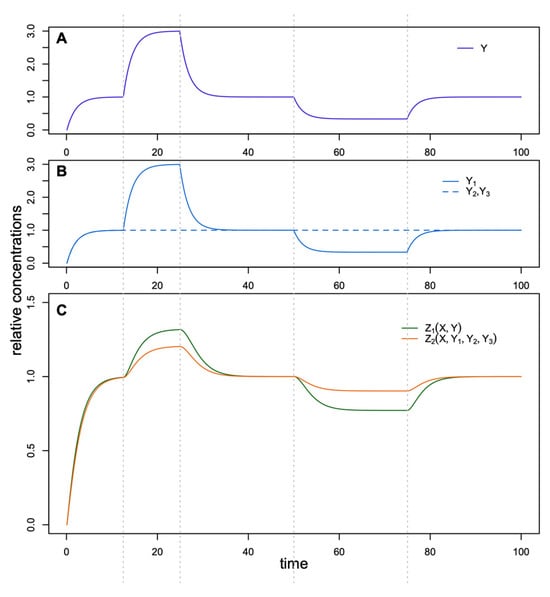
Figure 5.
Dynamics of Z1 and Z2 (C) in the FFLs in response to variation of (A) Y and (B) Y1–Y3, respectively.
3.2. Modeling PIM Dynamics in M. trancatula Suggests Cumulative Activation by SOC1 Genes
We elaborated four mathematical models of PIM regulation by FTa1 and SOC1 proteins and applied them to the M. trancatula data to test the following hypotheses H1–H4 about how activators of PIM combine to determine its expression dynamics observed in the data (see Section 2 for more details):
- H1: PIM is regulated by both FTa1 and all SOC1 transcription factors, and all SOC1 transcription factors are not functionally distinguishable in this regulation.
- H2: PIM is regulated only by the SOC1 transcription factors, and all SOC1 transcription factors are not functionally distinguishable.
- H3: PIM is regulated only by the SOC1 transcription factors, and each SOC1 transcription factor has its own regulatory parameters.
- H4: PIM is regulated by both FTa1 and all SOC1 transcription factors, and each SOC1 transcription factor has its own regulatory parameters.
We fitted the models H1–H4 to the expression data, minimizing the functional (6) for two genotypes (wild type and fta1-1) and in the presence or absence of vernalization. Table 1 shows the best parameter values for each model. The results demonstrated different fitting quality for different hypotheses (Figure 6). The PIM dynamics for the mutant genotype were visually similar in all models, so the main difference appeared for the wild type. The wild-type PIM expression in models H1 and H4 was close to data under vernalization (Figure 6A,G), while models H2 and H3 exhibited PIM underexpression (Figure 6C,E). This result hinted at the fact that the SOC1 transcription factors were not enough for PIM activation and that the direct activation from FTa1 was necessary since only models H1 and H4 implemented the direct PIM activation by FTa1. Prescribing separate regulatory parameters for each SOC1 in model H3 increased PIM expression as compared to the cumulative activation from SOC1a to SOC1c (Figure 6E vs. Figure 6C) but was not sufficient.

Table 1.
Best parameter values in models H1–H4.
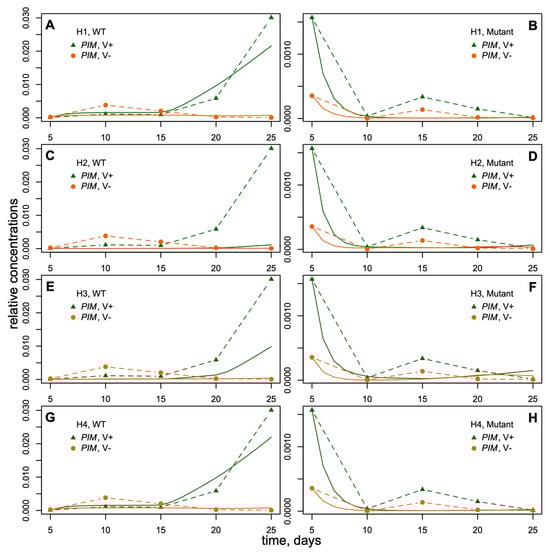
Figure 6.
Dynamics of PIM expression in models (solid curves) and data (dashed curves). (A,B): model under H1; (C,D): model H2; (E,F): model H3; (G,H): model H4. V+, vernalization; V−, absence of vernalization; WT, wild type; mutant, fta1-1 mutant plants.
To decide which model is preferable, we calculated the Akaike information criterion for each model, which accounted for both the minimal value of the minimized cost function and the number of free parameters in the model (Figure 7; see Section 2 for more details). Model H4 showed the smallest value, Vmin, of the cost function among all models, but this value did not noticeably differ from Vmin in model H1. On the other hand, model H4 had 10 free parameters vs. 6 free parameters in H1. This balance between the number of degrees of freedom in the model and its ability to approximate data resulted in model H1 exhibiting the smallest AIC. Therefore, hypothesis H1 should be considered the most preferred among the tested hypotheses.
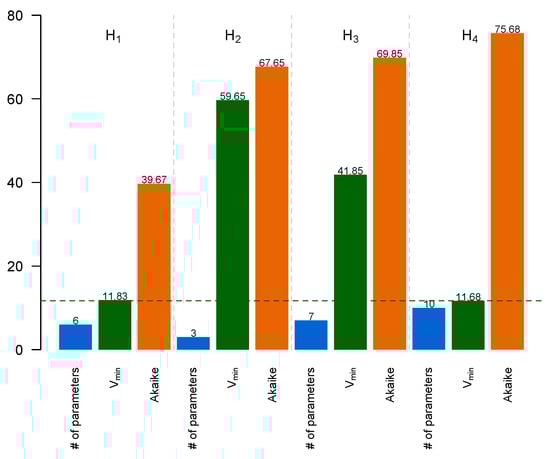
Figure 7.
Number of free parameters in a model (blue), minimal cost function value Vmin (green), and AIC value (brown) for models H1–H4.
4. Discussion
4.1. Multiple SOC1 Genes Buffer FT Variation in the FFL of PIM Activation
The regulatory motif controlling the vernalization-induced flowering in legumes includes several activating branches. The number of controlling ways seems to be abundant, but studying even the simplest model uncovers the sense of these ways in such a significant process. Our theoretical analysis demonstrates that several intermediate activators in the flowering activation motif provide more effective activation of the target, and gene breakdown would not lead to vital changes. However, several activating branches force noticeable changes in the target, only working together simultaneously. This is possible in a case of upstream regulation, and variations in only one branch that are not supported by variations in others are smoothed away by the loop. In other words, the loop with several branches eliminates no-sense signals and amplifies the useful signal from an upstream regulator. Since flowering is one of the most substantial processes of the plant, the support of its activation needs to be very reliable.
4.2. The Cumulative PIM Activation by Three SOC1 Genes Is Favored in the M. trancatula Model
The published experimental results showed that all three M. trancatula SOC1 genes promoted the early flowering of the Arabidopsis soc1–2 mutant, which points to their functional identity with the Arabidopsis SOC1 [33]. Nevertheless, there were noticeable differences in both the levels and dynamics of M. trancatula SOC1s expression upon induction by vernalization (Figure 3). Moreover, SOC1s had different effects on flowering time. The flowering was delayed significantly in the M. trancatula SOC1a mutants, while the mutation in the SOC1b gene did not affect flowering time. An input of the SOC1c gene has not yet been clarified [33,38].
These differences in SOC1s functions are reflected in the fits of H2 and H3 models to experimental data on PIM expression (Figure 6C,E). In the absence of FTa1, neither of the two models show good fits, but the differences between the independent regulation by different SOC1s (H3) and their cumulative input (H2) are quite evident. However, these differences become indistinguishable in the models, including FTa1, the major integrator of the vernalization and LD signals. Thus, in the real plant, the direct regulation of the target by FT is more intensive than regulation from intermediate branches of the motif (Figure 2). Indeed, the model including both FTa1 and SOC1s, where SOC1s act in sum (H1), is no worse than the complex model with SOC1s acting independently (H4) (Figure 6A,G). Moreover, the AIC value is much lower in the H1 model compared to H4 model (Figure 7). This led to a conclusion that, in the M. trancatula models, it makes no sense to consider different SOC1 genes as independent activators with specific regulatory properties. This is in line with the suggested hypothesis of functional redundancy of SOC1 genes [33,38].
Moreover, modeling the M. trancatula data under different hypotheses resulted in a curious trend: values of the SOC1-related dissociation constants K1, K2, and K3 were much higher than the FTa1-related dissociation constant K0. The results were similar even if FTa1 was absent in the model (Table 1). This result suggests a small impact of the intermediate activators.
In Arabidopsis, an induction of SOC1 by vernalization is both dependent and independent of the FT gene [15]. In legumes, a possibility of the FTa1-independent SOC1 regulation still exists since the late flowering of the fta1 mutants is detected under vernalization and LD [38]. The only known floral repressor, whose mutation enables bypassing the vernalization requirement in legumes, is the M. trancatula ortholog of the Arabidopsis VRN2 gene. The mutation in VRN2 resulted in the increased expression of FTa1 and all three SOC1 genes under LD [50]. However, no detailed analyses of the direct targets or interaction partners of VRN2 have been conducted. SOC1s may also be targeted by the LD-induced FT genes, e.g., the FTb1 gene [28]. Nevertheless, a possible independent input of SOC1 genes in the vernalization-induced flowering cannot be neglected.
PIM expression in M. trancatula fta1-1 mutants starts to increase with a delay compared with the wild type [33,38]. Within the considered period of 25 days, this concentration is very small (Figure 3 and Figure 6). Interestingly, all four models fit the mutant data in a similar way (Figure 6B,D,F,H), indicating that the PIM expression in this time interval is independent of structural changes in the regulatory module.
The network motif considered in this study can be supplemented by additional regulatory nodes as new experimental data become available. The weights of the regulation branches in other legumes may differ from those in M. trancatula, and modeling data from other crops will elucidate regulation processes in the future. Therefore, our study can be considered as a first step towards the quantitative understanding of regulatory mechanisms induced by vernalization.
4.3. Limitations of the Modeling Approach
The modeling of complex biological processes is always challenging and can be achieved through a number of simplifications. Such simplifications are largely determined by the limited resolution of experimental data. At the molecular level, the data on gene expression often lack information on absolute concentrations, half-lives, or mRNA/protein binding affinities. Moreover, the mathematical models often operate with large network hubs, which are further complemented by a more complete set of regulators.
The dynamic modeling of gene expression requires data that changes over time or space. For vernalization in legumes, a dataset that meets these requirements is only available for Medicago trancatula and includes temporal dynamics of flowering gene expression during vernalization at the RNA level [33]. Due to the lack of experimental data on protein expression, in the model, we assumed that protein concentrations are proportional to corresponding mRNA concentrations. As a consequence, this proportionality coefficient appears as a multiplier factor in the values of the equilibrium dissociation constants K, which represent the interaction of the regulator proteins with the target gene promoters. We find the values of K by fitting the model to experimental data (Table 1), so we cannot extract potentially interesting information about DNA–protein interaction from these values or use any experimental estimates on the dissociation constants to prescribe K in the model.
Our approach also has limitations at the gene network level. As shown in Arabidopsis, the integrator genes FT and SOC1 summarize information from the upstream pathways and transfer it to downstream meristem identity genes to promote flowering [5,6] (Figure 1A). The activation role of these integrators is proposed to be conserved in legumes [28,31,33,34]. The expression data for M. trancatula are available for the FTa1 and three SOC1 genes (Figure 1B); however, there is very limited information on candidate genes acting upstream of these integrators. A simplification of the model is that we do not explicitly consider information on the regulatory inputs of the upstream pathways but assume that this information is pre-included in the expression of pathway integrator genes (“hubs”). The earlier in silico study has shown that flowering time depends on the expression levels of integrator genes [51]; thus, this simplification is quite reliable. This way of generalizing the structure of gene networks has previously been used in numerous models of floral transition in Arabidopsis [40,41,43] and legumes [44,45]. Using a “hub” regulatory module enabled us to successfully fit the model to the data and test four hypotheses of PIM regulation in M. trancatula. These hypotheses can be further verified in experiments, and the newly obtained experimental data, in turn, can be included in the model.
The values of free parameters in the model were obtained by optimization, so the risk of overfitting exists. To reduce this potential risk, we used the systematic ensemble approach for the analysis of the optimization results [52]. All our conclusions were based on the average values over the ensemble of optimized parameter values.
Despite the limitations, in this study, we applied rigorous mathematical methods that allowed us to test various hypotheses using available experimental data. The presented modeling approach can be further applied to build more complete models once detailed gene expression and interaction data become available.
Author Contributions
Conceptualization, V.V.G., M.G.S. and S.Y.S.; methodology, M.A.D. and V.V.G.; software, M.A.D.; formal analysis, M.A.D. and V.V.G.; investigation, M.A.D., V.V.G., M.G.S. and S.Y.S.; writing—original draft preparation, M.A.D.; writing—review and editing, V.V.G., M.G.S. and S.Y.S.; visualization, M.A.D. and S.Y.S.; validation, V.V.G. and M.G.S.; funding acquisition, S.Y.S. All authors have read and agreed to the published version of the manuscript.
Funding
This research was funded by Russian Science Foundation (RSF), grant No. 23-26-00203.
Institutional Review Board Statement
Not applicable.
Informed Consent Statement
Not applicable.
Data Availability Statement
All data and modeling results are contained within the article.
Conflicts of Interest
The authors declare no conflict of interest.
References
- Kim, D.-H.; Doyle, M.R.; Sung, S.; Amasino, R.M. Vernalization: Winter and the Timing of Flowering in Plants. Annu. Rev. Cell Dev. Biol. 2009, 25, 277–299. [Google Scholar] [CrossRef] [PubMed]
- Ream, T.S.; Woods, D.P.; Amasino, R.M. The Molecular Basis of Vernalization in Different Plant Groups. Cold Spring Harb. Symp. Quant. Biol. 2012, 77, 105–115. [Google Scholar] [CrossRef] [PubMed]
- Nishio, H.; Kudoh, H. Distinct Responses to Autumn and Spring Temperatures by the Key Flowering-Time Regulator FLOWERING LOCUS C. Curr. Opin. Genet. Dev. 2023, 78, 102016. [Google Scholar] [CrossRef] [PubMed]
- Sharma, N.; Geuten, K.; Giri, B.S.; Varma, A. The Molecular Mechanism of Vernalization in Arabidopsis and Cereals: Role of Flowering Locus C and Its Homologs. Physiol. Plant. 2020, 170, 373–383. [Google Scholar] [CrossRef] [PubMed]
- Lee, J.H.; Hong, S.M.; Yoo, S.J.; Park, O.K.; Lee, J.S.; Ahn, J.H. Integration of Floral Inductive Signals by Flowering Locus T and Suppressor of Overexpression of Constans 1. Physiol. Plant. 2006, 126, 475–483. [Google Scholar] [CrossRef]
- Wellmer, F.; Riechmann, J.L. Gene Networks Controlling the Initiation of Flower Development. Trends Genet. 2010, 26, 519–527. [Google Scholar] [CrossRef]
- Chen, Z.; Li, Z. Adaptation and Integration of Environmental Cues to Internal Flowering Network in Arabidopsis thaliana. Reprod. Breed. 2022, 2, 133–137. [Google Scholar] [CrossRef]
- Pin, P.A.; Nilsson, O. The Multifaceted Roles of FLOWERING LOCUS T in Plant Development. Plant Cell Environ. 2012, 35, 1742–1755. [Google Scholar] [CrossRef]
- Lee, J.; Lee, I. Regulation and Function of SOC1, a Flowering Pathway Integrator. J. Exp. Bot. 2010, 61, 2247–2254. [Google Scholar] [CrossRef]
- Song, G.; Carter, B.B.; Zhong, G.-Y. Multiple Transcriptome Comparisons Reveal the Essential Roles of FLOWERING LOCUS T in Floral Initiation and SOC1 and SVP in Floral Activation in Blueberry. Front. Genet. 2023, 14, 1105519. [Google Scholar] [CrossRef]
- Whittaker, C.; Dean, C. The FLC Locus: A Platform for Discoveries in Epigenetics and Adaptation. Annu. Rev. Cell Dev. Biol. 2017, 33, 555–575. [Google Scholar] [CrossRef] [PubMed]
- Searle, I.; He, Y.; Turck, F.; Vincent, C.; Fornara, F.; Kröber, S.; Amasino, R.A.; Coupland, G. The Transcription Factor FLC Confers a Flowering Response to Vernalization by Repressing Meristem Competence and Systemic Signaling in Arabidopsis. Genes Dev. 2006, 20, 898–912. [Google Scholar] [CrossRef] [PubMed]
- Mateos, J.L.; Madrigal, P.; Tsuda, K.; Rawat, V.; Richter, R.; Romera-Branchat, M.; Fornara, F.; Schneeberger, K.; Krajewski, P.; Coupland, G. Combinatorial Activities of SHORT VEGETATIVE PHASE and FLOWERING LOCUS C Define Distinct Modes of Flowering Regulation in Arabidopsis. Genome Biol. 2015, 16, 31. [Google Scholar] [CrossRef] [PubMed]
- Shim, J.S.; Kubota, A.; Imaizumi, T. Circadian Clock and Photoperiodic Flowering in Arabidopsis: CONSTANS Is a Hub for Signal Integration. Plant Physiol. 2017, 173, 5–15. [Google Scholar] [CrossRef]
- Helliwell, C.A.; Wood, C.C.; Robertson, M.; James Peacock, W.; Dennis, E.S. The Arabidopsis FLC Protein Interacts Directly in Vivo with SOC1 and FT Chromatin and Is Part of a High-Molecular-Weight Protein Complex. Plant J. 2006, 46, 183–192. [Google Scholar] [CrossRef]
- Lee, J.H.; Yoo, S.J.; Park, S.H.; Hwang, I.; Lee, J.S.; Ahn, J.H. Role of SVP in the Control of Flowering Time by Ambient Temperature in Arabidopsis. Genes Dev. 2007, 21, 397–402. [Google Scholar] [CrossRef]
- Li, D.; Liu, C.; Shen, L.; Wu, Y.; Chen, H.; Robertson, M.; Helliwell, C.A.; Ito, T.; Meyerowitz, E.; Yu, H. A Repressor Complex Governs the Integration of Flowering Signals in Arabidopsis. Dev. Cell 2008, 15, 110–120. [Google Scholar] [CrossRef]
- Tiwari, S.B.; Shen, Y.; Chang, H.-C.; Hou, Y.; Harris, A.; Ma, S.F.; McPartland, M.; Hymus, G.J.; Adam, L.; Marion, C.; et al. The Flowering Time Regulator CONSTANS Is Recruited to the FLOWERING LOCUS T Promoter via a Unique Cis-Element. New Phytol. 2010, 187, 57–66. [Google Scholar] [CrossRef]
- Fornara, F.; de Montaigu, A.; Coupland, G. SnapShot: Control of Flowering in Arabidopsis. Cell 2010, 141, 550.e1–550.e2. [Google Scholar] [CrossRef]
- Bouché, F.; Lobet, G.; Tocquin, P.; Périlleux, C. FLOR-ID: An Interactive Database of Flowering-Time Gene Networks in Arabidopsis thaliana. Nucleic Acids Res. 2016, 44, D1167–D1171. [Google Scholar] [CrossRef]
- Surkova, S.Y.; Samsonova, M.G. Mechanisms of Vernalization-Induced Flowering in Legumes. Int. J. Mol. Sci. 2022, 23, 9889. [Google Scholar] [CrossRef]
- Hecht, V.; Foucher, F.; Ferrándiz, C.; Macknight, R.; Navarro, C.; Morin, J.; Vardy, M.E.; Ellis, N.; Beltrán, J.P.; Rameau, C.; et al. Conservation of Arabidopsis Flowering Genes in Model Legumes. Plant Physiol. 2005, 137, 1420–1434. [Google Scholar] [CrossRef] [PubMed]
- Liew, L.C.; Singh, M.B.; Bhalla, P.L. Unique and Conserved Features of Floral Evocation in Legumes. J. Integr. Plant Biol. 2014, 56, 714–728. [Google Scholar] [CrossRef] [PubMed]
- Jaudal, M.; Monash, J.; Zhang, L.; Wen, J.; Mysore, K.S.; Macknight, R.; Putterill, J. Overexpression of Medicago SVP Genes Causes Floral Defects and Delayed Flowering in Arabidopsis but Only Affects Floral Development in Medicago. J. Exp. Bot. 2014, 65, 429–442. [Google Scholar] [CrossRef] [PubMed]
- Hecht, V.; Knowles, C.L.; Vander Schoor, J.K.; Liew, L.C.; Jones, S.E.; Lambert, M.J.M.; Weller, J.L. Pea LATE BLOOMER1 Is a GIGANTEA Ortholog with Roles in Photoperiodic Flowering, Deetiolation, and Transcriptional Regulation of Circadian Clock Gene Homologs. Plant Physiol. 2007, 144, 648–661. [Google Scholar] [CrossRef]
- Wong, A.C.S.; Hecht, V.F.G.; Picard, K.; Diwadkar, P.; Laurie, R.E.; Wen, J.; Mysore, K.; Macknight, R.C.; Weller, J.L. Isolation and Functional Analysis of CONSTANS-LIKE Genes Suggests That a Central Role for CONSTANS in Flowering Time Control Is Not Evolutionarily Conserved in Medicago Truncatula. Front. Plant Sci. 2014, 5, 486. [Google Scholar] [CrossRef] [PubMed]
- Weller, J.L.; Ortega, R. Genetic Control of Flowering Time in Legumes. Front. Plant Sci. 2015, 6, 207. [Google Scholar] [CrossRef]
- Laurie, R.E.; Diwadkar, P.; Jaudal, M.; Zhang, L.; Hecht, V.; Wen, J.; Tadege, M.; Mysore, K.S.; Putterill, J.; Weller, J.L.; et al. The Medicago FLOWERING LOCUS T Homolog, MtFTa1, Is a Key Regulator of Flowering Time. Plant Physiol. 2011, 156, 2207–2224. [Google Scholar] [CrossRef]
- Jaudal, M.; Yeoh, C.C.; Zhang, L.; Stockum, C.; Mysore, K.S.; Ratet, P.; Putterill, J. Retroelement Insertions at the Medicago FTa1 Locus in Spring Mutants Eliminate Vernalisation but Not Long-Day Requirements for Early Flowering. Plant J. 2013, 76, 580–591. [Google Scholar] [CrossRef]
- Hecht, V.; Laurie, R.E.; Schoor, J.K.V.; Ridge, S.; Knowles, C.L.; Liew, L.C.; Sussmilch, F.C.; Murfet, I.C.; Macknight, R.C.; Weller, J.L. The Pea GIGAS Gene Is a FLOWERING LOCUS T Homolog Necessary for Graft-Transmissible Specification of Flowering but Not for Responsiveness to Photoperiod. Plant Cell 2011, 23, 147–161. [Google Scholar] [CrossRef]
- Nelson, M.N.; Książkiewicz, M.; Rychel, S.; Besharat, N.; Taylor, C.M.; Wyrwa, K.; Jost, R.; Erskine, W.; Cowling, W.A.; Berger, J.D.; et al. The Loss of Vernalization Requirement in Narrow-Leafed Lupin Is Associated with a Deletion in the Promoter and de-Repressed Expression of a Flowering Locus T (FT) Homologue. New Phytol. 2017, 213, 220–232. [Google Scholar] [CrossRef]
- Iqbal, M.M.; Erskine, W.; Berger, J.D.; Nelson, M.N. Phenotypic Characterisation and Linkage Mapping of Domestication Syndrome Traits in Yellow Lupin (Lupinus luteus L.). Theor. Appl. Genet. 2020, 133, 2975–2987. [Google Scholar] [CrossRef] [PubMed]
- Fudge, J.B.; Lee, R.H.; Laurie, R.E.; Mysore, K.S.; Wen, J.; Weller, J.L.; Macknight, R.C. Medicago Truncatula SOC1 Genes Are Up-Regulated by Environmental Cues That Promote Flowering. Front. Plant. Sci. 2018, 9, 496. [Google Scholar] [CrossRef] [PubMed]
- Yuan, X.; Wang, Q.; Yan, B.; Zhang, J.; Xue, C.; Chen, J.; Lin, Y.; Zhang, X.; Shen, W.; Chen, X. Single-Molecule Real-Time and Illumina-Based RNA Sequencing Data Identified Vernalization-Responsive Candidate Genes in Faba Bean (Vicia faba L.). Front. Genet. 2021, 12, 656137. [Google Scholar] [CrossRef] [PubMed]
- Kaufmann, K.; Wellmer, F.; Muiño, J.M.; Ferrier, T.; Wuest, S.E.; Kumar, V.; Serrano-Mislata, A.; Madueño, F.; Krajewski, P.; Meyerowitz, E.M.; et al. Orchestration of Floral Initiation by APETALA1. Science 2010, 328, 85–89. [Google Scholar] [CrossRef] [PubMed]
- Taylor, S.A.; Hofer, J.M.I.; Murfet, I.C.; Sollinger, J.D.; Singer, S.R.; Knox, M.R.; Ellis, T.H.N. PROLIFERATING INFLORESCENCE MERISTEM, a MADS-Box Gene That Regulates Floral Meristem Identity in Pea. Plant Physiol. 2002, 129, 1150–1159. [Google Scholar] [CrossRef] [PubMed]
- Benlloch, R.; Berbel, A.; Ali, L.; Gohari, G.; Millán, T.; Madueño, F. Genetic Control of Inflorescence Architecture in Legumes. Front. Plant Sci. 2015, 6, 543. [Google Scholar] [CrossRef] [PubMed]
- Jaudal, M.; Zhang, L.; Che, C.; Li, G.; Tang, Y.; Wen, J.; Mysore, K.S.; Putterill, J. A SOC1-like Gene MtSOC1a Promotes Flowering and Primary Stem Elongation in Medicago. J. Exp. Bot. 2018, 69, 4867–4880. [Google Scholar] [CrossRef]
- Welch, S.M.; Roe, J.L.; Dong, Z. A Genetic Neural Network Model of Flowering Time Control in Arabidopsis thaliana. Agron. J. 2003, 95, 71–81. [Google Scholar] [CrossRef]
- Jaeger, K.E.; Pullen, N.; Lamzin, S.; Morris, R.J.; Wigge, P.A. Interlocking Feedback Loops Govern the Dynamic Behavior of the Floral Transition in Arabidopsis. Plant Cell 2013, 25, 820–833. [Google Scholar] [CrossRef]
- Pullen, N.; Jaeger, K.E.; Wigge, P.A.; Morris, R.J. Simple Network Motifs Can Capture Key Characteristics of the Floral Transition in Arabidopsis. Plant Signal. Behav. 2013, 8, e26149. [Google Scholar] [CrossRef] [PubMed]
- Wang, C.C.N.; Chang, P.-C.; Ng, K.-L.; Chang, C.-M.; Sheu, P.C.Y.; Tsai, J.J.P. A Model Comparison Study of the Flowering Time Regulatory Network in Arabidopsis. BMC Syst. Biol. 2014, 8, 15. [Google Scholar] [CrossRef] [PubMed]
- Valentim, F.L.; van Mourik, S.; Posé, D.; Kim, M.C.; Schmid, M.; van Ham, R.C.H.J.; Busscher, M.; Sanchez-Perez, G.F.; Molenaar, J.; Angenent, G.C.; et al. A Quantitative and Dynamic Model of the Arabidopsis Flowering Time Gene Regulatory Network. PLoS ONE 2015, 10, e0116973. [Google Scholar] [CrossRef] [PubMed]
- Gursky, V.V.; Kozlov, K.N.; Nuzhdin, S.V.; Samsonova, M.G. Dynamical Modeling of the Core Gene Network Controlling Flowering Suggests Cumulative Activation From the FLOWERING LOCUS T Gene Homologs in Chickpea. Front. Genet. 2018, 9, 547. [Google Scholar] [CrossRef] [PubMed]
- Pavlinova, P.; Samsonova, M.G.; Gursky, V.V. Dynamical Modeling of the Core Gene Network Controlling Transition to Flowering in Pisum sativum. Front. Genet. 2021, 12, 614711. [Google Scholar] [CrossRef] [PubMed]
- Mangan, S.; Alon, U. Structure and Function of the Feed-Forward Loop Network Motif. Proc. Natl. Acad. Sci. USA 2003, 100, 11980–11985. [Google Scholar] [CrossRef] [PubMed]
- Alon, U. An Introduction to Systems Biology: Design Principles of Biological Circuits; CRC Press: Boca Raton, FL, USA, 2006; ISBN 978-1-58488-642-6. [Google Scholar]
- Duk, M.A.; Samsonova, M.G.; Samsonov, A.M. Dynamics of miRNA Driven Feed-Forward Loop Depends upon miRNA Action Mechanisms. BMC Genom. 2014, 15 (Suppl. S12), S9. [Google Scholar] [CrossRef]
- Drevon, D.; Fursa, S.R.; Malcolm, A.L. Intercoder Reliability and Validity of WebPlotDigitizer in Extracting Graphed Data. Behav. Modif. 2017, 41, 323–339. [Google Scholar] [CrossRef]
- Jaudal, M.; Zhang, L.; Che, C.; Hurley, D.G.; Thomson, G.; Wen, J.; Mysore, K.S.; Putterill, J. MtVRN2 Is a Polycomb VRN2-like Gene Which Represses the Transition to Flowering in the Model Legume Medicago Truncatula. Plant J. 2016, 86, 145–160. [Google Scholar] [CrossRef]
- van Dijk, A.D.J.; Molenaar, J. Floral Pathway Integrator Gene Expression Mediates Gradual Transmission of Environmental and Endogenous Cues to Flowering Time. PeerJ 2017, 5, e3197. [Google Scholar] [CrossRef]
- Samee, M.A.H.; Lim, B.; Samper, N.; Lu, H.; Rushlow, C.A.; Jiménez, G.; Shvartsman, S.Y.; Sinha, S. A Systematic Ensemble Approach to Thermodynamic Modeling of Gene Expression from Sequence Data. Cell Syst. 2015, 1, 396–407. [Google Scholar] [CrossRef] [PubMed]
Disclaimer/Publisher’s Note: The statements, opinions and data contained in all publications are solely those of the individual author(s) and contributor(s) and not of MDPI and/or the editor(s). MDPI and/or the editor(s) disclaim responsibility for any injury to people or property resulting from any ideas, methods, instructions or products referred to in the content. |
© 2023 by the authors. Licensee MDPI, Basel, Switzerland. This article is an open access article distributed under the terms and conditions of the Creative Commons Attribution (CC BY) license (https://creativecommons.org/licenses/by/4.0/).