Abstract
Despite their enormous impact on the environment and humans, the distribution and variety of the biggest natural secondary metabolite producers, the genus Streptomyces, have not been adequately investigated. We developed representative maps from public EMP 16S rRNA amplicon sequences microbiomics data. Streptomyces ASVs were extracted from the EMP overall bacterial community, demonstrating Streptomyces diversity and identifying crucial diversity patterns. Our findings revealed that while the EMP primarily distinguished bacterial communities as host-associated or free-living (EMPO level 1), the Streptomyces community showed no significant difference but exhibited distinctions between categories in EMPO level 2 (animal, plant, non-saline, and saline). Multiple linear regression analysis demonstrated that pH, temperature, and salinity significantly predicted Streptomyces richness, with richness decreasing as these factors increased. However, latitude and longitude do not predict Streptomyces richness. Our Streptomyces maps revealed that additional samplings in Africa and Southeast Asia are needed. Additionally, our findings indicated that a greater number of samples did not always result in greater Streptomyces richness; future surveys may not necessitate extensive sampling from a single location. Broader sampling, rather than local/regional sampling, may be more critical in answering microbial biogeograph questions. Lastly, using 16S rRNA gene sequencing data has some limitations, which should be interpreted cautiously.
1. Introduction
The genus Streptomyces is classified as a group of Gram-positive filamentous bacteria [1,2]. The distinct life cycle of Streptomyces includes the onset of vegetative mycelia autolysis via a programmed cell death-like mechanism to provide nutrients required for the development of aerial mycelia, which then develop into a long chain of spores. Meanwhile, to protect such nutrients from competing microorganisms, Streptomyces species produce bioactive small molecules, which humans have used in the pharmaceutical industry, making the genus well-known as a major antibiotic producer [3,4,5,6,7]. This group can be found in various environments, especially soil and sediments [1,8]. Streptomyces species are of interest because of their ability to produce essential bioactive secondary metabolites such as antibiotics. It has been indicated that Streptomyces antibiotic biosynthesis pathways account for about 5–10% of their genome [9,10]. Moreover, previous research has also shown that Streptomyces strains are crucial not only to human health but also to the agricultural system and global ecosystem. As of now, more than 600 species are known to be included in the genus [11]. Members in the genus Streptomyces are abundant in the soil as they play a crucial role in the cycle of carbon trapped in insoluble organic debris, especially from plants and fungi, by producing several hydrolytic exoenzymes for macromolecule digestion [3]. Many researchers have investigated Streptomyces spp. as a rhizosphere microbe and endophyte, which has showed that these Streptomyces produce metabolites to prevent plants from other bacterial and fungal infections [12,13,14,15]. In recent decades, the isolation and exploitation of Streptomyces spp. from conventional environments, such as soil and seawater, for the discovery of novel compounds have resulted in the rediscovery of previously known compounds. Therefore, the recent isolation of Streptomyces has been directed towards exotic and unexplored sources, including hypersaline marine environments, marine sediment, volcanic areas, hyper-arid deserts and cryoenvironments, and those associated with plants and animals [5,16,17,18,19,20]. Despite their crucial contribution to the environment and humans, curated documentation about large-scale Streptomyces distribution and diversity is very limited to local and regional investigation, which needs to be investigated further using a standardized procedure on a global level.
Previous studies of Streptomyces spp. are based on cultivation, isolation, and first-generation sequencing, such as the Sanger sequencing method, which showed Streptomyces spp. regional biography [21,22]. However, there are limitations to using traditional methods in many ecosystems. Culturing procedures often underestimate the true microbial diversity and are sometimes unreliable for microbial community characterization [23]. Additionally, many potential factors contribute to global microbial biogeography, such as environments, geography, pH, temperature, salinity, etc. [24,25,26]. As a result, a representative Streptomyces global distribution profile is difficult to decipher using traditional cultivation and isolation alone. Moreover, it is very complicated to compare or link between studies when different methods are used to assess Streptomyces diversity. With technological advancement, we can now rapidly obtain this information from all around the world using next-generation sequencing (NGS). The NGS method can obtain a higher number of sequences and provide more details regarding microbial communities. This method was used in the Earth Microbiome Project (EMP) [27,28,29,30,31], which will not only provide an opportunity for a standardized procedure (sequencing platform, amplicon region, and amplicon metabarcoding protocol) on a global level of bacterial diversity, including Streptomyces spp., but also eliminates the complication and complexity in diversity comparison using public sequences from many projects that used different procedures to acquire the sequences.
Similar to the EMP, other platforms for curated environment microbiome databases and resources have emerged for extreme environment microorganisms, a global catalog of the urban microbiome, northern Chile’s arid and desert microbiome, and the soil microbiome. These platforms include the Extreme Microbiome Project (XMP) [32], the International Metagenomics and Metadesign of Subways and Urban Biomes (MetaSUB) Consortium [33], the Atacama Database [34], and Biomes of Australian Soil Environments (BASE) [35], respectively. Nevertheless, the EMP is a massive crowd-sourced database comprising around 100 studies, which makes it the most suitable source for our study. The EMP studied global microbial diversity using NGS [31]. As a baseline documentation for a general global bacterial diversity pattern, the EMP showed that the aspect of host association was crucial for the overall bacterial communities [31]. The overall bacterial richness was lower in host-associated communities than in free-living populations (except plant rhizospheres in EMP, which are similar to free-living soil communities) [31]. In free-living samples, bacterial compositions in saline samples are distinct from non-saline samples. In non-host-associated habitats, the alpha diversity analysis of the large EMP dataset demonstrates a small but significant trend toward increasing species richness at lower latitudes. While the EMP is the beginning of deciphering bacterial global biogeography, the authors also indicated that the rate at which data are generated outpaces our ability to extract useful information. According to the distinct morphology of the genus Streptomyces, e.g., tip extension mycelia and long-lived spores and the ability to produce antagonistic compounds against microorganisms, altogether, it is worth investigating whether the alpha and beta diversity of Streptomyces spp. is similar to the overall bacterial communities presented in the EMP or not. To unravel the large, complicated EMP dataset at a finer resolution, Streptomyces ASVs diversity data will be obtained from the EMP bacterial dataset to investigate alpha and beta diversity in comparison to the EMP diversity results and to develop baseline documentation for future Streptomyces diversity studies.
Therefore, the main objectives of this study are to determine whether the Streptomyces composition pattern is similar or different from the overall microbial community and to establish comprehensive Streptomyces diversity maps. By leveraging the utilization of the EMP 16S rRNA gene (16S) dataset and focusing on Streptomyces diversity specifically, we predict that (1) the Streptomyces ASVs alpha and beta diversity pattern is different from the overall global microbial community, in which different geographical locations and environments structure the Streptomyces communities with respect to both richness and composition, and that (2) increasing the number of sample collections in a particular location did not always result in greater Streptomyces ASVs richness, though the 16S rRNA gene may not have sufficient resolution to differentiate all Streptomyces species. Additionally, given the data we retrieved from the public database, more sampling is needed in many locations to capture the global diversity of Streptomyces. Insights from this work will not only help determine and document what we know about Streptomyces diversity using a reliable, standardized procedure, but will also provide potential indications of the future sampling and surveys that should be investigated to understand the true global Streptomyces diversity. Additionally, biogeography data on Streptomyces diversity would help pinpoint the locations for Streptomyces isolation, perhaps leading to a potential novel strain and drug discoveries.
2. Materials and Methods
2.1. Data Retrieval
Sample processing, sequencing, and core amplicon data analyses were performed as part of the Earth Microbiome Project (www.earthmicrobiome.org (accessed on 9 March 2022)), and all amplicon sequence data and metadata have been made public through the EMP data portal (https://qiita.ucsd.edu/emp/ (accessed on 9 March 2022)). The 16S rRNA amplicon sequences data were retrieved from the EMP Zenodo archive (https://doi.org/10.5281/zenodo.890000 (accessed on 9 March 2022)) [31]. Briefly, for all these samples, DNA extraction and 16S rRNA amplicon sequencing were performed following the standard protocols outlined in the EMP (http://www.earthmicrobiome.org/protocols-and-standards/16s (accessed on 9 March 2022)). The sequence data underwent demultiplexing and minimal quality filtering through the QIIME 1.9.1 script, split_libraries_fastq.py60, utilizing a Phred quality threshold of 3 and default parameters to produce study-specific FASTA sequence files. Subsequently, the sequence data underwent error filtering and trimming to the length of the shortest sequencing run (90 bp) using the Deblur software 1.0.0. After retrieving the data, amplicon sequence variants (ASVs), specifically within the Streptomyces genus, were extracted from the EMP data. The Illumina amplicons used for this study targeted the V4 region of the 16S rRNA gene (rDNA), with a sequence length of ~390 base pairs. “emp_cr_silva_16S_123.release1.biom” was used as a source for an amplicon sequence variants (ASVs) table. This biom file also provided taxonomy data referencing the SILVA high-quality ribosomal RNA database [36]. “emp_qiime_mapping_release1_20170912.tsv” was used as a mapping file for data analysis. The raw ASVs table (307,572 ASVs) and taxonomy from the EMP 16S rRNA amplicon sequences data consisted of 27,406 samples collected worldwide.
2.2. Bioinformatics and Data Processing
This research focused on representative Streptomyces spp. diversity from 43 locations and 96 studies within the EMP data; therefore, 307,572 raw ASVs in an ASV table and taxonomy were filtered to obtain only Streptomyces ASVs using the “filter_taxa_from_otu_table.py” function in Qiime [37]. Then, the biom table containing only Streptomyces ASVs was converted to an ASV table with taxonomy information for each associated ASV using the “biom_convert” function [38]. After data processing, there were 485 ASVs at the ranks of species and subspecies of Streptomyces taxa from 34 countries (the samples summary table is available at https://github.com/natpombubpa-lab/Strep_biogeo/blob/main/Sample_metadata_summary.csv). Singleton ASVs were removed resulting in 429 ASVs, by using “prune_taxa” and “taxa_sums” from the Phyloseq packages [39] in R version 4.0.2 [40] and R studio version 1.3.1093 [41].
2.3. Data Analysis
Streptomyces alpha diversity results from the rarefied ASVs data were compared to (1) overall bacteria alpha diversity using the same analysis pipeline and (2) directly compared to Thompson et al., 2017 overall bacteria alpha diversity results for confirmation. The Phyloseq package was used to assess filtered microbial ASV alpha diversity, beta diversity, and taxonomic composition. Levene’s test, Bartlett’s test, and Hartley’s Fmax test were used in R to check for homoscedasticity in alpha diversity data variances [42]. The ‘Anova’ function in R was used to evaluate homoscedasticity data (alpha diversity), and the ‘TukeyHSD’ function was used to conduct pairwise multiple comparisons (Tukey test). A type = ‘III’ ANOVA was used to adjust for the unbalanced design comparison. Multiple linear regression analysis on environmental factors that are available for the majority of the samples (pH, temperature, and salinity) were performed using the ‘lm’ function for both Streptomyces and overall bacteria. To compare beta diversity amongst the samples, PERMANOVA was employed with the ‘adonis’ function in the ‘vegan’ package and visualized using PcoA in R using Bray–Curtis distance [43]. Diversity analysis was performed using the Earth Microbiome Project Ontology (EMPO), including EMPO level 1–3. EMPO level 1 includes free-living and host-associated. EMPO level 2 includes saline, non-saline, animal, and plant. EMPO level 3 includes water (saline), sediment (saline), hypersaline (saline), surface (saline), water (non-saline), sediment (non-saline), soil (non-saline), surface (non-saline), aerosol (non-saline), animal distal gut, animal proximal gut, animal secretion, animal surface, animal corpus, plant surface, plant rhizosphere, and plant corpus. Then, Streptomyces beta diversity results were directly compared to overall bacteria beta diversity results in Thompson et al., 2017 [31]. Bioinformatics, data processing, and data analysis coding scripts are available on GitHub at the following link: https://github.com/natpombubpa-lab/Strep_biogeo.
3. Results
3.1. Does the Environment Shape Streptomyces Composition and Richness Differently Compared to the Overall Bacterial Community Pattern Found in the EMP?
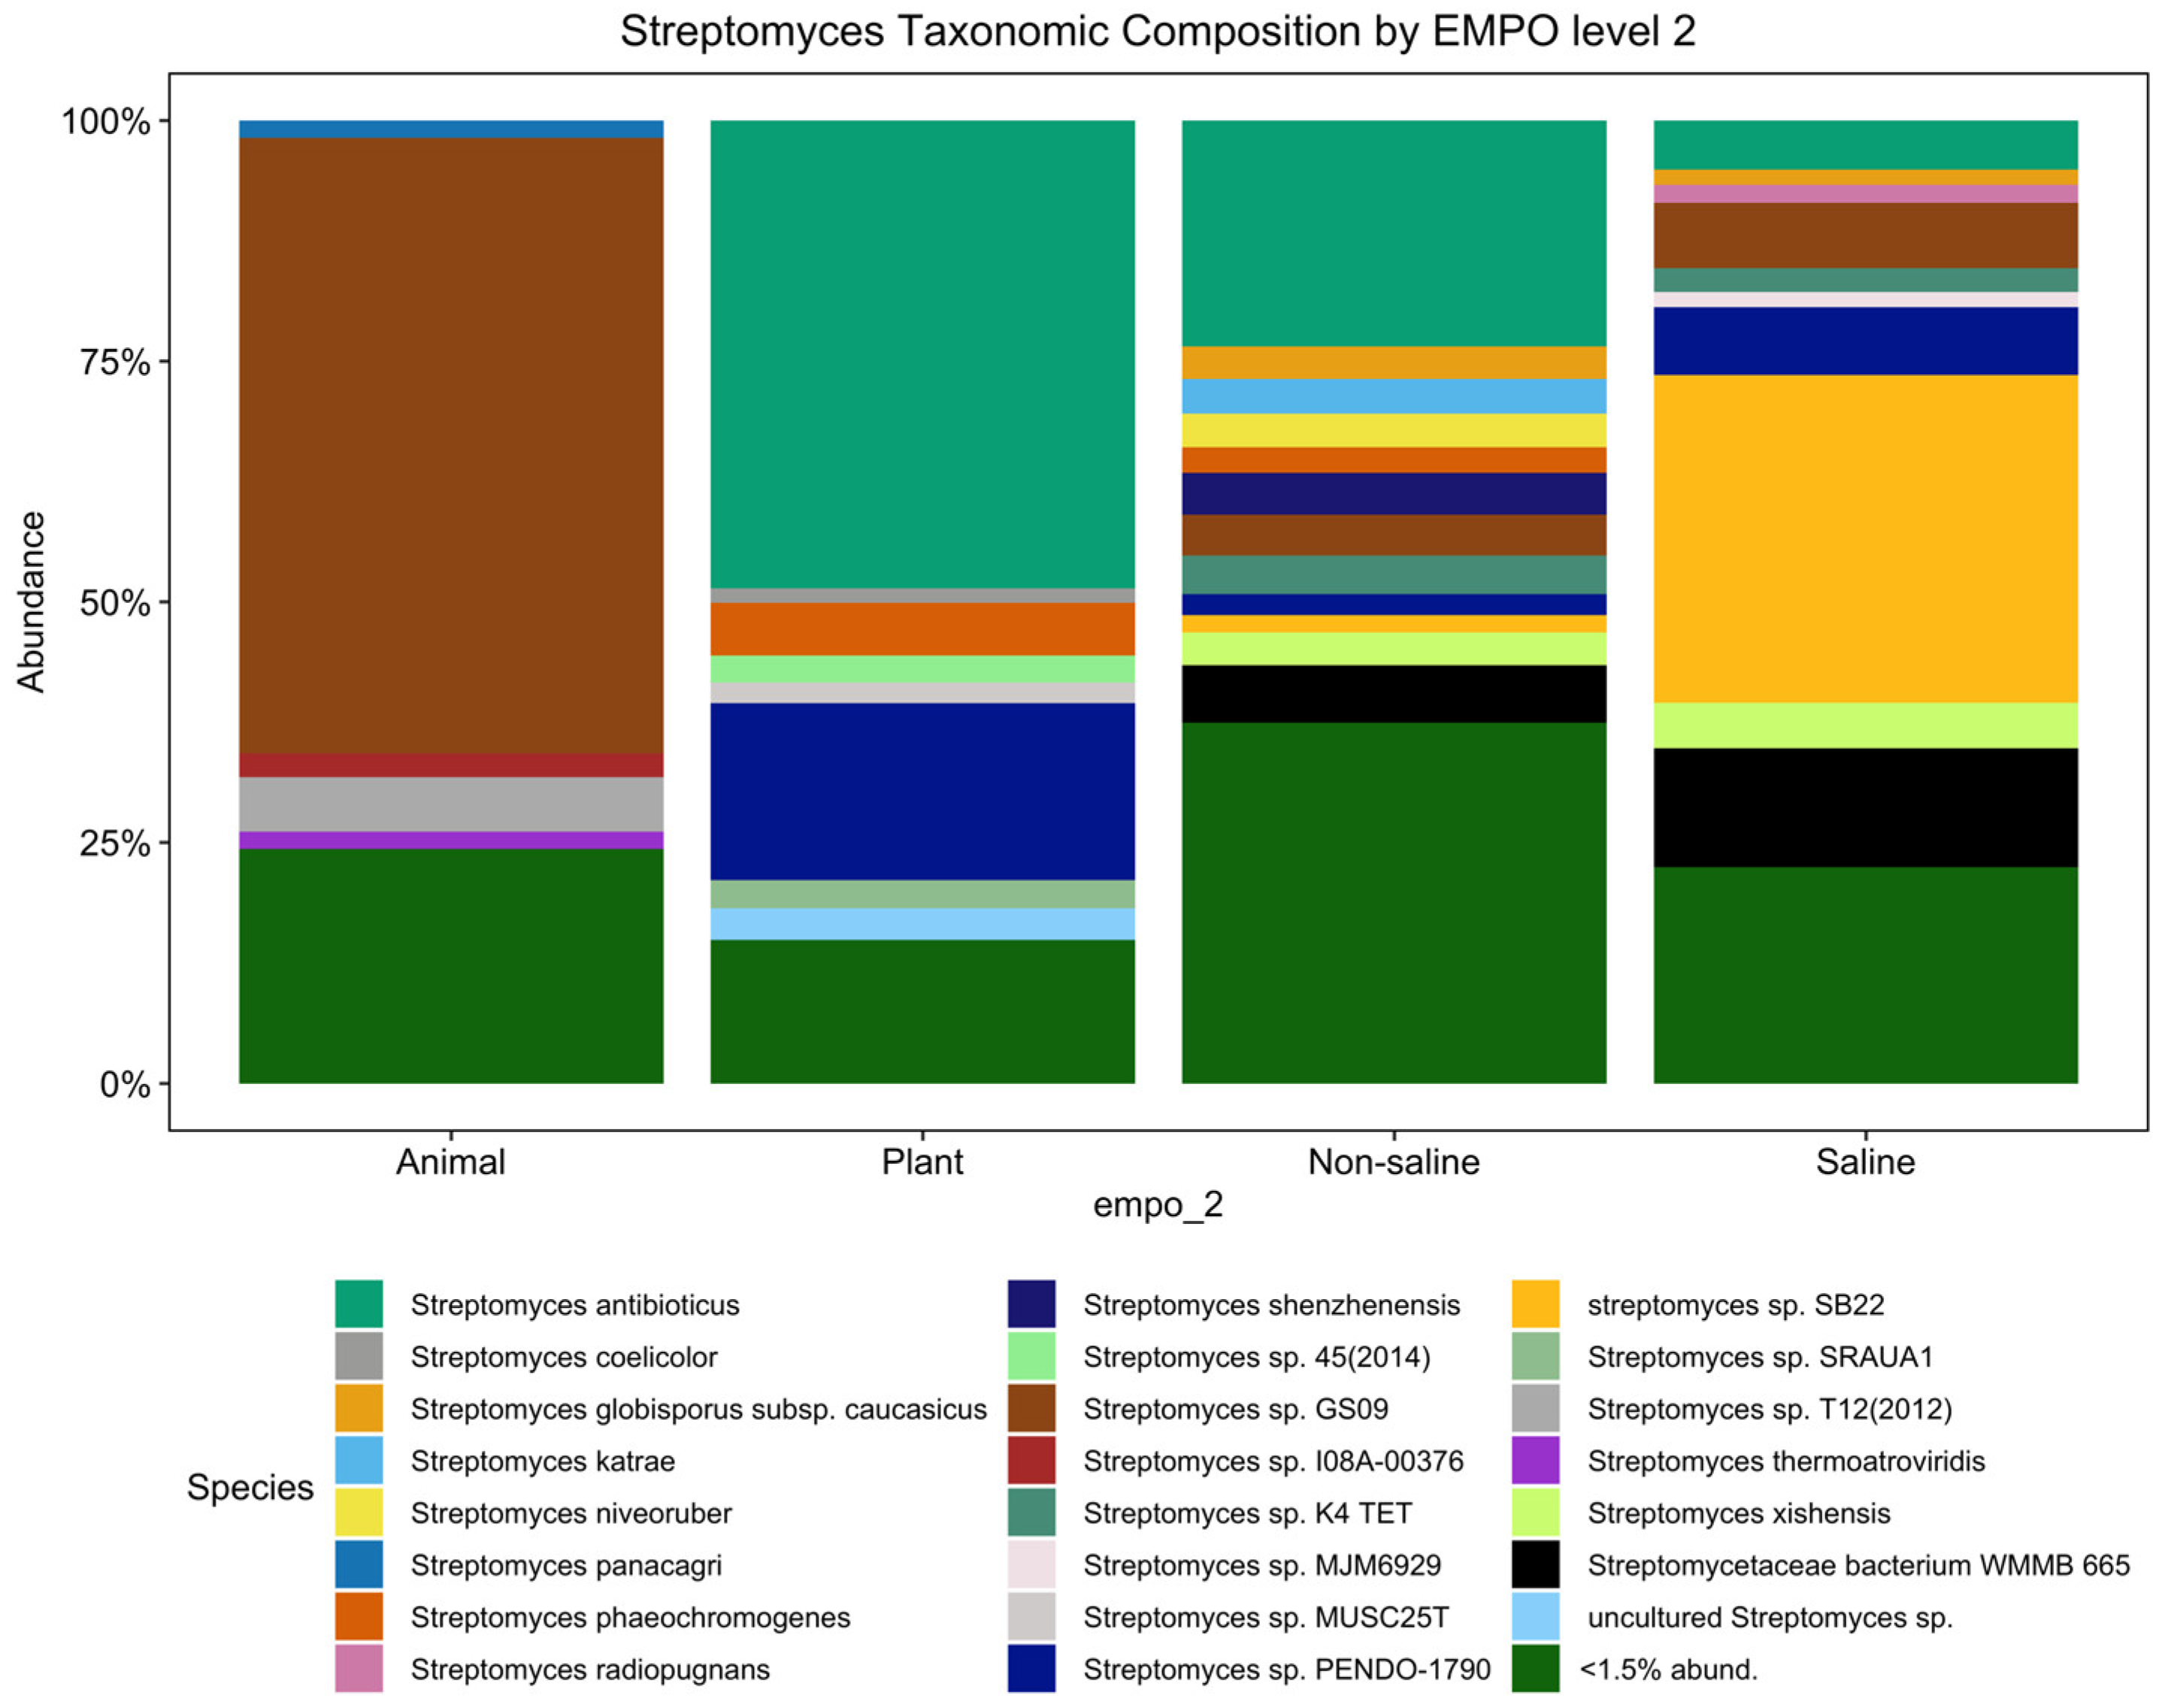
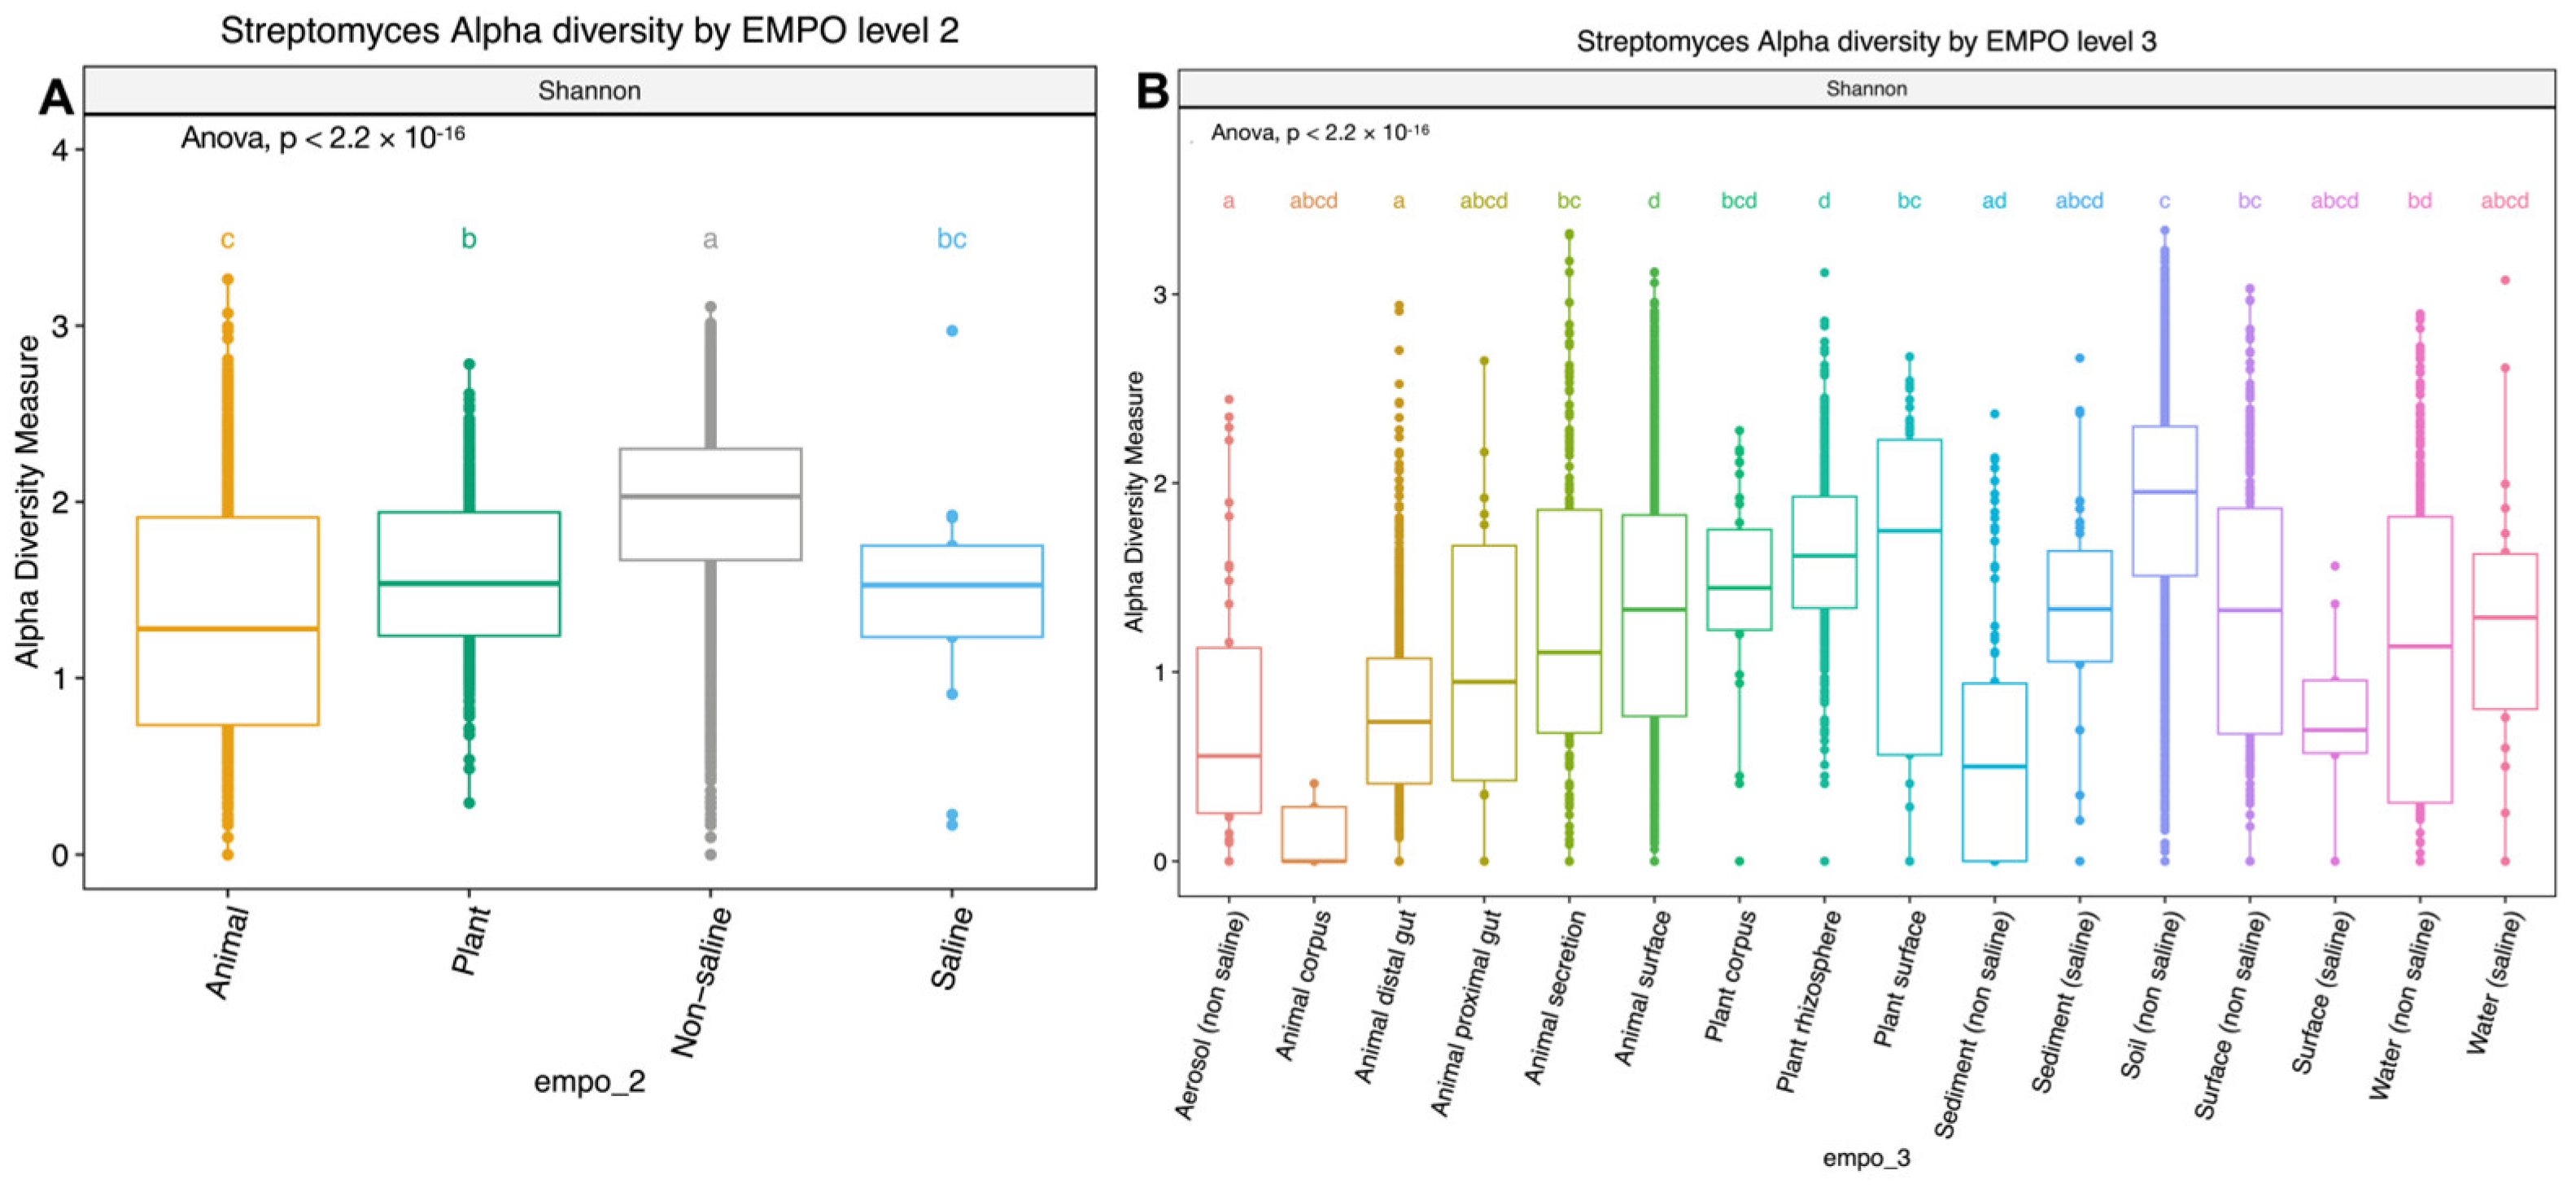
Although the significant distinction of the bacterial microbial composition in the EMP was host-associated vs. free-living samples [31] (Figure S1A) (ANOVA, F(3,7356) = 387.8, p < 2.2 × 10⁻¹⁶), the Streptomyces community showed no significant difference among host-associated vs. free-living samples. However, the Streptomyces community showed distinct patterns between animal and plant samples (Figure 1), which is supported with alpha diversity analysis showing that richness is significantly different (ANOVA, F(3,3211) = 210.4, p < 2.2 × 10⁻¹⁶) (Figure 2A). However, the Streptomyces taxa with the greatest relative abundance of Streptomyces spp. are similar between non-saline and saline samples, but both the number and composition of abundant ASVs/strains were distinct among four EMPO groups. In general, S. antibioticus was the most common and abundant strain, which was found in all EMPO level 2 categories except in animal samples.
Figure 1.
Streptomyces taxonomic composition bar plot showing distinct composition among animal, plant, non-saline, and saline samples (<1.5% abund. = <1.5% relative abundance). Among 429 ASVs, there were 23 Streptomyces spp. (27 ASVs) with a relative abundance exceeding 1.5 percent. However, the minor but diverse ASVs (<1.5%) represented 402 taxa (species/subspecies).
Figure 2.
Boxplots showing alpha diversity (Shannon index) comparison of Streptomyces spp. in (A) EMPO level 2: animal, plant, non-saline, and saline samples and (B) EMPO level 3: aerosol (non-saline), animal corpus, animal distal gut, animal proximal gut, animal secretion, animal surface, plant corpus, plant rhizosphere, plant surface, sediment (non-saline), sediment (saline), soil (non-saline), surface (non-saline), surface (saline), water (non-saline), and water (saline). Boxplots show the 25th and 75th percentiles, while the median is shown as lines inside boxes. Error bars show the 1st and 99th percentile. Tukey HSD significant differences (p < 0.05) are indicated by different letters.
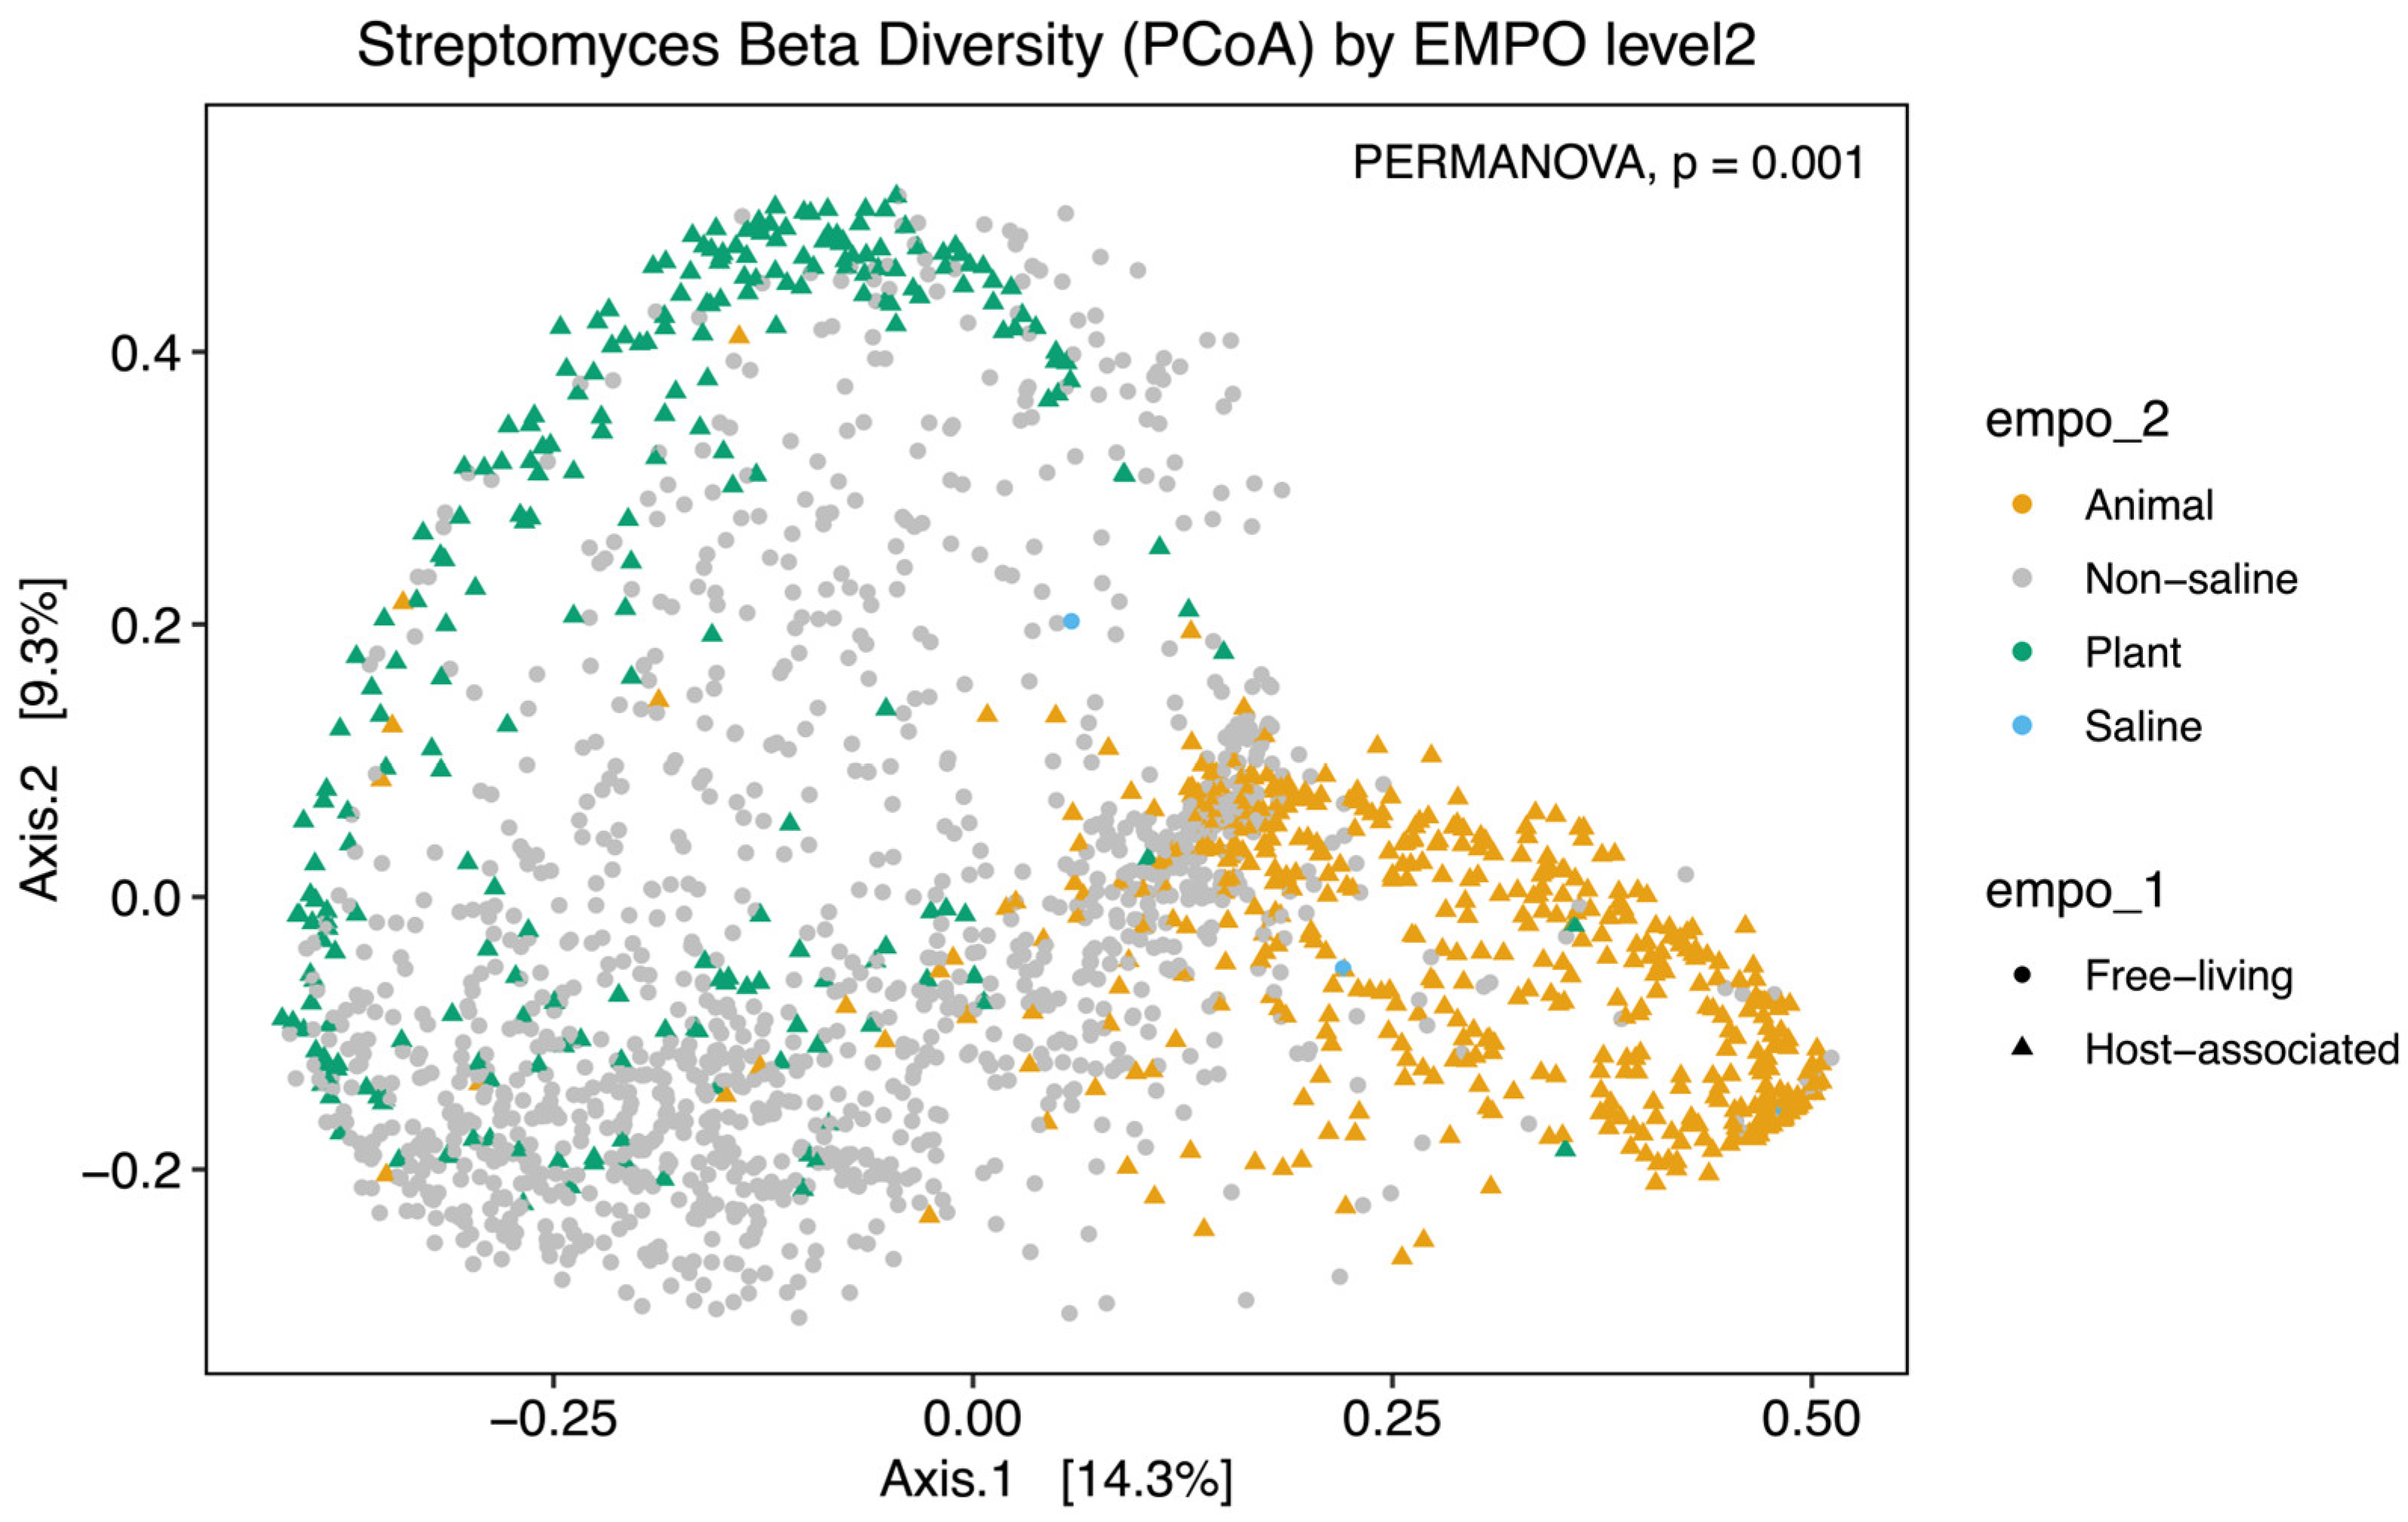
Alpha diversity analysis showed significant environmental differences for Streptomyces richness for both EMPO level 2 (ANOVA, F(3,3211) = 210.4, p < 2.2 × 10⁻¹⁶)(Figure 2A) and EMPO level 3 (ANOVA, F(15,3199) = 74.283, p < 2.2 × 10⁻¹⁶, Figure 2B), similar to the overall bacteria richness analysis in our study (Figure S1B,C) and Thomspon et al., 2017 [31]. In the EMPO level 2 alpha diversity comparison, Streptomyces richness was significantly higher in non-saline samples, whereas Streptomyces richness in animal and saline samples was not significantly different (Figure 2A). While the overall microbial richness was lower in host-associated (animal and plant) samples than in free-living (non-saline and saline) samples, from the EMP report and our analysis (Figure S1A), specifically focusing on Streptomyces spp. richness alone showed that Streptomyces richness differences were not significantly shaped by EMPO level 1 (host vs. free-living) but were determined by EMPO level 2 (animal, plant, non-saline, and saline). Additionally, Streptomyces richness at the ASV/strain level was also shaped differently by EMPO level 3. Streptomyces richness was highest in soil (non-saline) samples and lowest in sediment (non-saline) samples (Figure 2B). We also investigated how EMPO shaped beta diversity among the Streptomyces community. Beta diversity analysis showed significant differences among samples based on EMPO (PERMANOVA, p = 0.001) (Figure 3). The differences in Streptomyces beta diversity were visualized in a principal coordinate analysis (PcoA) plot (Figure 3). Microbial communities were shown to be tightly grouped by EMPO level 2 for animal samples in the PcoA plot. Plant and non-saline samples were not clearly separated from each other. EMPO level 1 alone (free-living and host-associated) also did not shape the Streptomyces community pattern.

Figure 3.
Beta diversity analysis of Streptomyces communities. Dissimilarity of Streptomyces community composition in the comparison between EMPO levels using PcoA. Different colors indicate EMPO level 2, including the yellow color for animal samples, the light gray color for non-saline samples, the green color for plant samples, and the blue color for saline samples. Circle points show free-living samples, while triangle points indicate host-associated samples. Significant differences among EMPO level 2 (PERMANOVA; p < 0.05) were shown on PcoA plots.
Additionally, multiple linear regression analysis on environmental factors, which are available for the majority of the samples (pH, temperature, and salinity), showed that pH, temperature, and salinity significantly predict Streptomyces richness (p < 0.05) in which richness decreases as pH, temperature, and salinity increase. In contrast, only pH and salinity significantly predict overall bacteria richness (p < 0.05). In our map, Streptomyces spp. richness was higher near the equator and lower near the north and south poles. However, linear regression analysis showed neither latitude nor longitude predicts Streptomyces richness (p > 0.05).
3.2. A Comprehensive Streptomyces Diversity Map: Do Geographical Locations Structure Streptomyces Community Diversity?
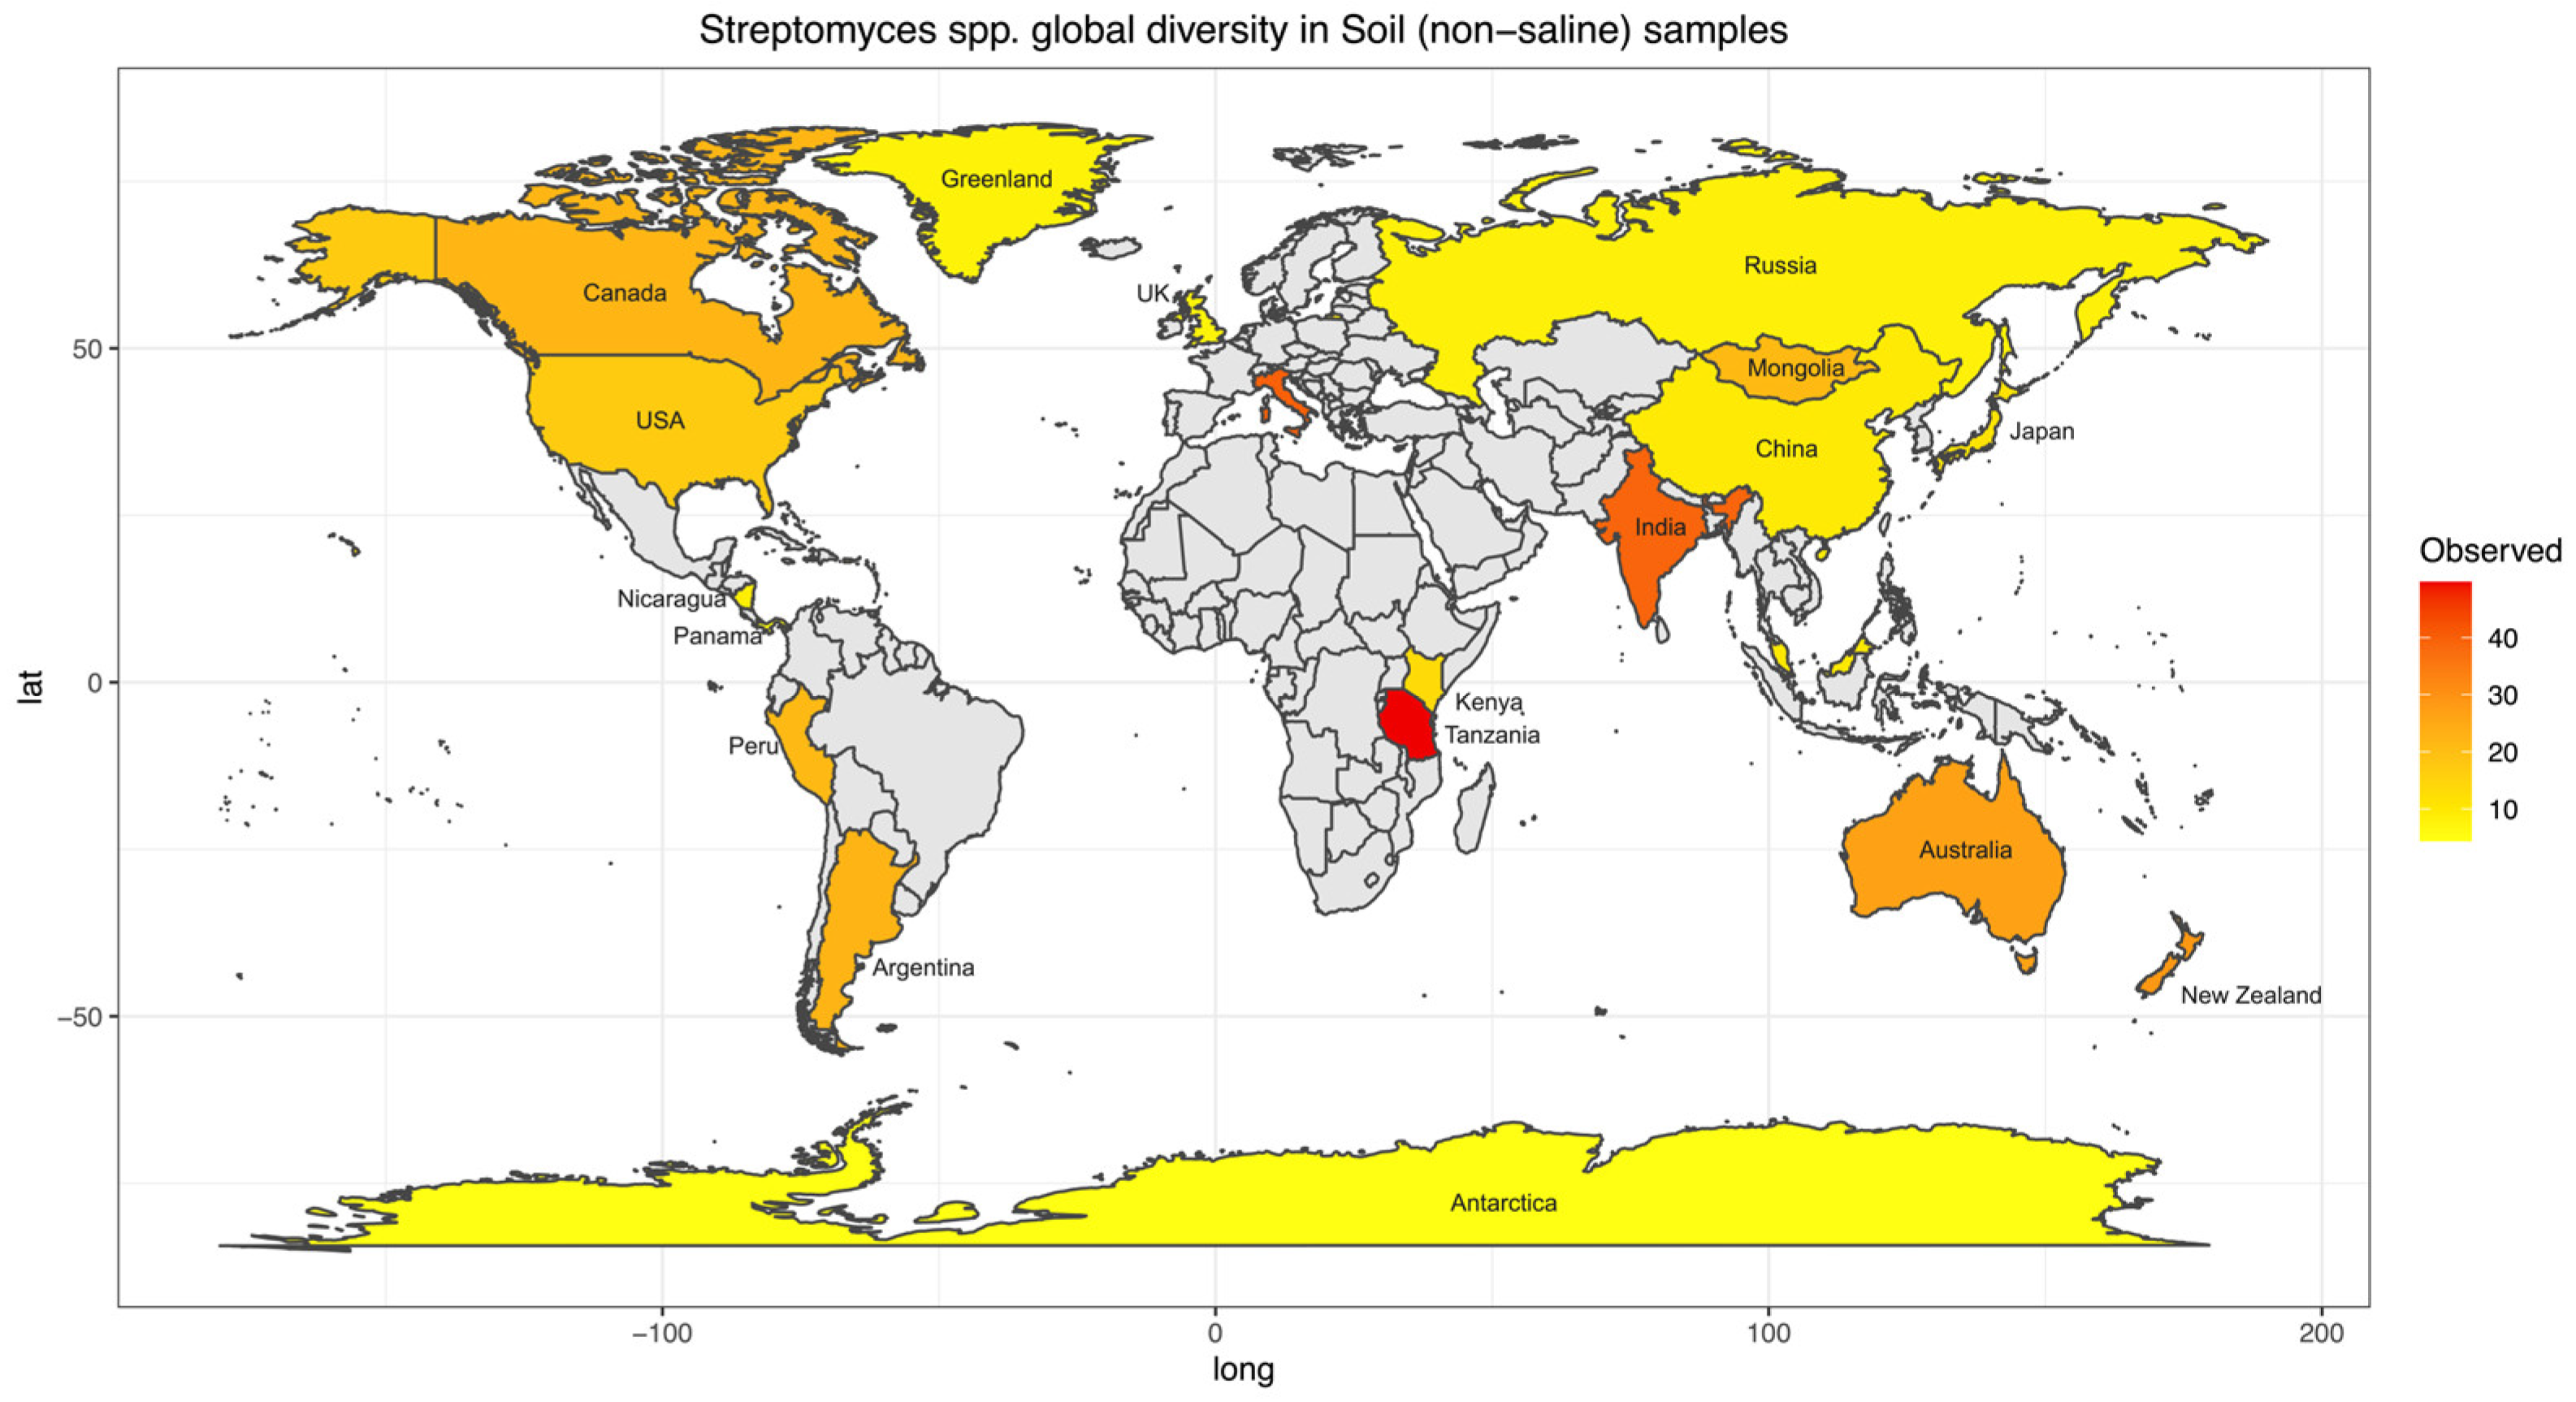
To further investigate biogeographical and environmental specificity, thirteen Streptomyces diversity maps were established based on the number of observed ASVs for each EMPO level 3, including (1) soil (non-saline) (Figure 4), (2) water (non-saline), (3) sediment (non-saline), (4) surface (non-saline), (5) aerosol (non-saline), (6) sediment (saline), (7) surface (saline), (8) water (saline), (9) animal surface, (10) animal secretion, (11) animal proximal gut, (12) animal distal gut, and (13) plant rhizosphere (Supplementary Information (SI), Figures S2–S13). The Streptomyces diversity map in soil (non-saline) samples revealed significant differences in Streptomyces richness across geographical locations (ANOVA, F(20,3480) = 125.6, p < 2.2 × 10⁻¹⁶, Figure 4). The number of observed soil Streptomyces ASVs were greatest in Tanzania and the second highest level of richness was observed in Italy. In contrast, low soil Streptomyces ASV richness was found in Antarctica, China, Greenland, Japan, Kenya, Malaysia, Nicaragua, Panama, Russia, and the United Kingdom (Scotland). While the number of soil samples in Italy (48 samples) was lower than in the United Kingdom (Scotland) (453 samples), the Streptomyces community was not only different in richness (highest richness in Italy though lower number of samples) but also distinct in ASV/strain composition (Figure 5). To confirm this pattern, further analysis using simple linear regression was performed to test if sample numbers significantly predicted Streptomyces richness. It was found that sample numbers do not significantly predict Streptomyces richness (p > 0.05).
Figure 4.
Streptomyces diversity map in soil (non-saline) samples showing species richness distribution worldwide. The average number of observed ASVs was shown as a gradient from lowest (yellow) to highest (red) diversity while grey color showed no Streptomyces or sample. Twenty-one regions were included in the soil (non-saline) Streptomyces diversity analysis. Note, some regions were not indicated on the map because of space limitations.
Figure 5.
Streptomyces taxonomic composition bar plot showing distinct composition between Italy and the United Kingdom (Scotland) (<1.5% abund. = <1.5% relative abundance). In total, there were 21 Streptomyces spp. with a relative abundance greater than 1.5 percent.
By mapping Streptomyces richness, general biogeographical patterns were observed for each EMPO level 3 environmental category. Generally, in non-saline (water, surface, and aerosol) samples, Streptomyces richness was high in the USA (Figures S2–S4). However, no water sample was taken from Asia, Africa, and Oceania. In contrast, in non-saline (sediment) samples, Streptomyces richness was high in Brazil but low in the USA and China (Figure S5). In saline (sediment and surface) samples, Streptomyces richness was low in the USA (Figures S6 and S7). However, in water (saline) samples, Streptomyces richness was high in Mexico but low in Brazil and Norway (Figure S8). In animal surface and proximal gut samples, Streptomyces richness was low in the USA (Figures S9 and S10). In animal secretion samples, Streptomyces richness was high in the USA and low in Venezuela (Figure S11). In animal distal gut samples, Streptomyces richness was generally high in South America and low in Germany and Australia (Figure S12). Lastly, in plant rhizosphere samples, Streptomyces richness was high in the USA and low in Japan (Figure S13).
4. Discussion
Our key results indicated that (1) while our Streptomyces maps revealed that samples were collected from all over the world, additional samplings, particularly in Africa and Southeast Asia, are still needed. Moreover, increasing the number of sample collections in a given location did not necessarily result in increasing Streptomyces diversity, and (2) the Streptomyces community showed no significant difference but exhibited distinctions between categories in EMPO level 2, whereas the EMP primarily distinguished bacterial communities as host-associated or free-living (EMPO level 1).
- Comprehensive Streptomyces diversity maps: Current sampling and future survey
Previously, Streptomyces diversity and biogeography were investigated at a regional scale, such as in the USA [21,22] and New Zealand [44]. The investigators used different methods, locations, and environments, especially for a very diverse Streptomyces genus. With the high-throughput sequencing method employed in New Zealand, latitude pattern was not the key driver for Streptomyces diversity. The approach differed from that in the USA, which used traditional culturing and sequencing techniques, leading to non-comparable results. Thus, the inconsistency in the sample preparation and sequencing methodology was presumably the limitation in interpreting an investigation. Moreover, Streptomyces studies oftentimes focused solely on soil collection while other environments were not usually investigated, most likely because they are considered soil/sediment inhabitants. It is believed that one gram of soil is estimated to contain 107 colony-forming units (CFU) of soil Actinobacteria [45] in which Streptomyces represents 50% of the total population [46]. Our comprehensive Streptomyces spp. maps helped fill these gaps and overcome this limitation since the same EMP standard procedure was used for the entire global sample collections in different environments [30]. Similar to other previous studies, soil samples were the most prevalent, and the Streptomyces spp. map was the most completed map of all EMPO level 3 categories (Figure 4). According to our map, Streptomyces spp. richness was higher near the equator and lower near the north and south poles, which was similar to the latitudinal pattern found earlier in the USA [21,22]; however, this pattern is not statistically significant (p > 0.05). While this pattern differed from the New Zealand [44] study, it could possibly explain the limitation of comparing different methods rather than local/regional sampling vs. global collection. At present, soil Streptomyces collection from the EMP represents a good starting point for biodiversity documentation. Still, our soil Streptomyces map showed that many countries, regions, and continents need to be taken into account, including Europe, the Middle East, Southeast Asia, and especially Africa. Although the map may show that there was no data from Africa, some soil Streptomyces research has actually been conducted, and new Streptomyces species have also been found in African soil [47]. However, a standard NGS procedure should be employed and added to the comprehensive soil Streptomyces map to investigate and compare the true diversity of Streptomyces spp. in African soil to global diversity. As the crucial antibiotics producers [9,10], investigating African soil would be essential to future Streptomyces research, especially when our current data from Tanzania showed that Streptomyces richness was the highest in the world. As a result, Africa is currently a black box for Streptomyces diversity investigation, and it is possible that many countries may have novel and essential Streptomyces spp. awaited to be found. Additionally, according to the review of new Streptomyces species published between January 2015 and December 2020, among 135 new species, 75 species were isolated from the terrestrial environment (non-saline soil) [48]. Whereas 6 novel species were from Africa, a total of 62 species were isolated from Asia, of which 39 species were reported from China, and the rest were from Southeast Asia, especially Thailand. Thus, additional NGS analyses of Streptomyces from Southeast Asia would be crucial to add to the Streptomyces biogeography map with high diversity potential.
Our Streptomyces spp. maps did not only show a comprehensive soil Streptomyces map but also indicated other environments where very limited research had been completed. Besides the Streptomyces spp. map in soil, other EMPO level 3 maps were still limited to several countries (Figures S2–S13). Streptomyces in water (non-saline), sediment (non-saline), surface (non-saline), aerosol (non-saline), sediment (saline), surface (saline), water (saline), animal surface, animal secretion, animal proximal gut, animal distal gut, and plant rhizosphere will need to be investigated further to be able to create more completed, comprehensive global diversity maps. To overcome this limitation, the same standard NGS procedure should be used for future sample collection and added to the maps we generated in this research. Moreover, future surveys would be crucial in some of these environments. For example, Streptomyces in marine environments has been shown to be a potentially important source of bioactive substances, many active secondary metabolites, and antimicrobial compounds [49,50,51]. However, our water (saline) Streptomyces map showed that there were only samples from Brazil, Mexico, and Norway (Figure S8), which identified the lack of standardized Streptomyces surveys in marine environments worldwide. Interestingly, our results showed that S. radiopugnans was the ASV/strain only found in saline environments but was not abundant/found in animal, plant, and non-saline samples (Figure 1). S. radiopugnans was identified as a radiation-resistant bacteria [52] and has also been shown to produce novel fibrinolytic protease, which has the potential for thrombosis treatment [53], which suggested that other marine Streptomyces spp. with novel abilities are likely waiting to be discovered. Lastly, future surveys may not require extensive sampling from a single location because our data showed that a greater number of samples did not always result in greater Streptomyces richness (Figure 5). In summary, while comprehensive Streptomyces diversity maps were generated as a baseline documentation of current samplings, we clearly need additional sample collection for global Streptomyces diversity for other EMPO level 3 environments besides soil across as many countries as possible.
- EMP dataset at a finer resolution: Streptomyces vs. overall bacterial global diversity environmental pattern
According to the EMP project, we are unable to extract relevant information at the rate at which data are generated [31]. The investigation of the EMP dataset at a finer resolution indicated that the overall bacterial diversity pattern might not necessarily be identical to each ASV/strain diversity. Focusing only on Streptomyces richness revealed that overall microbial richness was lower in host-associated samples than in free-living samples in the EMP report. Streptomyces richness differences were not significantly shaped by host-associated vs. free-living distinctions but rather by EMPO level 2 (animal, plant, non-saline, and saline). Previous research has shown that Streptomyces could be a “plant’s best friend” because of their ability to promote plant growth and protect plants from pathogens as a biocontrol agent [8,15]. As we might expect, our results showed that Streptomyces richness was high in plant samples, confirming a solid relationship between Streptomyces and plants due to disease suppression and plant–microbe coevolution [8,54]. Similar to plant samples, Streptomyces richness was also high in non-saline samples (mostly because of soil samples), which supported previous research showing that Streptomyces are generally abundant in soil [55,56]. Therefore, using Streptomyces as a case study reveals that researchers should use the overall pattern cautiously since the pattern at a finer resolution could potentially be different. However, a similar pattern between overall bacterial diversity and Streptomyces diversity was observed when comparing non-saline to saline samples, which was also observed in previous global bacterial diversity studies [24,31]. As a result, both our and previous research indicated that salinity is likely a global regulator of bacterial diversity, resulting in similar patterns for both higher- and finer-level biodiversity. Nevertheless, investigating other bacterial species would provide more insights into overall diversity vs. specific microbial group differences, especially global diversity regulator identification and species-specific regulator identification.
While investigating Streptomyces diversity in the EMP dataset showed that additional analyses of public NGS datasets would be helpful, especially at a finer level, using amplicon sequencing data has some limitations that may also apply to other microbial groups. For example, the 16S rRNA gene may not have sufficient resolution to differentiate all Streptomyces species. Previous studies revealed that some Streptomyces species may show >99% 16S rRNA sequence similarity (identical amplicon sequences) [57,58]; therefore, multilocus sequence analysis (MLSA) and/or whole genome sequencing (WGS) could be used for better resolution [59]. Additionally, discrepancies exist, particularly in the taxonomy databases utilized, where the EMP employed a rDNA-based SILVA database aligning to NCBI with some conflicts [60]. Conflicts also emerge in the comparison with the Genome Taxonomy Database (GTDB), a standardized microbial taxonomy based on genome phylogeny [61]. For example, an instance of conflict involves Streptomyces cinereus (classified under the phylum Actinomycetota, previously Actinobacteria), which is designated as Moraxella cinereus (belonging to the phylum Pseudomonadota, formerly Proteobacteria) according to the GTDB taxonomy (https://gtdb.ecogenomic.org/genome?gid=GCA_014647715.1 (accessed on 8 December 2023)). Such discrepancies are not uncommon and extend to polymorphism in multi-copied rDNA, exemplified by cases like Vibrio [62]. As genome-based taxonomy gains prominence, the study acknowledges the need to consider GTDB and genome-based taxonomies, recognizing the limitations posed by potential inconsistencies in rDNA-based taxonomies. Nevertheless, investigating Streptomyces diversity using 16S rRNA amplicon data analysis is still possible, but these data should be interpreted with caution because they may contain taxonomic disagreement. Additionally, the rarefaction curves, illustrating the total ASVs per sample, revealed that numerous samples reached a plateau, while others did not, implying potential coverage inadequacies in some samples (Figure S14A). Nevertheless, the species accumulation plots exhibited an approaching saturation curve, indicating that collecting more samples would likely result in the recovery of only a limited number of additional ASVs (Figure S14B). Lastly, while the EMP provides substantial representative global sampling, it is important to acknowledge that fine-scale biogeographic patterns, environmental heterogeneity, and other additional factors are likely to significantly influence biogeographic patterns. Moreover, performing data analysis beyond EMPO level 3 was limited by data unavailability and incompleteness. Therefore, future studies can overcome this limitation by adding finer resolution levels in data collection with genome-based taxonomy.
5. Conclusions
In conclusion, our study case of Streptomyces biogeography confirmed that while our scientific community generates a lot of valuable data globally, a second look at these public datasets could provide new insights that we have not seen before in previous investigations. Currently, the soil Streptomyces collection from the EMP serves as a helpful starting point for documenting biodiversity. Streptomyces alpha diversity analysis displayed distinctions at EMPO level 2, involving animal, plant, non-saline, and saline environments, rather than at EMPO level 1 as seen in the EMP overall bacterial community. Moreover, increasing Streptomyces richness can be predicted by decreasing other biotics factors such as pH, temperature, and salinity. As a result, for other specific microbial patterns, the overall microbial pattern should be interpreted carefully because the pattern at a finer resolution might be different, as shown by using Streptomyces as a case study. Furthermore, our soil Streptomyces map revealed that data from many other locations, particularly in Africa and Southeast Asia, are still needed. Moreover, NGS analysis of marine environments worldwide would be essential for future Streptomyces biodiversity investigations. However, using amplicon sequencing data (16S rRNA gene) has some limitations, which should be interpreted cautiously because it may underestimate biodiversity.
Supplementary Materials
The following supporting information can be downloaded at: https://www.mdpi.com/article/10.3390/life14010011/s1, Figure S1: Boxplots showing alpha diversity (Shannon index) comparison of overall bacterial community. (A) EMPO level 1: Free-living and Host-associated, (B) EMPO level 2: Animal, plant, non-saline, and saline samples and (C) EMPO level 3: Aerosol (non-saline), animal corpus, animal distal gut, animal proximal gut, animal secretion, animal surface, plant corpus, plant rhizosphere, plant surface, sediment (non-saline), sediment (saline), soil (non-saline), surface (non-saline), surface (saline), water (non-saline), and water (saline). Boxplots show the 25th and 75th percentiles, while the median is shown as lines inside boxes. Error bars show the 1st and 99th percentile. Tukey HSD significant differences (p < 0.05) are indicated by different letters; Figure S2: Streptomyces diversity map in water (non-saline) samples showing species richness distribution worldwide. The average number of observed ASVs was shown as a gradient from lowest (yellow) to highest (red) diversity; Figure S3: Streptomyces diversity map in surface (non-saline) samples showing species richness distribution worldwide. The average number of observed ASVs was shown as a gradient from lowest (yellow) to highest (red) diversity; Figure S4: Streptomyces diversity map in aerosol (non-saline) samples showing species richness distribution worldwide. The average number of observed ASVs was shown as a gradient from lowest (yellow) to highest (red) diversity; Figure S5: Streptomyces diversity map in sediment (non-saline) samples showing species richness distribution worldwide. The average number of observed ASVs was shown as a gradient from lowest (yellow) to highest (red) diversity; Figure S6: Streptomyces diversity map in sediment (saline) samples showing species richness distribution worldwide. The average number of observed ASVs was shown as a gradient from lowest (yellow) to highest (red) diversity; Figure S7: Streptomyces diversity map in surface (saline) samples showing species richness distribution worldwide. The average number of observed ASVs was shown as a gradient from lowest (yellow) to highest (red) diversity; Figure S8: Streptomyces diversity map in water (saline) samples showing species richness distribution worldwide. The average number of observed ASVs was shown as a gradient from lowest (yellow) to highest (red) diversity; Figure S9: Streptomyces diversity map in animal surface samples showing species richness distribution worldwide. The average number of observed ASVs was shown as a gradient from lowest (yellow) to highest (red) diversity; Figure S10: Streptomyces diversity map in animal proximal samples showing species richness distribution worldwide. The average number of observed ASVs was shown as a gradient from lowest (yellow) to highest (red) diversity; Figure S11: Streptomyces diversity map in animal secretion samples showing species richness distribution worldwide. The average number of observed ASVs was shown as a gradient from lowest (yellow) to highest (red) diversity; Figure S12: Streptomyces diversity map in animal distal gut samples showing species richness distribution worldwide. The average number of observed ASVs was shown as a gradient from lowest (yellow) to highest (red) diversity; Figure S13: Streptomyces diversity map in plant rhizosphere samples showing species richness distribution worldwide. The average number of observed ASVs was shown as a gradient from lowest (yellow) to highest (red) diversity; Figure S14: (A) Rarefaction curve was generated using the “rarecurve” function in the R library vegan showing frequency of observed ASVs for each sample. (B) Species accumulation curve was generated using “specaccum” function in the R library vegan representing the number of ASVs found at increasing number of sites (locations).
Author Contributions
Conceptualization, N.P. and C.K.; investigation, N.P., C.L. and P.T.; writing—original draft preparation, N.P., C.L., P.T. and C.K.; writing—review and editing, N.P. and C.K.; visualization, N.P., C.L. and P.T; supervision, N.P. and C.K.; project administration, N.P. and C.K.; funding acquisition, N.P. and C.K. All authors have read and agreed to the published version of the manuscript.
Funding
This research project is supported by The Office of the Permanent Secretary of the Ministry of Higher Education, Science: Research and Innovation Fund (RGNS65-005), Chulalongkorn University: Grants for development of new faculty staff, Chulalongkorn University: Ratchadaphiseksomphot Fund to Nuttapon Pombubpa and Chulalongkorn University: Ratchadaphiseksomphot Fund to Chompoonik Kanchanabanca.
Institutional Review Board Statement
Not applicable.
Informed Consent Statement
Not applicable.
Data Availability Statement
Data supporting this study are openly available from Strep_biogeo repository at https://doi.org/10.5281/zenodo.7807480.
Acknowledgments
Sample processing, sequencing, and all amplicon sequence data were curated by the Earth Microbiome Project (www.earthmicrobiome.org (accessed on 9 March 2022)). We thank Julia Adams for proofreading the article.
Conflicts of Interest
The authors declare no conflict of interest.
References
- De Lima Procópio, R.E.; da Silva, I.R.; Martins, M.K.; de Azevedo, J.L.; de Araújo, J.M. Antibiotics Produced by Streptomyces. Braz. J. Infect. Dis. 2012, 16, 466–471. [Google Scholar] [CrossRef] [PubMed]
- Labeda, D.P.; Goodfellow, M.; Brown, R.; Ward, A.C.; Lanoot, B.; Vanncanneyt, M.; Swings, J.; Kim, S.-B.; Liu, Z.; Chun, J.; et al. Phylogenetic Study of the Species within the Family Streptomycetaceae. Antonie Van Leeuwenhoek 2012, 101, 73–104. [Google Scholar] [CrossRef] [PubMed]
- Barka, E.A.; Vatsa, P.; Sanchez, L.; Gaveau-Vaillant, N.; Jacquard, C.; Meier-Kolthoff, J.P.; Klenk, H.-P.; Clément, C.; Ouhdouch, Y.; van Wezel, G.P. Taxonomy, Physiology, and Natural Products of Actinobacteria. Microbiol. Mol. Biol. Rev. 2016, 80, 1–43. [Google Scholar] [CrossRef] [PubMed]
- Fernández, M.; Sánchez, J. Nuclease Activities and Cell Death Processes Associated with the Development of Surface Cultures of Streptomyces antibioticus ETH 7451. Microbiology 2002, 148, 405–412. [Google Scholar] [CrossRef] [PubMed]
- Van der Meij, A.; Worsley, S.F. Chemical Ecology of Antibiotic Production by Actinomycetes. FEMS Microbiol. 2017, 41, 392–416. [Google Scholar] [CrossRef]
- Méndez, C.; Braña, A.F.; Manzanal, M.B.; Hardisson, C. Role of Substrate Mycelium in Colony Development in Streptomyces. Can. J. Microbiol. 1985, 31, 446–450. [Google Scholar] [CrossRef]
- Wildermuth, H. Development and Organization of the Aerial Mycelium in Streptomyces Coelicolor. J. Gen. Microbiol. 1970, 60, 43–50. [Google Scholar] [CrossRef]
- Kinkel, L.L.; Schlatter, D.C.; Bakker, M.G.; Arenz, B.E. Streptomyces Competition and Co-Evolution in Relation to Plant Disease Suppression. Res. Microbiol. 2012, 163, 490–499. [Google Scholar] [CrossRef]
- Ikeda, H.; Ishikawa, J.; Hanamoto, A.; Shinose, M.; Takahashi, C.; Horikawa, H.; Nakazawa, H.; Osonoe, T.; Kikuchi, H.; Shiba, T.; et al. Genome Sequence of an Industrial Microorganism Streptomyces avermitilis. In Proceedings of the Microbiological Society of Korea Conference; The Microbiological Society of Korea: Seoul, Republic of Korea, 2001; pp. 131–137. [Google Scholar]
- Bentley, S.D.; Chater, K.F.; Cerdeño-Tárraga, A.-M.; Challis, G.L.; Thomson, N.R.; James, K.D.; Harris, D.E.; Quail, M.A.; Kieser, H.; Harper, D.; et al. Complete Genome Sequence of the Model Actinomycete Streptomyces coelicolor A3(2). Nature 2002, 417, 141–147. [Google Scholar] [CrossRef]
- Nikolaidis, M.; Hesketh, A.; Frangou, N.; Mossialos, D.; Van de Peer, Y.; Oliver, S.G.; Amoutzias, G.D. A Panoramic View of the Genomic Landscape of the Genus Streptomyces. Microb. Genom. 2023, 9, 001028. [Google Scholar] [CrossRef]
- Yuan, W.M.; Crawford, D.L. Characterization of Streptomyces lydicus WYEC108 as a Potential Biocontrol Agent against Fungal Root and Seed Rots. Appl. Environ. Microbiol. 1995, 61, 3119–3128. [Google Scholar] [CrossRef] [PubMed]
- Cordovez, V.; Carrion, V.J.; Etalo, D.W.; Mumm, R.; Zhu, H.; van Wezel, G.P.; Raaijmakers, J.M. Diversity and Functions of Volatile Organic Compounds Produced by Streptomyces from a Disease-Suppressive Soil. Front. Microbiol. 2015, 6, 1081. [Google Scholar] [CrossRef] [PubMed]
- Chater, K.F. Recent Advances in Understanding Streptomyces. F1000Research 2016, 5, 2795. [Google Scholar] [CrossRef]
- Viaene, T.; Langendries, S.; Beirinckx, S.; Maes, M.; Goormachtig, S. Streptomyces as a Plant’s Best Friend? FEMS Microbiol. Ecol. 2016, 92, fiw119. [Google Scholar] [CrossRef]
- Jose, P.A.; Jebakumar, S.R.D. Unexplored Hypersaline Habitats Are Sources of Novel Actinomycetes. Front. Microbiol. 2014, 5, 242. [Google Scholar] [CrossRef] [PubMed]
- Dalisay, D.S.; Williams, D.E.; Wang, X.L.; Centko, R.; Chen, J.; Andersen, R.J. Marine Sediment-Derived Streptomyces Bacteria from British Columbia, Canada Are a Promising Microbiota Resource for the Discovery of Antimicrobial Natural Products. PLoS ONE 2013, 8, e77078. [Google Scholar] [CrossRef] [PubMed]
- Um, S.; Choi, T.J.; Kim, H.; Kim, B.Y.; Kim, S.-H.; Lee, S.K.; Oh, K.-B.; Shin, J.; Oh, D.-C. Ohmyungsamycins A and B: Cytotoxic and Antimicrobial Cyclic Peptides Produced by Streptomyces Sp. from a Volcanic Island. J. Org. Chem. 2013, 78, 12321–12329. [Google Scholar] [CrossRef]
- Abdelkader, M.S.A.; Philippon, T.; Asenjo, J.A.; Bull, A.T.; Goodfellow, M.; Ebel, R.; Jaspars, M.; Rateb, M.E. Asenjonamides A–C, Antibacterial Metabolites Isolated from Streptomyces asenjonii Strain KNN 42.f from an Extreme-Hyper Arid Atacama Desert Soil. J. Antibiot. 2018, 71, 425–431. [Google Scholar] [CrossRef]
- Li, J.; Tian, X.-P.; Zhu, T.-J.; Yang, L.-L.; Li, W.-J. Streptomyces fildesensis Sp. Nov., a Novel Streptomycete Isolated from Antarctic Soil. Antonie Van Leeuwenhoek 2011, 100, 537–543. [Google Scholar] [CrossRef]
- Andam, C.P.; Doroghazi, J.R.; Campbell, A.N.; Kelly, P.J.; Choudoir, M.J.; Buckley, D.H. A Latitudinal Diversity Gradient in Terrestrial Bacteria of the Genus Streptomyces. mBio 2016, 7, e02200-15. [Google Scholar] [CrossRef]
- Choudoir, M.J.; Doroghazi, J.R.; Buckley, D.H. Latitude Delineates Patterns of Biogeography in Terrestrial Streptomyces. Environ. Microbiol. 2016, 18, 4931–4945. [Google Scholar] [CrossRef] [PubMed]
- Hall, N. Advanced Sequencing Technologies and Their Wider Impact in Microbiology. J. Exp. Biol. 2007, 210, 1518–1525. [Google Scholar] [CrossRef] [PubMed]
- Lozupone, C.A.; Knight, R. Global Patterns in Bacterial Diversity. Proc. Natl. Acad. Sci. USA 2007, 104, 11436–11440. [Google Scholar] [CrossRef] [PubMed]
- Bates, S.T.; Clemente, J.C.; Flores, G.E.; Walters, W.A.; Parfrey, L.W.; Knight, R.; Fierer, N. Global Biogeography of Highly Diverse Protistan Communities in Soil. ISME J. 2013, 7, 652–659. [Google Scholar] [CrossRef] [PubMed]
- Livermore, J.A.; Jones, S.E. Local–global Overlap in Diversity Informs Mechanisms of Bacterial Biogeography. ISME J. 2015, 9, 2413–2422. [Google Scholar] [CrossRef] [PubMed]
- Gilbert, J.A.; Meyer, F.; Antonopoulos, D.; Balaji, P.; Brown, C.T.; Brown, C.T.; Desai, N.; Eisen, J.A.; Evers, D.; Field, D.; et al. Meeting Report: The Terabase Metagenomics Workshop and the Vision of an Earth Microbiome Project. Stand. Genom. Sci. 2010, 3, 243–248. [Google Scholar] [CrossRef] [PubMed]
- Gilbert, J.A. The Earth Microbiome Project and Modeling the Planets Microbial Potential (Invited). Volume 2013, p. B54B-01. Available online: https://ui.adsabs.harvard.edu/abs/2013AGUFM.B54B..01G/abstract (accessed on 1 December 2013).
- Gilbert, J.A.; Jansson, J.K.; Knight, R. The Earth Microbiome Project: Successes and Aspirations. BMC Biol. 2014, 12, 69. [Google Scholar] [CrossRef] [PubMed]
- Gilbert, J.A.; Jansson, J.K.; Knight, R. Earth Microbiome Project and Global Systems Biology. mSystems 2018, 3, 10–1128. [Google Scholar] [CrossRef]
- Thompson, L.R.; Sanders, J.G.; McDonald, D.; Amir, A.; Ladau, J.; Locey, K.J.; Prill, R.J.; Tripathi, A.; Gibbons, S.M.; Ackermann, G.; et al. A Communal Catalogue Reveals Earth’s Multiscale Microbial Diversity. Nature 2017, 551, 457–463. [Google Scholar] [CrossRef]
- Tighe, S.; Afshinnekoo, E.; Rock, T.M.; McGrath, K.; Alexander, N.; McIntyre, A.; Ahsanuddin, S.; Bezdan, D.; Green, S.J.; Joye, S.; et al. Genomic Methods and Microbiological Technologies for Profiling Novel and Extreme Environments for the Extreme Microbiome Project (XMP). J. Biomol. Tech. 2017, 28, 31–39. [Google Scholar] [CrossRef]
- Danko, D.; Bezdan, D.; Afshin, E.E.; Ahsanuddin, S.; Bhattacharya, C.; Butler, D.J.; Chng, K.R.; Donnellan, D.; Hecht, J.; Jackson, K.; et al. A Global Metagenomic Map of Urban Microbiomes and Antimicrobial Resistance. Cell 2021, 184, 3376–3393.e17. [Google Scholar] [CrossRef]
- Contador, C.A.; Veas-Castillo, L.; Tapia, E.; Antipán, M.; Miranda, N.; Ruiz-Tagle, B.; García-Araya, J.; Andrews, B.A.; Marin, M.; Dorador, C.; et al. Atacama Database: A Platform of the Microbiome of the Atacama Desert. Antonie Van Leeuwenhoek 2020, 113, 185–195. [Google Scholar] [CrossRef]
- Bissett, A.; Fitzgerald, A.; Court, L.; Meintjes, T.; Mele, P.M.; Reith, F.; Dennis, P.G.; Breed, M.F.; Brown, B.; Brown, M.V.; et al. Erratum to: Introducing BASE: The Biomes of Australian Soil Environments Soil Microbial Diversity Database. Gigascience 2017, 6, gix021. [Google Scholar] [CrossRef] [PubMed]
- Quast, C.; Pruesse, E.; Yilmaz, P.; Gerken, J.; Schweer, T.; Yarza, P.; Peplies, J.; Glöckner, F.O. The SILVA Ribosomal RNA Gene Database Project: Improved Data Processing and Web-Based Tools. Nucleic Acids Res. 2013, 41, D590–D596. [Google Scholar] [CrossRef]
- Caporaso, J.G.; Kuczynski, J.; Stombaugh, J.; Bittinger, K.; Bushman, F.D.; Costello, E.K.; Fierer, N.; Peña, A.G.; Goodrich, J.K.; Gordon, J.I.; et al. QIIME Allows Analysis of High-Throughput Community Sequencing Data. Nat. Methods 2010, 7, 335–336. [Google Scholar] [CrossRef]
- McDonald, D.; Clemente, J.C.; Kuczynski, J.; Rideout, J.R.; Stombaugh, J.; Wendel, D.; Wilke, A.; Huse, S.; Hufnagle, J.; Meyer, F.; et al. The Biological Observation Matrix (BIOM) Format or: How I Learned to Stop Worrying and Love the Ome-Ome. Gigascience 2012, 1, 7. [Google Scholar] [CrossRef]
- McMurdie, P.J.; Holmes, S. Phyloseq: An R Package for Reproducible Interactive Analysis and Graphics of Microbiome Census Data. PLoS ONE 2013, 8, e61217. [Google Scholar] [CrossRef]
- R Core Team. R: A Language and Environment for Statistical Computing; R Foundation for Statistical Computing: Vienna, Austria, 2020. [Google Scholar]
- RStudio Team. RStudio: Integrated Development Environment for R; RStudio: Boston, MA, USA, 2020. [Google Scholar]
- Wang, Y.; Rodríguez de Gil, P.; Chen, Y.-H.; Kromrey, J.D.; Kim, E.S.; Pham, T.; Nguyen, D.; Romano, J.L. Comparing the Performance of Approaches for Testing the Homogeneity of Variance Assumption in One-Factor ANOVA Models. Educ. Psychol. Meas. 2017, 77, 305–329. [Google Scholar] [CrossRef] [PubMed]
- Oksanen, J.; Blanchet, F.G.; Kindt, R.; Legendre, P.; Minchin, P.R.; O’Hara, R.B.; Simpson, G.L.; Solymos, P.; Henry, M.; Stevens, M.H.H.; et al. Vegan: Community Ecology Package. Ordination Methods, Diversity Analysis and Other Functions for Community and Vegetation Ecologists, R Package Verion 2.3-1. 2015.
- Higgins, S.A.; Panke-Buisse, K.; Buckley, D.H. The Biogeography of Streptomyces in New Zealand Enabled by High-Throughput Sequencing of Genus-Specific rpoB Amplicons. Environ. Microbiol. 2021, 23, 1452–1468. [Google Scholar] [CrossRef] [PubMed]
- Harir, M.; Bendif, H.; Bellahcene, M.; Fortas, Z.; Pogni, R. Streptomyces Secondary Metabolites. Basic Biol. Appl. Actinobacteria 2018, 6, 99–122. [Google Scholar]
- Gopalakrishnan, S.; Srinivas, V.; Prasanna, S.L. Streptomyces. In Beneficial Microbes in Agro-Ecology; Amaresan, N., Senthil Kumar, M., Annapurna, K., Kumar, K., Sankaranarayanan, A., Eds.; Elsevier: San Diego, CA, USA, 2020; pp. 55–71. ISBN 9780128234143. [Google Scholar]
- Adegboye, M.F.; Babalola, O.O.; Ngoma, L.; Okoh, A.I. Analysis of Streptomyces spp. Native to Mahikeng Soils in South Africa. J. Pure Appl. Microbiol. 2012, 6, 1001–1010. [Google Scholar]
- Donald, L.; Pipite, A.; Subramani, R.; Owen, J.; Keyzers, R.A.; Taufa, T. Streptomyces: Still the Biggest Producer of New Natural Secondary Metabolites, a Current Perspective. Microbiol. Res. 2022, 13, 418–465. [Google Scholar] [CrossRef]
- Dharmaraj, S. Marine Streptomyces as a Novel Source of Bioactive Substances. World J. Microbiol. Biotechnol. 2010, 26, 2123–2139. [Google Scholar] [CrossRef]
- Parthasarathi, S.; Sathya, S.; Bupesh, G.; Samy, R.D.; Mohan, M.R.; Kumar, G.S.; Manikandan, M.; Kim, C.J.; Balakrishna, K. Isolation and Characterization of Antimicrobial Compound from Marine Streptomyces hygroscopicus BDUS 49. World J. Fish Mar. Sci. 2012, 4, 268–277. [Google Scholar]
- Yang, Z.; He, J.; Wei, X.; Ju, J.; Ma, J. Exploration and Genome Mining of Natural Products from Marine Streptomyces. Appl. Microbiol. Biotechnol. 2020, 104, 67–76. [Google Scholar] [CrossRef] [PubMed]
- Mao, J.; Tang, Q.; Zhang, Z.; Wang, W.; Wei, D.; Huang, Y.; Liu, Z.; Shi, Y.; Goodfellow, M. Streptomyces radiopugnans sp. nov., a Radiation-Resistant Actinomycete Isolated from Radiation-Polluted Soil in China. Int. J. Syst. Evol. Microbiol. 2007, 57, 2578–2582. [Google Scholar] [CrossRef] [PubMed]
- Dhamodharan, D. Novel Fibrinolytic Protease Producing Streptomyces radiopugnans VITSD8 from Marine Sponges. Mar. Drugs 2019, 17, 164. [Google Scholar] [CrossRef]
- Kinkel, L.L.; Bakker, M.G.; Schlatter, D.C. A Coevolutionary Framework for Managing Disease-Suppressive Soils. Annu. Rev. Phytopathol. 2011, 49, 47–67. [Google Scholar] [CrossRef]
- Kennedy, A.C. Bacterial Diversity in Agroecosystems. In Invertebrate Biodiversity as Bioindicators of Sustainable Landscapes; Paoletti, M.G., Ed.; Elsevier: Amsterdam, The Netherlands, 1999; pp. 65–76. ISBN 9780444500199. [Google Scholar]
- Seipke, R.F.; Kaltenpoth, M.; Hutchings, M.I. Streptomyces as Symbionts: An Emerging and Widespread Theme? FEMS Microbiol. Rev. 2012, 36, 862–876. [Google Scholar] [CrossRef]
- Rong, X.; Huang, Y. Taxonomic Evaluation of the Streptomyces griseus Clade Using Multilocus Sequence Analysis and DNA-DNA Hybridization, with Proposal to Combine 29 Species and Three Subspecies as 11 Genomic Species. Int. J. Syst. Evol. Microbiol. 2010, 60, 696–703. [Google Scholar] [CrossRef]
- Rong, X.; Huang, Y. Taxonomic Evaluation of the Streptomyces hygroscopicus Clade Using Multilocus Sequence Analysis and DNA--DNA Hybridization, Validating the MLSA Scheme for Systematics of the Whole Genus. Syst. Appl. Microbiol. 2012, 35, 7–18. [Google Scholar] [CrossRef] [PubMed]
- Komaki, H. Recent Progress of Reclassification of the Genus Streptomyces. Microorganisms 2023, 11, 831. [Google Scholar] [CrossRef] [PubMed]
- Balvočiūtė, M.; Huson, D.H. SILVA, RDP, Greengenes, NCBI and OTT—How Do These Taxonomies Compare? BMC Genom. 2017, 18, 114. [Google Scholar] [CrossRef] [PubMed]
- Parks, D.H.; Chuvochina, M.; Rinke, C.; Mussig, A.J.; Chaumeil, P.-A.; Hugenholtz, P. GTDB: An Ongoing Census of Bacterial and Archaeal Diversity through a Phylogenetically Consistent, Rank Normalized and Complete Genome-Based Taxonomy. Nucleic Acids Res. 2022, 50, D785–D794. [Google Scholar] [CrossRef]
- Moreno, C.; Romero, J.; Espejo, R.T. Polymorphism in Repeated 16S rRNA Genes Is a Common Property of Type Strains and Environmental Isolates of the Genus Vibrio. Microbiology 2002, 148, 1233–1239. [Google Scholar] [CrossRef]

Disclaimer/Publisher’s Note: The statements, opinions and data contained in all publications are solely those of the individual author(s) and contributor(s) and not of MDPI and/or the editor(s). MDPI and/or the editor(s) disclaim responsibility for any injury to people or property resulting from any ideas, methods, instructions or products referred to in the content. |
© 2023 by the authors. Licensee MDPI, Basel, Switzerland. This article is an open access article distributed under the terms and conditions of the Creative Commons Attribution (CC BY) license (https://creativecommons.org/licenses/by/4.0/).