Article

mRNA Abundance of Neurogenic Factors Correlates with Hearing Capacity in Auditory Brainstem Nuclei of the Rat

1
Department of Otorhinolaryngology, University Hospital Wuerzburg, Plastic, Aesthetic and Reconstructive Head and Neck Surgery, Josef-Schneider-Strasse 11, 97080 Wuerzburg, Germany
2
Institute of Pathology, University of Wuerzburg, Josef-Schneider-Strasse 2, 97080 Wuerzburg, Germany
3
Institute for Auditory Neuroscience and InnerEarLab, University Medical Center Göttingen, Robert-Koch-Strasse 40, 37075 Göttingen, Germany
4
Institute of Human Genetics, University Medical Center Göttingen, Heinrich-Düker-Weg 12, 37073 Göttingen, Germany
*
Author to whom correspondence should be addressed.
Life 2023, 13(9), 1858; https://doi.org/10.3390/life13091858
Submission received: 7 August 2023 / Revised: 30 August 2023 / Accepted: 31 August 2023 / Published: 2 September 2023
(This article belongs to the Special Issue Neural Stem Cell Differentiation 2023)

Abstract

:
Neural stem cells (NSCs) have previously been described up to the adult stage in the rat cochlear nucleus (CN). A decreasing neurogenic potential was observed with critical changes around hearing onset. A better understanding of molecular factors affecting NSCs and neurogenesis is of interest as they represent potential targets to treat the cause of neurologically based hearing disorders. The role of genes affecting NSC development and neurogenesis in CN over time on hearing capacity has remained unclear. This study investigated the mRNA abundance of genes influencing NSCs and neurogenesis in rats’ CN over time. The CN of rats on postnatal days 6, 12, and 24 were examined. Real-time quantitative polymerase chain reaction arrays were used to compare mRNA levels of 84 genes relevant to NSCs and neurogenesis. Age- and hearing-specific patterns of changes in mRNA abundance of neurogenically relevant genes were detected in the rat CN. Additionally, crucial neurogenic factors with significant and relevant influence on neurogenesis were identified. The results of this work should contribute to a better understanding of the molecular mechanisms underlying the neurogenesis of the auditory pathway.

1. Introduction

By 2050, approximately 700 million people worldwide will have hearing loss that requires therapy. In many patients, this is due to sensorineural hearing loss (SNHL), which is characterized by irreversible disease of structures of the inner ear or neural structures of the auditory pathway [1]. The development of new therapeutical techniques, such as the generation of human induced pluripotent stem cells or genome editing using CRISPR/Cas9, represent promising approaches for treating SNHL [2]. In recent years, effective genetic therapy options for the auditory system have already been developed in the rodent model [3]. CRISPR-Cas9 technology uses synthetic RNA specific to the target sequence [4]. Gene editing with CRISPR/Cas9 was found to prevent hearing loss in the Beethoven mouse model, which is a model for human non-syndromic autosomal-dominant deafness [5]. Another promising approach is RNA interference (RNAi), a naturally occurring posttranscriptional process of gene expression regulation [6]. A RNAi approach based on an artificial microRNA (miRNA) was shown to successfully avert progressive hearing loss in the Beethoven mouse model [7]. The effectiveness of these RNA-based approaches in translational models of hearing loss emphasizes the importance of molecular genetics for future hearing research [3].
NSCs are defined by their ability to undergo mitotic self-renewal, form progenitor cells, and differentiate into all cell types of the neuroectodermal cell lineage [8]. The subventricular zone and the hippocampus are prominent examples in which neurogenic capacity has been extensively studied [9]. NSCs have been detected along the auditory pathway of postnatal rats and mice in several nuclei up to the adult stage [10,11,12,13,14,15]. Their cardinal features have been characterized by in vitro studies using differentiation, immunohistology, and proliferation analysis. For the first time in the auditory system, NSCs were described in the spiral ganglion and stria vascularis [12,14]. Similarly, a NSC niche was detected in the auditory cortex, inferior colliculus, and medial geniculate body [10,11,15]. The cochlear nucleus (CN) exhibits NSC capacity into the adult stage. Here, a decreasing potential with increasing age was found in CN. The critical period from which proliferative capacity and expression of NSC markers began to decline was the time from postnatal days 10 to 14 (p10–p14). Interestingly, this corresponds to rat hearing onset [16]. From about p20, stem cell capacity was stable at a low level.
The CN is the first relay station of the auditory pathway. It harbors the cell bodies of the second auditory neuron. Furthermore, it is of great therapeutic interest because it is surgically accessible and can be provided with an auditory brainstem implant if cochlear implantation is no longer possible, e.g., due to a tumor resection of the auditory nerve. [17]. As a basis for these therapeutic approaches, knowledge about molecular details in neural stem cells (NSCs) and neurogenesis of the auditory system is necessary [2].
As previously described, NSC potential has been detected in CN into the adult stage [13]. The decrease in NSC potential over time indicates that hearing onset represents a critical phase for CN neurogenesis and NSC development [13]. The molecular processes affecting neurogenesis and NSC development in CN are mainly unknown. To investigate the molecular processes of NSC development and CN neurogenesis, mRNA abundance of neurogenic factors was compared between different time points depending on hearing capacity. For this purpose, Sprague Dawley rats were examined at p6 (not hearing), p12 (hearing onset), and p24 (hearing). After isolation of the RNA and reverse transcription into cDNA, mRNA abundance of 84 different genes essential for neurogenesis and NSC development was analyzed using a quantitative real-time polymerase chain reaction array (RT-qPCR). Heat maps, volcano plots, and analyses of individual genes were performed to identify mRNA abundance patterns of neurogenic factors and relevant and significant genes in maturing rat CN over time. The present study aimed to find an mRNA pattern during the critical postnatal phase of hearing onset within CN and identify neurogenic factors that may be crucial for regenerative neurogenesis.

2. Materials and Methods

2.1. Animal and Tissue Preparations

Before starting work, all surfaces were decontaminated with RNase Zap (Thermo-Fischer Scientific®, Grand Island, NE, USA), and all work utensils were sterilized. Postnatal Sprague Dawley rats (Charles-River®, Wilmington, MA, USA) at 6, 12, and 24 days of age were delivered on the appropriate days and immediately cervically dislocated and decapitated. Equal numbers of females and males were chosen for each age group. The cranial nerves were detached after the midsagittal opening of the skull and the removal of the bony portions. Subsequently, the brain, including the brainstem, was transferred to Neurobasal® medium (Thermo-Fischer Scientific®, Grand Island, NE, USA) at room temperature. The cerebrum and cerebellum were carefully separated, and the meningeal tissue with blood vessels was detached from the brain stem with #5/45 preparation forceps (Dumont®, Montignez, Switzerland). Subsequently, CN was identified at the lateral brainstem under the microscope (OPMI1, Zeiss®, Oberkochen, Germany) and dissected bluntly with #5/45 preparation forceps (Dumont®, Montignez, Switzerland). Per animal, the two paired CN were transferred to DNA-, DNase-, RNase-, and pyrogen-free cryovials (Simport Scientific®, Saint-Mathieu-de-Beloeil, Canada) and placed immediately in liquid nitrogen for at least 15 min.
All experiments were conducted according to the national guidelines for the care and use of laboratory animals (§8) and carried out exclusively as organ removal. Removing organs from the animal after the sacrifice is subject to a notification requirement, as per § 6 Abs. 1 No. 4 (German Animal Welfare Act), but has not been and cannot be approved as an animal experiment.
The number of sacrificed animals per species per year has to be given to the local authorities. Accordingly, 12 sacrificed Sprague Dawley rats were reported to the “Regierung of Unterfranken” (Government Lower Franconia).

2.2. RNA Extraction from the Tissue of CN

The tissue was transferred from the cryovials into beads-filled tubes (Precellys® Lysing Kit CK 14, Bertin, France). The CN of the animals of one age group were pooled in one bead tube (n = 4 animals and 8 CN per age group) without a medium. Pooling was necessary to generate enough mRNA for further analysis. Weighing of pooled CN was performed (Sartorius® Handy M160, Goettingen, Germany). The pooled CN weighed less than 20 mg, regardless of age. Therefore, following the instructions of the RNeasy Mini Kit (Qiagen®, Venlo, The Netherlands), 350 µL of RLT buffer (Qiagen®, Venlo, The Netherlands) was added per tube. These were homogenized in two homogenizer steps (Precellys 24 DUAL®, Bertin, France) at 6000 rpm for 30 s each. A total of 350 µL of ethanol 70% (Thermo Fisher Scientific®, Waltham, MA, USA) was added to the resulting emulsion. Further steps were performed according to the instructions of the RNeasy Mini Kit (Qiagen®, Venlo, The Netherlands).
Subsequently, the extracted RNA was quantified using a spectrophotometer (NanoDrop One/Onec, Thermo Fisher Scientific®, Waltham, MA, USA), and its purity (A260/A280) was determined. At postnatal day 6 (p6), animals had approximately 350 ng/mL RNA. p12 and p24 animals had about 750 ng/mL. Only RNA with an A260/A280 ratio of 2.0 ± 0.1 was used to synthesize complementary DNA (cDNA).

2.3. cDNA Synthesis from RNA by Reverse Transcription

Further steps were carried out according to the procedure described in the RT2 First Strand Kit (Qiagen®, Venlo, The Netherlands). For this purpose, a 10 µL DNA elimination mix was prepared with 500 ng RNA, Buffer GE, and RNase-free water per reaction. This was incubated for 5 min at 42 °C (Biometra Trio 30, Analytik Jena®, Jena, Germany) and then placed on ice for 1 min. Then, 10 µL reverse transcriptase mix with 2 µL RE3 reverse transcriptase (Qiagen®, Venlo, The Netherlands) was prepared and pipetted into the cooled DNA elimination mix. Incubation was repeated at 42 °C for 15 min and immediately followed by incubation at 95 °C for 5 min. Then, 91 µL RNase-free water was added per sample. Before the following steps, the samples were stored at −20 °C for a maximum of eight weeks.

2.4. Rat Neurogenesis RT2 ProfilerTM PCR Array

From the cDNA obtained in the previous step, 102 µL were mixed with 1.350 µL 2XRT2 SYBR Green Mastermix (Qiagen®, Venlo, The Netherlands) and 1.248 µL RNase free water. Then, 25 µL per well of this suspension was transferred to the 96-well Rat Neurogenesis RT2 ProfilerTM PCR Array (PARN-404ZC-12, Qiagen®, Venlo, The Netherlands), which was sealed. This array contains a primer set for 84 genes related to neurogenesis and NSCs. Furthermore, the array comprises 5 reference genes (actin beta, beta-2-microglobulin, hypoxanthine phosphoribosyltransferase 1, lactate dehydrogenase A, ribosomal protein P1), 3 reverse transcription controls (RTC), 3 PCR reproducibility controls (PPC), and 1 contamination control (GDC). Additional steps were performed on the real-time PCR system StepOnePlusTM (Thermo Fisher Scientific®, Waltham, MA, USA), and the threshold values were identical for all analyses performed. The automated baseline option of the system was used as a baseline. PCR was performed at the following cycling conditions: 10 min at 95 °C for denaturation, 40 cycles at 95 °C for 15 s, and 60 °C for 1 min. The cycle threshold (Ct) determined this way was exported as a spreadsheet calculation from Microsoft® Excel 2023 V16.70 (Microsoft Corporation, Redmond, WA, USA). For each age group, 3 replicates were performed from the pooled samples.

2.5. Data Analysis and Statistical Evaluation

All collected data were compiled using Microsoft® Excel 2023 V16.70 (Microsoft Corporation, Redmond, WA, USA) spreadsheets. Raw Ct values were analyzed using the Qiagen® GeneGlobe Data Analysis Web Portal (Qiagen, Venlo, The Netherlands). All samples passed the PCR array reproducibility test (ΔCt average RTC—average PPC ≤ 5), the reverse transcription efficiency test (Ct PPC of the three replicates within an array is 20 ± 2, and the average PPC CT values of any 2 arrays do not differ by more than 2) and the genomic DNA contamination test (Ct GDC ≥ 35). The gene B2m was included in the setup but was not used as a reference gene because the expression was unstable between ages. The expression of genes in the maturing CN was determined using 4 reference genes (actin beta, hypoxanthine phosphoribosyltransferase 1, lactate dehydrogenase A, and ribosomal protein P1). The selected reference genes showed stable expression in the rat model [18,19,20]. The geometric mean of multiple thoughtful selected and stable reference genes is recommended in the literature [21]. The expression of the chosen reference genes was stable between the different age groups, and their geometric mean differed less than one, as recommended by the Qiagen® GeneGlobe Data Analysis Web Portal (Qiagen, Venlo, The Netherlands). Each gene was normalized with the geometric mean of the reference genes to obtain the ΔCt value. The ΔΔCt was calculated for each gene by subtracting the ΔCt value of the age group (n = 3) from the ΔCt value of the control age group (n = 3). The fold change for each gene from the age group to the control age group was calculated as 2(−ΔΔCt). P-values were calculated using a student’s t-test based on the ΔCt values of the replicates for each gene in each age group compared to the control age group. The fold change data obtained this way was used to create a heat map containing all the genes represented on the RT-qPCR array plate, following instructions provided by the freely available web software Heatmapper [22]. Colors were selected according to the recommendations of current literature to provide the best possible access for color-blind readers [23]. The heat map was generated using complete linkage and Pearson correlation. The clustering methodology was chosen according to suggestions in the current literature [24]. The individual clusters without dendrogram and larger font of the gene names are attached in the supplementary material for better readability of the gene names. The volcano plot allows the evaluation of relevant changes in mRNA abundance in the context of their statistical significance. It represents on the x-axis the log base 2 of the fold change value of each gene and the y-axis the negative log base 10 of the p-value of the gene on the y-axis. The graphical representation of the volcano plots and the bar charts were created with GraphPad® Prism 9.5.0 software (Graphpad Software Inc., San Diego, CA, USA). Data generated can be accessed under supplementary material. The final images were composed using Adobe® InDesign CC 2023 v 18.1 software (Adobe Inc., San Jose, CA, USA).

3. Results

3.1. mRNA Abundance Patterns of Neurogenic Factors Correlate with Age in Maturing CN

A heat map with a hierarchical-clustered dendrogram was generated to identify gene clusters in different age groups and therefore depending on hearing capacity (Figure 1). Clusters were defined based on the second branches of the dendrogram. Cluster A, which by previous definition would coincide with Cluster B, was defined subjectively for biological reasons. The genes in Cluster A already increase at hearing onset and not afterwards as in Cluster B. Therefore, Cluster A was defined as a separate cluster. This was made to emphasize the importance of the hearing onset and its influence on the mRNA level. The expression of neurogenic factors was shown to be age-dependent and thus to correlate well with hearing capacity. Hence, changes in a characteristic cluster of genes were shown at each time of investigation. Some mRNA clusters of particular interest will be described in detail in the following sections.
At p6, 7% of the genes examined (six genes) had a lower mRNA abundance at p6, followed by a higher mRNA abundance at p12 or p24. These genes were microtubule-associated protein 2 (Map2), hairy/enhancer-of-split related with YRPW motif 2 (Hey2), cholinergic receptor muscarinic 2 (Chrm2), discs large homolog 4 (Dlg4), slit homolog 2 (Slit2). and brain-derived neurotrophic factor (Bdnf) (Figure 1, Cluster A).
In addition, 44% of the genes studied (37 genes) had the highest mRNA abundance at p24. Among those, two clusters of genes were identified, Cluster B and Cluster C. Cluster B showed low mRNA abundance at p6 and varying degrees of mRNA abundance at p12 before an increase at p24 (Figure 1, Cluster B). These genes were POU class 3 homeobox 3 (Pou3f3), noggin (Nog), neuregulin 1 (Nrg1), neuronal cell adhesion molecule (Nrcam), acetylcholinesterase (Ache), superoxide dismutase 1 (Sod1), apolipoprotein E (Apoe), reticulon 4 (Rtn4), glial cell-derived neurotrophic factor (Gdnf), adenosine A1 receptor (Adora1), platelet-activating factor acetylhydrolase, isoform 1b (Pafah1b), glucose phosphate isomerase (Gpi), myocyte enhancer factor 2C (Mef2c), amyloid beta (A4) precursor protein (App), vascular endothelial growth factor A (Vegfa), S100 calcium-binding protein B (S100b), fibroblast growth factor 2 (Fgf2), anaplastic lymphoma kinase (Alk), sonic hedgehog (Shh), and artemin (Artn) (Figure 1, Cluster B). Cluster C showed intermediate mRNA abundance at p6, followed by a drastic drop at p12 before increasing at p24 (Figure 1, Cluster C). These genes were tenascin R (Tnr), chemokine (C-X-C motif) ligand 1 (Cxcl1), delta-like 1 (Dll1), adenosine A2a receptor (Adora2a), SRY (sex determining region Y)-box 8 (Sox8), Norrie disease (Ndp), interleukin 3 (Il3), glutamate receptor, ionotropic, N-methyl D-aspartate 1 (Grin1), bone morphogenetic protein 2 (Bmp2), hairy/enhancer-of-split related with YRPW motif-like (Heyl), ras-related C3 botulinum toxin substrate 1 (Rac1), neurofibromin 1 (Nf1), signal transducer and activator of transcription 3 (Stat3), amyloid beta (A4) precursor protein-binding, family B, member 1 (Fe65) (Apbb1), and hairy/enhancer-of-split related with YRPW motif 1 (Hey1) (Figure 1, Cluster C). S100 calcium-binding protein A6 (S100a6) and epidermal growth factor (Egf) were also included in Cluster C. These genes displayed a drastic decrease in mRNA abundance at p12, characteristic of this cluster. At p6 and p24, they showed a slight increase in mRNA abundance (Figure 1, Cluster C).
Analysis of Cluster D showed that 31% of the genes studied had a higher mRNA abundance before hearing onset at p6 than at p12 and p24 (Figure 1, Cluster D). These 26 genes showed a heterogeneous pattern at the following time points. Four subgroups were identified. For leukemia inhibitory factor (Lif), disheveled dsh homolog 3 (Dvl3), neurogenin 2 (Neurog2), netrin 1 (Ntn1), par-3 (partitioning defective 3) homolog (Pard3), bone morphogenetic protein 4 (Bmp4), and filamin A (Flna), there was a progression of the decrease in mRNA abundance with age (Figure 1, Cluster D). In contrast, paired box 6 (Pax6), neurogenic differentiation 1 (Neurod1), notch homolog 2 (Notch2), CDK5 regulatory subunit associated protein 2 (Cdk5rap2), and neurotrophin 3 (Ntf3) had less mRNA abundance at p12 compared to p6 but did not change between p12 and p24 (Figure 1, Cluster D). In contrast, myeloid/lymphoid or mixed-lineage leukemia 1 (Kmt2a), E1A binding protein p300 (Ep300), transforming growth factor, beta 1 (Tgfb1), midkine (Mdk), neurogenin 1 (Neurog1), and CAMP responsive element binding protein 1 (Creb1) underwent a drastic decrease in mRNA abundance between p6 and p12. Still, it displayed average levels at p24 (Figure 1, Cluster D). High mRNA abundance at p6 with intermediate mRNA abundance at p12 and a decrease in mRNA abundance at p24 was observed for tyrosine hydroxylase (Th), doublecortin (DCX), paired box 3 (Pax3), v-erb-b2 erythroblastic leukemia viral oncogene (Erbb2), ephrin B1 (Efnb1), notch homolog 1 (Notch1), achaete-scute complex homolog 1 (Ascl1), and SRY (sex determining region Y)-box 2 (Sox2) (Figure 1, Cluster D).
Regarding Cluster E, mRNA abundance was the highest at p12 in 17% (15 genes) of the genes examined. Two subgroups were identified (Figure 1, Cluster E). Genes with selectively high mRNA abundance at p12 were roundabout homolog 1 (Robo1), oligodendrocyte lineage transcription factor 2 (Olig2), paired box 2 (Pax2), neuropilin 2 (Nrp2), neuropilin 1 (Nrp1), POU class 4 homeobox 1 (Pou4f1), dopamine receptor D2 (Drd2), choline acetyltransferase (Chat), and bone morphogenetic protein 8a (Bmp8a) (Figure 1, Cluster E). The two subgroup displayed intermediate mRNA abundance before upregulation at p12 with a subsequent lower mRNA abundance at p24 (Figure 1, Cluster E). These genes were pleiotrophin (Ptn), cyclin-dependent kinase 5, regulatory subunit 1 (Cdk5r1), histone deacetylase 4 (Hdac4), B-cell CLL/lymphoma 2 (Bcl2), necdin (Ndn), and hairy and enhancer of split 1 (Hes1).

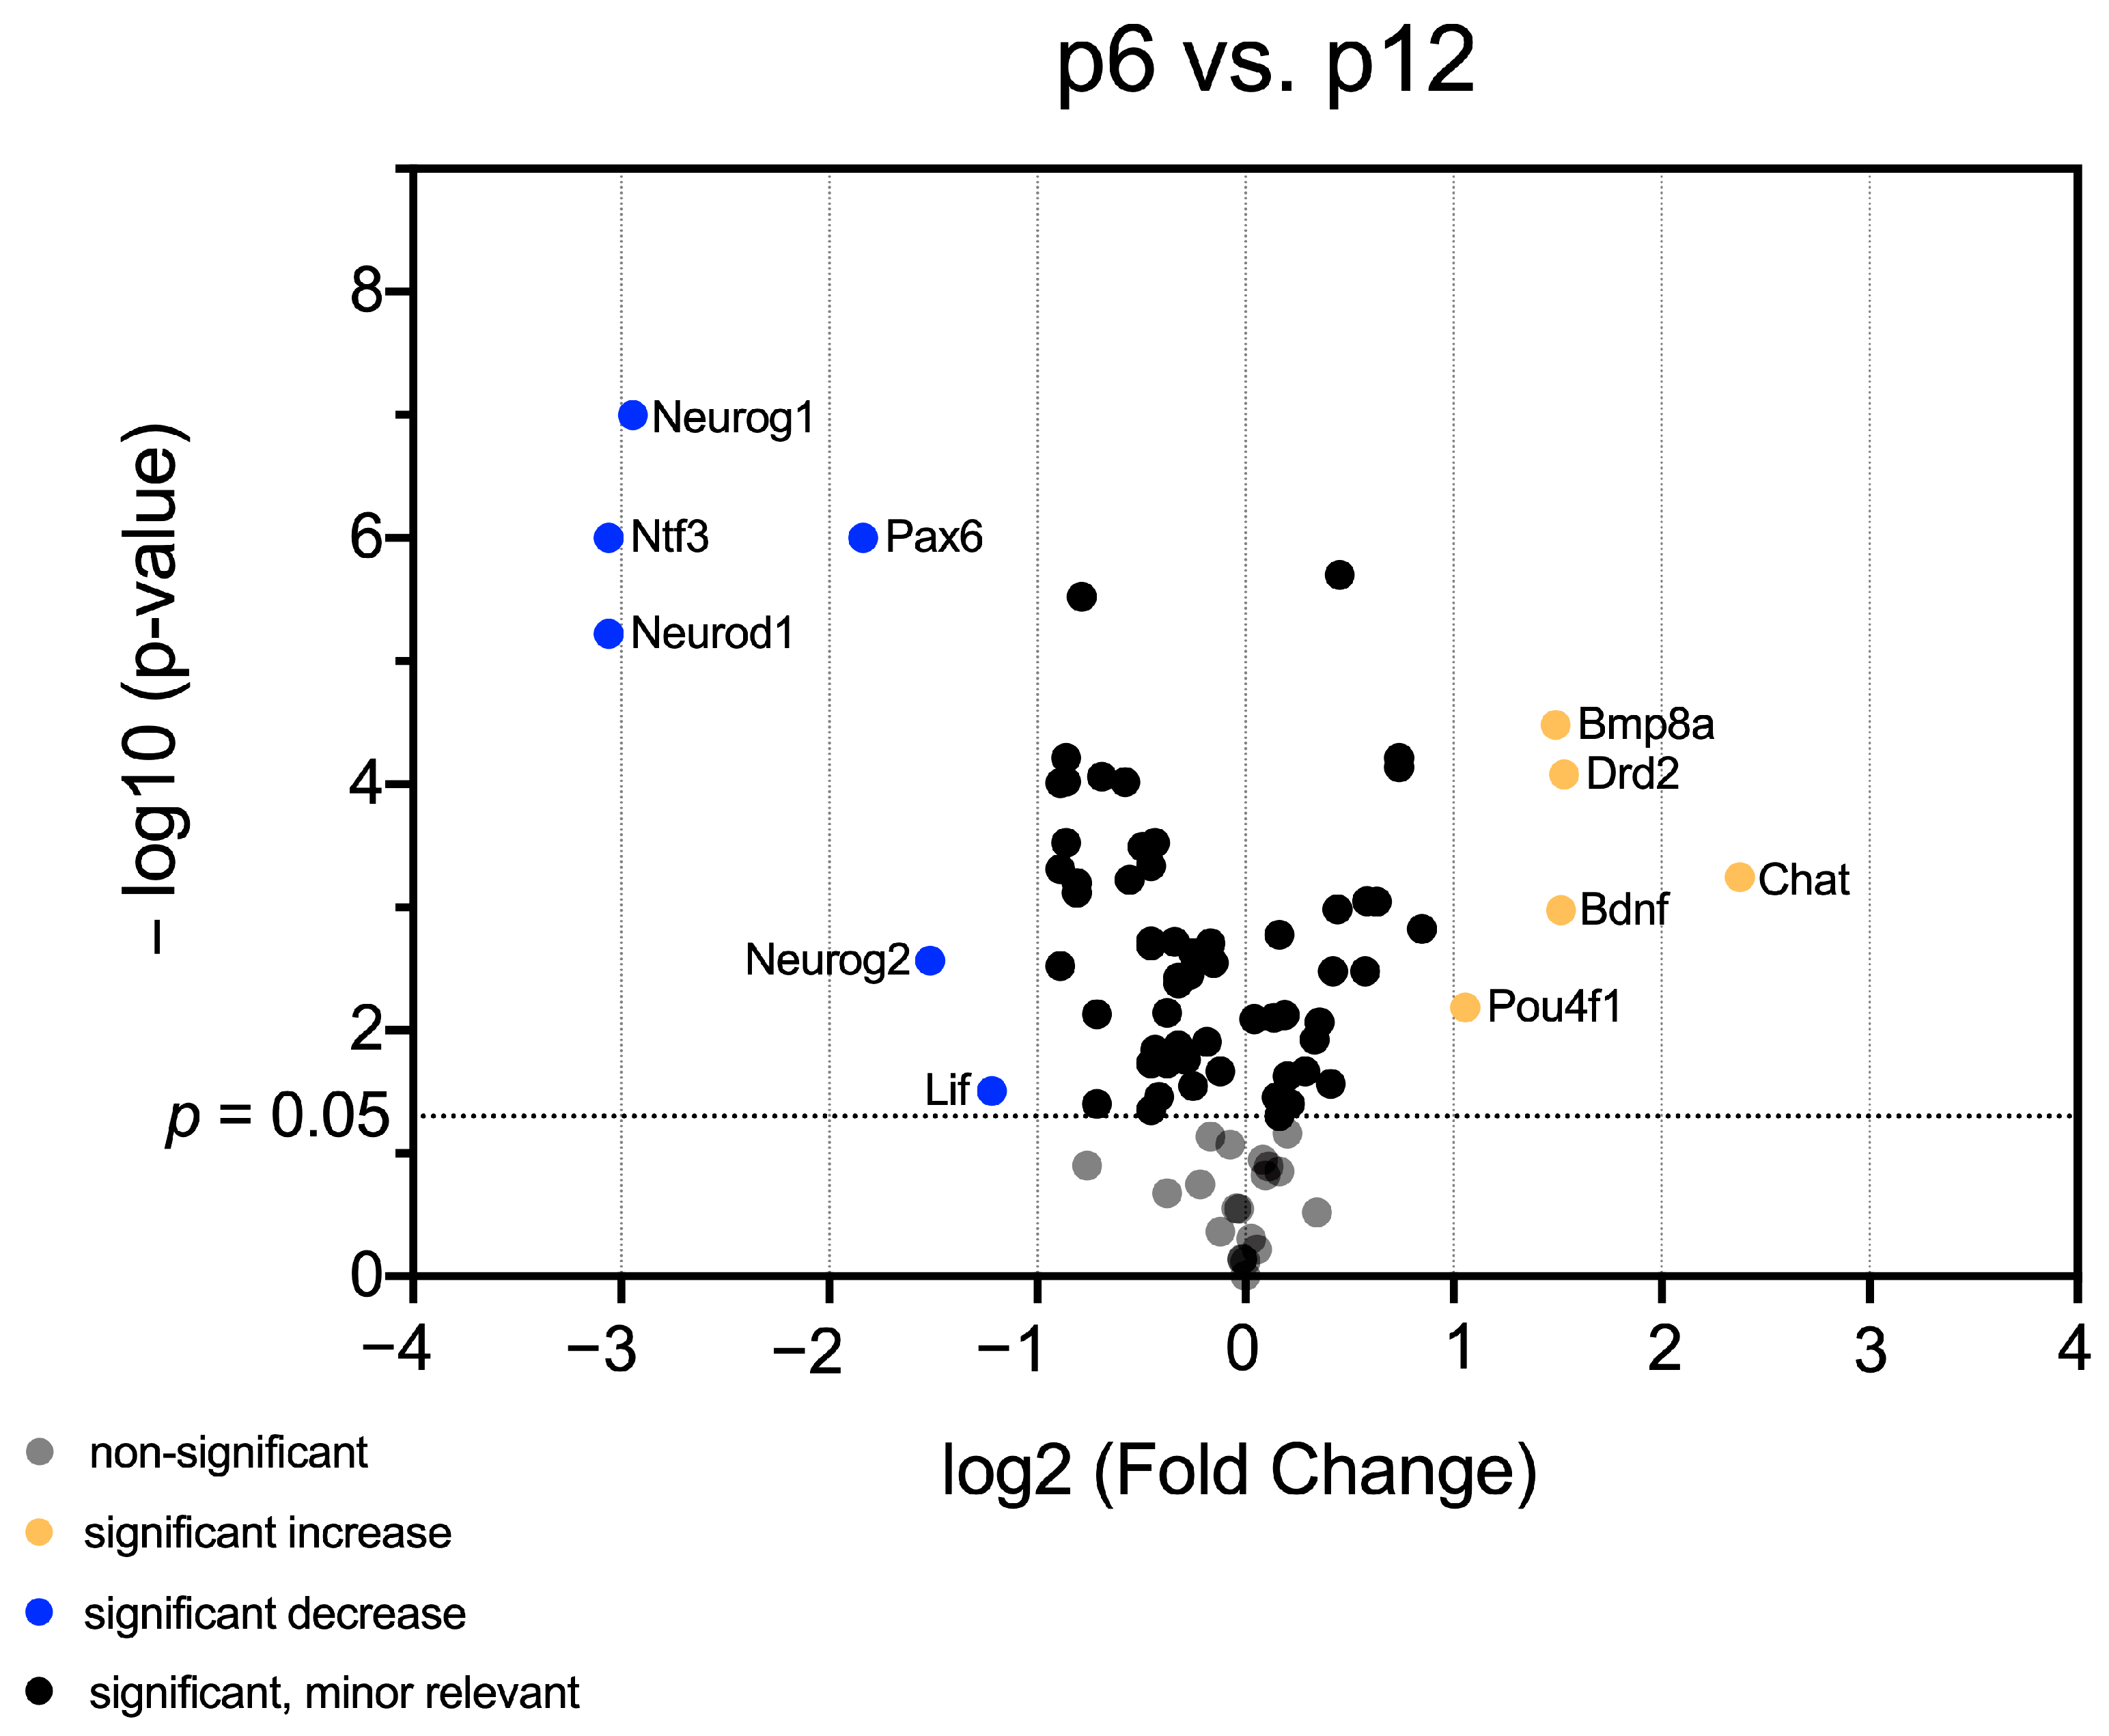
3.2. Identification of Neurogenic Factors with High Importance for NSC Development and Neurogenesis in Maturing CN

Having identified mRNA patterns in maturing CN, which vary in a hearing-correlating manner, volcano plots were generated to identify genes that exhibited both significant (p < 0.05) and relevant (fold change < 0.5 or >2) changes in mRNA abundance over time. Comparing all age groups, 38 genes were identified, whose mRNA abundance changes were significant and relevant.
Comparison between p6 and p12 revealed a significant and relevant decrease in mRNA abundance of Lif, Neurog2, Pax6, Neurod1, Ntf3, and Neurog1 at p12. In contrast, the mRNA abundance of Chat, Pou4f1, Bdnf, Drd2, and Bmp8a were significantly changed and relevantly higher at p12 than at p6 (Figure 2).
The analysis of the age-stage comparison between p12 and p24 revealed age-dependent high and low mRNA abundance of neurogenic factors. Significantly changed and relevantly lower mRNA abundance at p24 than at p12 was detected for Dcx, Th, Chat, Drd2, Ascl1, Flna, Ptn, Paax3, Robo1, and Bmp8a. In contrast, Rtn4, Vegfa, Mef2c, Hey1, B2m, Sod1, Adora2a, Tnr, Ndp, Artn, Cxcl1, Gdnf, Fgf2, and S100b had significantly changed and relevantly higher mRNA abundance in p24 than p12 (Figure 3).
The comparison of age groups p6 and p24 showed significant and relevant changes in mRNA abundance of most of the same factors previously identified in the comparison of age groups p6 and p12. The factors Dcx, Neurod1, Ntf3, Th, Pax6, Flna, Bmp4, Ascl1, Ptn, Erbb2, Neurog2, Lif, Efnb1, and Neurog1 displayed a significantly changed and relevantly lower mRNA abundance at p24 than at p6. The genes Artn, Bdnf, Gdnf, Ache, App, Sod1, Apoe, Mef2c, Fgf2, Vegfa, Rtn4, and S100b had a significantly changed and relevantly higher mRNA abundance at p24 than at p6 (Figure 4).

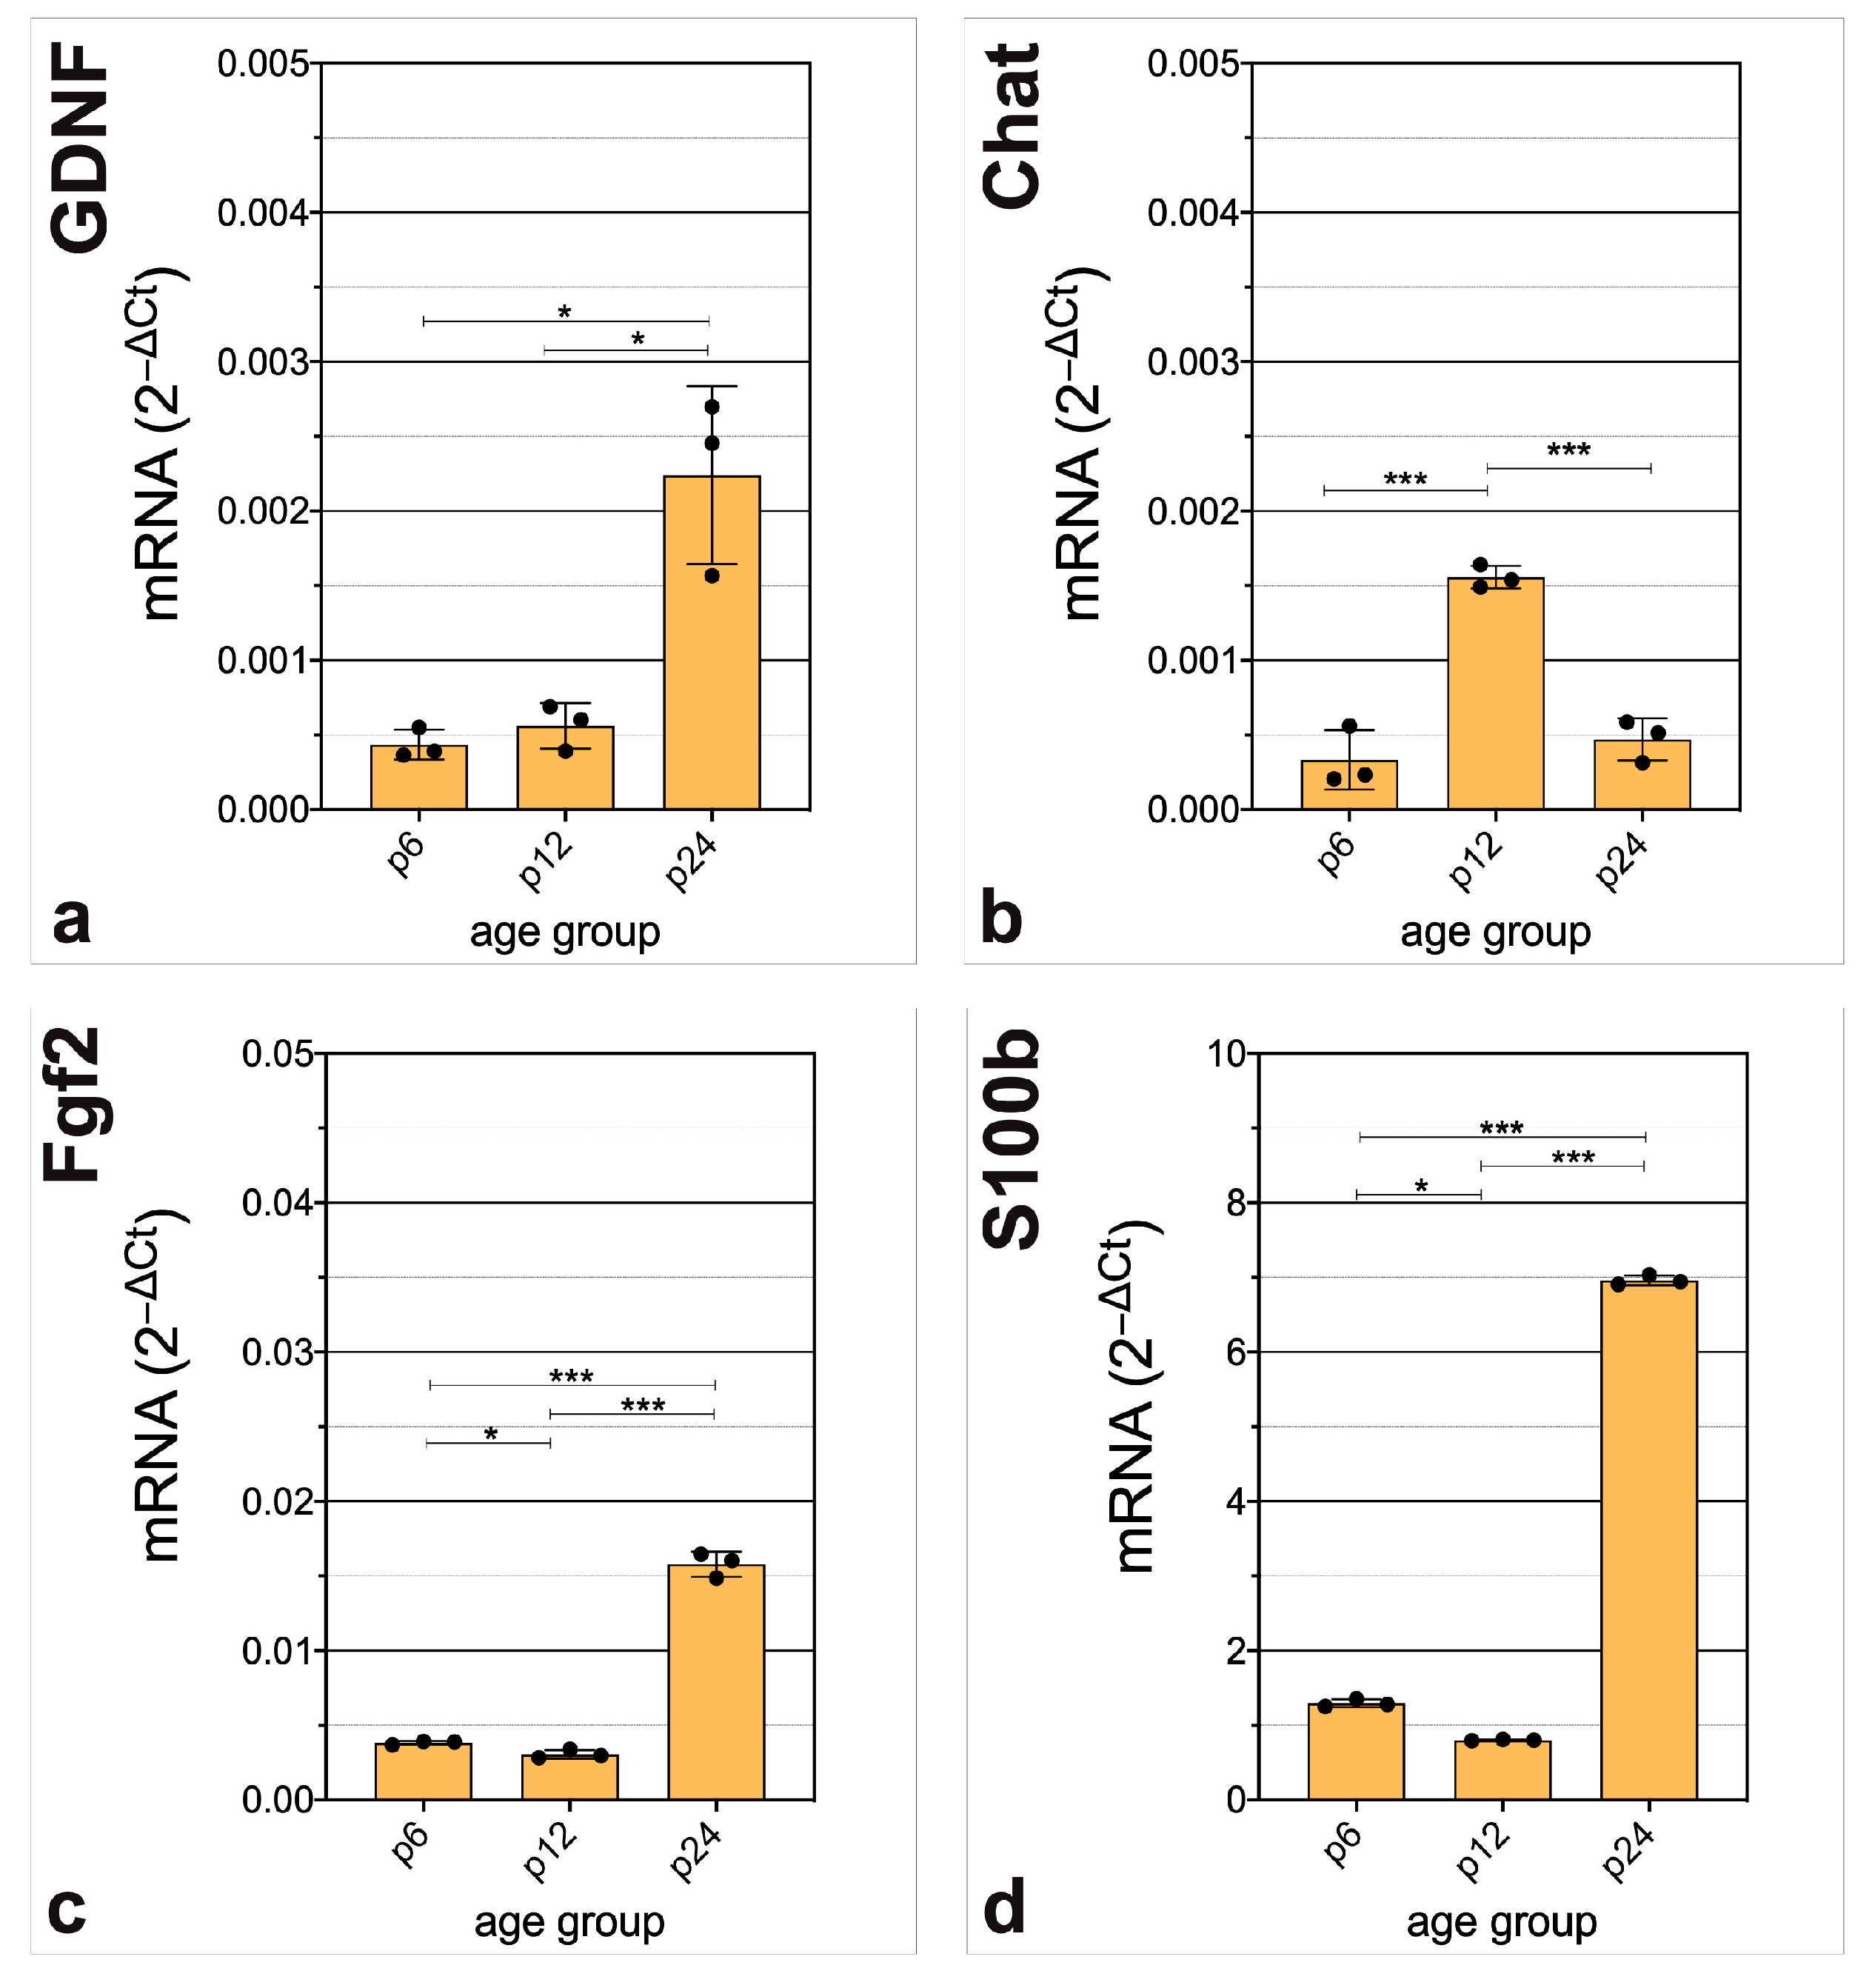
3.3. In-Depth Analysis of Selected Critical Neurogenic Factors in Maturing CN

To analyze and highlight the importance of individual neurogenic factors, which show significant and relevant differences in mRNA abundance, their 2-−ΔCt values were examined over time. For this purpose, genes were selected whose relative expression changes were significant within the relevantly altered cohort (fold change < 0.5 or >2) and showed the most pronounced changes. Genes with a fold change of >4 or <0.25 (log2 fold change = 2/−2) were examined at one of the analyzed stages. Four genes met this criterion with higher mRNA abundance over time. Namely, Gdnf, Fgf2, Chat, and S100b were analyzed. Additionally, for the genes with lower mRNA abundance over time, Dcx, Neurog1, Neurog2, Neurod1, Th, and Ntf3 met the fold change <4 criterion.
Essential genes in CN neurogenesis displayed a significant increase in mRNA abundance over time. mRNA abundance of Gdnf was significantly higher at p24 than at p6. There was no relevant difference between p6 and p12 (p6 vs. p12, p = 0.3004; p12 vs. p24, p = 0.0091; p6 vs. p24, p = 0.0066) (Figure 5a). Interestingly, Chat showed significantly higher mRNA abundance at p12 than at p6 with significantly lower mRNA abundance at p24 than at p12 (p6 vs. p12, p = p < 0.001; p12 vs. p24, p < 0.001; p6 vs. p24, p = 0.3818) (Figure 5b). After a significantly but slightly lower mRNA abundance at p12 than at p6, there was a pronounced significantly higher mRNA abundance of Fgf2 at p24 than at p12 (p6 vs. p12, p = 0.0132; p12 vs. p24, p < 0.001; p6 vs. p24, p < 0.001) (Figure 5c). Similarly, the mRNA abundance of S100b was shown to be significantly altered. After a slightly higher mRNA abundance at p6 than at p12, there was a significantly higher mRNA abundance at p24 (p6 vs. p12, p = 0.0087; p12 vs. p24, p < 0.001; p6 vs. p24, p < 0.001) (Figure 5d).
Essential genes in CN neurogenesis displayed significant decrease in mRNA abundance over time. Dcx displayed a significant decrease in mRNA abundance over time. There was a significantly lower mRNA abundance at p12 and p24 than at p6 (p6 vs. p12, p < 0.001; p12 vs. p24, p = p < 0.001; p6 vs. p24, p = p < 0.001) (Figure 6a). The mRNA abundance of Neurog1 and Neurog2 were significantly lower at p12 and p24 than at p6 (Neurog1, p6 vs. p12, p = p < 0.001; p12 vs. p24, p = 0.0648; p6 vs. p24, p = 0.0054) (Neurog2, p6 vs. p12, p = 0.0057; p12 vs. p24, p = 0.2471; p6 vs. p24, p = 0.0059) (Figure 6b,c). Neurod1 had similar differences in mRNA abundance. mRNA abundance was significantly lower at p12 and p24 that at p6 (p6 vs. p12, p < 0.001; p12 vs. p24, p = 0.0583; p6 vs. p24, p < 0.001) (Figure 6d). Th mRNA abundance was significantly lower at p12 and p24 than at p6 (p6 vs. p12, p = 0.0069; p12 vs. p24, p < 0.001; p6 vs. p24, p < 0.001) (Figure 6e). Ntf3 mRNA abundance was significantly lower at p12 and p24 than at p6 (p6 vs. p12, p < 0.001; p12 vs. p24, p = 0.2011; p6 vs. p24, p < 0.001) (Figure 6f).

4. Discussion

mRNA levels of neurogenic factors were analyzed in rat CN before hearing onset (p6), at hearing onset (p12), and after hearing onset (p24). This analysis revealed characteristic mRNA abundance patterns over time about hearing (Figure 7). Furthermore, it was shown that a differentially pronounced significance of the differences in mRNA abundance of the individual neurogenic factors was present. Specific gene(s) groups shape the neurogenesis of rat CN at crucial time points of the auditory system on the mRNA level. Analysis of these factors demonstrated that the changes in their mRNA level were closely correlated to the results obtained from in vitro studies [13]. A detailed analysis of the mRNA level of neurogenic factors at the crucial stages of the maturing CN has been demonstrated, to the best of our knowledge, for the first time.

4.1. bHLH Family of Transcription Factors and Pax Gene Family Play Essential Roles in CN Neurogenesis and Regulation of NSC Pool on mRNA Level

Analysis of significantly and relevantly altered mRNA abundance of neurogenic factors identified that the basic helix-loop-helix (bHLH) family of transcription factors and the Pax gene family assume a critical role in CN NSC niche regulation at the mRNA level.
Genes of the bHLH transcription factor family and the Pax gene family are strongly represented in Cluster D, which has as a standard feature a high mRNA abundance before hearing onset (Figure 1, Cluster D). Pax3 and Pax6 are important in maintaining NSCs and their differentiation into neurons [25]. Pax3 regulates migration and differentiation in precursor cell populations [26]. Removal of Pax6 reduces NSC self-renewal and results in early neurogenesis [27]. mRNA abundance of Pax3 and Pax6 was significant and relevantly higher at p6 than at p24 (Figure 4). Pax2 plays an essential role in developing the inner ear. A high correlation between Pax2 expression and the proliferation of chicken hair cells has been reported in the literature [28]. The selective elevation of Pax2 mRNA at hearing onset and its influence on the inner ear highlight its importance for the maturation of sensory proneural cells in the auditory system. These results indicate an essential role of Pax genes in maintaining CN NSC niche before hearing onset.
The bHLH genes Neurog1, Neurog2, Ascl1, and Neurod1 play a central role in the development and maturation of the auditory pathway [29]. These genes displayed significant and relevant changes at mRNA levels (Figure 4 and Figure 6b–d). They contribute to the proliferation, cell cycle, and differentiation of neurons [30,31]. They are essential for neuron survival and crucial in forming internuclear connections of the auditory pathway [29,31,32,33]. Neurog1, Neurog2, and Ascl1 function to induce proneural differentiation while suppressing gliogenesis [34]. These results emphasize the proneural influence of these bHLH transcription factors on the NSC pool before hearing onset.
HeyL, Hey1, Hes1, and Hey2 are members of the Hey/Hes family, which are also bHLH transcription factors. Hey1 and Hey2 promote neural precursor cell maintenance in the brain and negatively regulate neuronal bHLH genes [35]. mRNA abundance of both genes was elevated at p24, with Hey2 already upregulated around hearing onset (Figure 1, Cluster A and C). Hey1 mRNA abundance was significant and relevantly higher at p24 than at p12 (Figure 3). HeyL mRNA increased at p24 (Figure 1, Cluster C). This is interesting because HeyL, on the other hand, promotes neuronal differentiation from neural progenitor cells by inhibiting other Hey/Hes genes [36]. These expression patterns suggest that these genes play a critical role in maintaining the CN NSC niche after activation at hearing onset.
Mutual interactions were found between the previously described factors about neurogenesis and the NSC niche. Interestingly, Pax3 was shown to regulate both bHLH genes Hes1 and Neurog2 [37]. In mouse embryos with nonfunctional Pax3 mutant, transcripts of Hes1 and Neurog2 and, consequently, neurogenesis and NSC development were reduced. Therefore, two crucial functions are attributed to Pax3 in this context—first, the maintenance of stem cell character secured by the bHLH gene Hes1 [37]. Hes1 ensures proper maintenance of the stem cell niche, and when missing, premature neurogenesis occurs [38]. On the other hand, the bHLH gene Neurog2 initiates the development of the neuronal lineage of NSCs. Neurog2 assumes a critical role in sensory neurogenesis [39].
The results of this study suggest that at the mRNA level, the CN NSC niche is maintained by Pax genes before hearing onset. At the same time, the results indicate that stimulation by activating bHLH genes (Neurog1, Neurog2, Neurod1, and Ascl1) stimulates proneural progenitor cells before hearing onset. As described in 4.2, there is an increase in neurogenic factors at the mRNA level at hearing onset that activates the CN NSC niche (Figure 1, Cluster E). At the same time, there is a decrease in proneural mRNA and activating bHLH genes at the hearing onset (Figure 2). bHLH genes that suppress and thus maintain the CN NSC niche (Hey/Hes) mostly experience an increase in mRNA after hearing onset (Figure 1, Clusters A, C, and E). Therefore, transcription factors of the Pax family and the bHLH family may represent potential targets for future gene therapies to manipulate CN Neurogenesis and NSC niche.

4.2. NSC Niche-Activating Transcripts Are Elevated at the Hearing Onset

At hearing onset (p12), factors that promote a proneural fate of NSCs and the survival of newly formed neurons and progenitor cells have a higher mRNA abundance (Figure 7). The genes whose mRNA abundance started to increase at p12 are labeled Cluster A, and genes with mRNA abundance higher at p12 are labeled Cluster E (Figure 1, Cluster A, and Cluster E).
Cluster A contained Map2, Hey2, Chrm2, Dlg4, Slit2, and Bdnf (Figure 1, Cluster A). Most of these genes had the highest mRNA abundance at p24 and are therefore discussed at 4.4. Bdnf has a vital role in the survival of newly formed cells, and its mRNA abundance was significant and relatively higher at p12 than at p6 (Figure 2) [40]. Interestingly, Bdnf mRNA was expressed in the early postnatal days and is downregulated with maturation in the rat inner ear [41]. These results indicate that on the mRNA level, Bdnf has an essential role in developing and surviving neurons in the auditory system.
Cluster E consisted of genes relevant for stimulation of NSC niche (Chat, Drd2, and Bmp8a), regulation of newly formed progenitor and neurons (Pax2, Nrp1, Nrp2, Cdk5r1, and Hes1), regulation of gliogenesis (Ndn and Olig2), neuroprotection and survival of new neurons (Hdac4, Ptn, and Bcl2), and axogenesis (Robo1, Pou4f1) [42,43,44,45,46,47,48,49,50,51,52,53,54].
mRNA abundance of Bmp8a, Drd2, Pou4f1, and Chat were significantly and relevantly higher at p12 than at p6 (Figure 2). Bmps are activated in NSCs that enter a neuronal fate [55]. Bmp8a provides proneural differentiation in hippocampal NSCs, which is critical, and Pou4f1 plays a crucial role in neuronal differentiation and survival [49]. Chat and Drd2 provide stimulation of NSC niche and proneural progenitor cells [56,57]. The interplay of these factors indicates that activation of CN NSC niche and neuronal differentiation of NSCs occurs at hearing onset. The acoustic stimulus that starts at the hearing onset is a potential trigger for these changes [58]. The changes in Chat mRNA abundance were significant and pronounced higher at p12 than at p6 (Figure 5b). Therefore, this neurogenic factor was highlighted. It was shown by Chat+ immunoreaction detection in the chicken that efferent neurons pulling from CN to the cochlea are 70% cholinergic [59]. The increase in Chat mRNA at p12 possibly represents the increased formation of cochlear efferents in response to auditory input triggered by hearing onset.
Around the hearing onset, genes stimulating NSCs to a proneural fate with expansion and protection of these cells had high mRNA abundance. This indicates that neuronal input from the cochlea is accompanied by the stimulation of genes in CN, which promote the formation and stabilization of signal-transducing neuronal structures. Interestingly, factors with crucial influence on axogenesis were also upregulated. Axonal growth and axon-path-finding, together with proneural regulation, shaped the expression pattern of neurogenetic factors at the time of hearing onset in CN. Slit1 and Robo1 are essential in axogenesis in embryonal CN [60].
Interestingly, auditory stimulus promotes the differentiation and maturation of neurons from NSCs in CN. Here, a connection with the clusterin pathway has been described [58]. The results of this study, which examined the physiological development of CN maturation in response to hearing, made comparable findings at the mRNA level at the time of hearing onset.
The results of this study suggest that proneural stimulation occurs at the mRNA level at hearing onset at the expense of the NSC pool. The increased mRNA of neurogenic factors stimulating the NSC niche suggests that the critical balance between proliferation and differentiation is shifting towards differentiation at hearing onset. In vitro, a decrease in neurospheres was observed up to p12 with stable neurosphere formation at a low level [13]. Neurospheres are a correlate for mitotic self-renewal and proliferation of NSCs [61]. Analysis of the cell division and proliferative marker BrdU showed high cell division activity up to p12 with a decrease and stable low levels from p20 [13]. These results suggest a close correlation between the mRNA level and the results expressed at the protein level. The characteristic changes at the mRNA level of neurogenic factors in CN reflect the changes in the in vitro results. This is interesting because other brain sections with NSC niches have similarly been found to have decreasing NSC capacity in vitro. A prominent example is the dentate gyrus of the hippocampus. Here, a decrease in new neurons forming was observed [62,63]. Using a similar methodology, no significant change in neurogenic factors mRNA abundance in the dentate gyrus was detected. mRNA abundance of the neurogenic factors was stable over time [64].

4.3. mRNA of Neurogenic Factors Stimulating Proliferation, Neuronal Migration, and Proneural Differentiation Is Abundant before Hearing Onset

Before hearing onset (p6), mRNA abundance of genes that promote proliferation, neuronal migration, and proneural differentiation was higher than at p12 and p24 (Figure 1, Cluster D) (Figure 7). Four subgroups were identified, depending on the mRNA levels at subsequent ages.
The first subgroup had a slight decrease in mRNA abundance at hearing onset with a significant reduction at p24 and contained the genes Lif, Dvl3, Neurog2, Ntn1, Pard3, Bmp4, and Flna (Figure 1, Cluster D). Ntn1, Pard3, and Flna promote the maintenance of self-renewing progenitor cells [65,66,67]. Neurog2 had a significant and relevantly higher mRNA abundance at p6 compared to subsequent ages and promotes proneural differentiation (Figure 2 and Figure 4) [30]. NSCs transplanted into the inner ears of guinea pigs with degenerated spiral ganglions differentiated into neurons after transduction with Neurog2 [68]. These results indicate that Neurog2 is critical for developing newly formed neurons in spiral ganglions. Bmp4 and Lif were expressed similarly and promoted gliogenesis [69,70]. Dvl3 is essential for cochlea and brain maturation at early stages [71]. Another subgroup, whose mRNA levels remained consistently low beginning at p12, included genes that promote maintenance of the neural stem cell pool (Pax6, Notch2, and Cdk5rap2) and a proneural fate of progenitor cells (Ntf3 and Neurod1) (Figure 1, Cluster D) [25,33,72,73,74]. The changes in mRNA abundance of Ntf3 in CN over time were significant and relevant (Figure 6f). The essential function of Ntf3 for forming neurons in the spiral ganglion was demonstrated [75]. These results suggest that Ntf3 plays a vital role at the mRNA level in forming new neurons in the auditory system. Kmt2a, Ep300, Tgfb1, Mdk, Neurog1, and Creb1 formed another subgroup (Figure 1, Cluster D). After a decrease in mRNA level at hearing onset (p12), this subgroup had intermediate mRNA abundance at p24. This subgroup consisted of genes that promote a proneural fate of progenitor cells and maintain a progenitor cell pool [31,76,77,78,79]. Mdk promotes NSC migration [80]. Another subgroup consisted of genes promoting neuronal migration (Dcx), maintaining of the NSC pool (Pax3, Efnb1, Notch1, and Sox2), and differentiation (Th, Erbb2 and Ascl1) (Figure 1, Cluster D) [25,73,81,82,83,84,85,86]. Th had significant and slightly lower mRNA abundance at p12 than at p6. Subsequently, there was a substantial drop in mRNA abundance at p24 (Figure 6e). In the spiral ganglion, protein expression studies of Tyrosin-hydroxylase revealed a peak before hearing onset with a decline at the hearing onset. It was suggested that Th indicates the hearing onset in the spiral ganglion [87]. mRNA abundance of Dcx, which promotes neuronal migration, was significant and relevantly higher at p6 than at p24 and significant and relevantly higher at p12 than at p24 (Figure 3 and Figure 4). Thus, the crucial decrease at the mRNA level of Dcx occurs after hearing onset (Figure 6a). The protein DCX has been shown to play a critical role in maturing neurons in other neurogenic areas. Its expression decreased with age [88]. Additionally, the dorsal part of CN expresses DCX [89]. These findings indicate that Dcx is essential for neuronal migration in developing CN at the mRNA level before and at hearing onset.
Analysis of genes with higher mRNA abundance before hearing onset (p6) in CN indicates that this development point is critical for mRNA-level neurogenesis. On the one hand, proliferative factors and genes that are relevant for the maintenance of a self-renewing progenitor or stem cell pool, and on the other hand, factors that are essential for the migration and formation of new neurons shape CN neurogenesis before hearing onset. This suggests a critical balance between proliferation, differentiation, and regulation of the NSC pool before hearing onset.
Additionally, the genes with the most pronounced changes in mRNA abundance showed high biological relevance to the auditory pathway, as the critical influence of these genes and their gene products was found in other nuclei of the auditory pathway. This indicates that NSC development and neurogenesis along the auditory pathway share certain mRNA-level intranuclear similarities.

4.4. Regulators of Gliogenesis, Neuritogenesis, Synaptogenesis, and Angiogenesis Are Prominent at the Transcriptional Level of CN after Hearing Onset

Clusters B and C contain genes whose mRNA levels increased after hearing onset. The genes in Cluster B had a low mRNA abundance before hearing onset. In contrast, Cluster C is characterized by mRNA of these genes being intermediate before hearing onset and decreased at hearing onset (Figure 1, Cluster B and C). Genes whose mRNA levels increase after hearing onset largely influence gliogenesis, neuritogenesis, and angiogenesis.
The genes S100b, Sod1, Chrm2, Sox8, Bmp4, Erbb2, Nf1, Gpi, and Bmp2 are relevant for gliogenesis and development of astrocytes [70,86,90,91,92,93,94,95]. mRNA abundance of these genes is high after hearing onset (p24) (Figure 1, Cluster B and C). S100b mRNA abundance was significantly and relevantly higher (Figure 5d). S100b mRNA is largely localized in astroglial cells. Interestingly, S100-positive neurons were detected at a very high density in the auditory system, especially in CN [96]. In rodents, there is an increase in S100b expression within the first three postnatal weeks, indicating that astrocytes significantly regulate glial proliferation and synaptic plasticity [97]. These results suggest that the increase in S100b mRNA abundance after hearing onset has a crucial influence on the gliogenesis and synaptogenesis of CN.
Similarly, the mRNA level of genes influencing neuritogenesis and synaptogenesis was increased. Mef2c, Rtn4, Grin1, Pafah1b1, Il3, Map2, Nrcam, Apoe, Ache, App, Dlg4, Gdnf, Alk, and Artn play essential roles in neuritogenesis, and synapse formation and mRNA levels of these genes are higher at p24 (Figure 1, Cluster B and C) [98,99,100,101,102,103,104,105,106,107,108,109,110,111]. The timing of maturation and development of synaptogenesis is consistent with studies of other brain regions. In rat motor-sensory cortex, the density of synapses increases rapidly from about 14 days onward and shows a peak between 20 and 30 days [112]. Gdnf had a significantly and relevantly higher mRNA abundance at p24 than at p6 and p12 (Figure 5a). Gdnf has been detected up to the adult stage in the spiral ganglion and other sections of the cochlea and is suggested to promote neuritogenesis and protect neuronal cells [101,113]. An age-dependent comparison has yet to be made in these studies. Interestingly, a similar mRNA pattern of Gdnf has been demonstrated in the rat cerebellum [114]. These results suggest the potential importance of Gdnf for the protection and survival of auditory neurons.
A subset of genes (Vegfa, Ndp, Adora1, and Adora2a) whose mRNA abundance is increased after hearing onset (p24) has an essential influence on angiogenesis and blood–brain barrier formation (Figure 1, Cluster B and C) [115,116,117]. The increase in mRNA level of these genes was significant and relevant between p12 and p24 (Figure 4). Interestingly, cerebral capillary diameters increase at p24 in healthy rats [118]. These results suggest that Adora2a, Vegfa, and Ndp influence angiogenesis in maturing CN.
Interestingly, mRNA abundance of genes influencing neural progenitor cells and NSC niche is increased after hearing onset. Some of these genes (Nrg1, Stat3, Rac1, Pou3f3, Nog, Shh, and Dll1) displayed no significant and relevant change in mRNA abundance (Figure 1, Cluster B and C) [73,119,120,121,122,123,124,125]. The mRNA levels of several of these genes (B2m, Tnr, Cxcl1, Hey1, Fgf2) were significantly and relevantly altered over time (Figure 3). B2m is a pro-aging factor and inhibits neurogenesis [126]. Tnr regulates NSC niche and neurogenesis [127]. Hey1 promotes NSC maintenance [35]. Cxcl1 inhibits the proliferation of NSC niche [128]. Fgf2 mRNA abundance was significantly and relevantly higher at p24 than at p6 and p12 (Figure 5c). Fgf2 has an essential function in neurons of the peripheral and central auditory pathways [129]. Egf and Fgf2 ensure the survival and proliferation of NSCs into the adult stage [130]. The proliferation of neural progenitor cells occurs after cerebral ischemia by administration of Egf and Fgf2 [131]. Fgf2 has a crucial influence on the NSC niche by suppressing astrocytic differentiation and preserving dormancy [132]. In the context of gene therapy for treating Alzheimer’s disease, the therapeutic potential of Fgf2 by stimulating NSCs in neurodegenerative disorders has already been demonstrated [133]. These results indicate that after hearing onset (p24) NSC niche is regulated at the mRNA level by different factors promoting the maintenance of the NSC niche.

4.5. Limitations of the Study

Exclusively the level of mRNA of neurogenic factors was investigated. An analysis of proteomics is necessary to verify whether changes at the mRNA level correlate with expression at the protein level in vivo in the rat. This study aimed to determine whether and to what extent changes in selected neurogenic factors are apparent at the mRNA level. The chosen genes were classified according to their biological importance and the project’s research question. Transcripts subsequently showed a highly relevant biological significance in the auditory system (4.1 and 4.3). In addition, 2(−ΔCt) values rather than fold change were analyzed to assess RNA content. Thus, evaluating the change’s expression of the mRNA abundance level is possible. All relevant altered genes in 3.2 were also analyzed and evaluated for neurogenesis. Identifying NSC niche or single cell groups showing appropriate neurogenic potential is impossible with this methodology. What kind of cells express these neurogenic factors and thus provide the required milieu for NSCs remains unknown. In this respect, single-cell RNA sequencing would be a relevant extension of the current work. This study will hopefully serve as a basis for additional investigations of the neurogenic capacity of CN at the transcriptional and other levels.

5. Conclusions

In summary, neurogenic mRNA patterns correlating with hearing capacity, as well as factors with essential impact on CN neurogenesis, were identified. Before hearing onset (p6), mRNA abundance of factors promoting NSC niche maintenance, proneural differentiation, and proliferation were elevated. At hearing onset (p12), mRNA levels of genes that promote activation of the NSC niche increased. After hearing onset (p24), genes affecting synaptogenesis, angiogenesis, and gliogenesis had high mRNA abundance. Significantly and relevantly altered genes were identified. Changes at the mRNA level reflected in vitro changes in CN NSC capacity. Furthermore, the relevant altered neurogenic factors closely correlated to the maturation and neurogenesis of other nuclear areas of the auditory pathway. The results of this study may contribute to a better understanding of molecular processes of auditory pathway neurogenesis.

Supplementary Materials

The following supporting information can be downloaded at: https://www.mdpi.com/article/10.3390/life13091858/s1. Table S1: Gene Table, Table S2: Average Ct, Table S3: Average Delta(Ct), Table S4: 2^(−Avg.(Delta(Ct)), Table S5: Fold Change, Table S6: p-value, Figure S1: The individual clusters without dendrogram and larger font of the gene names.

Author Contributions

J.E.: preparation of the animals, RNA isolation, DNA synthesis, statistical evaluation of the results, and writing of the paper. J.D.: RNA isolation, DNA synthesis, correction of the manuscript. B.V.: teaching of scientific techniques, correction of the manuscript. T.E.K.: statistical evaluation of the results, and manuscript correction. B.S.: support of animal preparation, RNA isolation, DNA synthesis. R.H.: project supervision and correction of the manuscript. K.R.: project supervision, coordination of the research project, and manuscript correction. J.V.: project supervision, teaching of scientific techniques, technical support for software and hardware, digital image composition, and manuscript correction. All authors have read and agreed to the published version of the manuscript.

Funding

This work was generously supported by the “Interdisciplinary Center for Clinical Research Wuerzburg”, IZKF Wuerzburg (grant #Z-2/CSP-4 (JV), #Z-2/89 (JE) and #Z3BC/05 (BS)), Beethovenstrasse 1a, Wuerzburg, D-97080, Germany; https://www.med.uni-wuerzburg.de/izkf/ (accessed on 30 August 2023). BV is supported by the German Research Foundation DFG VO 2138/7-1 grant 469177153. This publication was supported by the Open Access Publication Fund of the University of Wuerzburg.

Institutional Review Board Statement

All experiments were conducted according to the national guidelines for treating and using laboratory animals (§8). All experiments described in the manuscript were carried out exclusively as organ removal. Removing organs from the animal after the sacrifice is subject to a notification requirement as per § 6 Abs. 1 No. 4 (German Animal Welfare Act). Code: BY_HNOIOWÜ_2020.

Data Availability Statement

The data used to support the findings of this study are included within the article.

Acknowledgments

The authors would like to thank the technical team of the ENT research laboratory, in particular Laura Halbhuber, Silke Hummel, and Petra Joa, for their support with animal care, RNA isolation, DNA synthesis, and PCR-cycling.

Conflicts of Interest

We declare that we have received no support from any companies for the submitted work and have no financial or non-financial interest that might be relevant to the submitted work.

References

  1. Chadha, S.; Kamenov, K.; Cieza, A. The world report on hearing, 2021. Bull. World Health Organ. 2021, 99, 242. [Google Scholar] [CrossRef] [PubMed]
  2. Stojkovic, M.; Han, D.; Jeong, M.; Stojkovic, P.; Stankovic, K.M. Human induced pluripotent stem cells and CRISPR/Cas-mediated targeted genome editing: Platforms to tackle sensorineural hearing loss. Stem. Cells 2021, 39, 673–696. [Google Scholar] [CrossRef] [PubMed]
  3. Lahlou, G.; Calvet, C.; Giorgi, M.; Lecomte, M.J.; Safieddine, S. Towards the Clinical Application of Gene Therapy for Genetic Inner Ear Diseases. J. Clin. Med. 2023, 12, 1046. [Google Scholar] [CrossRef]
  4. Mali, P.; Esvelt, K.M.; Church, G.M. Cas9 as a versatile tool for engineering biology. Nat. Methods 2013, 10, 957–963. [Google Scholar] [CrossRef] [PubMed]
  5. Gao, X.; Tao, Y.; Lamas, V.; Huang, M.; Yeh, W.H.; Pan, B.; Hu, Y.J.; Hu, J.H.; Thompson, D.B.; Shu, Y.; et al. Treatment of autosomal dominant hearing loss by in vivo delivery of genome editing agents. Nature 2018, 553, 217–221. [Google Scholar] [CrossRef] [PubMed]
  6. Elbashir, S.M.; Martinez, J.; Patkaniowska, A.; Lendeckel, W.; Tuschl, T. Functional anatomy of siRNAs for mediating efficient RNAi in Drosophila melanogaster embryo lysate. EMBO J. 2001, 20, 6877–6888. [Google Scholar] [CrossRef]
  7. Yoshimura, H.; Shibata, S.B.; Ranum, P.T.; Moteki, H.; Smith, R.J.H. Targeted Allele Suppression Prevents Progressive Hearing Loss in the Mature Murine Model of Human TMC1 Deafness. Mol. Ther. 2019, 27, 681–690. [Google Scholar] [CrossRef]
  8. Gage, F.H. Mammalian neural stem cells. Science 2000, 287, 1433–1438. [Google Scholar] [CrossRef]
  9. Sohur, U.S.; Emsley, J.G.; Mitchell, B.D.; Macklis, J.D. Adult neurogenesis and cellular brain repair with neural progenitors, precursors and stem cells. Philos. Trans. R Soc. Lond B Biol. Sci. 2006, 361, 1477–1497. [Google Scholar] [CrossRef]
  10. Engert, J.; Spahn, B.; Bieniussa, L.; Hagen, R.; Rak, K.; Voelker, J. Neurogenic Stem Cell Niche in the Auditory Thalamus: In Vitro Evidence of Neural Stem Cells in the Rat Medial Geniculate Body. Life 2023, 13, 1188. [Google Scholar] [CrossRef]
  11. Hu, Z.; Tao, L.; Liu, Z.; Jiang, Y.; Deng, X. Identification of Neural Stem Cells from Postnatal Mouse Auditory Cortex In Vitro. Stem. Cells Dev. 2019, 28, 860–870. [Google Scholar] [CrossRef] [PubMed]
  12. Oshima, K.; Grimm, C.M.; Corrales, C.E.; Senn, P.; Martinez Monedero, R.; Geleoc, G.S.; Edge, A.; Holt, J.R.; Heller, S. Differential distribution of stem cells in the auditory and vestibular organs of the inner ear. J. Assoc. Res. Otolaryngol. 2007, 8, 18–31. [Google Scholar] [CrossRef] [PubMed]
  13. Rak, K.; Volker, J.; Frenz, S.; Scherzed, A.; Radeloff, A.; Hagen, R.; Mlynski, R. Dynamic changes of the neurogenic potential in the rat cochlear nucleus during post-natal development. Exp. Brain Res. 2013, 226, 393–406. [Google Scholar] [CrossRef] [PubMed]
  14. Rask-Andersen, H.; Bostrom, M.; Gerdin, B.; Kinnefors, A.; Nyberg, G.; Engstrand, T.; Miller, J.M.; Lindholm, D. Regeneration of human auditory nerve. In vitro/in video demonstration of neural progenitor cells in adult human and guinea pig spiral ganglion. Hear. Res. 2005, 203, 180–191. [Google Scholar] [CrossRef]
  15. Völker, J.; Engert, J.; Völker, C.; Bieniussa, L.; Schendzielorz, P.; Hagen, R.; Rak, K. Isolation and Characterization of Neural Stem Cells from the Rat Inferior Colliculus. Stem. Cells Int. 2019, 2019, 5831240. [Google Scholar] [CrossRef]
  16. Geal-Dor, M.; Freeman, S.; Li, G.; Sohmer, H. Development of hearing in neonatal rats: Air and bone conducted ABR thresholds. Hear. Res. 1993, 69, 236–242. [Google Scholar] [CrossRef]
  17. Schwartz, M.S.; Otto, S.R.; Shannon, R.V.; Hitselberger, W.E.; Brackmann, D.E. Auditory brainstem implants. Neurotherapeutics 2008, 5, 128–136. [Google Scholar] [CrossRef]
  18. Tanic, N.; Perovic, M.; Mladenovic, A.; Ruzdijic, S.; Kanazir, S. Effects of aging, dietary restriction and glucocorticoid treatment on housekeeping gene expression in rat cortex and hippocampus-evaluation by real time RT-PCR. J. Mol. Neurosci. 2007, 32, 38–46. [Google Scholar] [CrossRef]
  19. Yao, L.; Chen, X.; Tian, Y.; Lu, H.; Zhang, P.; Shi, Q.; Zhang, J.; Liu, Y. Selection of housekeeping genes for normalization of RT-PCR in hypoxic neural stem cells of rat in vitro. Mol. Biol. Rep. 2012, 39, 569–576. [Google Scholar] [CrossRef]
  20. Skidmore, A.F.; Beebee, T.J. Rat lactate dehydrogenase A and B subunit concentrations are not regulated by mRNA abundance in liver and heart. FEBS Lett. 1990, 270, 67–70. [Google Scholar] [CrossRef]
  21. Vandesompele, J.; De Preter, K.; Pattyn, F.; Poppe, B.; Van Roy, N.; De Paepe, A.; Speleman, F. Accurate normalization of real-time quantitative RT-PCR data by geometric averaging of multiple internal control genes. Genome. Biol. 2002, 3, research0034. [Google Scholar] [CrossRef]
  22. Babicki, S.; Arndt, D.; Marcu, A.; Liang, Y.; Grant, J.R.; Maciejewski, A.; Wishart, D.S. Heatmapper: Web-enabled heat mapping for all. Nucleic Acids Res. 2016, 44, W147–W153. [Google Scholar] [CrossRef] [PubMed]
  23. Plante, T.B.; Cushman, M. Choosing color palettes for scientific figures. Res. Pract. Thromb. Haemost. 2020, 4, 176–180. [Google Scholar] [CrossRef] [PubMed]
  24. D’Haeseleer, P. How does gene expression clustering work? Nat. Biotechnol. 2005, 23, 1499–1501. [Google Scholar] [CrossRef]
  25. Blake, J.A.; Ziman, M.R. Pax genes: Regulators of lineage specification and progenitor cell maintenance. Development 2014, 141, 737–751. [Google Scholar] [CrossRef] [PubMed]
  26. Maschhoff, K.L.; Baldwin, H.S. Molecular determinants of neural crest migration. Am. J. Med. Genet. 2000, 97, 280–288. [Google Scholar] [CrossRef]
  27. Sansom, S.N.; Griffiths, D.S.; Faedo, A.; Kleinjan, D.J.; Ruan, Y.; Smith, J.; van Heyningen, V.; Rubenstein, J.L.; Livesey, F.J. The level of the transcription factor Pax6 is essential for controlling the balance between neural stem cell self-renewal and neurogenesis. PLoS Genet. 2009, 5, e1000511. [Google Scholar] [CrossRef]
  28. Li, H.; Liu, H.; Corrales, C.E.; Mutai, H.; Heller, S. Correlation of Pax-2 expression with cell proliferation in the developing chicken inner ear. J. Neurobiol. 2004, 60, 61–70. [Google Scholar] [CrossRef]
  29. Jahan, I.; Kersigo, J.; Pan, N.; Fritzsch, B. Neurod1 regulates survival and formation of connections in mouse ear and brain. Cell Tissue Res. 2010, 341, 95–110. [Google Scholar] [CrossRef]
  30. Hulme, A.J.; Maksour, S.; St-Clair Glover, M.; Miellet, S.; Dottori, M. Making neurons, made easy: The use of Neurogenin-2 in neuronal differentiation. Stem. Cell Rep. 2022, 17, 14–34. [Google Scholar] [CrossRef]
  31. Ma, Q.; Anderson, D.J.; Fritzsch, B. Neurogenin 1 null mutant ears develop fewer, morphologically normal hair cells in smaller sensory epithelia devoid of innervation. J. Assoc. Res. Otolaryngol. 2000, 1, 129–143. [Google Scholar] [CrossRef]
  32. Kageyama, R.; Ohtsuka, T.; Kobayashi, T. The Hes gene family: Repressors and oscillators that orchestrate embryogenesis. Development 2007, 134, 1243–1251. [Google Scholar] [CrossRef]
  33. Kim, W.Y.; Fritzsch, B.; Serls, A.; Bakel, L.A.; Huang, E.J.; Reichardt, L.F.; Barth, D.S.; Lee, J.E. NeuroD-null mice are deaf due to a severe loss of the inner ear sensory neurons during development. Development 2001, 128, 417–426. [Google Scholar] [CrossRef]
  34. Bertrand, N.; Castro, D.S.; Guillemot, F. Proneural genes and the specification of neural cell types. Nat. Rev. Neurosci. 2002, 3, 517–530. [Google Scholar] [CrossRef]
  35. Sakamoto, M.; Hirata, H.; Ohtsuka, T.; Bessho, Y.; Kageyama, R. The basic helix-loop-helix genes Hesr1/Hey1 and Hesr2/Hey2 regulate maintenance of neural precursor cells in the brain. J. Biol. Chem. 2003, 278, 44808–44815. [Google Scholar] [CrossRef] [PubMed]
  36. Jalali, A.; Bassuk, A.G.; Kan, L.; Israsena, N.; Mukhopadhyay, A.; McGuire, T.; Kessler, J.A. HeyL promotes neuronal differentiation of neural progenitor cells. J. Neurosci. Res. 2011, 89, 299–309. [Google Scholar] [CrossRef]
  37. Nakazaki, H.; Reddy, A.C.; Mania-Farnell, B.L.; Shen, Y.W.; Ichi, S.; McCabe, C.; George, D.; McLone, D.G.; Tomita, T.; Mayanil, C.S. Key basic helix-loop-helix transcription factor genes Hes1 and Ngn2 are regulated by Pax3 during mouse embryonic development. Dev. Biol. 2008, 316, 510–523. [Google Scholar] [CrossRef] [PubMed]
  38. Ishibashi, M.; Ang, S.L.; Shiota, K.; Nakanishi, S.; Kageyama, R.; Guillemot, F. Targeted disruption of mammalian hairy and Enhancer of split homolog-1 (HES-1) leads to up-regulation of neural helix-loop-helix factors, premature neurogenesis, and severe neural tube defects. Genes Dev. 1995, 9, 3136–3148. [Google Scholar] [CrossRef]
  39. Lo, L.; Dormand, E.; Greenwood, A.; Anderson, D.J. Comparison of the generic neuronal differentiation and neuron subtype specification functions of mammalian achaete-scute and atonal homologs in cultured neural progenitor cells. Development 2002, 129, 1553–1567. [Google Scholar] [CrossRef] [PubMed]
  40. Snapyan, M.; Lemasson, M.; Brill, M.S.; Blais, M.; Massouh, M.; Ninkovic, J.; Gravel, C.; Berthod, F.; Gotz, M.; Barker, P.A.; et al. Vasculature guides migrating neuronal precursors in the adult mammalian forebrain via brain-derived neurotrophic factor signaling. J. Neurosci. 2009, 29, 4172–4188. [Google Scholar] [CrossRef] [PubMed]
  41. Ylikoski, J.; Pirvola, U.; Moshnyakov, M.; Palgi, J.; Arumae, U.; Saarma, M. Expression patterns of neurotrophin and their receptor mRNAs in the rat inner ear. Hear. Res. 1993, 65, 69–78. [Google Scholar] [CrossRef]
  42. Majdzadeh, N.; Wang, L.; Morrison, B.E.; Bassel-Duby, R.; Olson, E.N.; D’Mello, S.R. HDAC4 inhibits cell-cycle progression and protects neurons from cell death. Dev. Neurobiol. 2008, 68, 1076–1092. [Google Scholar] [CrossRef] [PubMed]
  43. Copray, S.; Balasubramaniyan, V.; Levenga, J.; de Bruijn, J.; Liem, R.; Boddeke, E. Olig2 overexpression induces the in vitro differentiation of neural stem cells into mature oligodendrocytes. Stem. Cells 2006, 24, 1001–1010. [Google Scholar] [CrossRef]
  44. Fujimoto, I.; Hasegawa, K.; Fujiwara, K.; Yamada, M.; Yoshikawa, K. Necdin controls EGFR signaling linked to astrocyte differentiation in primary cortical progenitor cells. Cell Signal 2016, 28, 94–107. [Google Scholar] [CrossRef] [PubMed]
  45. Tang, C.; Wang, M.; Wang, P.; Wang, L.; Wu, Q.; Guo, W. Neural Stem Cells Behave as a Functional Niche for the Maturation of Newborn Neurons through the Secretion of PTN. Neuron 2019, 101, 32–44.e6. [Google Scholar] [CrossRef] [PubMed]
  46. Zhang, R.; Xue, Y.Y.; Lu, S.D.; Wang, Y.; Zhang, L.M.; Huang, Y.L.; Signore, A.P.; Chen, J.; Sun, F.Y. Bcl-2 enhances neurogenesis and inhibits apoptosis of newborn neurons in adult rat brain following a transient middle cerebral artery occlusion. Neurobiol. Dis. 2006, 24, 345–356. [Google Scholar] [CrossRef]
  47. Lopez-Bendito, G.; Flames, N.; Ma, L.; Fouquet, C.; Di Meglio, T.; Chedotal, A.; Tessier-Lavigne, M.; Marin, O. Robo1 and Robo2 cooperate to control the guidance of major axonal tracts in the mammalian forebrain. J. Neurosci. 2007, 27, 3395–3407. [Google Scholar] [CrossRef]
  48. Yuan, W.; Zhou, L.; Chen, J.H.; Wu, J.Y.; Rao, Y.; Ornitz, D.M. The mouse SLIT family: Secreted ligands for ROBO expressed in patterns that suggest a role in morphogenesis and axon guidance. Dev. Biol. 1999, 212, 290–306. [Google Scholar] [CrossRef]
  49. Erkman, L.; McEvilly, R.J.; Luo, L.; Ryan, A.K.; Hooshmand, F.; O’Connell, S.M.; Keithley, E.M.; Rapaport, D.H.; Ryan, A.F.; Rosenfeld, M.G. Role of transcription factors Brn-3.1 and Brn-3.2 in auditory and visual system development. Nature 1996, 381, 603–606. [Google Scholar] [CrossRef]
  50. Ohtsuka, T.; Ishibashi, M.; Gradwohl, G.; Nakanishi, S.; Guillemot, F.; Kageyama, R. Hes1 and Hes5 as notch effectors in mammalian neuronal differentiation. EMBO J. 1999, 18, 2196–2207. [Google Scholar] [CrossRef]
  51. Castella, P.; Sawai, S.; Nakao, K.; Wagner, J.A.; Caudy, M. HES-1 repression of differentiation and proliferation in PC12 cells: Role for the helix 3-helix 4 domain in transcription repression. Mol. Cell Biol. 2000, 20, 6170–6183. [Google Scholar] [CrossRef]
  52. Ng, T.; Ryu, J.R.; Sohn, J.H.; Tan, T.; Song, H.; Ming, G.L.; Goh, E.L. Class 3 semaphorin mediates dendrite growth in adult newborn neurons through Cdk5/FAK pathway. PLoS ONE 2013, 8, e65572. [Google Scholar] [CrossRef]
  53. Sahlgren, C.M.; Mikhailov, A.; Vaittinen, S.; Pallari, H.M.; Kalimo, H.; Pant, H.C.; Eriksson, J.E. Cdk5 regulates the organization of Nestin and its association with p35. Mol. Cell Biol. 2003, 23, 5090–5106. [Google Scholar] [CrossRef]
  54. Uchida, T.; Ishiguro, K.; Ohnuma, J.; Takamatsu, M.; Yonekura, S.; Imahori, K. Precursor of cdk5 activator, the 23 kDa subunit of tau protein kinase II: Its sequence and developmental change in brain. FEBS Lett. 1994, 355, 35–40. [Google Scholar] [CrossRef]
  55. Armenteros, T.; Andreu, Z.; Hortiguela, R.; Lie, D.C.; Mira, H. BMP and WNT signalling cooperate through LEF1 in the neuronal specification of adult hippocampal neural stem and progenitor cells. Sci. Rep. 2018, 8, 9241. [Google Scholar] [CrossRef] [PubMed]
  56. Hiramoto, T.; Kanda, Y.; Satoh, Y.; Takishima, K.; Watanabe, Y. Dopamine D2 receptor stimulation promotes the proliferation of neural progenitor cells in adult mouse hippocampus. Neuroreport 2007, 18, 659–664. [Google Scholar] [CrossRef]
  57. Paez-Gonzalez, P.; Asrican, B.; Rodriguez, E.; Kuo, C.T. Identification of distinct ChAT(+) neurons and activity-dependent control of postnatal SVZ neurogenesis. Nat. Neurosci. 2014, 17, 934–942. [Google Scholar] [CrossRef] [PubMed]
  58. Xue, T.; Wei, L.; Zha, D.J.; Qiao, L.; Lu, L.J.; Chen, F.Q.; Qiu, J.H. Exposure to acoustic stimuli promotes the development and differentiation of neural stem cells from the cochlear nuclei through the clusterin pathway. Int. J. Mol. Med. 2015, 35, 637–644. [Google Scholar] [CrossRef] [PubMed]
  59. Code, R.A.; Carr, C.E. Choline acetyltransferase-immunoreactive cochlear efferent neurons in the chick auditory brainstem. J. Comp. Neurol. 1994, 340, 161–173. [Google Scholar] [CrossRef]
  60. Howell, D.M.; Morgan, W.J.; Jarjour, A.A.; Spirou, G.A.; Berrebi, A.S.; Kennedy, T.E.; Mathers, P.H. Molecular guidance cues necessary for axon pathfinding from the ventral cochlear nucleus. J. Comp. Neurol. 2007, 504, 533–549. [Google Scholar] [CrossRef]
  61. Reynolds, B.A.; Rietze, R.L. Neural stem cells and neurospheres—Re-evaluating the relationship. Nat. Methods 2005, 2, 333–336. [Google Scholar] [CrossRef] [PubMed]
  62. Rao, M.S.; Hattiangady, B.; Shetty, A.K. The window and mechanisms of major age-related decline in the production of new neurons within the dentate gyrus of the hippocampus. Aging Cell 2006, 5, 545–558. [Google Scholar] [CrossRef]
  63. Kuhn, H.G.; Dickinson-Anson, H.; Gage, F.H. Neurogenesis in the dentate gyrus of the adult rat: Age-related decrease of neuronal progenitor proliferation. J. Neurosci. 1996, 16, 2027–2033. [Google Scholar] [CrossRef] [PubMed]
  64. Shetty, G.A.; Hattiangady, B.; Shetty, A.K. Neural stem cell- and neurogenesis-related gene expression profiles in the young and aged dentate gyrus. Age 2013, 35, 2165–2176. [Google Scholar] [CrossRef] [PubMed]
  65. Costa, M.R.; Wen, G.; Lepier, A.; Schroeder, T.; Gotz, M. Par-complex proteins promote proliferative progenitor divisions in the developing mouse cerebral cortex. Development 2008, 135, 11–22. [Google Scholar] [CrossRef]
  66. Houlihan, S.L.; Lanctot, A.A.; Guo, Y.; Feng, Y. Upregulation of neurovascular communication through filamin abrogation promotes ectopic periventricular neurogenesis. eLife 2016, 5, e17823. [Google Scholar] [CrossRef]
  67. Lu, H.; Song, X.; Wang, F.; Wang, G.; Wu, Y.; Wang, Q.; Wang, Y.; Yang, G.Y.; Zhang, Z. Hyperexpressed Netrin-1 Promoted Neural Stem Cells Migration in Mice after Focal Cerebral Ischemia. Front. Cell Neurosci. 2016, 10, 223. [Google Scholar] [CrossRef]
  68. Hu, Z.; Wei, D.; Johansson, C.B.; Holmstrom, N.; Duan, M.; Frisen, J.; Ulfendahl, M. Survival and neural differentiation of adult neural stem cells transplanted into the mature inner ear. Exp. Cell Res. 2005, 302, 40–47. [Google Scholar] [CrossRef]
  69. Nakashima, K.; Yanagisawa, M.; Arakawa, H.; Taga, T. Astrocyte differentiation mediated by LIF in cooperation with BMP2. FEBS Lett. 1999, 457, 43–46. [Google Scholar] [CrossRef]
  70. Yanagisawa, M.; Takizawa, T.; Ochiai, W.; Uemura, A.; Nakashima, K.; Taga, T. Fate alteration of neuroepithelial cells from neurogenesis to astrocytogenesis by bone morphogenetic proteins. Neurosci. Res. 2001, 41, 391–396. [Google Scholar] [CrossRef]
  71. Etheridge, S.L.; Ray, S.; Li, S.; Hamblet, N.S.; Lijam, N.; Tsang, M.; Greer, J.; Kardos, N.; Wang, J.; Sussman, D.J.; et al. Murine dishevelled 3 functions in redundant pathways with dishevelled 1 and 2 in normal cardiac outflow tract, cochlea, and neural tube development. PLoS Genet. 2008, 4, e1000259. [Google Scholar] [CrossRef]
  72. Buchman, J.J.; Tseng, H.C.; Zhou, Y.; Frank, C.L.; Xie, Z.; Tsai, L.H. Cdk5rap2 interacts with pericentrin to maintain the neural progenitor pool in the developing neocortex. Neuron 2010, 66, 386–402. [Google Scholar] [CrossRef] [PubMed]
  73. Zhou, Z.D.; Kumari, U.; Xiao, Z.C.; Tan, E.K. Notch as a molecular switch in neural stem cells. IUBMB Life 2010, 62, 618–623. [Google Scholar] [CrossRef] [PubMed]
  74. Parthasarathy, S.; Srivatsa, S.; Nityanandam, A.; Tarabykin, V. Ntf3 acts downstream of Sip1 in cortical postmitotic neurons to control progenitor cell fate through feedback signaling. Development 2014, 141, 3324–3330. [Google Scholar] [CrossRef] [PubMed]
  75. Fritzsch, B.; Farinas, I.; Reichardt, L.F. Lack of neurotrophin 3 causes losses of both classes of spiral ganglion neurons in the cochlea in a region-specific fashion. J. Neurosci. 1997, 17, 6213–6225. [Google Scholar] [CrossRef]
  76. Herold, S.; Jagasia, R.; Merz, K.; Wassmer, K.; Lie, D.C. CREB signalling regulates early survival, neuronal gene expression and morphological development in adult subventricular zone neurogenesis. Mol. Cell Neurosci. 2011, 46, 79–88. [Google Scholar] [CrossRef]
  77. Huang, Y.C.; Shih, H.Y.; Lin, S.J.; Chiu, C.C.; Ma, T.L.; Yeh, T.H.; Cheng, Y.C. The epigenetic factor Kmt2a/Mll1 regulates neural progenitor proliferation and neuronal and glial differentiation. Dev. Neurobiol. 2015, 75, 452–462. [Google Scholar] [CrossRef]
  78. Kandasamy, M.; Lehner, B.; Kraus, S.; Sander, P.R.; Marschallinger, J.; Rivera, F.J.; Trumbach, D.; Ueberham, U.; Reitsamer, H.A.; Strauss, O.; et al. TGF-beta signalling in the adult neurogenic niche promotes stem cell quiescence as well as generation of new neurons. J. Cell Mol. Med. 2014, 18, 1444–1459. [Google Scholar] [CrossRef] [PubMed]
  79. Shimizu, Y.; Kawasaki, T. Histone acetyltransferase EP300 regulates the proliferation and differentiation of neural stem cells during adult neurogenesis and regenerative neurogenesis in the zebrafish optic tectum. Neurosci. Lett. 2021, 756, 135978. [Google Scholar] [CrossRef]
  80. Ishikawa, E.; Ooboshi, H.; Kumai, Y.; Takada, J.; Nakamura, K.; Ago, T.; Sugimori, H.; Kamouchi, M.; Kitazono, T.; Ibayashi, S.; et al. Midkine gene transfer protects against focal brain ischemia and augments neurogenesis. J. Neurol. Sci. 2009, 285, 78–84. [Google Scholar] [CrossRef] [PubMed]
  81. Conover, J.C.; Doetsch, F.; Garcia-Verdugo, J.M.; Gale, N.W.; Yancopoulos, G.D.; Alvarez-Buylla, A. Disruption of Eph/ephrin signaling affects migration and proliferation in the adult subventricular zone. Nat. Neurosci. 2000, 3, 1091–1097. [Google Scholar] [CrossRef] [PubMed]
  82. Couillard-Despres, S.; Winner, B.; Schaubeck, S.; Aigner, R.; Vroemen, M.; Weidner, N.; Bogdahn, U.; Winkler, J.; Kuhn, H.G.; Aigner, L. Doublecortin expression levels in adult brain reflect neurogenesis. Eur. J. Neurosci. 2005, 21, 1–14. [Google Scholar] [CrossRef] [PubMed]
  83. Ferri, A.L.; Cavallaro, M.; Braida, D.; Di Cristofano, A.; Canta, A.; Vezzani, A.; Ottolenghi, S.; Pandolfi, P.P.; Sala, M.; DeBiasi, S.; et al. Sox2 deficiency causes neurodegeneration and impaired neurogenesis in the adult mouse brain. Development 2004, 131, 3805–3819. [Google Scholar] [CrossRef]
  84. Nishimura, K.; Weichert, R.M.; Liu, W.; Davis, R.L.; Dabdoub, A. Generation of induced neurons by direct reprogramming in the mammalian cochlea. Neuroscience 2014, 275, 125–135. [Google Scholar] [CrossRef] [PubMed]
  85. Sakurada, K.; Ohshima-Sakurada, M.; Palmer, T.D.; Gage, F.H. Nurr1, an orphan nuclear receptor, is a transcriptional activator of endogenous tyrosine hydroxylase in neural progenitor cells derived from the adult brain. Development 1999, 126, 4017–4026. [Google Scholar] [CrossRef]
  86. Schmid, R.S.; McGrath, B.; Berechid, B.E.; Boyles, B.; Marchionni, M.; Sestan, N.; Anton, E.S. Neuregulin 1-erbB2 signaling is required for the establishment of radial glia and their transformation into astrocytes in cerebral cortex. Proc. Natl. Acad. Sci. USA 2003, 100, 4251–4256. [Google Scholar] [CrossRef]
  87. Trigueiros-Cunha, N.; Renard, N.; Humbert, G.; Tavares, M.A.; Eybalin, M. Catecholamine-independent transient expression of tyrosine hydroxylase in primary auditory neurons is coincident with the onset of hearing in the rat cochlea. Eur. J. Neurosci. 2003, 18, 2653–2662. [Google Scholar] [CrossRef]
  88. Brown, J.P.; Couillard-Despres, S.; Cooper-Kuhn, C.M.; Winkler, J.; Aigner, L.; Kuhn, H.G. Transient expression of doublecortin during adult neurogenesis. J. Comp. Neurol. 2003, 467, 1–10. [Google Scholar] [CrossRef]
  89. Manohar, S.; Paolone, N.A.; Bleichfeld, M.; Hayes, S.H.; Salvi, R.J.; Baizer, J.S. Expression of doublecortin, a neuronal migration protein, in unipolar brush cells of the vestibulocerebellum and dorsal cochlear nucleus of the adult rat. Neuroscience 2012, 202, 169–183. [Google Scholar] [CrossRef]
  90. Bunton-Stasyshyn, R.K.; Saccon, R.A.; Fratta, P.; Fisher, E.M. SOD1 Function and Its Implications for Amyotrophic Lateral Sclerosis Pathology: New and Renascent Themes. Neuroscientist 2015, 21, 519–529. [Google Scholar] [CrossRef]
  91. Guizzetti, M.; Costa, P.; Peters, J.; Costa, L.G. Acetylcholine as a mitogen: Muscarinic receptor-mediated proliferation of rat astrocytes and human astrocytoma cells. Eur. J. Pharmacol. 1996, 297, 265–273. [Google Scholar] [CrossRef]
  92. Tanie, Y.; Tanabe, N.; Kuboyama, T.; Tohda, C. Extracellular Neuroleukin Enhances Neuroleukin Secretion From Astrocytes and Promotes Axonal Growth in vitro and in vivo. Front. Pharmacol. 2018, 9, 1228. [Google Scholar] [CrossRef]
  93. Gross, R.E.; Mehler, M.F.; Mabie, P.C.; Zang, Z.; Santschi, L.; Kessler, J.A. Bone morphogenetic proteins promote astroglial lineage commitment by mammalian subventricular zone progenitor cells. Neuron 1996, 17, 595–606. [Google Scholar] [CrossRef]
  94. Dasgupta, B.; Gutmann, D.H. Neurofibromin regulates neural stem cell proliferation, survival, and astroglial differentiation in vitro and in vivo. J. Neurosci. 2005, 25, 5584–5594. [Google Scholar] [CrossRef]
  95. Takouda, J.; Katada, S.; Imamura, T.; Sanosaka, T.; Nakashima, K. SoxE group transcription factor Sox8 promotes astrocytic differentiation of neural stem/precursor cells downstream of Nfia. Pharmacol. Res. Perspect. 2021, 9, e00749. [Google Scholar] [CrossRef]
  96. Rickmann, M.; Wolff, J.R. S100 protein expression in subpopulations of neurons of rat brain. Neuroscience 1995, 67, 977–991. [Google Scholar] [CrossRef] [PubMed]
  97. Tramontina, F.; Conte, S.; Goncalves, D.; Gottfried, C.; Portela, L.V.; Vinade, L.; Salbego, C.; Goncalves, C.A. Developmental changes in S100B content in brain tissue, cerebrospinal fluid, and astrocyte cultures of rats. Cell Mol. Neurobiol. 2002, 22, 373–378. [Google Scholar] [CrossRef] [PubMed]
  98. El-Husseini, A.E.; Schnell, E.; Chetkovich, D.M.; Nicoll, R.A.; Bredt, D.S. PSD-95 involvement in maturation of excitatory synapses. Science 2000, 290, 1364–1368. [Google Scholar] [CrossRef]
  99. Rohrbough, J.; Kent, K.S.; Broadie, K.; Weiss, J.B. Jelly Belly trans-synaptic signaling to anaplastic lymphoma kinase regulates neurotransmission strength and synapse architecture. Dev. Neurobiol. 2013, 73, 189–208. [Google Scholar] [CrossRef] [PubMed]
  100. Adachi, M.; Lin, P.Y.; Pranav, H.; Monteggia, L.M. Postnatal Loss of Mef2c Results in Dissociation of Effects on Synapse Number and Learning and Memory. Biol. Psychiatry 2016, 80, 140–148. [Google Scholar] [CrossRef] [PubMed]
  101. Euteneuer, S.; Yang, K.H.; Chavez, E.; Leichtle, A.; Loers, G.; Olshansky, A.; Pak, K.; Schachner, M.; Ryan, A.F. Glial cell line-derived neurotrophic factor (GDNF) induces neuritogenesis in the cochlear spiral ganglion via neural cell adhesion molecule (NCAM). Mol. Cell Neurosci. 2013, 54, 30–43. [Google Scholar] [CrossRef]
  102. Park, S.; Hong, Y.W. Transcriptional regulation of artemin is related to neurite outgrowth and actin polymerization in mature DRG neurons. Neurosci. Lett. 2006, 404, 61–66. [Google Scholar] [CrossRef] [PubMed]
  103. Teng, F.Y.; Tang, B.L. Cell autonomous function of Nogo and reticulons: The emerging story at the endoplasmic reticulum. J. Cell Physiol. 2008, 216, 303–308. [Google Scholar] [CrossRef] [PubMed]
  104. Hoe, H.S.; Magill, L.A.; Guenette, S.; Fu, Z.; Vicini, S.; Rebeck, G.W. FE65 interaction with the ApoE receptor ApoEr2. J. Biol. Chem. 2006, 281, 24521–24530. [Google Scholar] [CrossRef] [PubMed]
  105. Soldano, A.; Hassan, B.A. Beyond pathology: APP, brain development and Alzheimer’s disease. Curr. Opin. Neurobiol. 2014, 27, 61–67. [Google Scholar] [CrossRef]
  106. Xie, W.; Stribley, J.A.; Chatonnet, A.; Wilder, P.J.; Rizzino, A.; McComb, R.D.; Taylor, P.; Hinrichs, S.H.; Lockridge, O. Postnatal developmental delay and supersensitivity to organophosphate in gene-targeted mice lacking acetylcholinesterase. J. Pharmacol. Exp. Ther. 2000, 293, 896–902. [Google Scholar]
  107. Masuho, I.; Mototani, Y.; Sahara, Y.; Asami, J.; Nakamura, S.; Kozasa, T.; Inoue, T. Dynamic expression patterns of G protein-regulated inducer of neurite outgrowth 1 (GRIN1) and its colocalization with Galphao implicate significant roles of Galphao-GRIN1 signaling in nervous system. Dev. Dyn. 2008, 237, 2415–2429. [Google Scholar] [CrossRef]
  108. Kamegai, M.; Niijima, K.; Kunishita, T.; Nishizawa, M.; Ogawa, M.; Araki, M.; Ueki, A.; Konishi, Y.; Tabira, T. Interleukin 3 as a trophic factor for central cholinergic neurons in vitro and in vivo. Neuron 1990, 4, 429–436. [Google Scholar] [CrossRef]
  109. Safaei, R.; Fischer, I. Regulation of microtubule-associated protein 2 (MAP2) mRNA expression during rat brain development. J. Mol. Neurosci. 1989, 1, 189–198. [Google Scholar] [CrossRef]
  110. Hines, T.J.; Gao, X.; Sahu, S.; Lange, M.M.; Turner, J.R.; Twiss, J.L.; Smith, D.S. An Essential Postdevelopmental Role for Lis1 in Mice. eNeuro 2018, 5. [Google Scholar] [CrossRef]
  111. Sakurai, T. The role of NrCAM in neural development and disorders--beyond a simple glue in the brain. Mol. Cell Neurosci. 2012, 49, 351–363. [Google Scholar] [CrossRef] [PubMed]
  112. Markus, E.J.; Petit, T.L. Neocortical synaptogenesis, aging, and behavior: Lifespan development in the motor-sensory system of the rat. Exp. Neurol. 1987, 96, 262–278. [Google Scholar] [CrossRef] [PubMed]
  113. Stover, T.; Gong, T.L.; Cho, Y.; Altschuler, R.A.; Lomax, M.I. Expression of the GDNF family members and their receptors in the mature rat cochlea. Brain Res. Mol. Brain Res. 2000, 76, 25–35. [Google Scholar] [CrossRef] [PubMed]
  114. Choi-Lundberg, D.L.; Bohn, M.C. Ontogeny and distribution of glial cell line-derived neurotrophic factor (GDNF) mRNA in rat. Brain Res. Dev. Brain Res. 1995, 85, 80–88. [Google Scholar] [CrossRef] [PubMed]
  115. Raab, S.; Beck, H.; Gaumann, A.; Yuce, A.; Gerber, H.P.; Plate, K.; Hammes, H.P.; Ferrara, N.; Breier, G. Impaired brain angiogenesis and neuronal apoptosis induced by conditional homozygous inactivation of vascular endothelial growth factor. Thromb. Haemost. 2004, 91, 595–605. [Google Scholar] [CrossRef] [PubMed]
  116. Yamamoto, M.; Guo, D.H.; Hernandez, C.M.; Stranahan, A.M. Endothelial Adora2a Activation Promotes Blood-Brain Barrier Breakdown and Cognitive Impairment in Mice with Diet-Induced Insulin Resistance. J. Neurosci. 2019, 39, 4179–4192. [Google Scholar] [CrossRef]
  117. Ye, X.; Smallwood, P.; Nathans, J. Expression of the Norrie disease gene (Ndp) in developing and adult mouse eye, ear, and brain. Gene Expr. Patterns 2011, 11, 151–155. [Google Scholar] [CrossRef]
  118. Ogunshola, O.O.; Stewart, W.B.; Mihalcik, V.; Solli, T.; Madri, J.A.; Ment, L.R. Neuronal VEGF expression correlates with angiogenesis in postnatal developing rat brain. Brain Res. Dev. Brain Res. 2000, 119, 139–153. [Google Scholar] [CrossRef]
  119. Lu, F.; Wei, L.; Yang, C.; Qiao, Y.; Liu, Y.S.; Chen, X.D.; Wang, J.; Shi, Z.H.; Chen, F.Q.; Zha, D.J.; et al. Nrg1/ErbB2 regulates differentiation and apoptosis of neural stem cells in the cochlear nucleus through PI3K/Akt pathway. Neurosci. Lett. 2021, 751, 135803. [Google Scholar] [CrossRef]
  120. Gu, F.; Hata, R.; Ma, Y.J.; Tanaka, J.; Mitsuda, N.; Kumon, Y.; Hanakawa, Y.; Hashimoto, K.; Nakajima, K.; Sakanaka, M. Suppression of Stat3 promotes neurogenesis in cultured neural stem cells. J. Neurosci. Res. 2005, 81, 163–171. [Google Scholar] [CrossRef]
  121. Chen, L.; Melendez, J.; Campbell, K.; Kuan, C.Y.; Zheng, Y. Rac1 deficiency in the forebrain results in neural progenitor reduction and microcephaly. Dev. Biol. 2009, 325, 162–170. [Google Scholar] [CrossRef]
  122. Sumiyama, K.; Washio-Watanabe, K.; Saitou, N.; Hayakawa, T.; Ueda, S. Class III POU genes: Generation of homopolymeric amino acid repeats under GC pressure in mammals. J. Mol. Evol. 1996, 43, 170–178. [Google Scholar] [CrossRef]
  123. Lim, D.A.; Tramontin, A.D.; Trevejo, J.M.; Herrera, D.G.; Garcia-Verdugo, J.M.; Alvarez-Buylla, A. Noggin antagonizes BMP signaling to create a niche for adult neurogenesis. Neuron 2000, 28, 713–726. [Google Scholar] [CrossRef]
  124. Balordi, F.; Fishell, G. Hedgehog signaling in the subventricular zone is required for both the maintenance of stem cells and the migration of newborn neurons. J. Neurosci. 2007, 27, 5936–5947. [Google Scholar] [CrossRef]
  125. Kawaguchi, D.; Furutachi, S.; Kawai, H.; Hozumi, K.; Gotoh, Y. Dll1 maintains quiescence of adult neural stem cells and segregates asymmetrically during mitosis. Nat. Commun. 2013, 4, 1880. [Google Scholar] [CrossRef] [PubMed]
  126. Smith, L.K.; He, Y.; Park, J.S.; Bieri, G.; Snethlage, C.E.; Lin, K.; Gontier, G.; Wabl, R.; Plambeck, K.E.; Udeochu, J.; et al. beta2-microglobulin is a systemic pro-aging factor that impairs cognitive function and neurogenesis. Nat. Med. 2015, 21, 932–937. [Google Scholar] [CrossRef] [PubMed]
  127. Xu, J.C.; Xiao, M.F.; Jakovcevski, I.; Sivukhina, E.; Hargus, G.; Cui, Y.F.; Irintchev, A.; Schachner, M.; Bernreuther, C. The extracellular matrix glycoprotein tenascin-R regulates neurogenesis during development and in the adult dentate gyrus of mice. J. Cell Sci. 2014, 127, 641–652. [Google Scholar] [CrossRef]
  128. Lin, Y.; He, M.; Zeng, X.; Sheng, X.; Wang, S.; Cui, F. 4-hydroxybenzophenone exposure inhibits mouse hippocampal neural stem cell proliferation in vitro by upregulating Cxcl1. Toxicol. In Vitro 2022, 82, 105367. [Google Scholar] [CrossRef]
  129. Silva, V.A.; Gomide, V.C.; Chadi, G. Fibroblast growth factor-2 immunoreactivity is present in the central and peripheral auditory pathways of adult rats. J. Morphol. 2005, 265, 141–151. [Google Scholar] [CrossRef]
  130. Ray, J.; Gage, F.H. Differential properties of adult rat and mouse brain-derived neural stem/progenitor cells. Mol. Cell Neurosci. 2006, 31, 560–573. [Google Scholar] [CrossRef] [PubMed]
  131. Tureyen, K.; Vemuganti, R.; Bowen, K.K.; Sailor, K.A.; Dempsey, R.J. EGF and FGF-2 infusion increases post-ischemic neural progenitor cell proliferation in the adult rat brain. Neurosurgery 2005, 57, 1254–1263. [Google Scholar] [CrossRef] [PubMed]
  132. Sun, Y.; Hu, J.; Zhou, L.; Pollard, S.M.; Smith, A. Interplay between FGF2 and BMP controls the self-renewal, dormancy and differentiation of rat neural stem cells. J. Cell Sci. 2011, 124, 1867–1877. [Google Scholar] [CrossRef] [PubMed]
  133. Kiyota, T.; Ingraham, K.L.; Jacobsen, M.T.; Xiong, H.; Ikezu, T. FGF2 gene transfer restores hippocampal functions in mouse models of Alzheimer’s disease and has therapeutic implications for neurocognitive disorders. Proc. Natl. Acad. Sci. USA 2011, 108, E1339–E1348. [Google Scholar] [CrossRef] [PubMed]
Figure 1. Before (p6), during (p12), and after (p24) the hearing onset, mRNA abundance of neurogenic factors in CN occurs in characteristic clusters. mRNA abundance profiles of neurogenic factors in CN are presented in a heat map with a hierarchical cluster-based dendrogram. Age groups are noted in the bottom margin, and gene names are in the heat map’s right margin. Complete linkage and Pearson correlation generated the dendrogram on the left margin. Mean fold changes from three independent experiments of all RT-qPCR analyzed mRNAs were used as input data. The Z-score visualizes the magnitude of gene expression with zero (white) equaling average expression over all samples and +/−1 indicating standard deviations from the mean. Blue fields indicate a lower mRNA abundance and orange fields indicate a higher one.
Life 13 01858 g001
Figure 2. The volcano plot highlights significant and relevant differences in mRNA abundance of neurogenic factors in CN between p6 and p12. The y-axis displays the negative logarithm with base 10 of the p-value. The p-value is indicated with the dashed line at the corresponding position. Points below this dashed line have p > 0.05 and are shown in gray. The x-axis represents the logarithm with base 2 of fold change between p6 and p12. Points above the p-value are black if the fold change is less than two or more than 0.5 (log2 = 1/−1). Points that have a p-value < 0.0.5 and a fold change greater than two or less than 0.5 are shown in orange (higher mRNA abundance at p12 than at p6) and blue (lower mRNA abundance at p12 than at p6), respectively.
Life 13 01858 g002
Figure 3. The volcano plot highlights significant and relevant differences in mRNA abundance of neurogenic factors in CN between p12 and p24. The y-axis displays the negative logarithm with base 10 of the p-value. The p-value is indicated with the dashed line at the corresponding position. Points below this dashed line have p > 0.05 and are shown in gray. The x-axis represents the logarithm with base 2 of fold change between p12 and p24. Points above the p-value are shown in black if the fold change is less than two or more than 0.5 (log2 = 1/−1). Points that have a p-value < 0.0.5 and a fold change greater than two or less than 0.5 are shown in orange (higher mRNA abundance at p24 than at p12) and blue (lower mRNA abundance at p24 than at p12), respectively.
Life 13 01858 g003
Figure 4. Volcano plot highlights significant and relevant differences in mRNA abundance of neurogenic factors in CN between p6 and p24. The y-axis displays the negative logarithm with base 10 of the p-value. The p-value is indicated with the dashed line at the corresponding position. Points below this dashed line have p > 0.05 and are shown in gray. The x-axis represents the logarithm with base 2 of fold change between p6 and p24. Points above the p-value are shown in black if the fold change is less than two or more than 0.5 (log2 = 1/−1). Points that have a p-value < 0.0.5 and a fold change greater than two or less than 0.5 are shown in orange (higher mRNA abundance at p24 than at p6) and blue (lower mRNA abundance at p24 than at p6), respectively.
Life 13 01858 g004
Figure 5. Highlighting genes critical for CN neurogenesis with a significant and relevant increase in mRNA abundance. Genes were chosen, whose relative expression changes were significant (p < 0.05) and had a fold change > 4 between two age groups. The critical neurogenic factors (a) Gdnf, (c) Fgf2 and (d) S100b display significantly higher amounts of mRNA at p24 than at p6 and p12, whereas (b) Chat has the highest mRNA abundance at p12. The bar charts represent the mean with standard deviation (SD); each point represents one of the three independently performed experiments, n = 3; asterisks indicate the significance level, * p < 0.05, *** p < 0.001.
Life 13 01858 g005
Figure 6. Highlighting genes critical for CN neurogenesis with a significant and relevant decrease in mRNA abundance. Genes were chosen, whose relative expression changes were significant (p < 0.05) and had a fold change < 0.25 between two age groups. The critical neurogenic factors (a) Dcx, (b) Neurog1, (c) Neurog2, (d) Neurod1, (e) Th, and (f) Ntf3 have the highest mRNA abundance at the hearing onset (p6) with significant decrease at p12 and p24. The bar charts represent the mean with standard deviation (SD); each point represents one of the three independently performed experiments, n = 3; asterisks indicate the significance level, * p < 0.05, *** p < 0.001.
Life 13 01858 g006
Figure 7. Graphical representation of CN neurogenesis at the mRNA level in relation to auditory capacity. At each age group, there is a characteristic mRNA abundance of neurogenetic factors. Prior to hearing onset (p6), genes that influence proliferation, proneural fate, and neural stem cell niche maintenance experience an increase in mRNA level. Around hearing onset (p12), activation of the neural stem cell niche and progenitor cells occurs at the mRNA level. After hearing onset (p24), increased mRNA abundance was detected in genes related to gliagenesis, synaptogenesis, and angiogenesis. ). Figure was created with BioRender.com (accessed on 30th August 2023).
Life 13 01858 g007
Disclaimer/Publisher’s Note: The statements, opinions and data contained in all publications are solely those of the individual author(s) and contributor(s) and not of MDPI and/or the editor(s). MDPI and/or the editor(s) disclaim responsibility for any injury to people or property resulting from any ideas, methods, instructions or products referred to in the content.

