Figure 1.
(A) Microscope view of the macular area with an epiretinal membrane (ERM) after staining with Doubledyne blue. (The white box indicates the field-of-view of the OCT scan, the green circle within the white box represents the effective working distance and green and blue lines within the green circle show the vertical and horizontal scan planes). (B) The intraoperative optical coherence tomography (i-OCT) horizontal (green arrow) and vertical (blue arrow) scan showing the presence of the ERM and the macular thickening. (C) Microscope view of the macular area during peeling. The ERM is elevated. (The white box indicates the field-of-view of the OCT scan, the green circle within the white box represents the effective working distance and green and blue lines within the green circle show the vertical and horizontal scan planes). (D) The i-OCT B horizontal (green arrow) and vertical (blue arrow) scan during peeling. The ERM is elevated, and the macular profile is preserved where the ERM has been peeled.

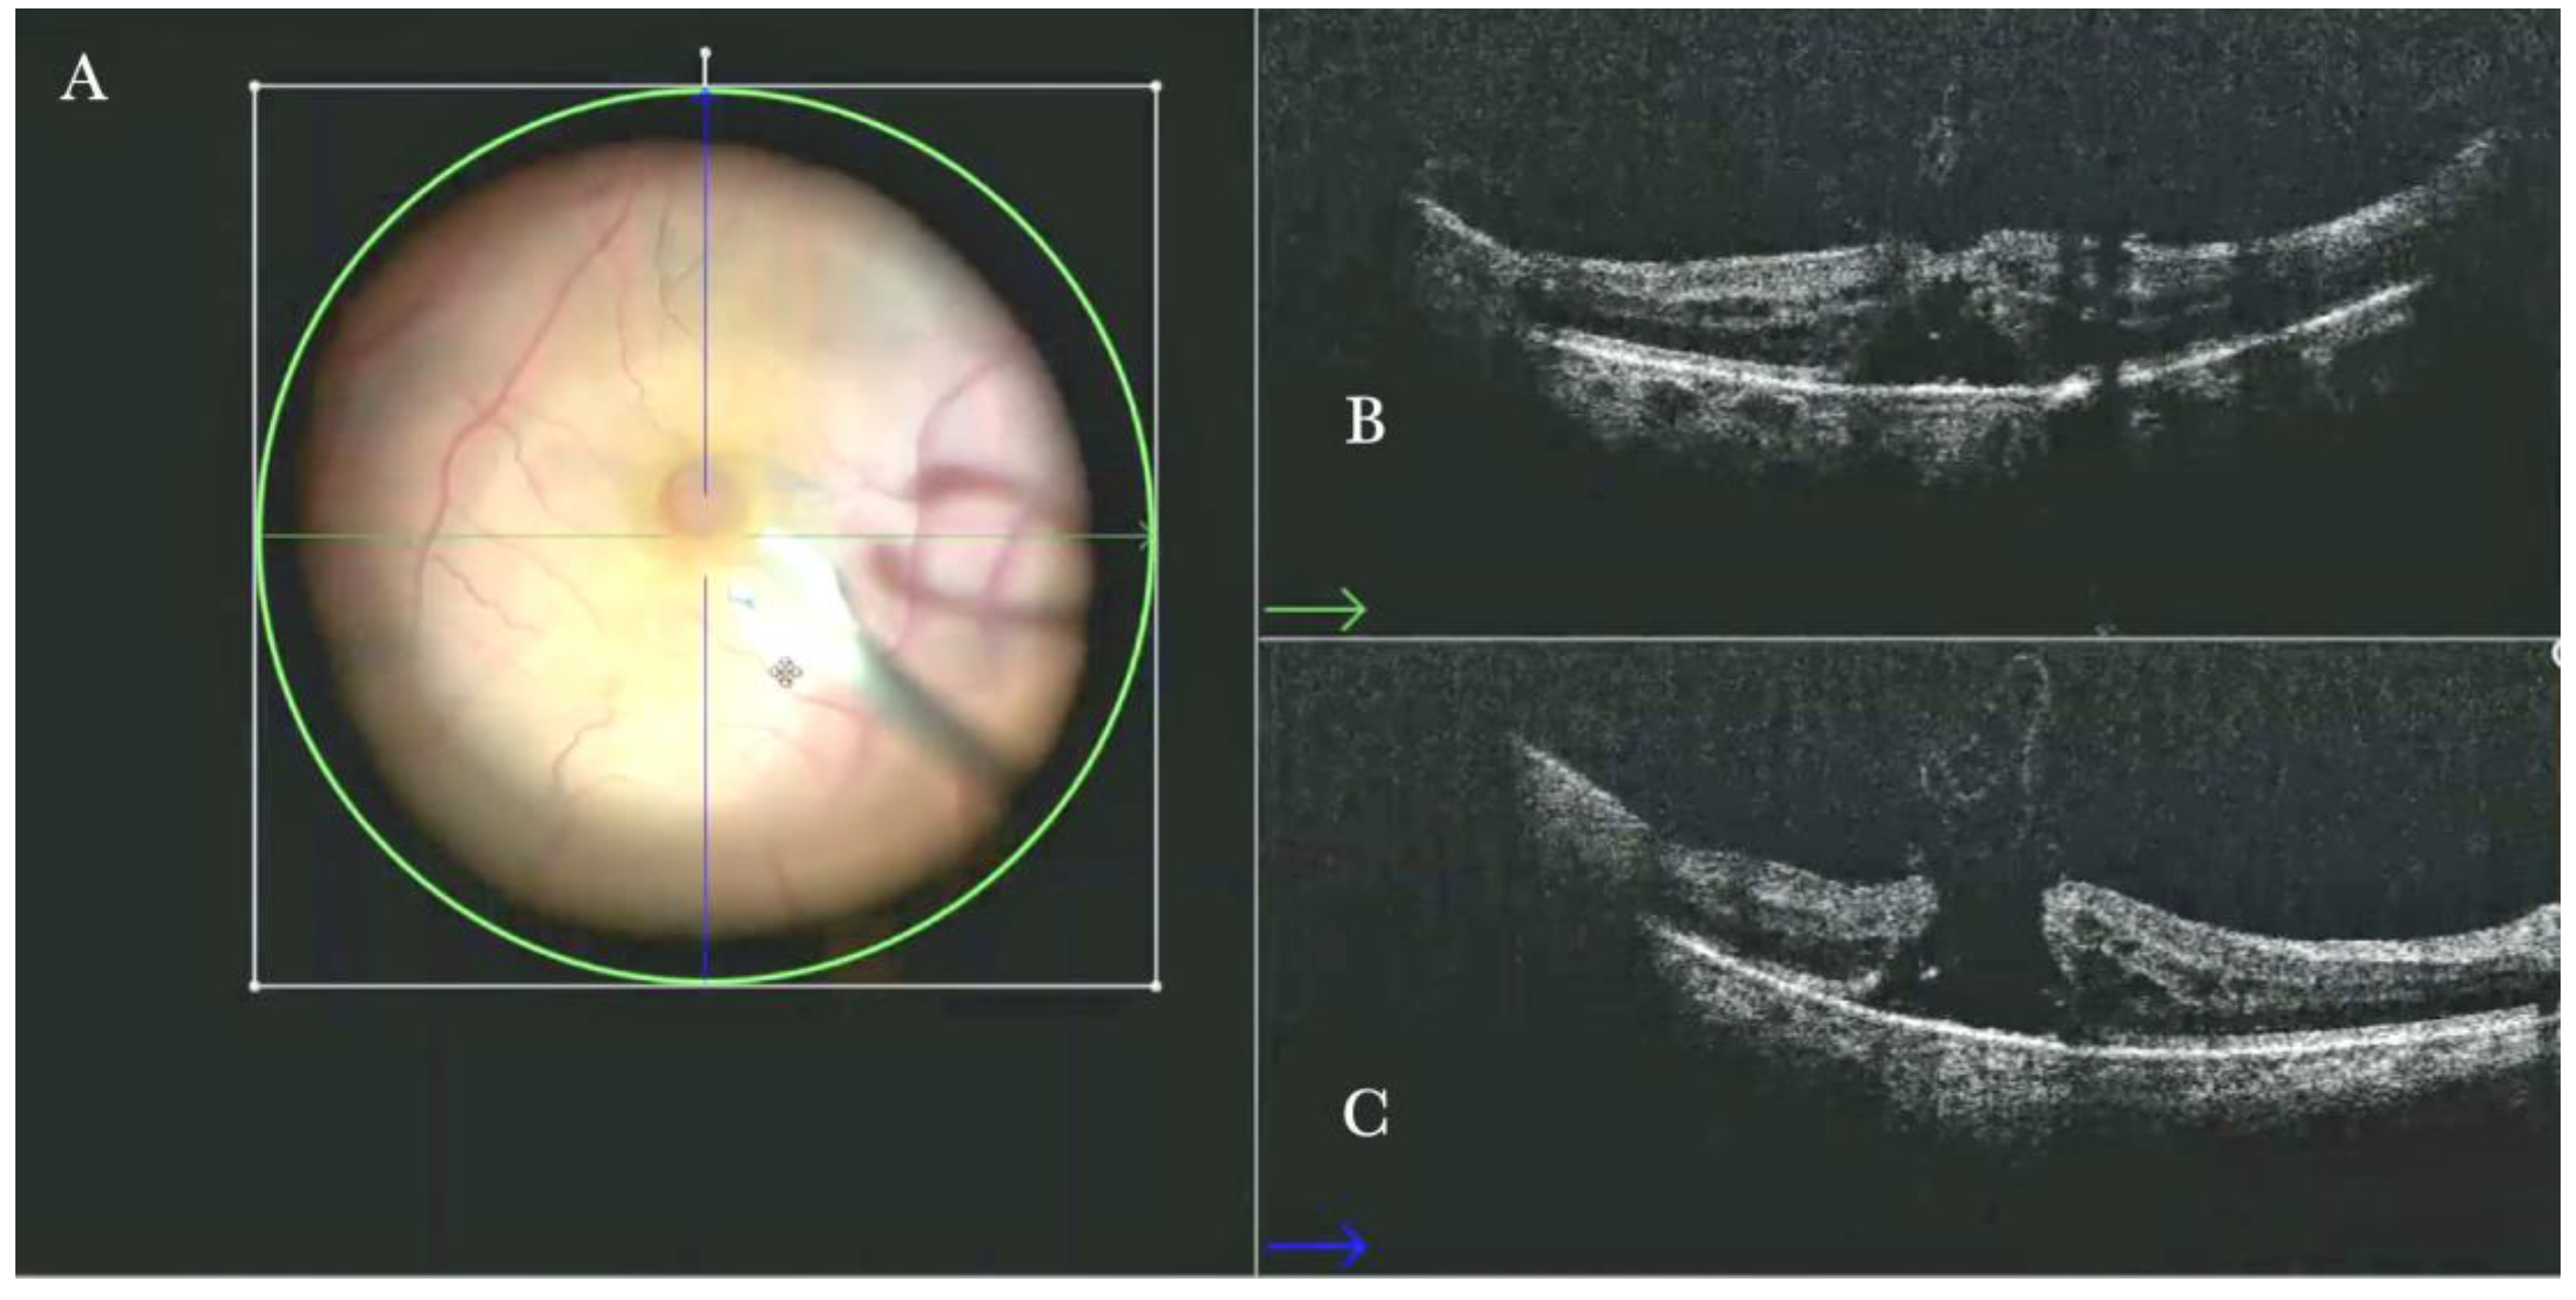
Figure 2.
(A) Microscope view of the macular area with a macular hole after staining and peeling of the inner limiting membrane (ILM) with the creation of an ILM flap. (The white box indicates the field-of-view of the OCT scan, the green circle within the white box represents the effective working distance and green and blue lines within the green circle show the vertical and horizontal scan planes). (B) Intraoperative optical coherence tomography (i-OCT) B horizontal (green arrow) scan showing the ILM flap over the hole. (C) i-OCT B vertical (blue arrow) scan showing the ILM flap over the hole.
Figure 3.
(A) Microscope view of the macular area with an epiretinal membrane (ERM) after staining with Doubledyne blue. (The white box indicates the field-of-view of the OCT scan, the green circle within the white box represents the effective working distance and green and blue lines within the green circle show the vertical and horizontal scan planes). (B) Intraoperative optical coherence tomography (i-OCT) B horizontal (green arrow) scan showing the macular profile after peeling and restaining with Doubledyne blue. (C) i-OCT B vertical (blue arrow) scan showing the macular profile after peeling and restaining with Doubledyne blue.
Figure 4.
(A) Microscope view of the macular area during peeling of an epiretinal membrane (ERM). The ERM is elevated. (The white box indicates the field-of-view of the OCT scan, the green circle within the white box represents the effective working distance and green and blue lines within the green circle show the vertical and horizontal scan planes). (B) Intraoperative optical coherence tomography (i-OCT) B horizontal (green arrow) scan during peeling. The ERM is elevated, and the macular profile is preserved where the ERM has been peeled. (C) i-OCT B vertical (blue arrow) scan during peeling. The ERM is elevated. The inner limiting membrane (ILM) is stretched and elevated where the ERM is peeled. The i-OCT allowed us to see the double simultaneous peeling of ERM and ILM.
Figure 5.
(A). Microscope view of the macular area during peeling of an epiretinal membrane (ERM). An intraretinal hemorrhage is present. (The green box indicates the field-of-view of the OCT scan, the green and blue lines within the green box show the vertical and horizontal scan planes). (B) Intraoperative optical coherence tomography (i-OCT) B vertical scan showing that the retina is preserved under the hemorrhage. (Red empty circle).
Figure 6.
(A) Microscope view showing the macular area after autologous choroidal transplant. A full-thickness patch of the choroid has been transplanted from the peripheral area under the macula. A macular hole occurred. (The green box indicates the field-of-view of the OCT scan, the green and blue lines within the green box show the vertical and horizontal scan planes). (B) The intraoperative optical coherence tomography (i-OCT) B horizontal (green arrow) scan shows the retina attached over the choroidal patch. An autologous patch of the retina (white arrowhead) was transplanted into a macular hole. (C) The i-OCT B vertical (blue arrow) scan shows the retina attached over the choroidal patch. An autologous patch of the retina (white arrowhead) was transplanted into a macular hole.
Figure 7.
(A) Microscope view, and horizontal (green arrow) and vertical view, of a case of a macular hole where an inner limiting membrane (ILM) flap has been created in a case of myopic macular hole. (The white box indicates the field-of-view of the OCT scan, the green line within the green box shows the scan plane). (B) Same case, where viscoelastic stained with Doubledyne blue has been injected over the ILM flap to prevent dislocation. The intraoperative optical coherence tomography (i-OCT) shows that the ILM flap remains elevated. (The white box indicates the field-of-view of the OCT scan, the green line within the green box shows the horizontal scan plane). (C) Same description as in B with a B (green arrow) scan. (The white box indicates the field-of-view of the OCT scan, the green line within the green box shows the scan plane). (D) The viscoelastic material has been replaced by perfluorocarbon liquid (PFCL). The i-OCT scan shows that, under PFCL, the ILM flap is well allocated over and into the hole. (The white box indicates the field-of-view of the OCT scan, the green line within the green box shows the scan plane).

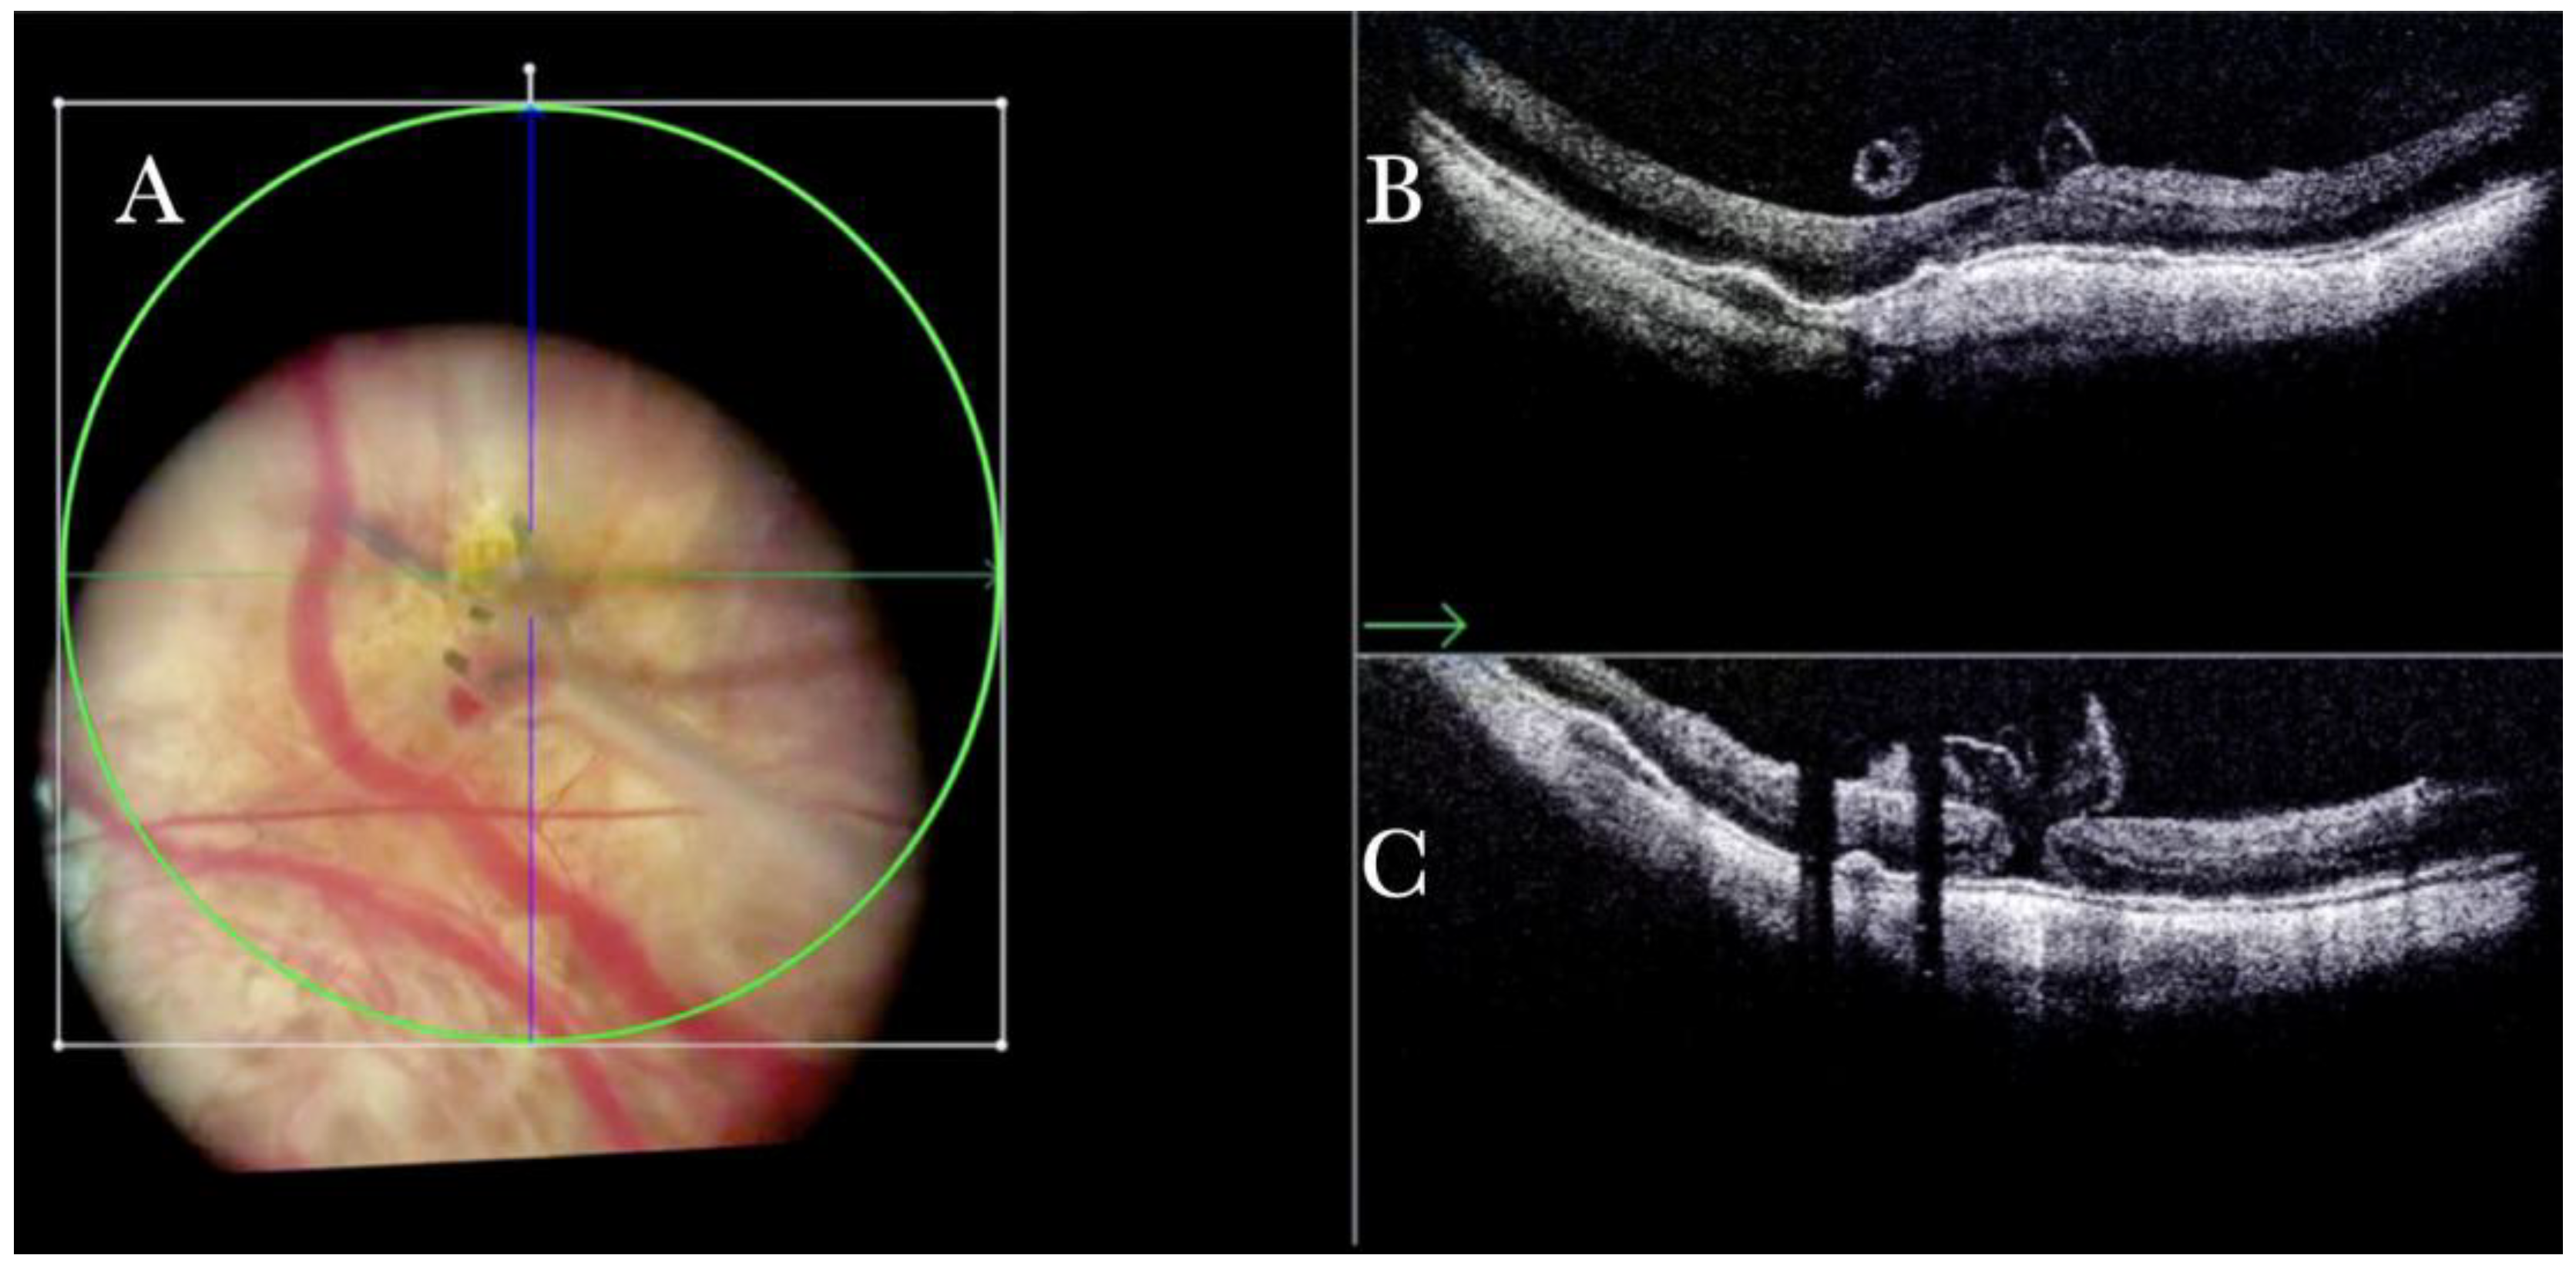
Figure 8.
(A) Microscope view of the macular area with a macular hole in case of high myopia after staining and peeling of the inner limiting membrane (ILM) with the creation of an ILM flap under fluid. The macular hole is very difficult to highlight due to low contrast in the choroid and confounding details from the choroidal vessels and microhemorrhages. (The white box indicates the field-of-view of the OCT scan, the green circle within the white box represents the effective working distance and green and blue lines within the green circle show the vertical and horizontal scan planes). (B) The intraoperative optical coherence tomography (i-OCT) B horizontal (green arrow) scan shows, very clearly, the ILM flap well-positioned over the hole. (C) i-OCT B vertical scan showing, very clearly, the ILM flap well-positioned over the hole.
Figure 9.
(A) Staining and peeling of the inner limiting membrane (ILM) with the creation of an ILM flap under air after fluid air exchange. The macular hole is very difficult to highlight due to low contrast in the choroid and confounding details from the choroidal vessels and microhemorrhages. (The white box indicates the field-of-view of the OCT scan, the green line within the green box shows the scan plane) (B) The intraoperative optical coherence tomography (i-OCT) B horizontal (green arrow) scan shows, very clearly, the ILM flap well-positioned over the hole under the air. (C) i-OCT B vertical (blue arrow) scan shows, very clearly, the ILM flap well-positioned over the hole under the air.
Figure 10.
(A) Microscope view of the macular area in case of myopic traction maculopathy in stage 3a (macular detachment and no macular hole) after implanting a macular buckle. The transillumination of a fiber optic inserted into the buckle allows us to identify the location of the buckle itself. (The green box indicates the field-of-view of the OCT scan, the green and blue lines within the green box show the vertical and horizontal scan planes). (B) The intraoperative optical coherence tomography (i-OCT) B horizontal (green arrow) scan shows, very clearly, the indentation of the macula from the scleral side due to the presence of a macular buckle. (C) The i-OCT B vertical (blue arrow) scan shows, very clearly, the indentation of the macula from the scleral side due to the presence of a macular buckle.
Figure 11.
(A) Microscope view of the macular area in case of myopic traction maculopathy in stage 4C (macular detachment with full-thickness macular hole (FTMH)) after implanting a macular buckle. The transillumination of a fiber optic inserted into the buckle allows us to guess the location of the buckle itself. The inner limiting membrane (ILM) flap is visibly stained blue. The FTMH is not visible. (The white box indicates the field-of-view of the OCT scan, the green line within the green box shows the scan plane) (B) The Intraoperative Optical coherence tomography (i-OCT) B horizontal (green arrow) and vertical scan shows very clearly the indentation of the macula from the scleral side due to the presence of a macular buckle. The white arrowhead shows the FTMH, which is not over the buckle. (C) Same view as in A after repositioning the macular buckle. (The white box indicates the field-of-view of the OCT scan, the green line within the green box shows the scan plane) (D) i-OCT B horizontal (green arrow) and vertical scan showing very clearly the indentation of the macula from the scleral side due to the presence of a macular buckle. The white arrow shows the FTMH, which is now well-positioned over the buckle.

Figure 12.
(A) Microscope view of the macular area in case of myopic traction maculopathy in stage 4C (macular detachment with full-thickness macular hole (FTMH)) after implanting a macular buckle and peeling the inner limiting membrane (ILM) creating an ILM flap. The transillumination of a fiber optic inserted into the buckle allows us to guess the location of the buckle itself. The FTMH is not visible under the air. (The green box indicates the field-of-view of the OCT scan, the green and blue lines within the green box show the vertical and horizontal scan planes). (B) The intraoperative optical coherence tomography (i-OCT) B horizontal (green arrow) scan shows, very clearly, the indentation of the macula from the scleral side due to the presence of a macular buckle. (C) The i-OCT B vertical scan shows, very clearly, the indentation of the macula. The white arrow shows the FTMH, which is now well-positioned over the buckle, and the presence of the ILM flap even under the air.
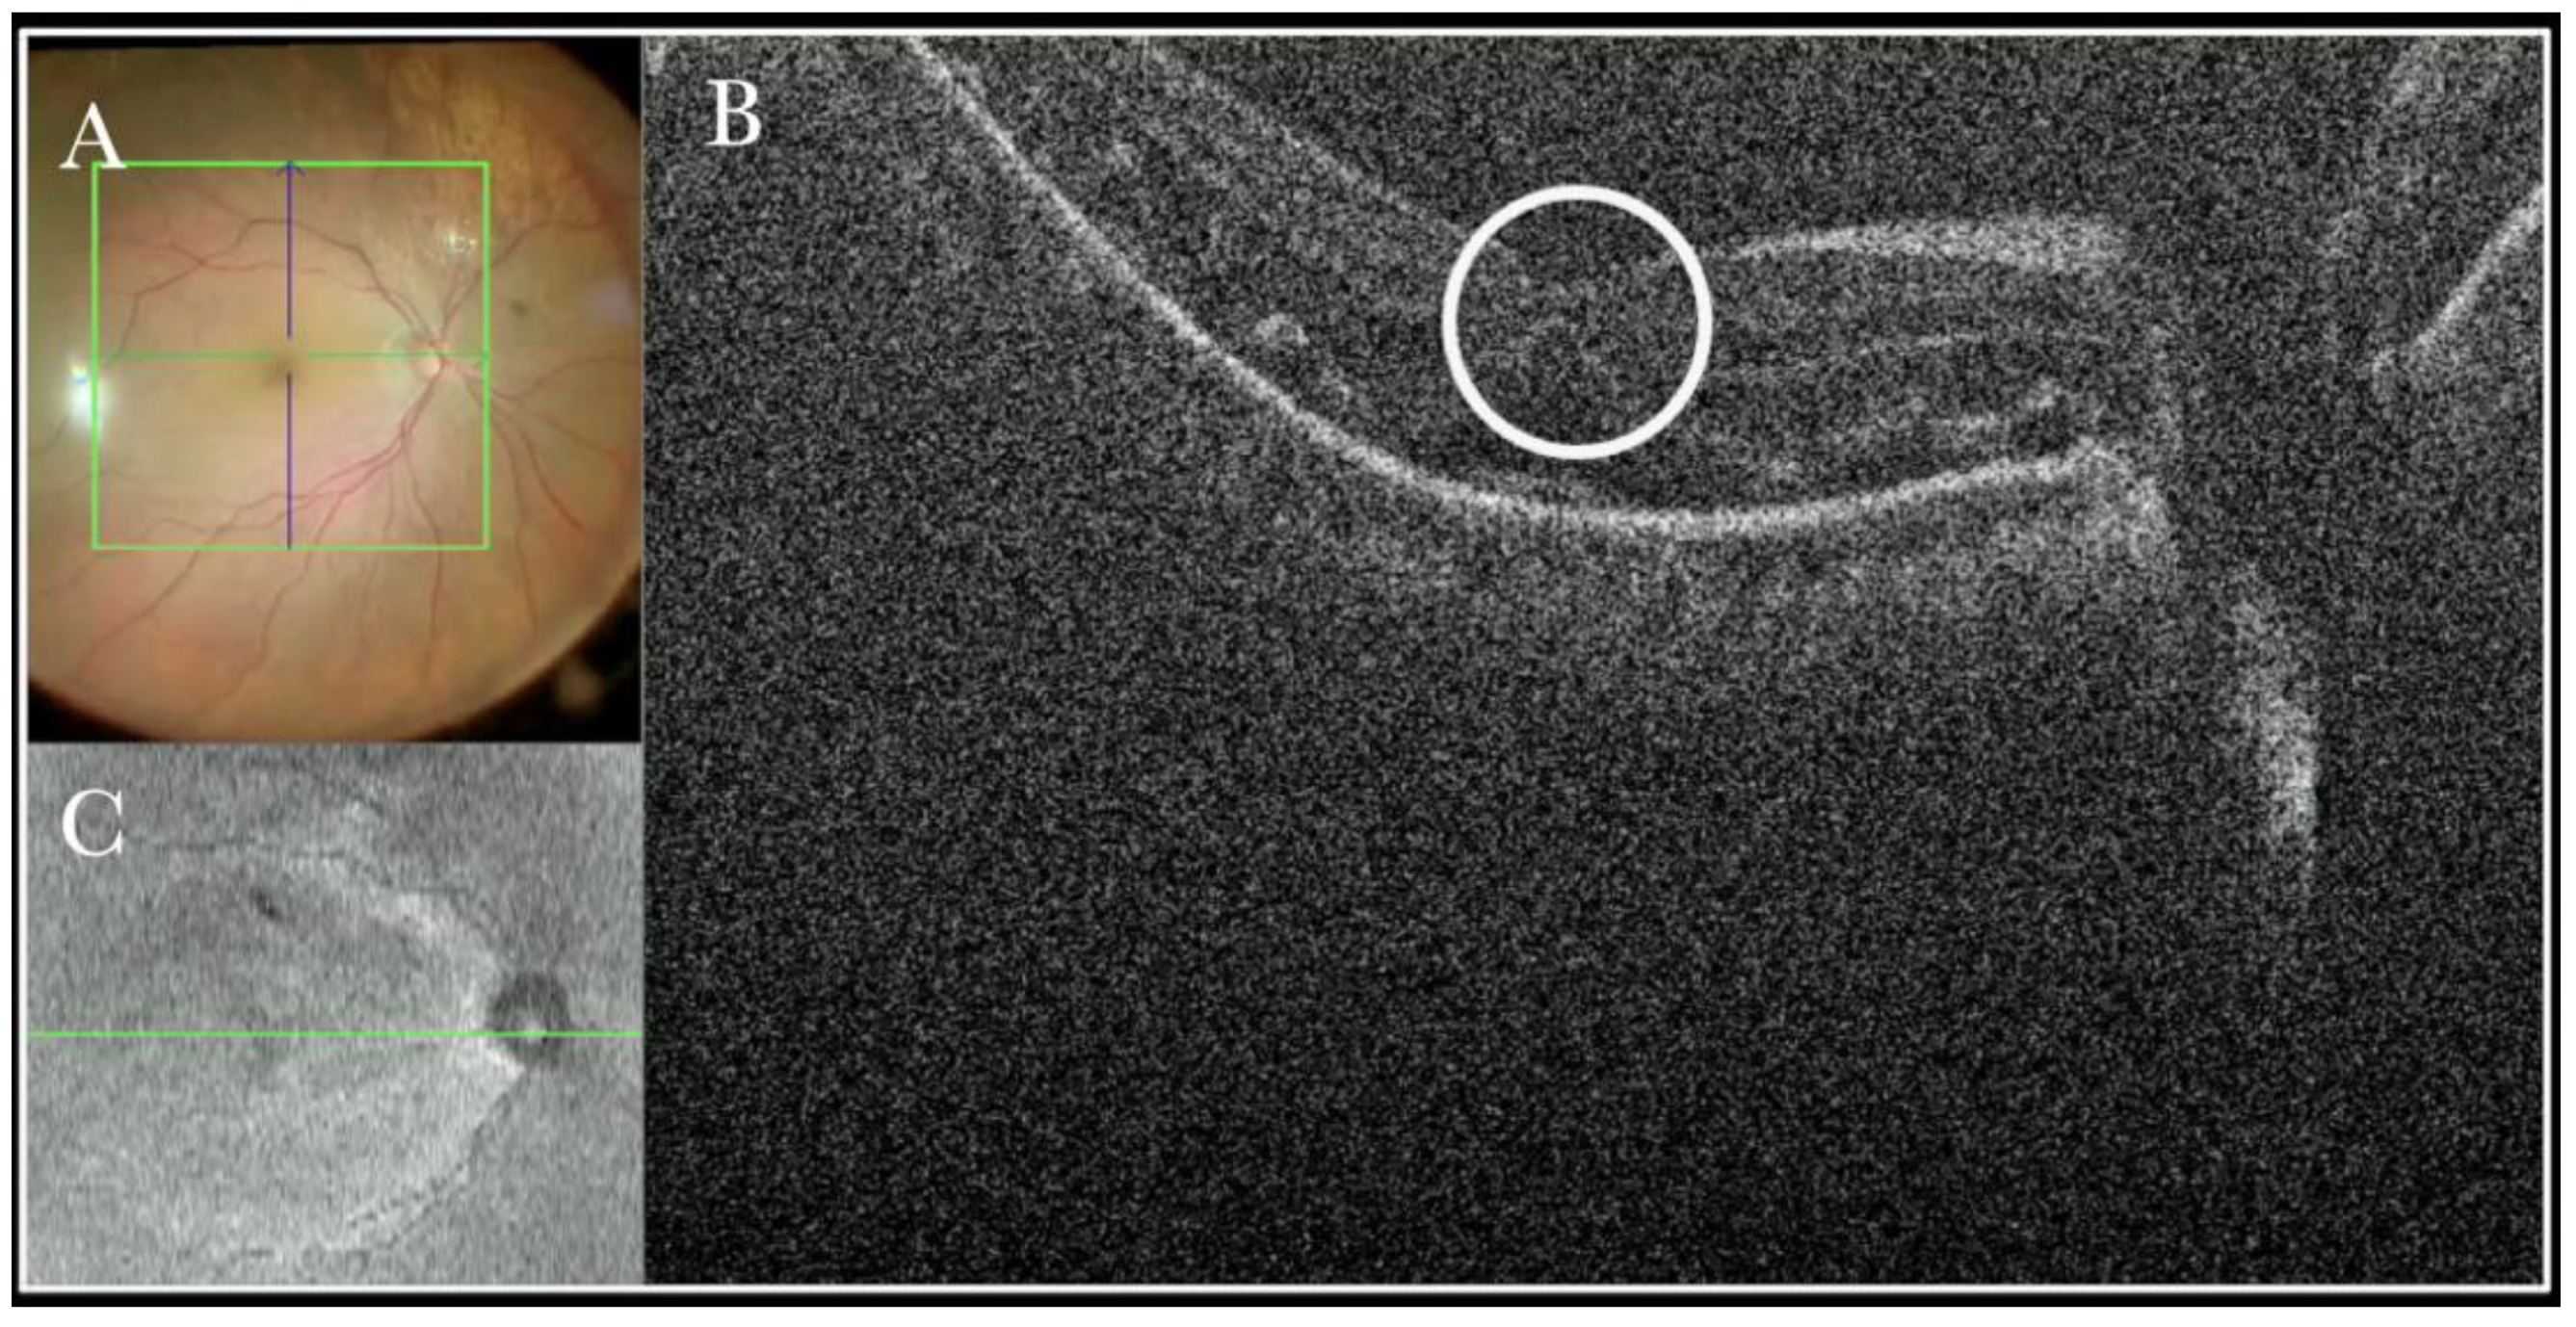
Figure 13.
(A) Microscope view of the macular area in a case of retinal detachment. The retina is flat under perfluorocarbon liquid (PFCL). The surgeon was considering at this point whether to perform a peeling of the inner limiting membrane (ILM) to prevent the formation of an epiretinal membrane (ERM). (The green box indicates the field-of-view of the OCT scan, the green and blue lines within the green box show the vertical and horizontal scan planes). (B) The intraoperative optical coherence tomography (i-OCT) B horizontal scan shows the thinning of the fovea and indicates the surgeon had a high risk of inducing a full-thickness macular hole (FTMH) if performing the ILM peeling. (White borders of circle) a decision not to peel was taken after looking at the i-OCT scan. (C) En-face view of the macular area in a case of retinal detachment. (The green line represents the scan plane).
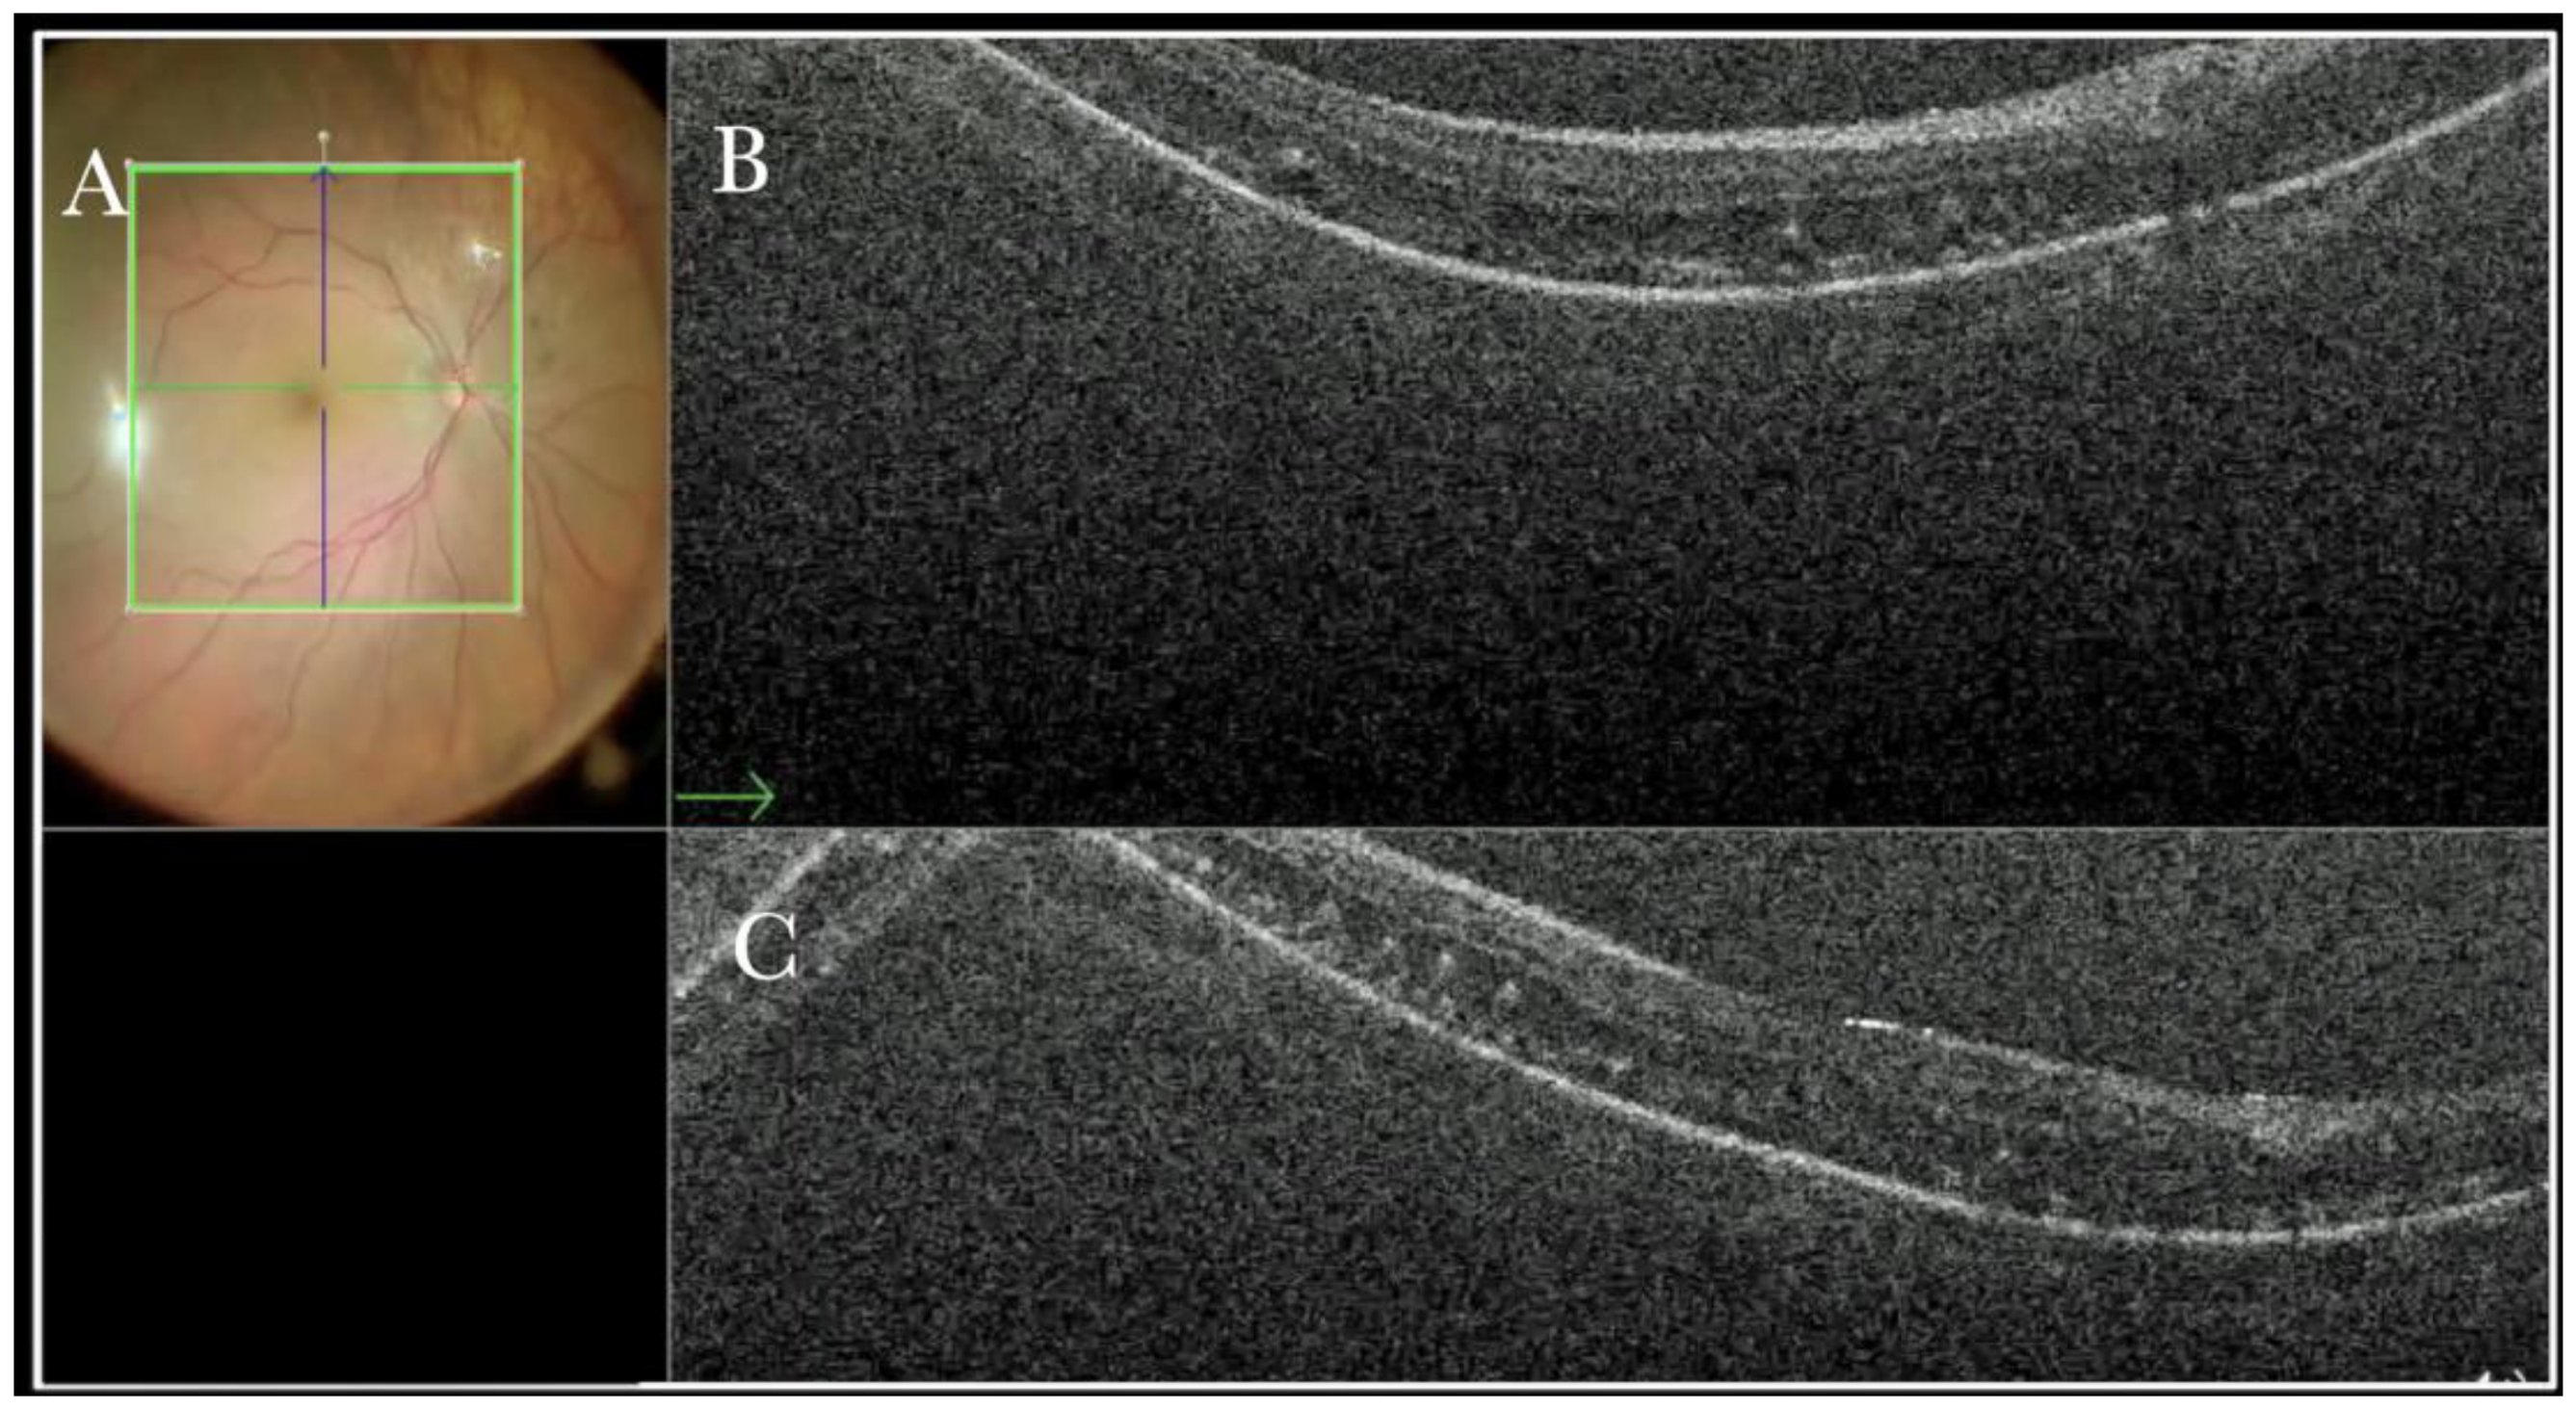
Figure 14.
(A) Microscope view of the macular area in a case of retinal detachment. The retina is flat under perfluorocarbon liquid (PFCL). (The green box indicates the field-of-view of the OCT scan, the green and blue lines within the green box show the vertical and horizontal scan planes). (B) The intraoperative optical coherence tomography (i-OCT) B horizontal (green arrow) scan shows that the retina is flat. The outer layers are slightly edematous and present microfolds. (C) i-OCT B vertical scan shows that the retina is flat. The outer layers are slightly edematous and present microfolds.
Figure 15.
Microscope view of the macular area in a case of retinal detachment associated with retinoschisis. This is the second operation for a relapse of retinal detachment. In the previous surgery, perfluorocarbon liquid (PFCL) was used. The surgeon was considering at this point whether point was (a) a cyst of a hole, (b) schisis or represented subretinal bands or PVR, or (c) indicated the presence of a subretinal PFCL bubble. It is very difficult to discriminate with the microscope view only.
Figure 16.
(
A) Microscope view of point (a) of
Figure 15. (The green box indicates the field-of-view of the OCT scan, the green and blue lines within the green box show the vertical and horizontal scan planes). (
B) Intraoperative optical coherence tomography (i-OCT) can show that, in the area of point (a), there is a hole close to a cyst.
Figure 17.
(
A) Microscope view of point (a) of
Figure 15. Microscope view of point (b) of
Figure 15. (The green box indicates the field-of-view of the OCT scan, the green and blue lines within the green box show the vertical and horizontal scan planes). (
B) The intraoperative optical coherence tomography (i-OCT) B horizontal (green) scan shows that, in the area of point (b), the suspect bands are areas of retinoschisis. (
C) The i-OCT vertical scan shows that, in the area of point (b), the suspect bands are areas of retinoschisis.
Figure 18.
(
A) Microscope view of point (c) of
Figure 15. (The green box indicates the field-of-view of the OCT scan, the green and blue lines within the green box show the vertical and horizontal scan planes). (
B) The intraoperative optical coherence tomography (i-OCT) horizontal (green arrow) scan shows that, in point (b), the suspect bubbles of perfluorocarbon liquid (PFCL) represent retinoschisis areas. (
C) The i-OCT vertical scan shows that, in point (b), the suspect bubbles of PFCL represent areas of retinoschisis.
Figure 19.
(A) Microscope view of a case of retinal detachment with proliferative vitreoretinopathy (PVR). The retina is stained with Doubledyne blue. However, it is not clear where the PVR membranes are located. (The green box indicates the field-of-view of the OCT scan, the green and blue lines within the green box show the vertical and horizontal scan planes). (B) The horizontal (green arrow) intraoperative optical coherence tomography (i-OCT) scan shows an area of retina thickening and wrinkling, indicating the presence of an epiretinal membrane (ERM). (C) The vertical i-OCT scan (thin blue arrow) shows an area of retina thickening and wrinkling, indicating the presence of an ERM (thick blue arrow).
Figure 20.
(A) Microscope view of the same case of retinal detachment with proliferative vitreoretinopathy (PVR). The retinotomy is analyzed. The surgeon needed to decide whether to peel the epiretinal membrane (ERM) at the edge of the retinotomy and elevate the retinotomy to lower the traction. It is not clear through the microscope how to proceed. (The green box indicates the field-of-view of the OCT scan, the green and blue lines within the green box show the vertical and horizontal scan planes). (B) The horizontal (green arrow) intraoperative optical coherence tomography (i-OCT) scan shows the retinotomy, indicating the presence of an ERM and squared edges. (C) The vertical (blue arrow) i-OCT scan shows the same area after peeling the ERM, elevating, and reattaching the retinotomy. The retinotomy is now flat and relaxed.
Figure 21.
(A) Microscope view of the macular area in a case of subfoveal perfluorocarbon liquid (PFCL). (B) The intraoperative optical coherence tomography (i-OCT) horizontal scan shows the detached macula with bubbles of PFCL enclosed into the external retina. (C) The i-OCT vertical scan shows the detached macula with bubbles of PFCL enclosed in the external retina.
Figure 22.
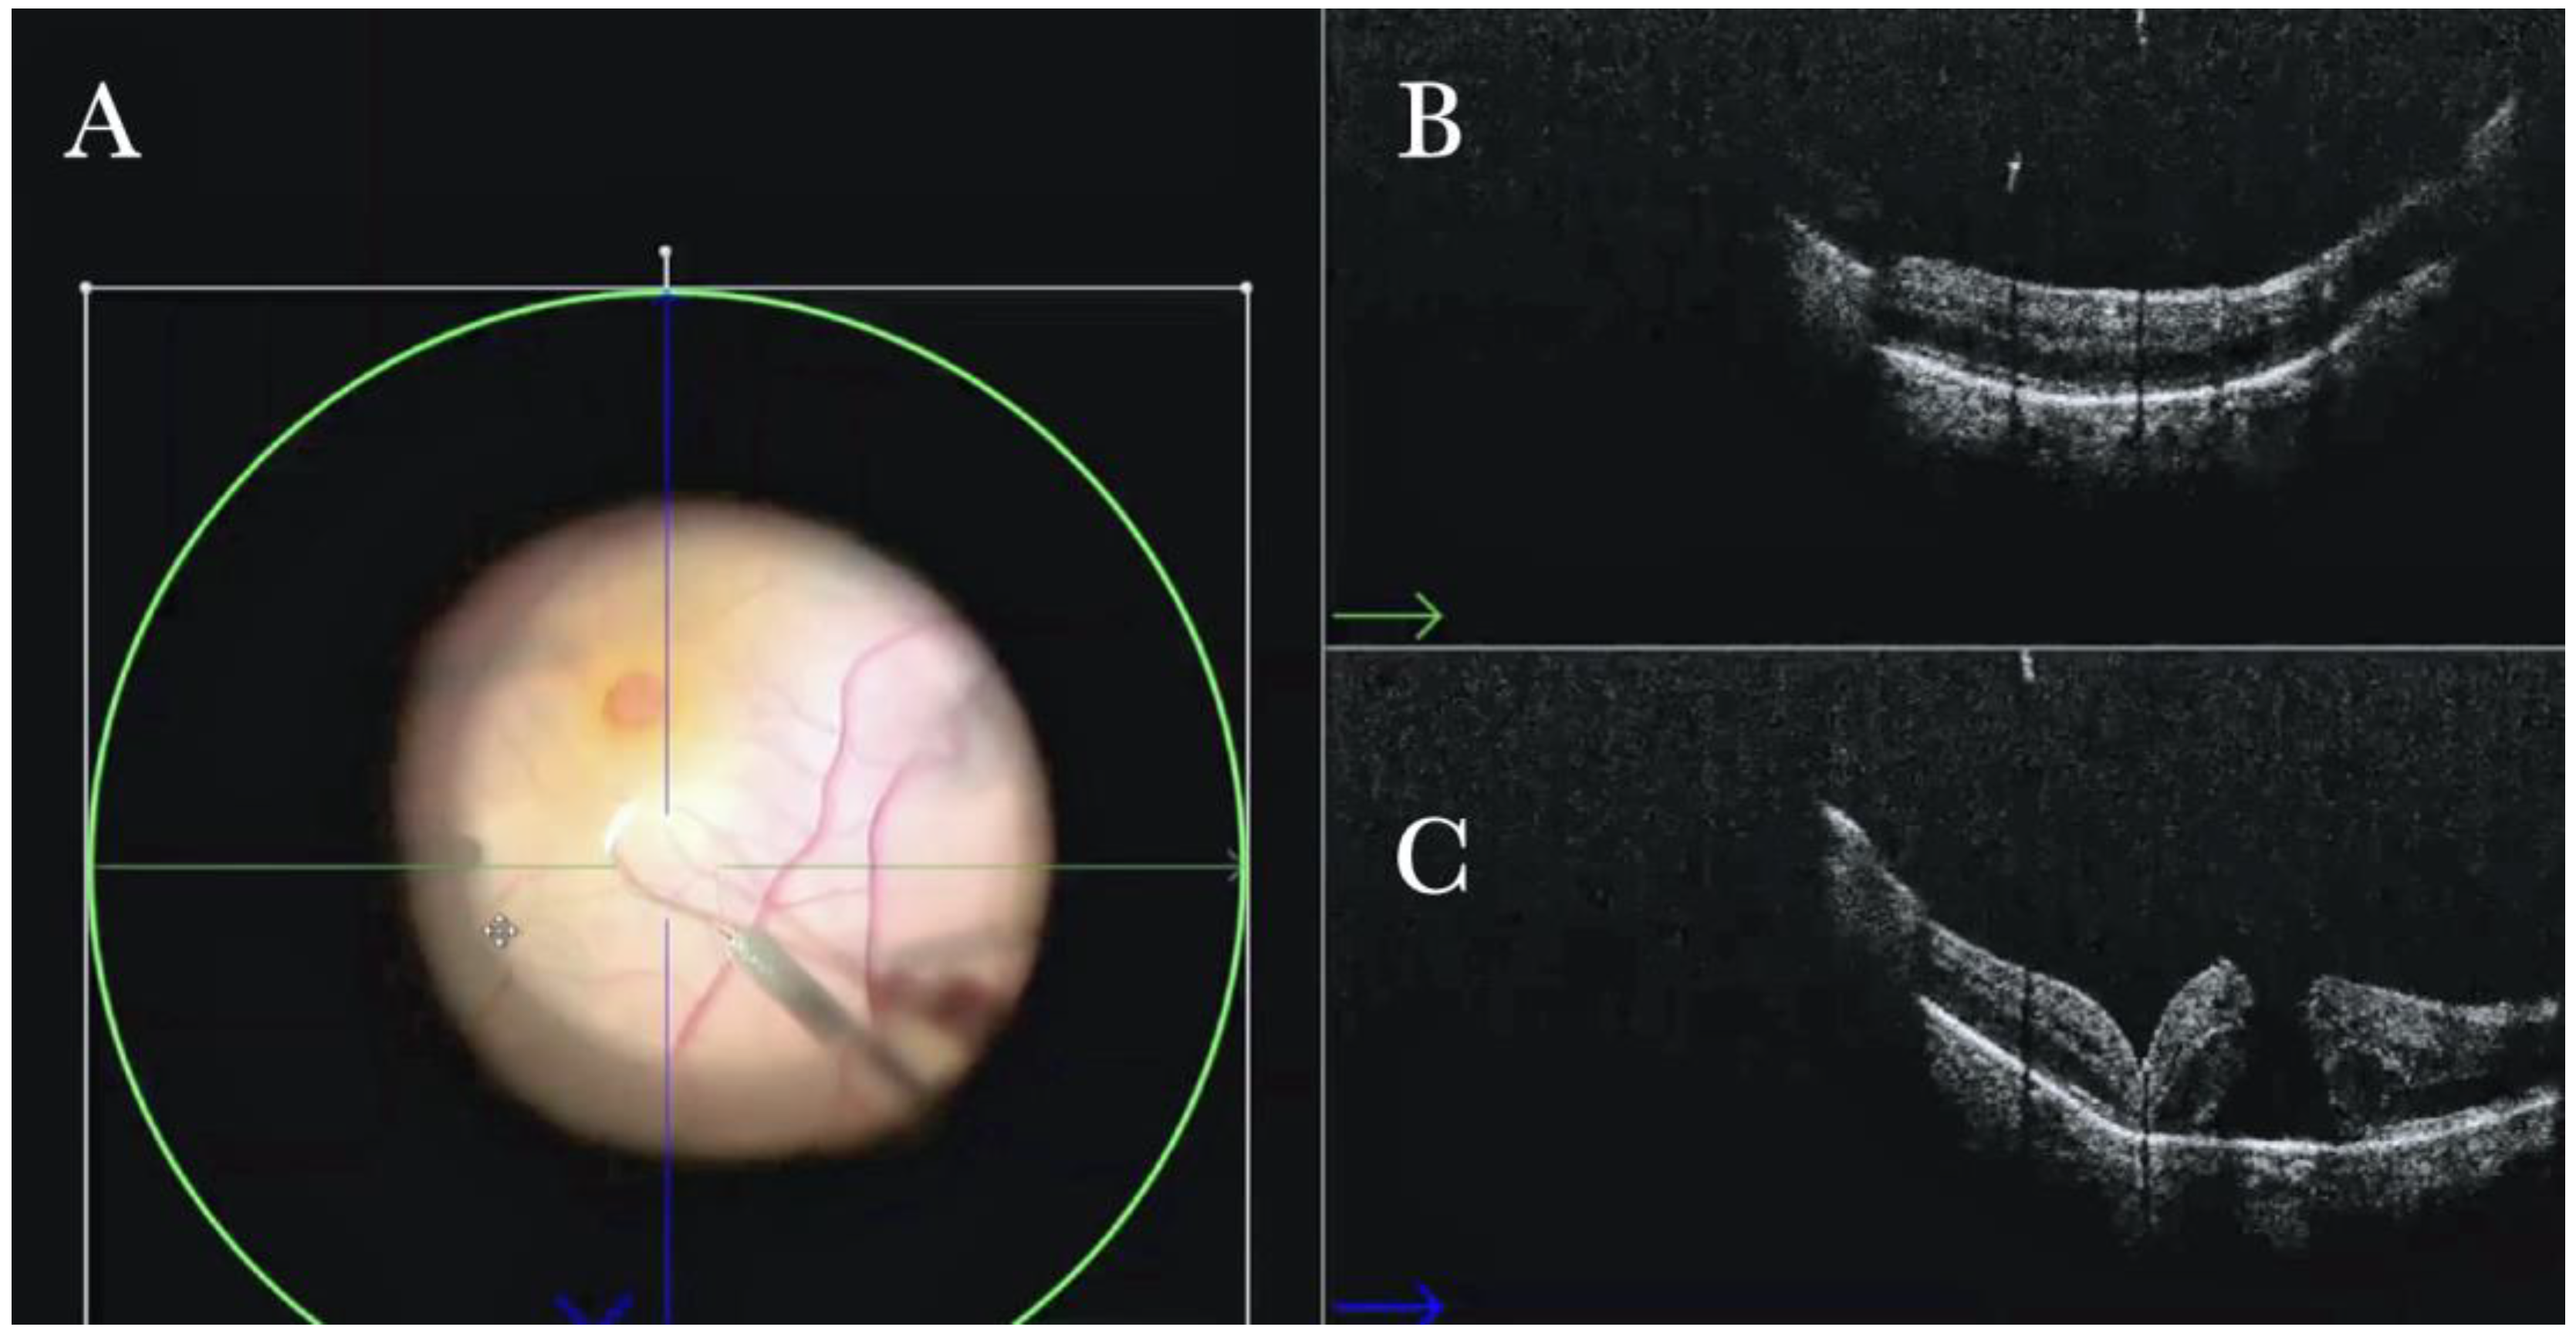
(A) Microscope view of the macular area in a case of autologous choroidal transplant. The surgeon is inducing a retinal detachment by injecting a balanced salt solution (BSS) through a 41-gauge needle into the macular area. (The green box indicates the field-of-view of the OCT scan, the green and blue lines within the green box show the vertical and horizontal scan planes). (B) The intraoperative optical coherence tomography (i-OCT) horizontal (green arrow) scan shows the detached macula. (C) The i-OCT vertical scan shows the detached macula with a full-thickness macular hole (FTMH) (white arrow) induced during the injection of BSS. The FTMH was not visible through the microscope and could be managed during surgery.
Figure 22.
(A) Microscope view of the macular area in a case of autologous choroidal transplant. The surgeon is inducing a retinal detachment by injecting a balanced salt solution (BSS) through a 41-gauge needle into the macular area. (The green box indicates the field-of-view of the OCT scan, the green and blue lines within the green box show the vertical and horizontal scan planes). (B) The intraoperative optical coherence tomography (i-OCT) horizontal (green arrow) scan shows the detached macula. (C) The i-OCT vertical scan shows the detached macula with a full-thickness macular hole (FTMH) (white arrow) induced during the injection of BSS. The FTMH was not visible through the microscope and could be managed during surgery.
Figure 23.
(A) Microscope view of the temporal retina that is detached and inverted onto the nasal side. A full-thickness patch of the choroid is visible over the macular area and covered by perfluorocarbon liquid (PFCL). (The green box indicates the field-of-view of the OCT scan, the green and blue lines within the green box show the vertical and horizontal scan planes). (B) The intraoperative optical coherence tomography (i-OCT) horizontal (green arrow) scan shows a choroidal patch with no retina on top and covered by PFCL, which is invisible with i-OCT. (C) The i-OCT vertical scan shows a choroidal patch with no retina on top and covered by PFCL, which is invisible with i-OCT.
Figure 24.
(
A) Microscope view of the macular area of the same case of autologous choroidal transplant shown in
Figure 23. The perfluorocarbon liquid (PFCL) has been moved from the subretinal space to the preretinal space, and the retina has been attached. A full-thickness patch of the choroid is visible in the macular area and covered by the retina. (The green box indicates the field-of-view of the OCT scan, the green and blue lines within the green box show the vertical and horizontal scan planes). (
B) The intraoperative optical coherence tomography (i-OCT) horizontal (green arrow) scan shows a choroidal patch with the retina on top. The retina appears well-attached. No PFCL bubbles are present under the retina. (
C) The i-OCT vertical scan shows a choroidal patch with the retina on top. The retina appears well-attached. No PFCL bubbles are present under the retina.
Figure 25.
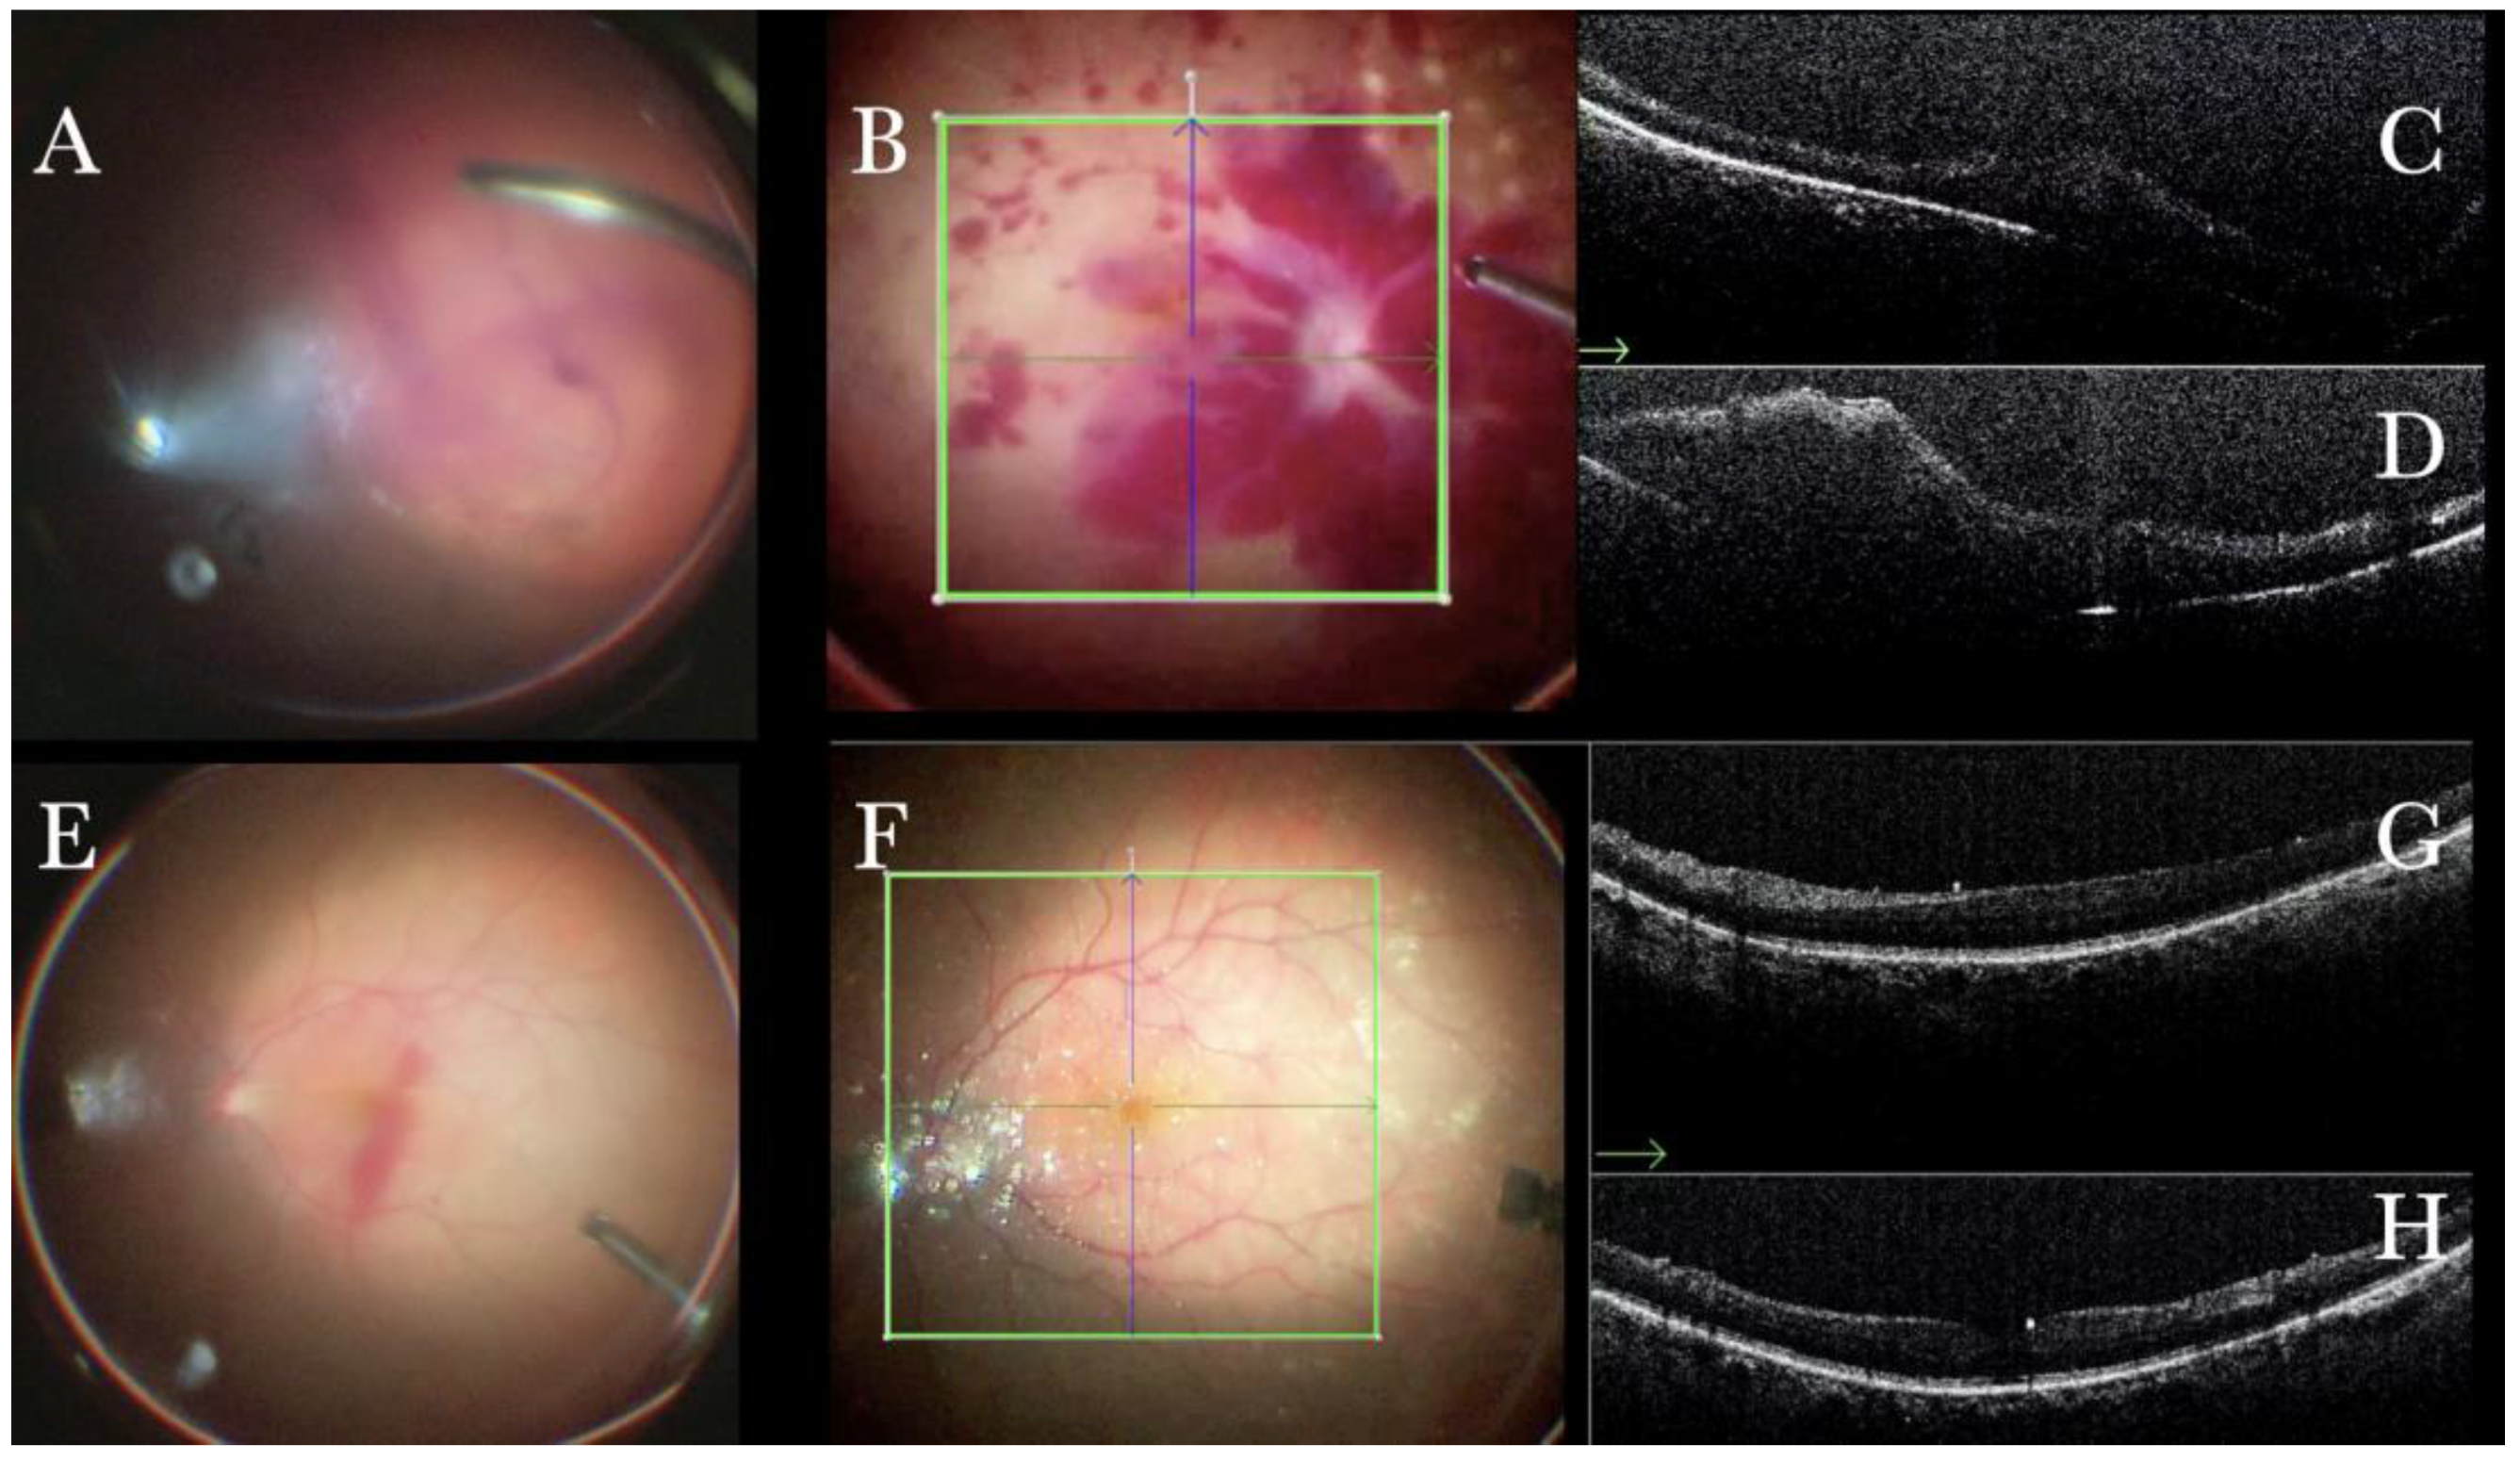
(A) Microscope view in a case of vitreous hemorrhage. An OCT was not obtainable prior to surgery. (B) Microscope view of the same case after vitrectomy and removal of the vitreous hemorrhage. The macular area is filled with intraretinal hemorrhages. (The green box indicates the field-of-view of the OCT scan, the green and blue lines within the green box show the vertical and horizontal scan planes). (C) The intraoperative optical coherence tomography (i-OCT) horizontal (green arrow) scan shows macular thickening but no membranes or holes. (D) The i-OCT vertical scan shows macular thickening but no membranes or holes. (E) Microscope view in a case of vitreous hemorrhage. An optical coherence tomography was not obtainable prior to surgery. (F) Microscope view of the same case after vitrectomy and removal of the vitreous hemorrhage. The macular area seems normal. (The green box indicates the field-of-view of the OCT scan, the green and blue lines within the green box show the vertical and horizontal scan planes). (G) The i-OCT horizontal (green arrow) scan shows a normal macular profile. (H) The i-OCT vertical scan shows a normal macular profile.
Figure 25.
(A) Microscope view in a case of vitreous hemorrhage. An OCT was not obtainable prior to surgery. (B) Microscope view of the same case after vitrectomy and removal of the vitreous hemorrhage. The macular area is filled with intraretinal hemorrhages. (The green box indicates the field-of-view of the OCT scan, the green and blue lines within the green box show the vertical and horizontal scan planes). (C) The intraoperative optical coherence tomography (i-OCT) horizontal (green arrow) scan shows macular thickening but no membranes or holes. (D) The i-OCT vertical scan shows macular thickening but no membranes or holes. (E) Microscope view in a case of vitreous hemorrhage. An optical coherence tomography was not obtainable prior to surgery. (F) Microscope view of the same case after vitrectomy and removal of the vitreous hemorrhage. The macular area seems normal. (The green box indicates the field-of-view of the OCT scan, the green and blue lines within the green box show the vertical and horizontal scan planes). (G) The i-OCT horizontal (green arrow) scan shows a normal macular profile. (H) The i-OCT vertical scan shows a normal macular profile.

Figure 26.
(A) Microscope view of the macular area during peeling of the epiretinal membrane (ERM) with toothed forceps. The surgeon has no sense of pressure or touch and counts only on visual feedback to control the maneuvers. (The white box indicates the field-of-view of the OCT scan, the green circle within the white box represents the effective working distance and green and blue lines within the green circle show the vertical and horizontal scan planes). (B) The intraoperative optical coherence tomography (i-OCT) horizontal (green arrow) scan shows the difference in the area where the ERM has already been or is not yet peeled, with the effect on the tissue due to the surgical maneuver. (C) The i-OCT vertical scan shows the effect on the tissue due to the surgical maneuver of peeling. The tissue is inevitably pushed downward. Possible damage to the retinal layers can be foreseen. The view of the i-OCT’s effect on tissue should guide in improving the technical approach.
Figure 27.
(A) Microscope view of the macular area during peeling of the inner limiting membrane (ILM) with a loop. The surgeon has no sense of pressure or touch and counts only on visual feedback to control the maneuvers. (The white box indicates the field-of-view of the OCT scan, the green circle within the white box represents the effective working distance and green and blue lines within the green circle show the vertical and horizontal scan planes). (B) The intraoperative optical coherence tomography (i-OCT) horizontal (green arrow) scan shows the difference in the area where the epiretinal membrane (ERM) has already been or is not yet peeled, with the effect on the tissue due to the surgical maneuver. (C) The i-OCT vertical (blue arrow) scan shows the effect on the tissue due to the surgical maneuver of peeling. The tissue is inevitably pushed downward. Possible damage to the retinal layers can be foreseen. The view of the i-OCT’s effect on tissue should guide in improving the technical approach.

Table 1.
Patients’ demographics.
Table 1.
Patients’ demographics.
| Features | Number (%) |
|---|
| Sex: | 265 |
| Male | 131 (49.43%) |
| Female | 134 (50.57%) |
| Age (years); (mean-range) | 58 (10–81) |
Table 2.
Diagnosis features.
Table 2.
Diagnosis features.
| Diagnosis | Number,
n = 265 Eyes | Sex, Number (%) | Age (Mean-Range) |
|---|
| Myopic Tractional Maculopathy | 60 (22.64%) | Male: 18 (6.79%)
Female: 42 (15.84%) | 58 (39–72) |
| Epiretinal Membrane | 52 (19.62%) | Male: 27 (10.19%)
Female: 25 (9.43%) | 63 (58–65) |
| Macular Hole | 40 (15.09%) | Male: 25 (9.44%)
Female: 15 (5.66%) | 68 (12–75) |
| Retinal Detachment | 30 (11.32%) | Male: 18 (6.79%)
Female: 12 (4.52%) | 58 (37–64) |
| Proliferative Vitreoretinopathy | 32 (12.08%) | Male: 20 (7.55%)
Female: 12 (4.53%) | 61 (10–68) |
| Choroidal Transplant | 30 (11.32%) | Male: 11 (4.15%)
Female: 19 (7.17%) | 75 (57–87) |
| Vitreous Opacities | 20 (7.55%) | Male: 12 (4.53%)
Female 8 (3%) | 71 (57–81) |
| Optic Disc Pit | 1 (0.4%) | Male: 0 (0%)
Female: 1 (0.4%) | 10 |
Table 3.
Advantages of intraoperative optical coherence tomography (OCT) in managing different vitreoretinal diseases in a real-life setting.
Table 3.
Advantages of intraoperative optical coherence tomography (OCT) in managing different vitreoretinal diseases in a real-life setting.
| Disease | Advantages of Intraoperative OCT |
|---|
| ERM/ILM | Real-Time Visualization of Surgical maneuvers
Evaluation of possible iatrogenic retinal hole |
| FTMH | Evaluation of the ILM position over the MH regardless of the tamponade
Evaluation of the efficacy of the adopted technique
Evaluation of ART graft position
Evaluation of the presence of ILM flap in high myopic eyes where neither pigmentation nor contrast is present
Guiding the decision of “Peel Vs. No peel” |
| Macular buckle | Evaluation of the buckle position under the MH and fovea |
| Retinal detachment | Confirmation of retinal status regardless of the tamponade
Discrimination between schisis and detachment
Discrimination between holes and cysts
Evaluation of subretinal PFCL
Identification of immature PVR membranes
Evaluation of residual traction at the edge of a retinotomy |
| Media opacities | Intraoperative diagnosis of retinal diseases when the preoperative OCT is not possible due to the opacity of optic media |
| Any surgery | Real-Time Visualization of Surgical maneuvers |


 ,
, 


