

Body Composition Relationship to Performance, Cardiorespiratory Profile, and Tether Force in Youth Trained Swimmers

 ,
,  , ,
, ,  , ,
, , 
Abstract
1. Introduction
2. Materials and Methods
2.1. Study Design
2.2. Participants
2.3. Procedures
2.3.1. Anthropometric and Morphological Evaluations
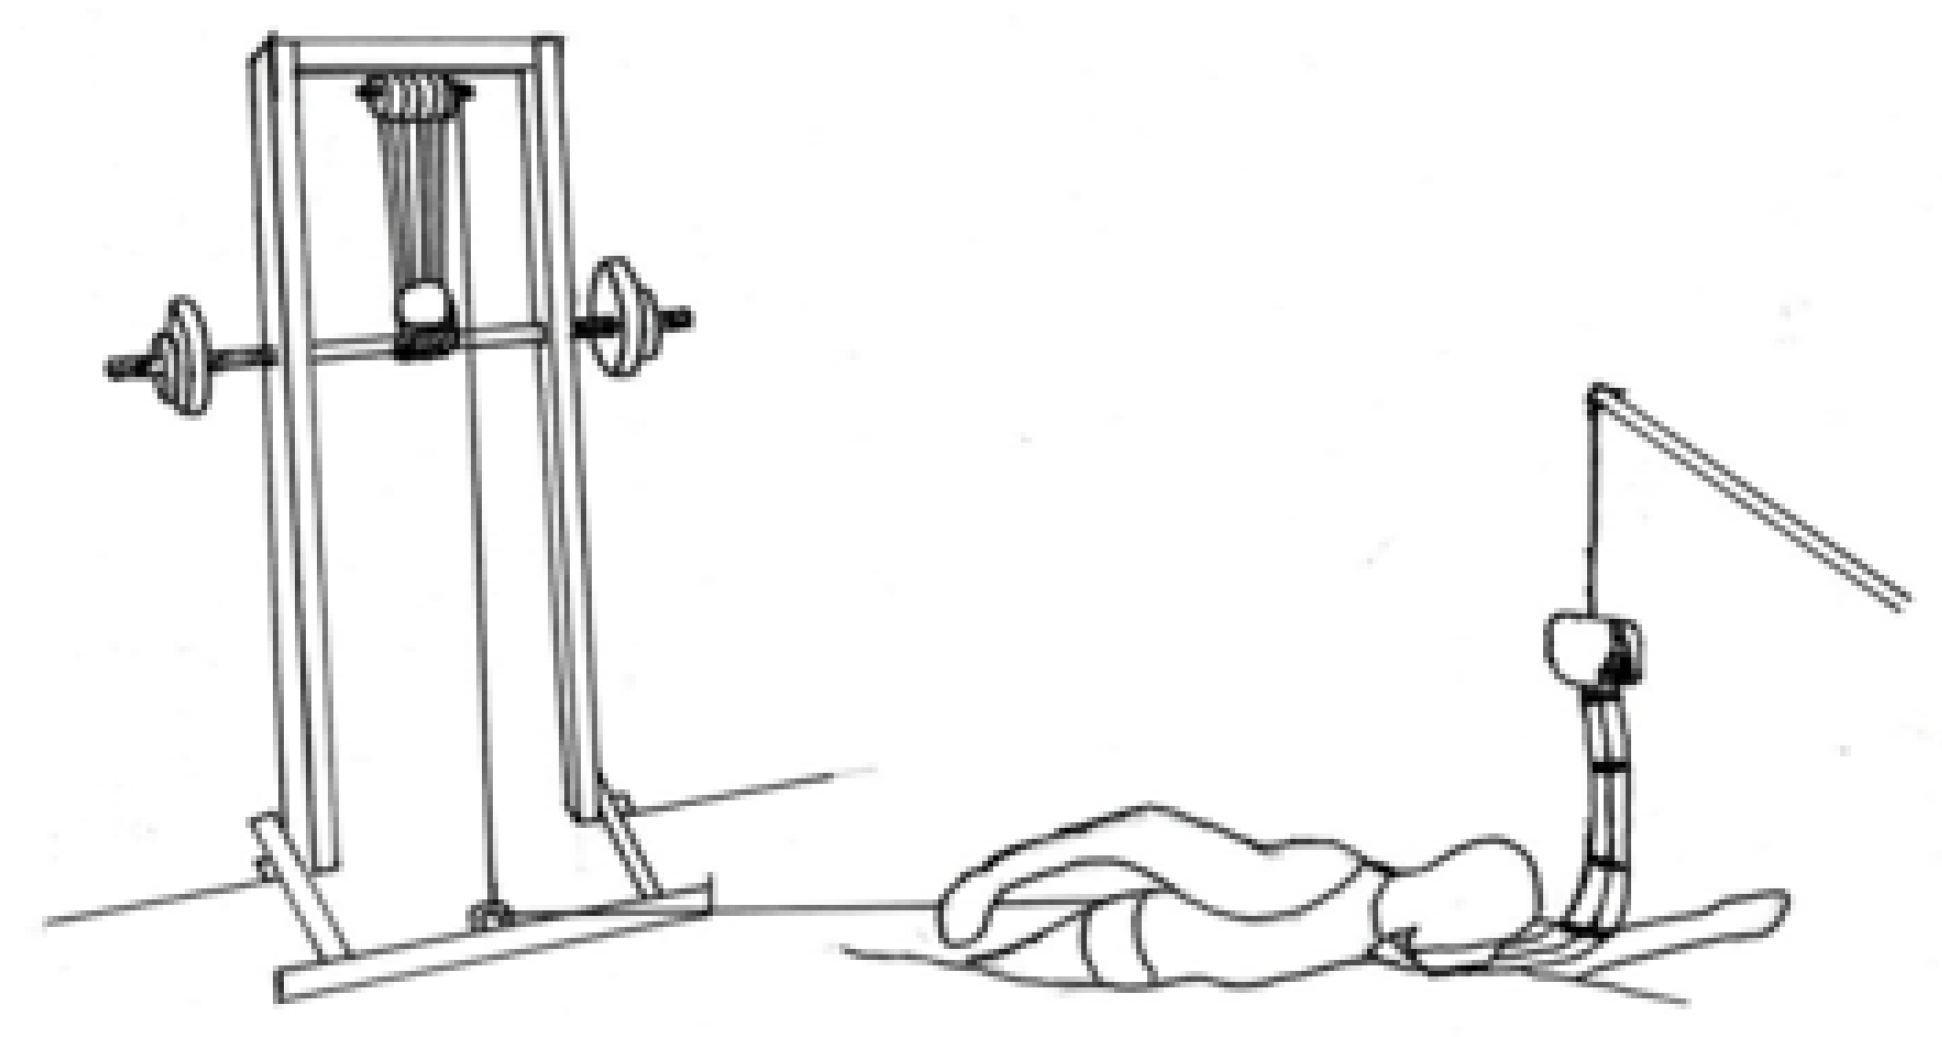
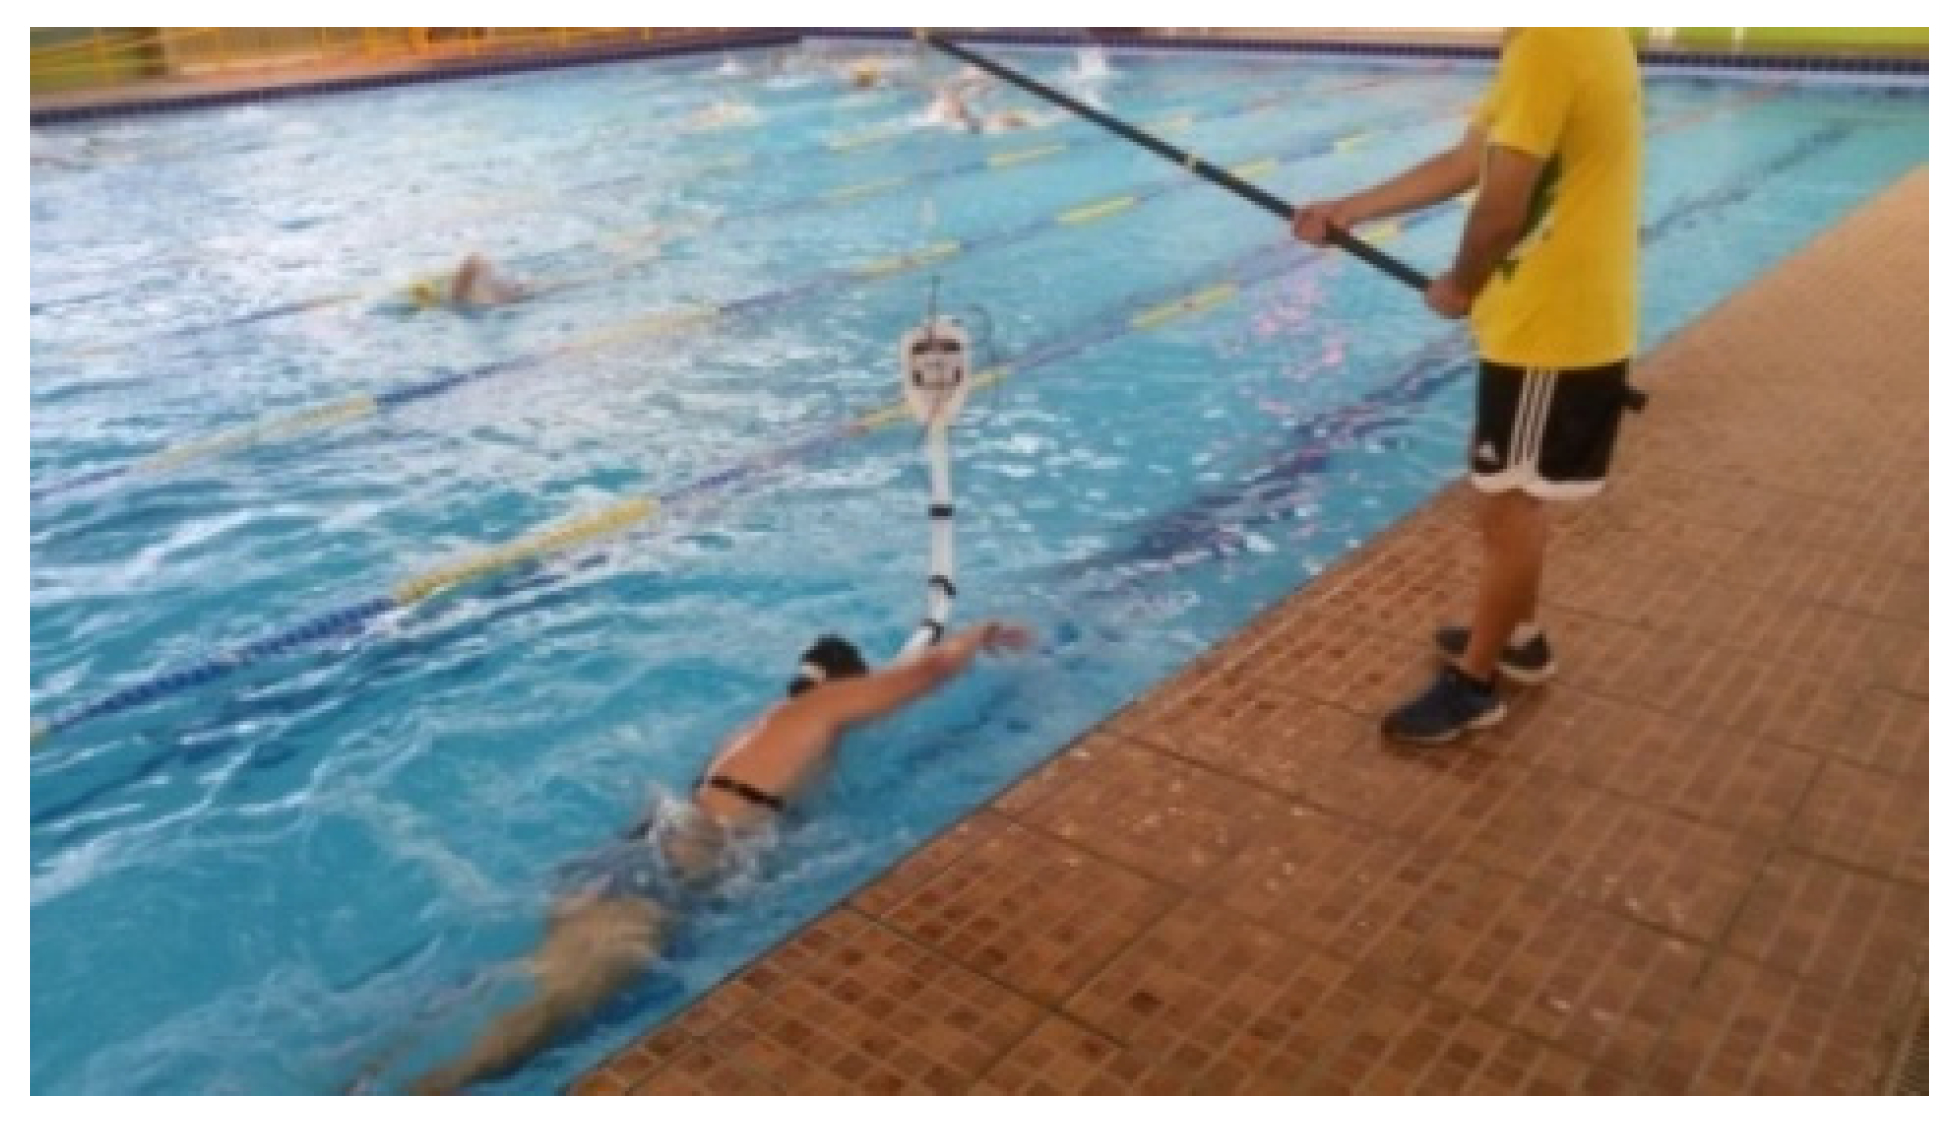
2.3.2. In-Water Tests
2.4. Statistical Analysis
3. Results
4. Discussion
5. Conclusions
Author Contributions
Funding
Institutional Review Board Statement
Informed Consent Statement
Data Availability Statement
Conflicts of Interest
References
- Campa, F.; Piras, A.; Raffi, M.; Toselli, S. Functional Movement Patterns and Body Composition of High-Level Volleyball, Soccer, and Rugby Players. J. Sport Rehabil. 2019, 28, 740–745. [Google Scholar] [CrossRef]
- Dopsaj, M.; Zuoziene, I.J.; Milić, R.; Cherepov, E.; Erlikh, V.; Masiulis, N.; di Nino, A.; Vodičar, J. Body Composition in International Sprint Swimmers: Are There Any Relations with Performance? Int. J. Environ. Res. Public Health 2020, 17, 9464. [Google Scholar] [CrossRef]
- Almeida, T.A.F.; Pessôa Filho, D.M.; Espada, M.A.C.; Reis, J.F.; Sancassani, A.; Massini, D.A.; Santos, F.J.; Alves, F.B. Physiological Responses During High-intensity Interval Training in Young Swimmers. Front. Physiol. 2021, 12, 662029. [Google Scholar] [CrossRef]
- Massini, D.A.; Almeida, T.A.F.; Vasconcelos, C.M.T.; Macedo, A.G.; Espada, M.A.C.; Reis, J.F.; Fernandes, R.; Pessôa Filho, D.M. Are Young Swimmers Short and Middle Distances Energy Cost Sex-specific? Front. Physiol. 2021, 12, 796886. [Google Scholar] [CrossRef]
- Almeida, T.A.F.; Massini, D.A.; Silva Júnior, O.T.; Venditti Júnior, R.; Espada, M.A.C.; Macedo, A.G.; Reis, J.F.; Alves, F.B.; Pessôa Filho, D.M. Time Limit and VO2 Kinetics at Maximal Aerobic Velocity: Continuous vs. Intermittent Swimming Trials. Front. Physiol. 2022, 13, 982874. [Google Scholar] [CrossRef]
- Aujouannet, Y.A.; Bonifazi, M.; Hintzy, F.; Vullerme, N.; Rouard, A.H. Effects of a High-intensity Swim Test on Kinematic Parameters in High-level Athletes. Appl. Physiol. Nutr. Metab. 2006, 31, 150–158. [Google Scholar] [CrossRef]
- Ribeiro, J.; Toubekis, A.G.; Figueiredo, P.; de Jesus, K.; Toussaint, H.M.; Alves, F.; Vilas-Boas, J.P.; Fernandes, R.J. Biophysical Determinants of Front-Crawl Swimming at Moderate and Severe Intensities. Int. J. Sports Physiol. Perform. 2017, 12, 241–246. [Google Scholar] [CrossRef]
- Kolmogorov, S.; Vorontsov, A.; Vilas-Boas, J.P. Metabolic Power, Active Drag, Mechanical and Propelling Efficiency of Elite Swimmers at 100 Meter Events in Different Competitive Swimming Techniques. Appl. Sci. 2021, 11, 8511. [Google Scholar] [CrossRef]
- Wądrzyk, Ł.; Staszkiewicz, R.; Strzała, M. Comparison of Race Performance Characteristics for the 50 m and 100 m Freestyle among Regional-Level Male Swimmers. Appl. Sci. 2022, 12, 12577. [Google Scholar] [CrossRef]
- Almeida, T.A.F.; Pessôa Filho, D.M.; Espada, M.A.C.; Reis, J.F.; Simionato, A.R.; Siqueira, L.O.C.; Alves, F.B. VO2 Kinetics and Energy Contribution in Simulated Maximal Performance During Short and Middle Distance-trials in Swimming. Eur. J. Appl. Physiol. 2020, 120, 1097–1109. [Google Scholar] [CrossRef]
- Espada, M.C.; Alves, F.B.; Curto, D.; Ferreira, C.C.; Santos, F.J.; Pessôa-Filho, D.M.; Reis, J.F. Can an Incremental Step Test Be Used for Maximal Lactate Steady State Determination in Swimming? Clues for Practice. Int. J. Environ. Res. Public Health 2021, 18, 477. [Google Scholar] [CrossRef]
- Amaro, N.; Marinho, D.A.; Batalha, N.; Marques, M.C.; Morouço, P. Reliability of Tethered Swimming Evaluation in Age Group Swimmers. J. Hum. Kinet. 2014, 41, 155–162. [Google Scholar] [CrossRef]
- Pessôa Filho, D.M.; Siqueira, L.O.C.; Simionato, A.R.; Espada, M.A.C.; Pestana, D.S.; DiMenna, F.J. A Rapidly-Incremented Tethered-Swimming test for Defining Domain-Specific Training Zones. J. Hum. Kinet. 2017, 57, 117–128. [Google Scholar] [CrossRef]
- Girold, S.; Calmels, P.; Maurin, D.; Milhau, N.; Chatard, J.C. Assisted and resisted sprint training in swimming. J. Strength Cond. Res. 2006, 20, 547–554. [Google Scholar] [CrossRef]
- Sharp, R.L.; Troup, J.P. Relationship Between Power and Sprint Freestyle. Med. Sci. Sports Exerc. 1982, 14, 53–56. [Google Scholar] [CrossRef]
- Yeater, R.A.; Martin, R.B.; White, M.K.; Gilson, K.H. Tethered Swimming Forces in the Crawl, Breast and Back Strokes and their Relationship to Competitive Performance. J. Biomech. 1981, 14, 527–537. [Google Scholar] [CrossRef]
- Morouço, P.G.; Marinho, D.A.; Keskinen, K.L.; Badillo, J.J.; Marques, M.C. Tethered Swimming can be used to Evaluate Force Contribution for Short-distance Swimming Performance. J. Strength Cond. Res. 2014, 28, 3093–3099. [Google Scholar] [CrossRef]
- Santos, K.B.; Bento, P.C.; Pereira, G.; Rodacki, A.L. The Relationship Between Propulsive Force in Tethered Swimming and 200-m Front Crawl Performance. J. Strength Cond. Res. 2016, 30, 2500–2507. [Google Scholar] [CrossRef]
- Morouço, P.G.; Vilas-Boas, J.P.; Fernandes, R.J. Evaluation of Adolescent Swimmers Through a 30-s Tethered Test. Pediatr. Exerc. Sci. 2012, 24, 312–321. [Google Scholar] [CrossRef]
- Lätt, E.; Jürimäe, J.; Mäestu, J.; Purge, P.; Rämson, R.; Haljaste, K.; Keskinen, K.L.; Rodriguez, F.A.; Jürimäe, T. Physiological, Biomechanical and Anthropometrical Predictors of Sprint Swimming Performance in Adolescent Swimmers. J. Sports Sci. Med. 2010, 9, 398–404. [Google Scholar]
- Bonen, A.; Wilson, B.A.; Yarkony, M.; Belcastro, A.N. Maximal oxygen uptake during free, tethered, and flume swimming. J. Appl. Physiol. Respir. Environ. Exerc. Physiol. 1980, 48, 232–235. [Google Scholar] [CrossRef]
- Ratamess, N.A. Body Composition. In NSCA’s Guide to Tests and Assessments, National Strength and Conditioning Association; Miller, T.T., Ed.; Human Kinetics: Champaign, IL, USA, 2012; pp. 31–42. [Google Scholar]
- Dopsaj, M.; Markovic, M.; Kasum, G.; Jovanovic, S.; Koropanovski, G.; Vukovic, M.; Mudric, M. Discrimination of Different Body Structure Indexes of Elite Athletes in Combat Sports Measured by Multi Frequency Bioimpedance Method. Int. J. Morphol. 2017, 35, 199–207. [Google Scholar] [CrossRef]
- Gibson, A.L.; Holmes, J.C.; Desautels, R.L.; Edmonds, L.B.; Nuudi, L. Ability of New Octapolar Bioimpedance Spectroscopy Analyzers to Predict 4-component-model Percentage Body Fat in Hispanic, Black, and White Adults. Am. J. Clin. Nutr. 2008, 87, 328–332. [Google Scholar] [CrossRef] [PubMed]
- Esco, M.R.; Snarr, R.L.; Leatherwood, M.D.; Chamberlain, N.A.; Redding, M.L.; Flatt, A.A.; Moon, J.R.; Williford, H.N. Comparison of Total and Segmental Body Composition using DXA and Multifrequency Bioimpedance in Collegiate Female Athletes. J. Strength Cond. Res. 2015, 29, 918–925. [Google Scholar] [CrossRef] [PubMed]
- Cochrane, K.C.; Housh, T.J.; Smith, C.M.; Hill, E.C.; Jenkins, N.D.; Johnson, G.O.; Housh, D.J.; Schmidt, R.J.; Cramer, J.T. Relative Contributions of Strength, Anthropometric, and Body Composition Characteristics to Estimated Propulsive Force in Young Male Swimmers. J. Strength Cond. Res. 2015, 29, 1473–1479. [Google Scholar] [CrossRef] [PubMed]
- Pessôa Filho, D.M.; Simionato, A.R.; Siqueira, L.B.O.; Espada, M.C.; Pestana, D. Influence of Regional and Whole-Body Composition on Swimming and Aerobic Indexes. Rev. Bras. Med. Esporte. 2016, 22, 195–199. [Google Scholar] [CrossRef][Green Version]
- Kjendlie, P.L.; Thorsvald, K. A Tethered Swimming Power Test is Highly Reliable. Port. J. Sport Sci. 2006, 6, 231–233. [Google Scholar]
- Pessôa Filho, D.M.; Massini, D.A.; Siqueira, L.O.C.; Santos, L.G.A.; Vasconcelos, C.M.T.; Almeida, T.A.F.; Espada, M.A.C.; Reis, J.F.; Alves, F.B.; DiMenna, F.J. A Rapidly Incremented Tethered-Swimming Maximal Protocol for Cardiorespiratory Assessment of Swimmers. J. Vis. Exp. 2020, 155. [Google Scholar] [CrossRef]
- Morais, J.E.; Jesus, S.; Lopes, V.; Garrido, N.; Silva, A.; Marinho, D.; Barbosa, T.M. Linking Selected Kinematic, Anthropometric and Hydrodynamic Variables to Young Swimmer Performance. Pediatr. Exerc. Sci. 2012, 24, 649–664. [Google Scholar] [CrossRef]
- Harriss, D.; MacSween, A.; Atkinson, G. Ethical Standards in Sport and Exercise Science Research: 2020 Update. Int. J. Sports Med. 2019, 40, 813–817. [Google Scholar] [CrossRef]
- Nana, A.; Slater, G.J.; Hopkins, W.G.; Burke, L.M. Techniques for Undertaking Dual-energy X-ray Absorptiometry Whole-body Scans to Estimate Body Composition in Tall and/or Broad Subjects. Int. J. Sport. Nutr. Exerc. Metab. 2012, 22, 313–322. [Google Scholar] [CrossRef] [PubMed]
- Baldari, C.; Fernandes, R.J.; Meucci, M.; Ribeiro, J.; Vilas-Boas, J.P.; Guidetti, L. Is the New AquaTrainer® Snorkel Valid for VO2 Assessment in Swimming? Int. J. Sports Med. 2013, 34, 336–344. [Google Scholar] [CrossRef] [PubMed]
- Ferguson, C.J. An Effect Size Primer: A Guide for Clinicians and Researchers. Prof. Psychol. Res. Pract. 2009, 40, 532–538. [Google Scholar] [CrossRef]
- Mukaka, M.M. A Guide to Appropriate use of Correlation Coefficient in Medical Research. Malawi Med. J. 2012, 24, 69–71. [Google Scholar] [PubMed]
- Faul, F.; Erdfelder, E.; Lang, A.G.; Buchner, A. G*Power 3: A Flexible Statistical Power Analysis Program for the Social, Behavioral, and Biomedical Sciences. Behav. Res. Methods. 2007, 39, 175–191. [Google Scholar] [CrossRef]
- Strzała, M.; Stanula, A.; Krężałek, P.; Sadowski, W.; Wilk, R.; Pałka, T.; Sokołowski, K.; Radecki-Pawlik, A. Body Composition and Specific and General Strength Indices as Predictors of 100-m Front Crawl Performance. Acta Bioeng. Biomech. 2020, 22, 51–60. [Google Scholar] [CrossRef] [PubMed]
- Gagnon, C.M.; Steiper, M.E.; Pontzer, H. Elite Swimmers do not Exhibit a Body Mass Index Trade-off Across a Wide Range of Event Distances. Proc. Biol. Sci. 2018, 285, 20180684. [Google Scholar] [CrossRef]
- Mameletzi, D.; Siatras, T.; Tsalis, G.; Kellis, S. The Relationship Between Lean Body Mass and Isokinetic Peak Torque of Knee Extensors and Flexors in Young Male and Female Swimmers. Isokinet. Exerc. Sci. 2003, 11, 159–163. [Google Scholar] [CrossRef]
- Chatard, J.C.; Collomp, C.; Maglischo, E.; Maglischo, C. Swimming Skill and Stroking Characteristics of Front Crawl Swimmers. Int. J. Sports Med. 1990, 11, 156–161. [Google Scholar] [CrossRef]
- Cortesi, M.; Gatta, G.; Michielon, G.; Di Michele, R.; Bartolomei, S.; Scurati, R. Passive Drag in Young Swimmers: Effects of Body Composition, Morphology and Gliding Position. Int. J. Environ. Res. Public Health 2020, 17, 2002. [Google Scholar] [CrossRef]
- Jurimae, J.; Haljaste, K.; Cicchella, A.; Latt, E.; Purge, P.; Leppik, A.; Jurimae, T. Analysis of Swimming Performance from Physical, Physiological, and Biomechanical Parameters in Young Swimmers. Pediatr. Exerc. Sci. 2007, 19, 70–81. [Google Scholar] [CrossRef]
- Saavedra, J.M.; Escalante, Y.; Rodriguez, F.A. A Multivariate Analysis of Performance in Young Swimmers. Pediatr. Exerc. Sci. 2010, 22, 135–151. [Google Scholar] [CrossRef]
- Avlonitou, E.; Georgiou, E.; Douskas, G.; Louizi, A. Estimation of Body Composition in Competitive Swimmers by Means of Three Different Techniques. Int. J. Sports Med. 1997, 18, 363–368. [Google Scholar] [CrossRef]
- Meleski, B.; Malina, R. Changes in Body Composition and Physique of Elite University-level Female Swimmers During a Competitive Season. J. Sports Sci. 1985, 3, 33–40. [Google Scholar] [CrossRef]
- Barbosa, T.M.; Fernandes, R.; Keskinen, K.L.; Colaço, P.; Cardoso, C.; Vilas-Boas, J.P. Evaluation of the Energy Expenditure in Competitive Swimming Strokes. Int. J. Sports Med. 2006, 27, 894–899. [Google Scholar] [CrossRef]
- West, D.J.; Owen, N.J.; Cunningham, D.J.; Cook, C.J.; Kidu, L.P. Strength and Power Predictors of Swimming Starts in International Sprint Swimmers. J. Strength Cond. Res. 2011, 25, 950–955. [Google Scholar] [CrossRef] [PubMed]
- Nevill, A.M.; Oxford, S.W.; Duncan, M.J. Optimal Body Size and Limb Length Ratios Associated with 100-m Personal-Best Swim Speeds. Med. Sci. Sports Exerc. 2015, 47, 1714–1718. [Google Scholar] [CrossRef] [PubMed]
- Peters, M.S.; Berry, S.; Koley, S. Relationship of Physical Characteristics, Power and Swimming Time in Sprint Swimmers. Ann. Biol. Res. 2014, 5, 24–29. [Google Scholar]
- Batalha, N.; Marmeleira, J.; Garrido, N.; Silva, A.J. Does a Water-training Macrocycle Really Create Imbalances in Swimmers’ Shoulder Rotator Muscles? Eur. J. Sport Sci. 2015, 15, 167–172. [Google Scholar] [CrossRef] [PubMed]
- Sokołowski, K.; Bartolomeu, R.F.; Barbosa, T.M.; Strzała, M. VO2 Kinetics and Tethered Strength Influence the 200-m Front Crawl Stroke Kinematics and Speed in Young Male Swimmers. Front. Physiol. 2022, 13, 1045178. [Google Scholar] [CrossRef]
- Gastin, P.B.; Lawson, D.L. Variable Resistance All-out Test to Generate Accumulated Oxygen Deficit and Predict Anaerobic Capacity. Eur. J. Appl. Physiol. Occup. Physiol. 1994, 69, 331–336. [Google Scholar] [CrossRef] [PubMed]
- Crowley, E.; Harrison, A.J.; Lyons, M. The Impact of Resistance Training on Swimming Performance: A Systematic Review. Sports Med. 2017, 47, 2285–2307. [Google Scholar] [CrossRef] [PubMed]


| Variables | M | SD |
|---|---|---|
| Absolute VO2max (mL·min−1) | 3.423.0 | 601.8 |
| Relative VO2max (mL·kg·min−1) | 49.2 | 5.9 |
| iVO2max (kg) | 8.9 | 1.6 |
| Absolute RCP (mL·min−1) | 3.046.2 | 588.7 |
| Relative RCP (mL·kg·min−1) | 43.8 | 6.0 |
| iRCP (kg) | 7.8 | 1.4 |
| Absolute GET (mL·min−1) | 2.214.8 | 455.0 |
| Relative GET (mL·kg·min−1) | 32.0 | 6.3 |
| iGET (kg) | 5.5 | 1.3 |
| Variables | M | SD |
|---|---|---|
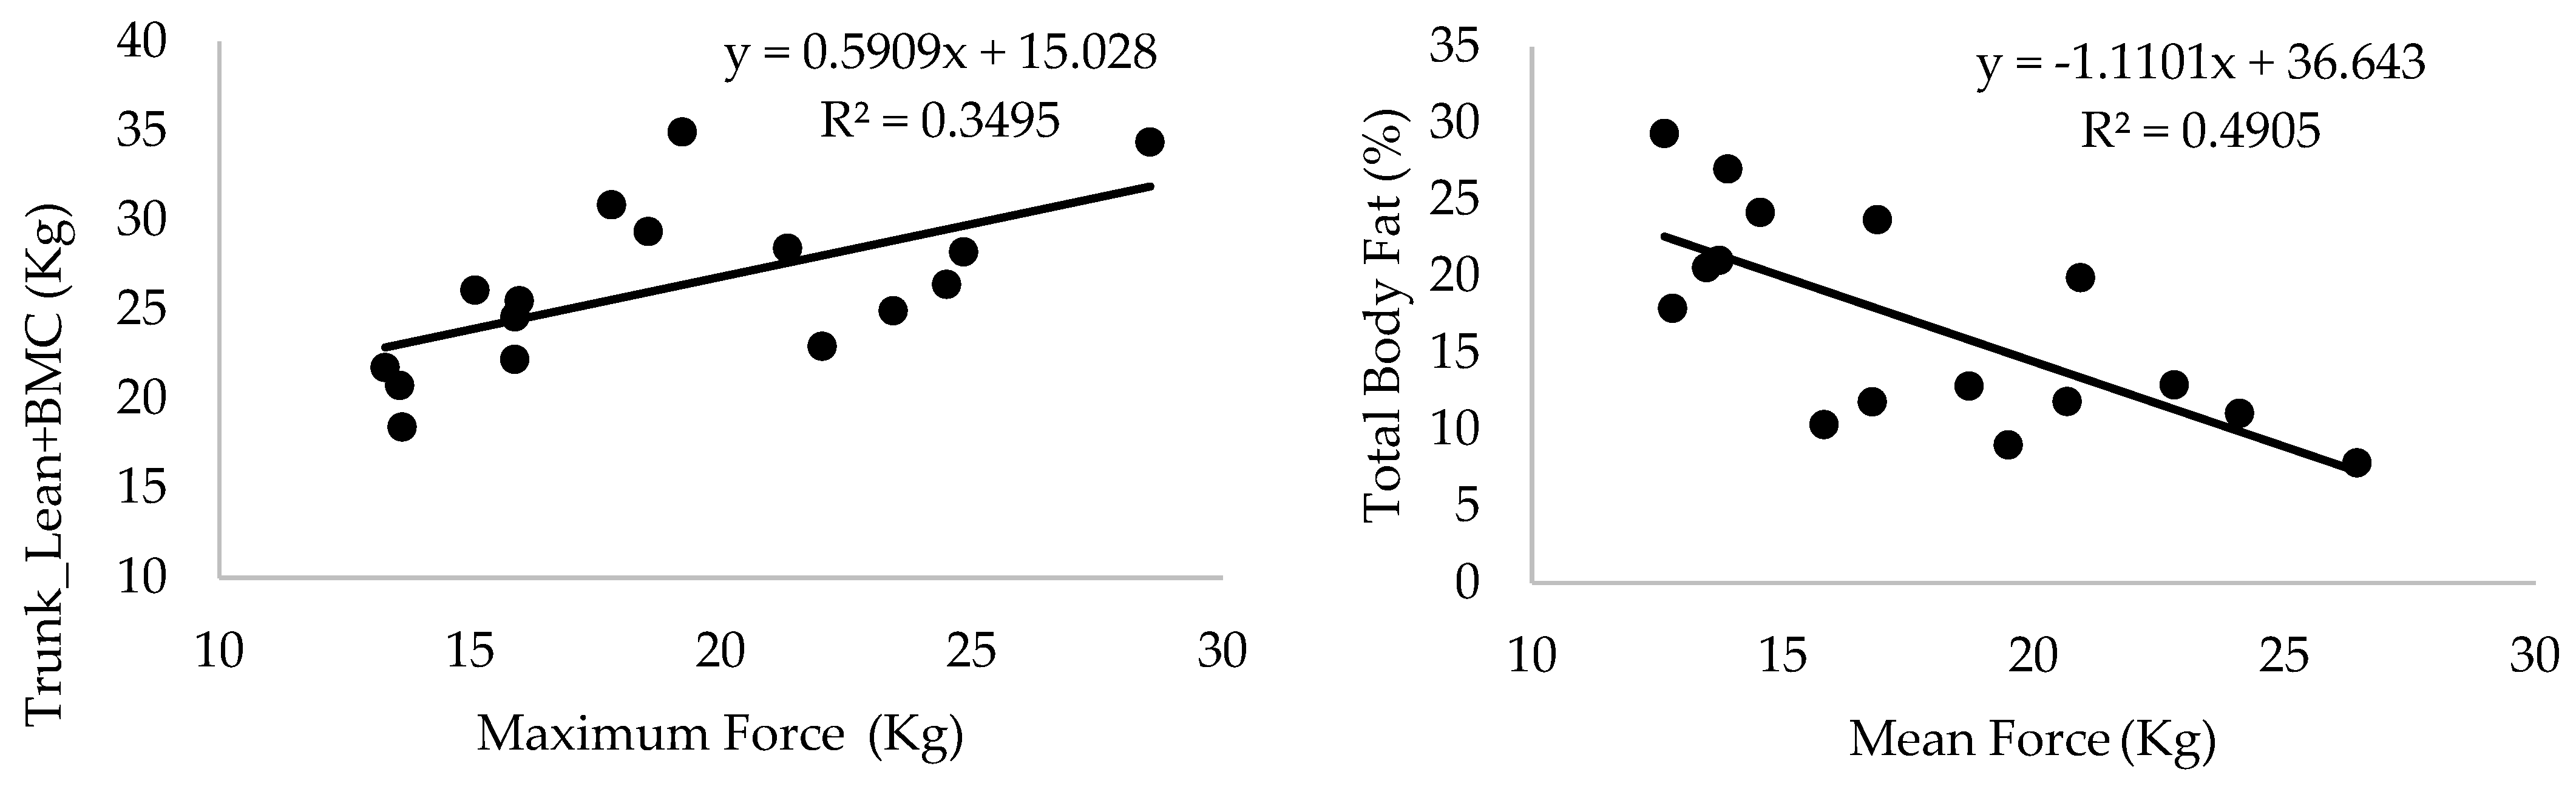
| Fmax (kg) | 19.0 | 4.7 |
| Fmean (kg) | 17.7 | 4.3 |
| Total_LM+BMC (kg) | 56.8 | 10.1 |
| TM (kg) | 68.4 | 10.6 |
| Total FM (%) | 16.9 | 6.8 |
| UL_LM+BMC (kg) | 6.7 | 1.6 |
| UL_TM (kg) | 8.0 | 1.5 |
| UL_FM (%) | 16.0 | 8.6 |
| Trunk_LM+BMC (kg) | 26.2 | 4.6 |
| Trunk_TM (kg) | 30.8 | 5.1 |
| Trunk_FM (%) | 14.8 | 6.8 |
| LL_LM+BMC (kg) | 20.1 | 3.8 |
| LL_TM (kg) | 25.1 | 4.0 |
| LL_FM (%) | 19.6 | 8.1 |
| VO2max | iVO2max | RCP | iRCP | GET | iGET | Fmax | Fmean | |
|---|---|---|---|---|---|---|---|---|
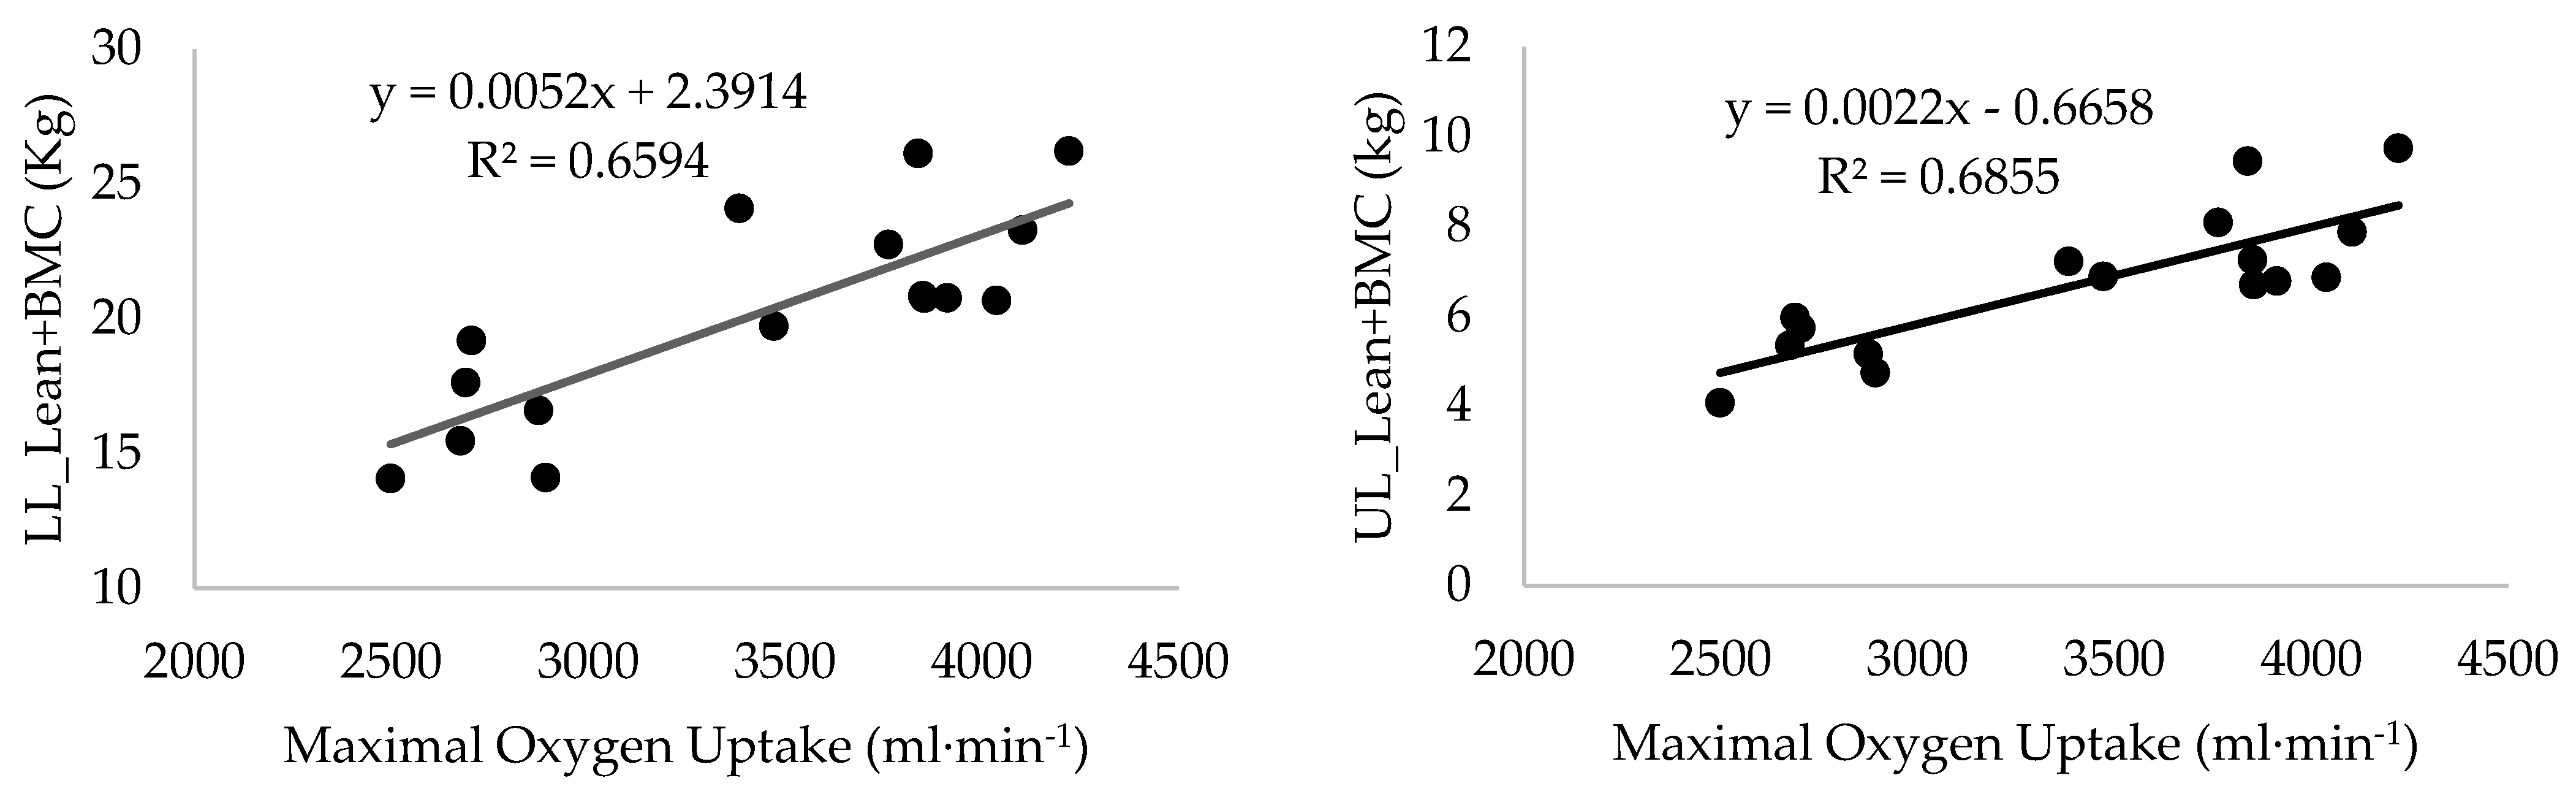
| UL_LM+BMC | 0.83 ** | 0.80 ** | 0.81 ** | 0.74 ** | 0.76 ** | 0.68 ** | 0.70 ** | 0.68 ** |
| UL_TM | 0.80 ** | 0.72 ** | 0.77 ** | 0.69 ** | 0.56 * | 0.65 ** | - | - |
| UL_FM | - | - | 0.99 ** | - | −0.73 ** | −0.65 * | −0.68 ** | −0.72 ** |
| Trunk_LM+BMC | 0.78 ** | 0.76 ** | 0.76 ** | 0.65 ** | 0.60 * | 0.61 * | 0.59 * | 0.58 * |
| Trunk_TM | 0.69 ** | 0.57 * | 0.64 ** | 0.55 * | - | 0.52 * | - | - |
| Trunk_FM | - | - | - | - | - | - | −0.61 * | −0.65 ** |
| LL_LM+BMC | 0.81 ** | 0.72 ** | 0.80 ** | 0.68 ** | 0.67 ** | 0.62 ** | 0.63 ** | 0.62 * |
| LL_TM | 0.69 ** | 0.54 ** | 0.64 ** | 0.54 ** | 0.67 ** | 0.62 ** | - | - |
| LL_FM | - | - | - | - | −0.67 ** | −0.63 ** | −0.67 ** | −0.71 ** |
Disclaimer/Publisher’s Note: The statements, opinions and data contained in all publications are solely those of the individual author(s) and contributor(s) and not of MDPI and/or the editor(s). MDPI and/or the editor(s) disclaim responsibility for any injury to people or property resulting from any ideas, methods, instructions or products referred to in the content. |
© 2023 by the authors. Licensee MDPI, Basel, Switzerland. This article is an open access article distributed under the terms and conditions of the Creative Commons Attribution (CC BY) license (https://creativecommons.org/licenses/by/4.0/).
Share and Cite
Espada, M.C.; Ferreira, C.C.; Gamonales, J.M.; Hernández-Beltrán, V.; Massini, D.A.; Macedo, A.G.; Almeida, T.A.F.; Castro, E.A.; Pessôa Filho, D.M. Body Composition Relationship to Performance, Cardiorespiratory Profile, and Tether Force in Youth Trained Swimmers. Life 2023, 13, 1806. https://doi.org/10.3390/life13091806
Espada MC, Ferreira CC, Gamonales JM, Hernández-Beltrán V, Massini DA, Macedo AG, Almeida TAF, Castro EA, Pessôa Filho DM. Body Composition Relationship to Performance, Cardiorespiratory Profile, and Tether Force in Youth Trained Swimmers. Life. 2023; 13(9):1806. https://doi.org/10.3390/life13091806
Chicago/Turabian StyleEspada, Mário C., Cátia C. Ferreira, José M. Gamonales, Víctor Hernández-Beltrán, Danilo A. Massini, Anderson G. Macedo, Tiago A. F. Almeida, Eliane A. Castro, and Dalton M. Pessôa Filho. 2023. "Body Composition Relationship to Performance, Cardiorespiratory Profile, and Tether Force in Youth Trained Swimmers" Life 13, no. 9: 1806. https://doi.org/10.3390/life13091806
APA StyleEspada, M. C., Ferreira, C. C., Gamonales, J. M., Hernández-Beltrán, V., Massini, D. A., Macedo, A. G., Almeida, T. A. F., Castro, E. A., & Pessôa Filho, D. M. (2023). Body Composition Relationship to Performance, Cardiorespiratory Profile, and Tether Force in Youth Trained Swimmers. Life, 13(9), 1806. https://doi.org/10.3390/life13091806