Article

Aligning Cross-Species Interactomes for Studying Complex and Chronic Diseases

by
Marianna Milano
1,2,*,
Pietro Cinaglia
2,3,
Pietro Hiram Guzzi
2,4 and
Mario Cannataro
2,4
1
Department of Experimental and Clinical Medicine, University Magna Græcia, 88100 Catanzaro, Italy
2
Data Analytics Research Center, University Magna Græcia, 88100 Catanzaro, Italy
3
Department of Health Sciences, University Magna Græcia, 88100 Catanzaro, Italy
4
Department of Medical and Surgical Sciences, University Magna Græcia, 88100 Catanzaro, Italy
*
Author to whom correspondence should be addressed.
Life 2023, 13(7), 1520; https://doi.org/10.3390/life13071520
Submission received: 13 June 2023 / Revised: 3 July 2023 / Accepted: 5 July 2023 / Published: 6 July 2023
(This article belongs to the Section Biochemistry, Biophysics and Computational Biology)

Abstract

:
Neurodegenerative diseases (NDs) are a group of complex disorders characterized by the progressive degeneration and dysfunction of neurons in the central nervous system. NDs encompass many conditions, including Alzheimer’s disease and Parkinson’s disease. Alzheimer’s disease (AD) is a complex disease affecting almost forty million people worldwide. AD is characterized by a progressive decline of cognitive functions related to the loss of connections between nerve cells caused by the prevalence of extracellular A β plaques and intracellular neurofibrillary tangles plaques. Parkinson’s disease (PD) is a neurodegenerative disorder that primarily affects the movement of an individual. The exact cause of Parkinson’s disease is not fully understood, but it is believed to involve a combination of genetic and environmental factors. Some cases of PD are linked to mutations in the LRRK2, PARKIN and other genes, which are associated with familial forms of the disease. Different research studies have applied the Protein Protein Interaction (PPI) networks to understand different aspects of disease progression. For instance, Caenorhabditis elegans is widely used as a model organism for the study of AD due to roughly 38% of its genes having a human ortholog. This study’s goal consists of comparing PPI network of C. elegans and human by applying computational techniques, widely used for the analysis of PPI networks between species, such as Local Network Alignment (LNA). For this aim, we used L-HetNetAligner algorithm to build a local alignment among two PPI networks, i.e., C. elegans and human PPI networks associated with AD and PD built-in silicon. The results show that L-HetNetAligner can find local alignments representing functionally related subregions. In conclusion, since local alignment enables the extraction of functionally related modules, the method can be used to study complex disease progression.

1. Introduction

Neurodegenerative diseases (NDs) are complex disorders characterized by progressive damage and loss of neurons in the central nervous system (CNS) leading to mobility and/or cognition impairments. For instance, Alzheimer’s disease (AD) is a progressive neurodegenerative disorder that affects the brain, primarily causing problems with memory, thinking, and behavior. AD is the most common cause of dementia, a general term for a decline in cognitive abilities severe enough to interfere with daily life [1,2]. The pathogenesis of AD is related to be a complex interplay of genetic, environmental, and lifestyle factors [3]. The disease is characterized by the accumulation of abnormal protein deposits, including beta-amyloid plaques [4] and TAU tangles [5] in the brain. The accumulation causes a loss of connections between nerve cells and the eventual death of these cells, resulting in the progressive decline of cognitive functions.
The symptoms of AD usually develop slowly and worsen over time. Early signs may include forgetfulness, difficulty with language and problem-solving, confusion, disorientation, and mood and behavior changes. As the disease progresses, individuals may experience significant memory loss, impaired judgment, and difficulties with daily tasks. In the later stages, people with AD may lose the ability to converse or respond to their environment [6].
Parkinson’s disease [7] (PD) is a chronic and progressive neurodegenerative disorder that primarily affects the movement of individuals. It is the second most common neurodegenerative disease after AD. PD is characterized by motor symptoms such as tremors, rigidity, and bradykinesia [8]. A combination of genetic and environmental factors causes it. Some cases of PD are associated with mutations of the (PARK2) gene [9].
While there is currently no cure for AD and PD, various treatments and interventions can help manage symptoms and improve the quality of life for individuals with the condition [2]. These may include medication to temporarily improve cognitive function or manage behavioral symptoms and non-drug approaches such as cognitive stimulation, physical exercise, and support from caregivers [2,10,11].
Current studies focus on understanding the disease mechanism, i.e., ongoing research to uncover the molecular and cellular mechanisms involved in the development of complex disease [12]. The complete elucidation of these mechanisms may suggest biomarkers for the early detection of the disease and identification of potential drug targets.
Such studies require a model to represent association among genes and protein related to diseases in order to discover disrupted mechanisms related to diseases. Network sciences and in particular protein–protein interaction (PPI) networks may represent a useful framework to shed light on disease mechanisms [13,14,15]. PPI networks are networks whose nodes are proteins and edges among them represent their biochemical associations. Many studies based on PPI networks obtained significant results, discovering disease complexities at the protein and gene levels [16,17,18]. In particular, PPI networks have been used to transfer knowledge among different species, i.e., from models to complex organisms [19], if proteins are conserved among different species [20].
C. elegans is a widely used model organism in biological research due to its well-characterized and straightforward anatomy. Although C. elegans does not develop any neurodegenerative diseases because it lacks certain key features of the human brain, it has been used to study various neurodegenerative disorders, including AD and PD [21,22,23].
Several genes associated with AD in humans have orthologs in C. elegans. For example, the amyloid precursor protein (APP) gene, which plays a crucial role in forming amyloid plaques in Alzheimer’s disease, has an ortholog in C. elegans called apl-1. Similarly, ptl-1 protein is the ortholog of human TAU protein. Similarly, different PD genes have orthologues in C. elegans, for example parkin ortholog, PDR-1. Typically, the C. elegans PPI network for studying neurodegenerative disorders is built by combining experimental and computational methods. Once the PPI network is constructed, analysis can be conducted on the network topology, i.e., to identify some key proteins or modules involved in neurodegenerative disorders-related processes or by performing a comparison among networks of different organisms.
A computational technique widely used for comparative analysis of PPI networks between species is Network Alignment (NA) [24,25,26]. NA algorithms enable us to elucidate the conservation among the evolution of molecular machinery or, similarly, the conservation of protein complexes among species by discovering common subnetworks (obtained with the Local NA approach) or whole similarities (obtained with the Global NA approach).
In [27], Apostolakou et at. applied the Global NA method to Alzheimer-related PPI networks in humans and C. elegans to find common biological pathways conserved in two organisms involved in AD.
To the best of our knowledge, using Local NA methods for comparison and analysis of neurodegenerative disease PPI networks remains unexplored.
Starting from these considerations, in this work, we apply Local NA to analyze PPI networks to discover proteins related to neurodegenerative disease in model organisms, like C. elegans, and in humans.
For this goal, we build in silico C. elegans and human PPI networks associated with AD and PD, and we applied the L-HetNetAligner algorithm to build a local alignment among two PPI networks. To our knowledge, this is the first study that applies the local alignment to compare PPI networks to study neurodegenerative disease. The results show that the extracted modules, representing the local alignment, are functionally related and present a higher biological relevance than by chance. The rest of this paper is organized as follows. Section 2 discusses the theoretical background. Section 4 presents the approach and discusses the results. Finally, Section 6 concludes the paper.

2. Related Work

2.1. Network Comparison

Several algorithms and techniques exist that can be used to assess similarities or differences among networks [28]. For instance, Graph Edit Distance is used to find a minimum cost set of operations (node and edge deletions or insertions) to transform a graph into another [29]. A comparison of the topological parameters of the graphs (degree distribution, clustering coefficient, average path length) may provide some insights into the differences between networks [30]. Comparison of mesoscale parameters, such as spectra of the graphs, communities as well as network motifs, may reveal differences at different levels [31,32].

2.2. Network Alignment Algorithms

Network alignment (NA) is a computational technique widely used for comparative analysis of PPI networks between species to predict evolutionary conserved components or sub-structures at a system data level.
Considering the interaction networks, the mapping from a specie into another one resides on the definition of such mapping, i.e., how to state that two proteins of two different species can be associated [33]. The correct choice of the association is a key problem [34,35]. Usually, the associated proteins should be orthologs, mainly when the alignment is used to explain evolutionary relationships. The definition of orthologs is often a too-restrictive criterion, so most algorithms try to choose the correspondent proteins based on their sequence similarity and eventually introduce other biological considerations.
Thus, the network alignment is a common problem that requires searching for a node mapping that best fits one network into another [36]. The problem of graph alignment consists of the mapping between two or more graphs to maximize an associated cost function that represents the similarity among nodes or edges. Formally, let G 1 = { V 1 , E 1 } and G 2 = { V 2 , E 2 } two graphs, where V 1 , 2 are sets of nodes and E 1 , 2 are sets of edges, the graph alignment problem consists of finding an alignment function (or a mapping) f : V 1 V 2 such that the similarity between mapped entities is maximized. Thus, the alignment problem relies on the (sub)-graph isomorphism problem, which is computationally NP-hard in some general formulations, and heuristic methods should resolve it. The similarity between the graphs is defined by a cost function, Q ( G 1 , G 2 , f ) , also known as the quality of the alignment. Q expresses the similarity among two input graphs on a specific alignment f, and the formulation of Q strongly influences the mapping strategy [37]. In the literature, there exist different network alignment algorithms that investigate approximate solutions. The network alignment algorithms can be categorized as local or global alignment.
Local network alignment (LNA) algorithms search multiple small subnetworks with high similarity among input networks by producing a many-to-many node mapping. These subnetworks are conserved patterns of interaction that can correspond to conserved motifs or patterns of activities. LNA algorithms employ a two-step schema to build the alignment. At first, starting from a list of seed nodes selected from biological considerations, the algorithms integrate all the information in an auxiliary structure, usually called an alignment graph. Then they mined the graph for exciting evidence regions. The literature contains many network alignment algorithms to compare classical networks, also called homogeneous, due to the nodes representing a single entity. Otherwise, the network alignment algorithms are developed for specific networks, such as heterogeneous, i.e., networks where the nodes can represent different entities.
For example, L-HetNetAligner [38] is a local network alignment algorithm for comparing heterogeneous networks. L-HetNetAligner takes two heterogeneous networks and a set of similarities between node pairs as the input. Then, L-HetNetAligner creates the nodes of the alignment graph. Each node of the alignment graph represents a pair of nodes of input networks. The input similarity relationships guide the selection of node pairs. Therefore, each node is matched with the most similar node of the other network, and each node of the alignment graph represents a pair of similar nodes from the input networks. Once all nodes have been added to the graph, L-HetNetAligner creates the edges of the alignment graph. Edges are weighted according to the colors of corresponding nodes and topological considerations according to seven parameters: δ node distance related to the length of the shortest connecting path) heterogeneous match that set the weight of edges connecting the nodes in both input networks having the different colour, homogeneous match that set the weight of edges connecting the nodes in both input networks having the same color, heterogeneous mismatch that set the weight of edges connecting the nodes in a single network having the different color, homogeneous match that set the weight of edges connecting the nodes in a single network having the same color, heterogeneous gap that put the weight of edges connecting the adjacent nodes in a single network and they are at a distance lower than δ in the other network and all the nodes having the different color, homogeneous gap that set the weight of edges connecting the adjacent nodes in a single network and they are at a distance lower than δ in the other network and all the nodes having the same color. See [38] for complete details. The analysis of the input networks determines the presence of an edge in the alignment graph. Once the alignment graph is built, we use the Markov clustering algorithm (MCL) [39].

2.3. Semantic Similarity Measures

Biological knowledge can be defined via mathematical formulas that are useful to perform several tasks; for instance, we may use these for classification and comparison. In this context, a semantic similarity measure (i.e., SSM) is a function calculated between biological objects based, e.g., on their related terms. A similarity score is a metric defined over a set of features (e.g., terms), where the resulting distance is based on the likeness of their semantic meaning. For example, in a graph model consisting of genes (i.e., nodes) and their interactions (i.e., edges), we may calculate the similarity based on sub-structure matching or vector similarity. The latter denotes the similarity of two nodes measuring the distance between their associated vectors; the same approach may be mutually used for dissimilarity [40].
The Information Content (IC) method computes the similarity between two terms in according to their Most Informative Common Ancestor (MICA) terms, or Closest Common Ancestor (CCA) terms. We describe the following well-known IC-based measures: Resnik, Lin, and Jiang. The Resnik’s similarity measure [41] (i.e., s i m r e s ) of two terms T 1 and T 2 of GO is based on the determination of the IC of their MICA.
s i m R e s = I C ( M I C A ( T 1 , T 2 ) )
It mainly considers the common ancestor, and it does not take into account the distance among the compared terms and the shared ancestor.
Lin’s measure [42] (i.e., s i m L i n ) assigns higher weights to more frequent categories in case of matches, and lower weights to less frequent ones in case of mismatches:
s i m L i n = I C ( M I C A ( T 1 , T 2 ) I C ( T 1 ) + I C ( T 2 )
Jiang’s measure [43] (i.e., s i m J C ) takes into account the distance among terms by calculating the following formula:
s i m J C = 1 I C ( T 1 ) + I C ( T 2 ) 2 I C ( M I C A ( T 1 , T 2 )

3. Materials and Methods

3.1. Dataset: AD-Related PPI Networks

We queried the STRING [44] database to build the PPI network related to APP and TAU proteins (human network hereafter), and the PPI network related to apl-1 and ptl-1 (C. elegans network hereafter). We set the following parameters in the STRING database: (i) all interactions, (ii) score greater than 0.7. We obtain a C. elegans network, which contains 33 nodes and 82 edges, while the human network has 41 nodes and 157 edges. We used the OrthoList2 database [45] to find the C. elegans orthologs of human proteins.

3.2. Dataset: PD-Related PPI Networks

We queried the STRING [44] database to build the PPI network related to PARK-2 protein (human network hereafter), and the PPI network related to PDR-1 (C. elegans network hereafter). We obtain a C. elegans network, which contains 51 nodes and 438 edges, while the human network has 51 nodes and 651 edges. We used the OrthoList2 database [45] to find the C. elegans orthologs of human proteins.

3.3. Local Network Alignmnent

We built the local alignment among C. elegans network and human network AD-related and PD-related by applying the L-HetNetAligner algorithm. L-HetNetAligner takes as input the PPI networks and the orthologs proteins extracted as seed nodes. We set L-HetNetAligner parameters as follows: delta = 2, homogeneous match = 1, heterogeneous match = 0.9, homogeneous mismatch = 0.5, heterogeneous mismatch = 0.4, homogeneous gap = 0.2, heterogeneous gap = 0.1. Furthermore, we assigned a single color to the nodes of both input networks. We ran L-HetNetAligner on a Linux machine with Intel Core i5 and 4 GB of RAM and the algorithm built both local alignments in 60 s.

4. Results

We applied L-HetNetAligner algorithm to build the local alignment among C. elegans network and AD-related and PD-related networks.
For AD, the output consists of local alignment as six relevant modules. Table 1 reports the number of proteins belonging to each module.
For PD, the output consists of local alignment as five relevant modules. Table 2 reports the number of proteins belonging to each module.
To evaluate the quality of the local alignment, we consider the biological relevance of the extracted module in terms of functional similarity, which is a measure of functional relatedness. We used the semantic similarity concept applied to Gene Ontology vocabularies [46]. Therefore, we computed the semantic similarity values of the extracted modules using the three semantic similarity measures: Resnik’s with the Best-Match Average (BMA) approach [47], Lin [42] and Wang [48]. We also chose Wang’s measure because is a hybrid measure that computes the semantic similarity by considering the best path (in terms of weighted edges) among the gene products that outperforms other semantic similarities by producing results closer to human expectations (see [48] complete details). Thus, we computed for each module the semantic similarity score by applying Resnik’s, Lin’s and Wang’s measures.
Table 3 and Table 4 report the values of semantic similarity of each module computed with three measures for AD and PD.
Furthermore, to demonstrate that high and, therefore, significant values of semantic similarity are due to the functional relationship of the proteins that form the modules of the local alignment and not by chance, we compared our results with respect to randomly generated alignments.
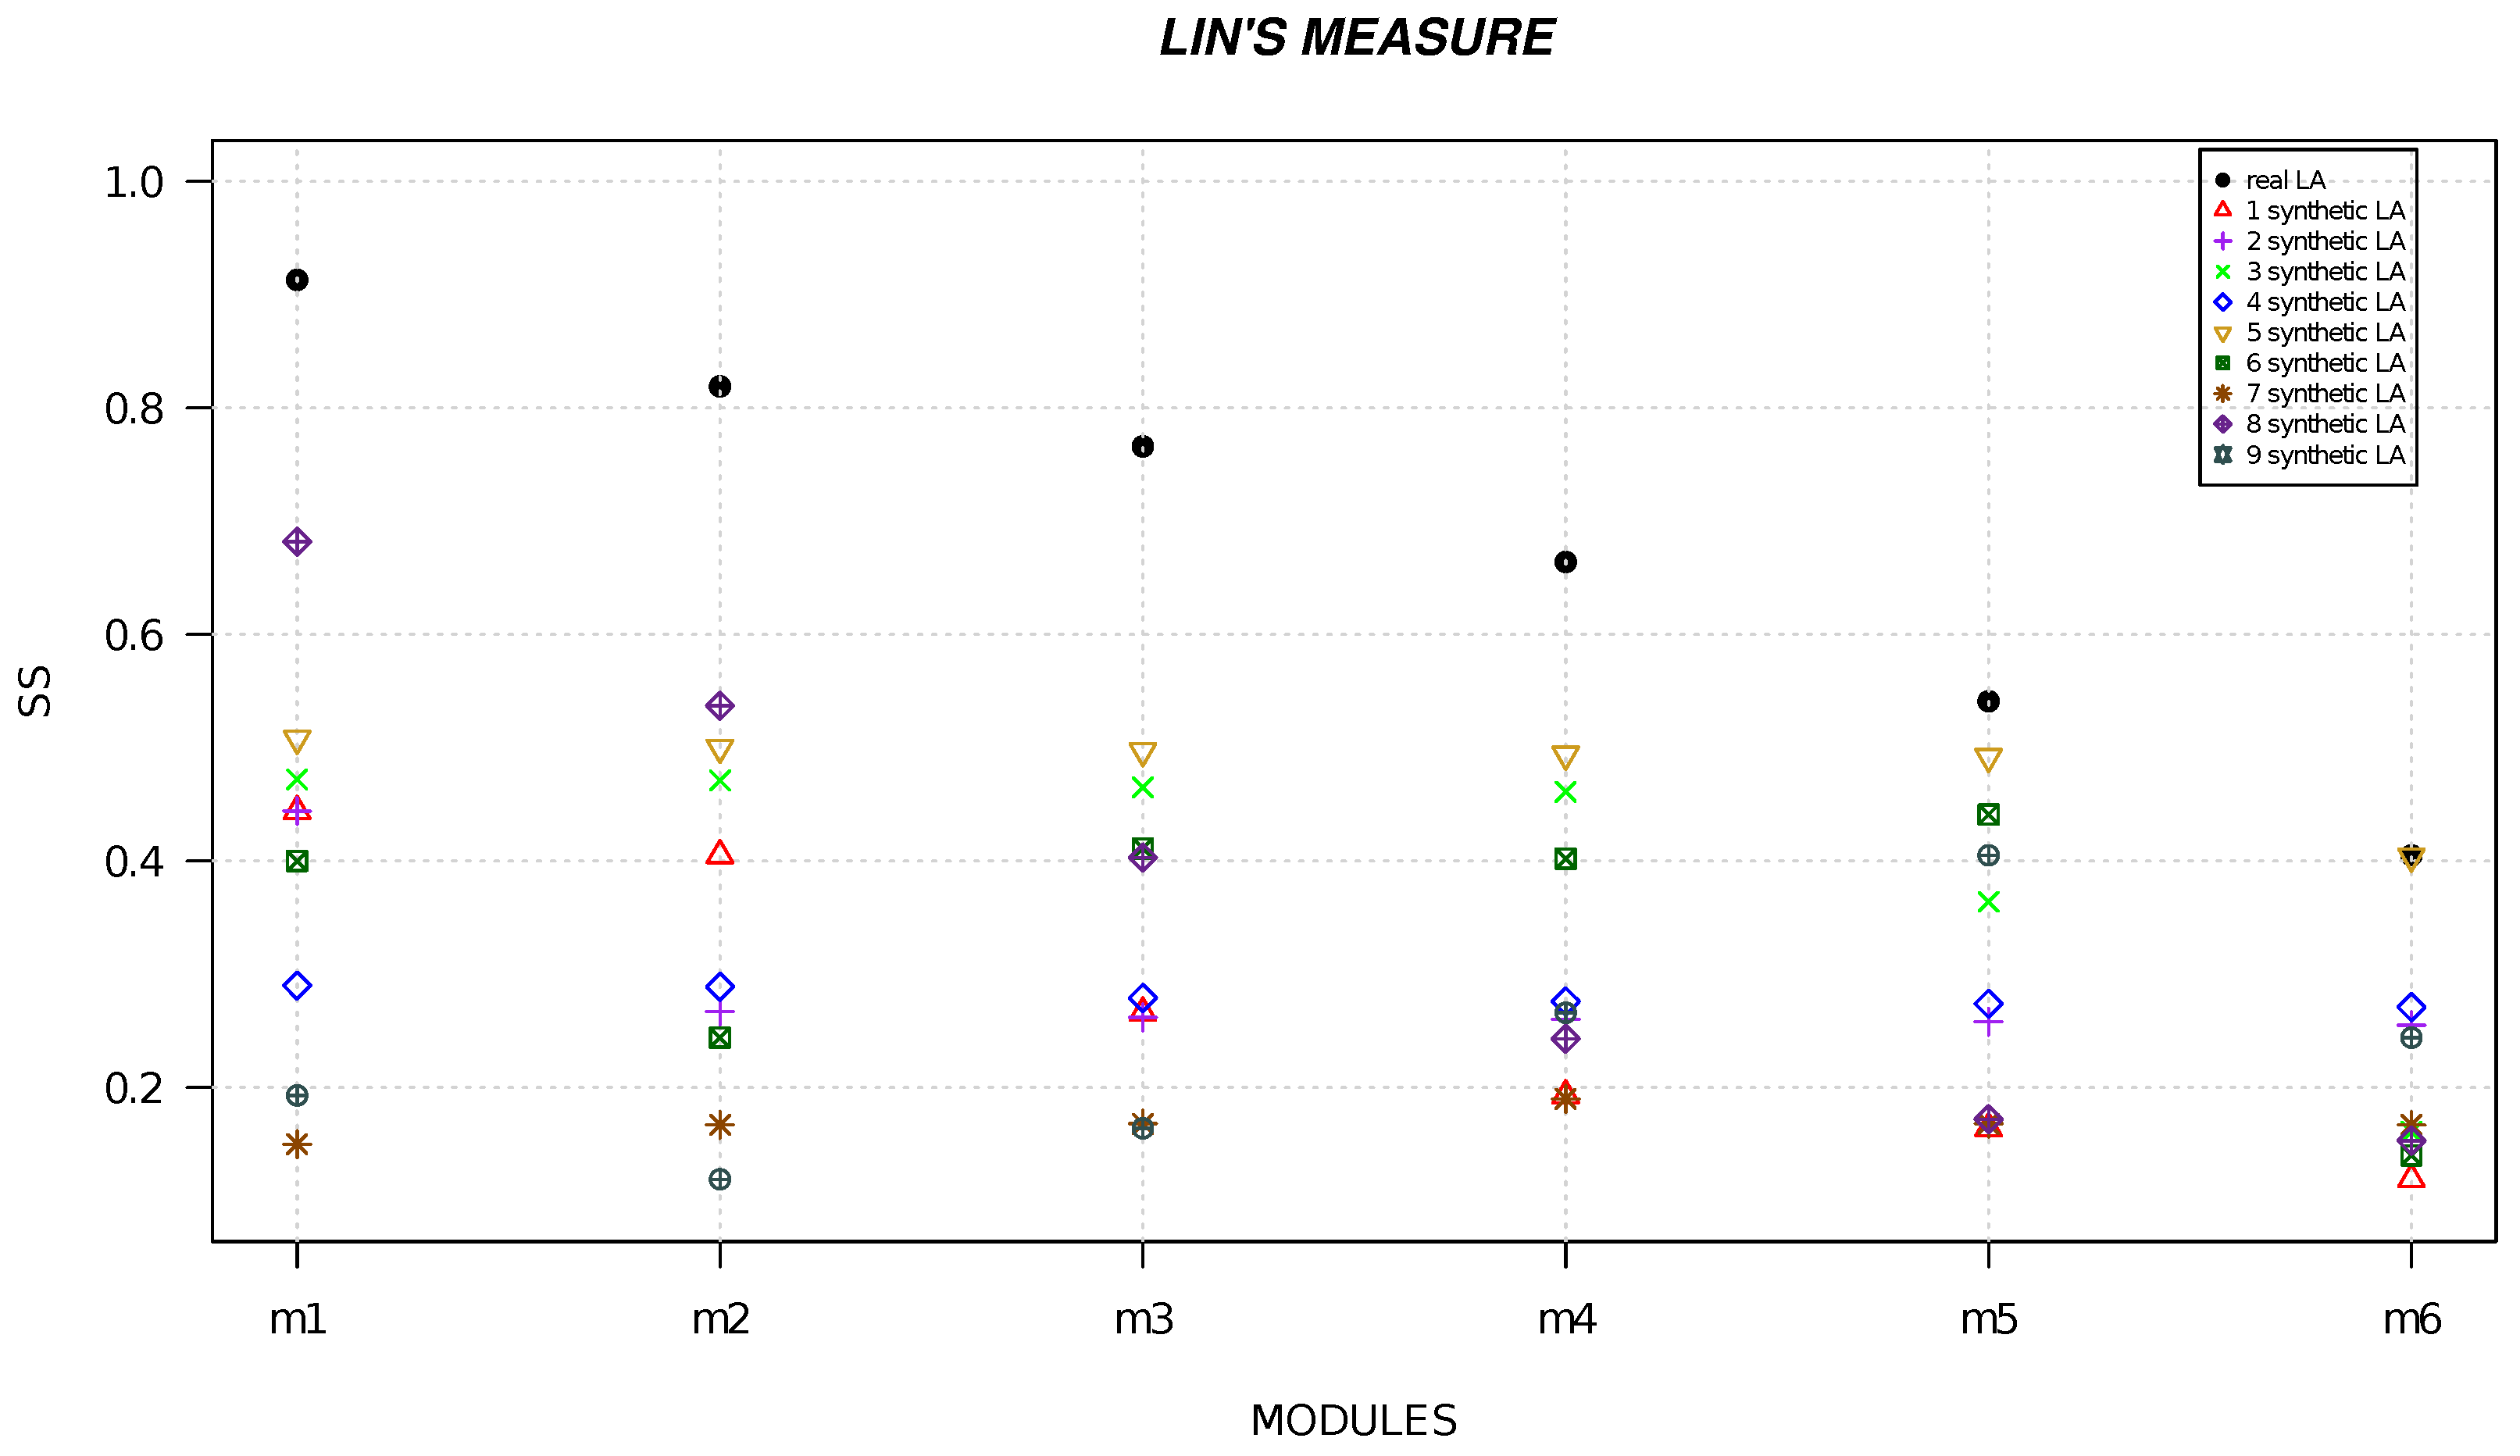
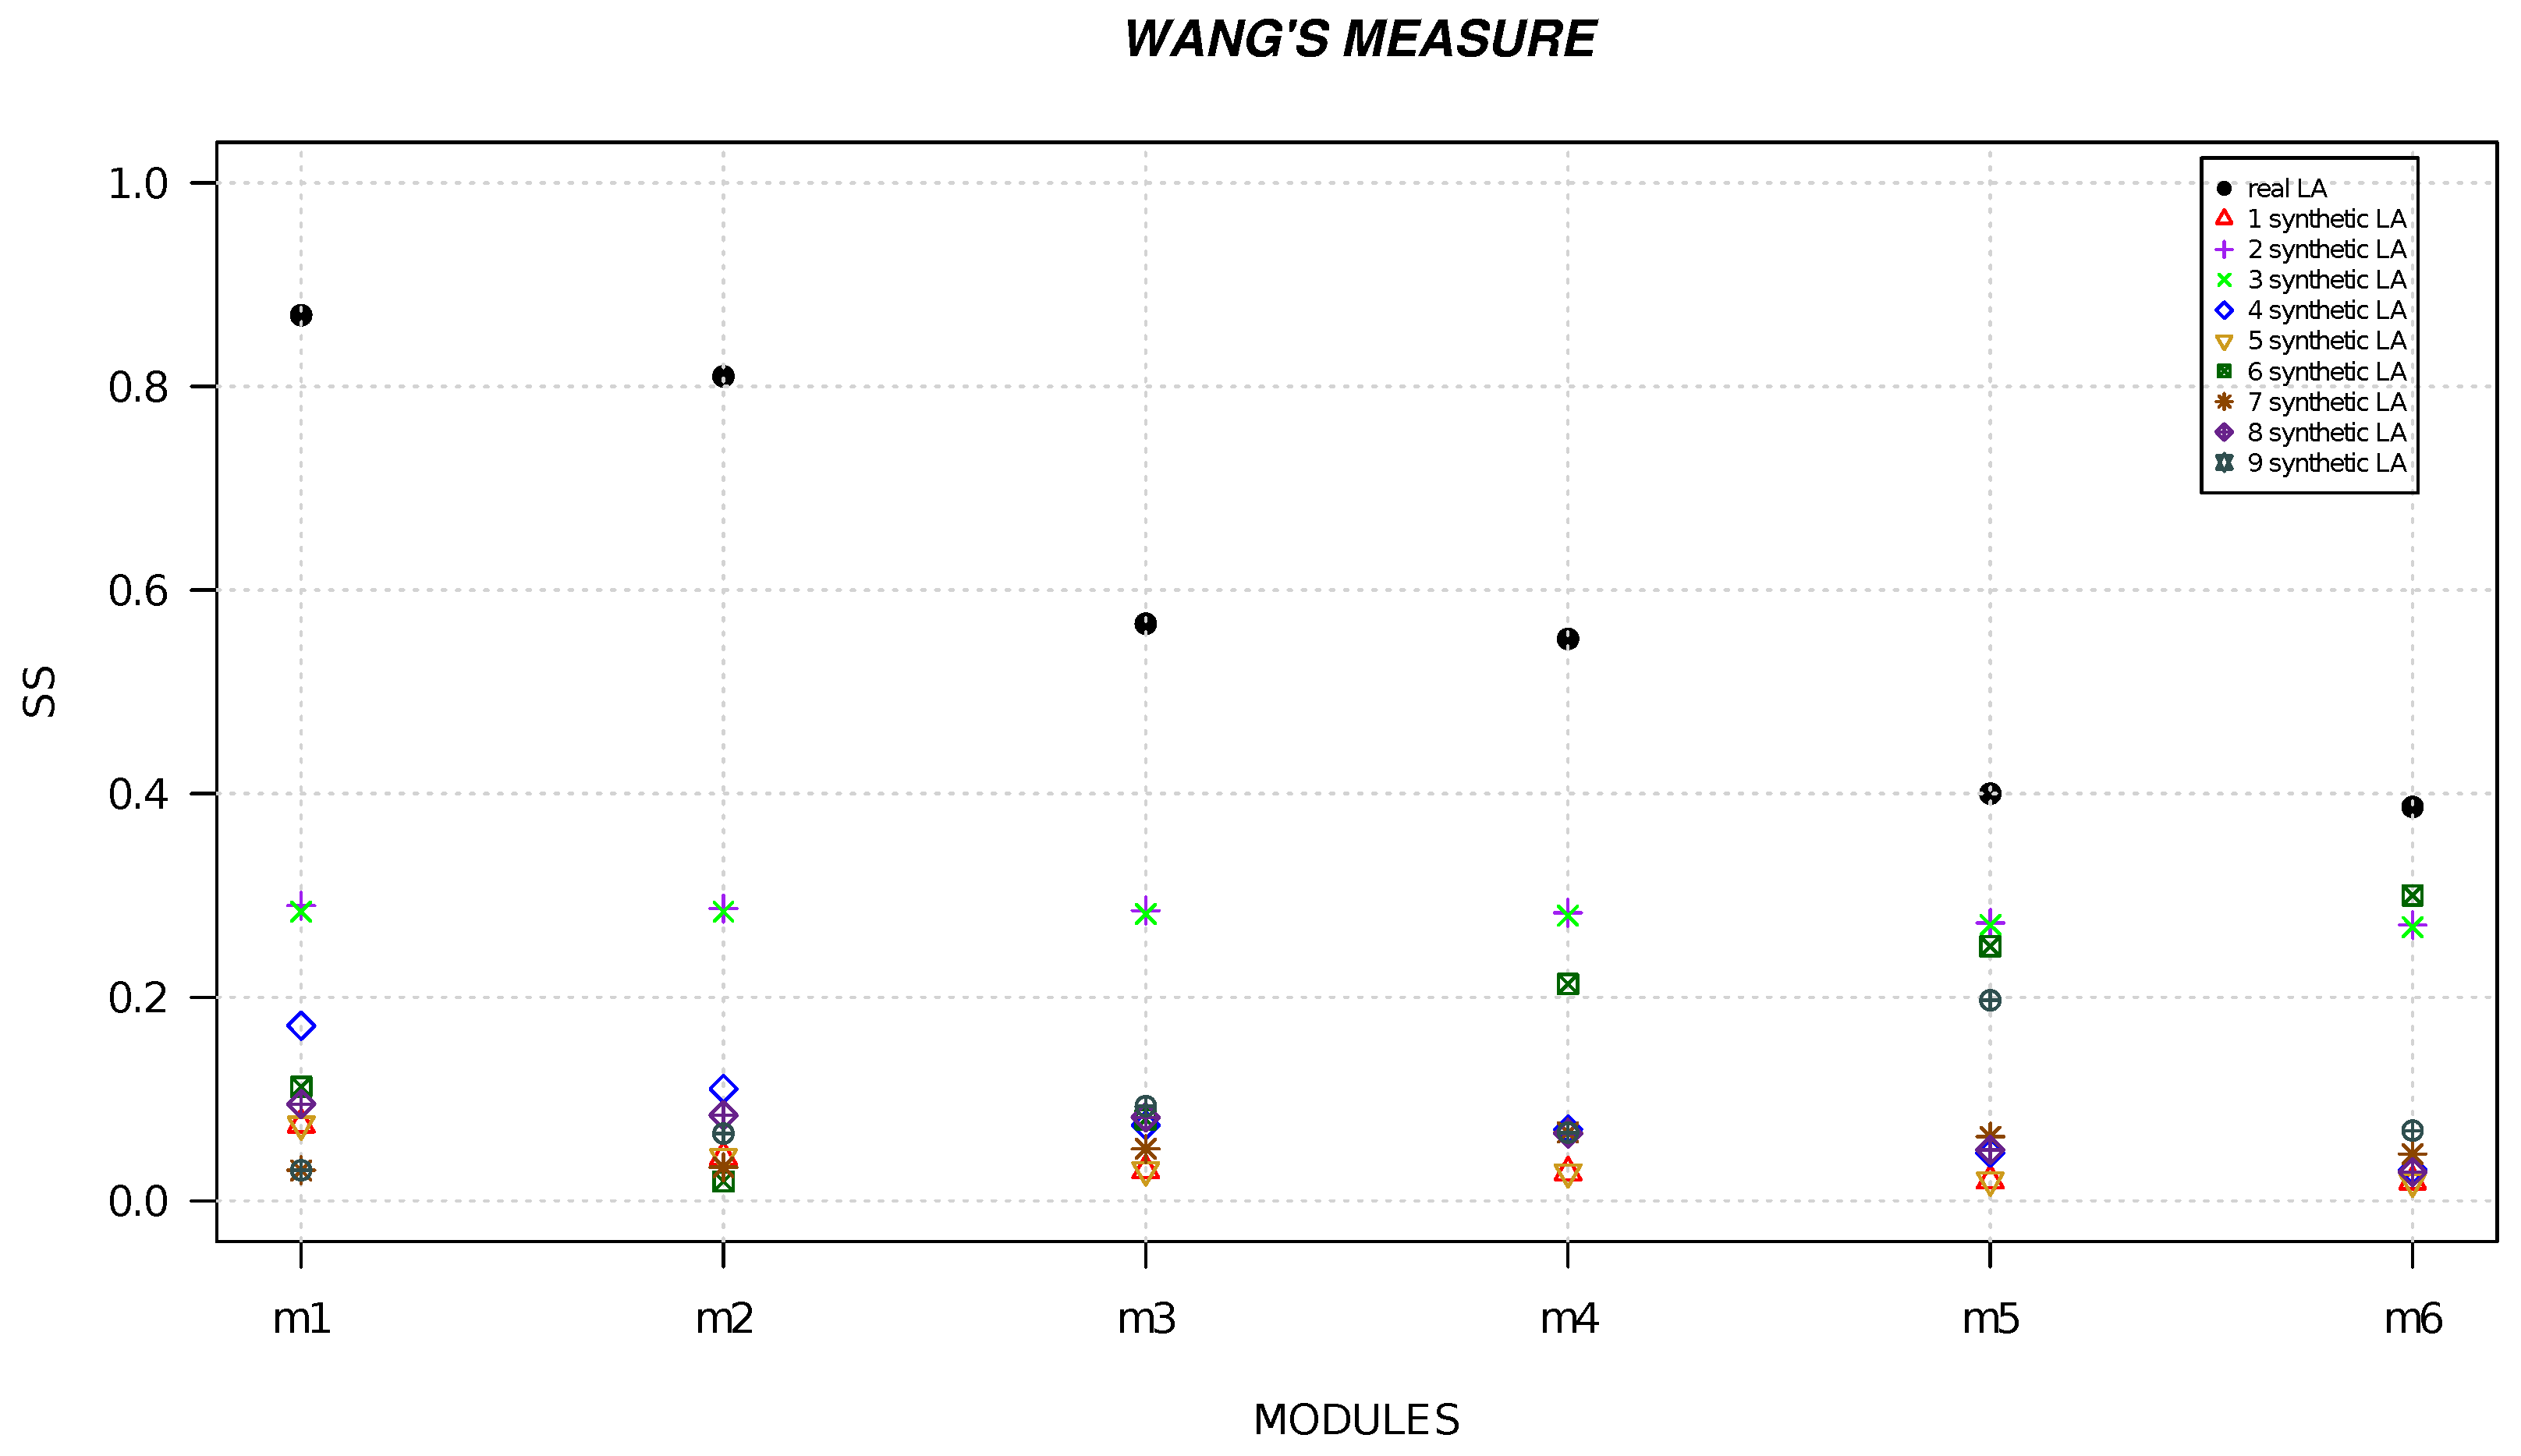
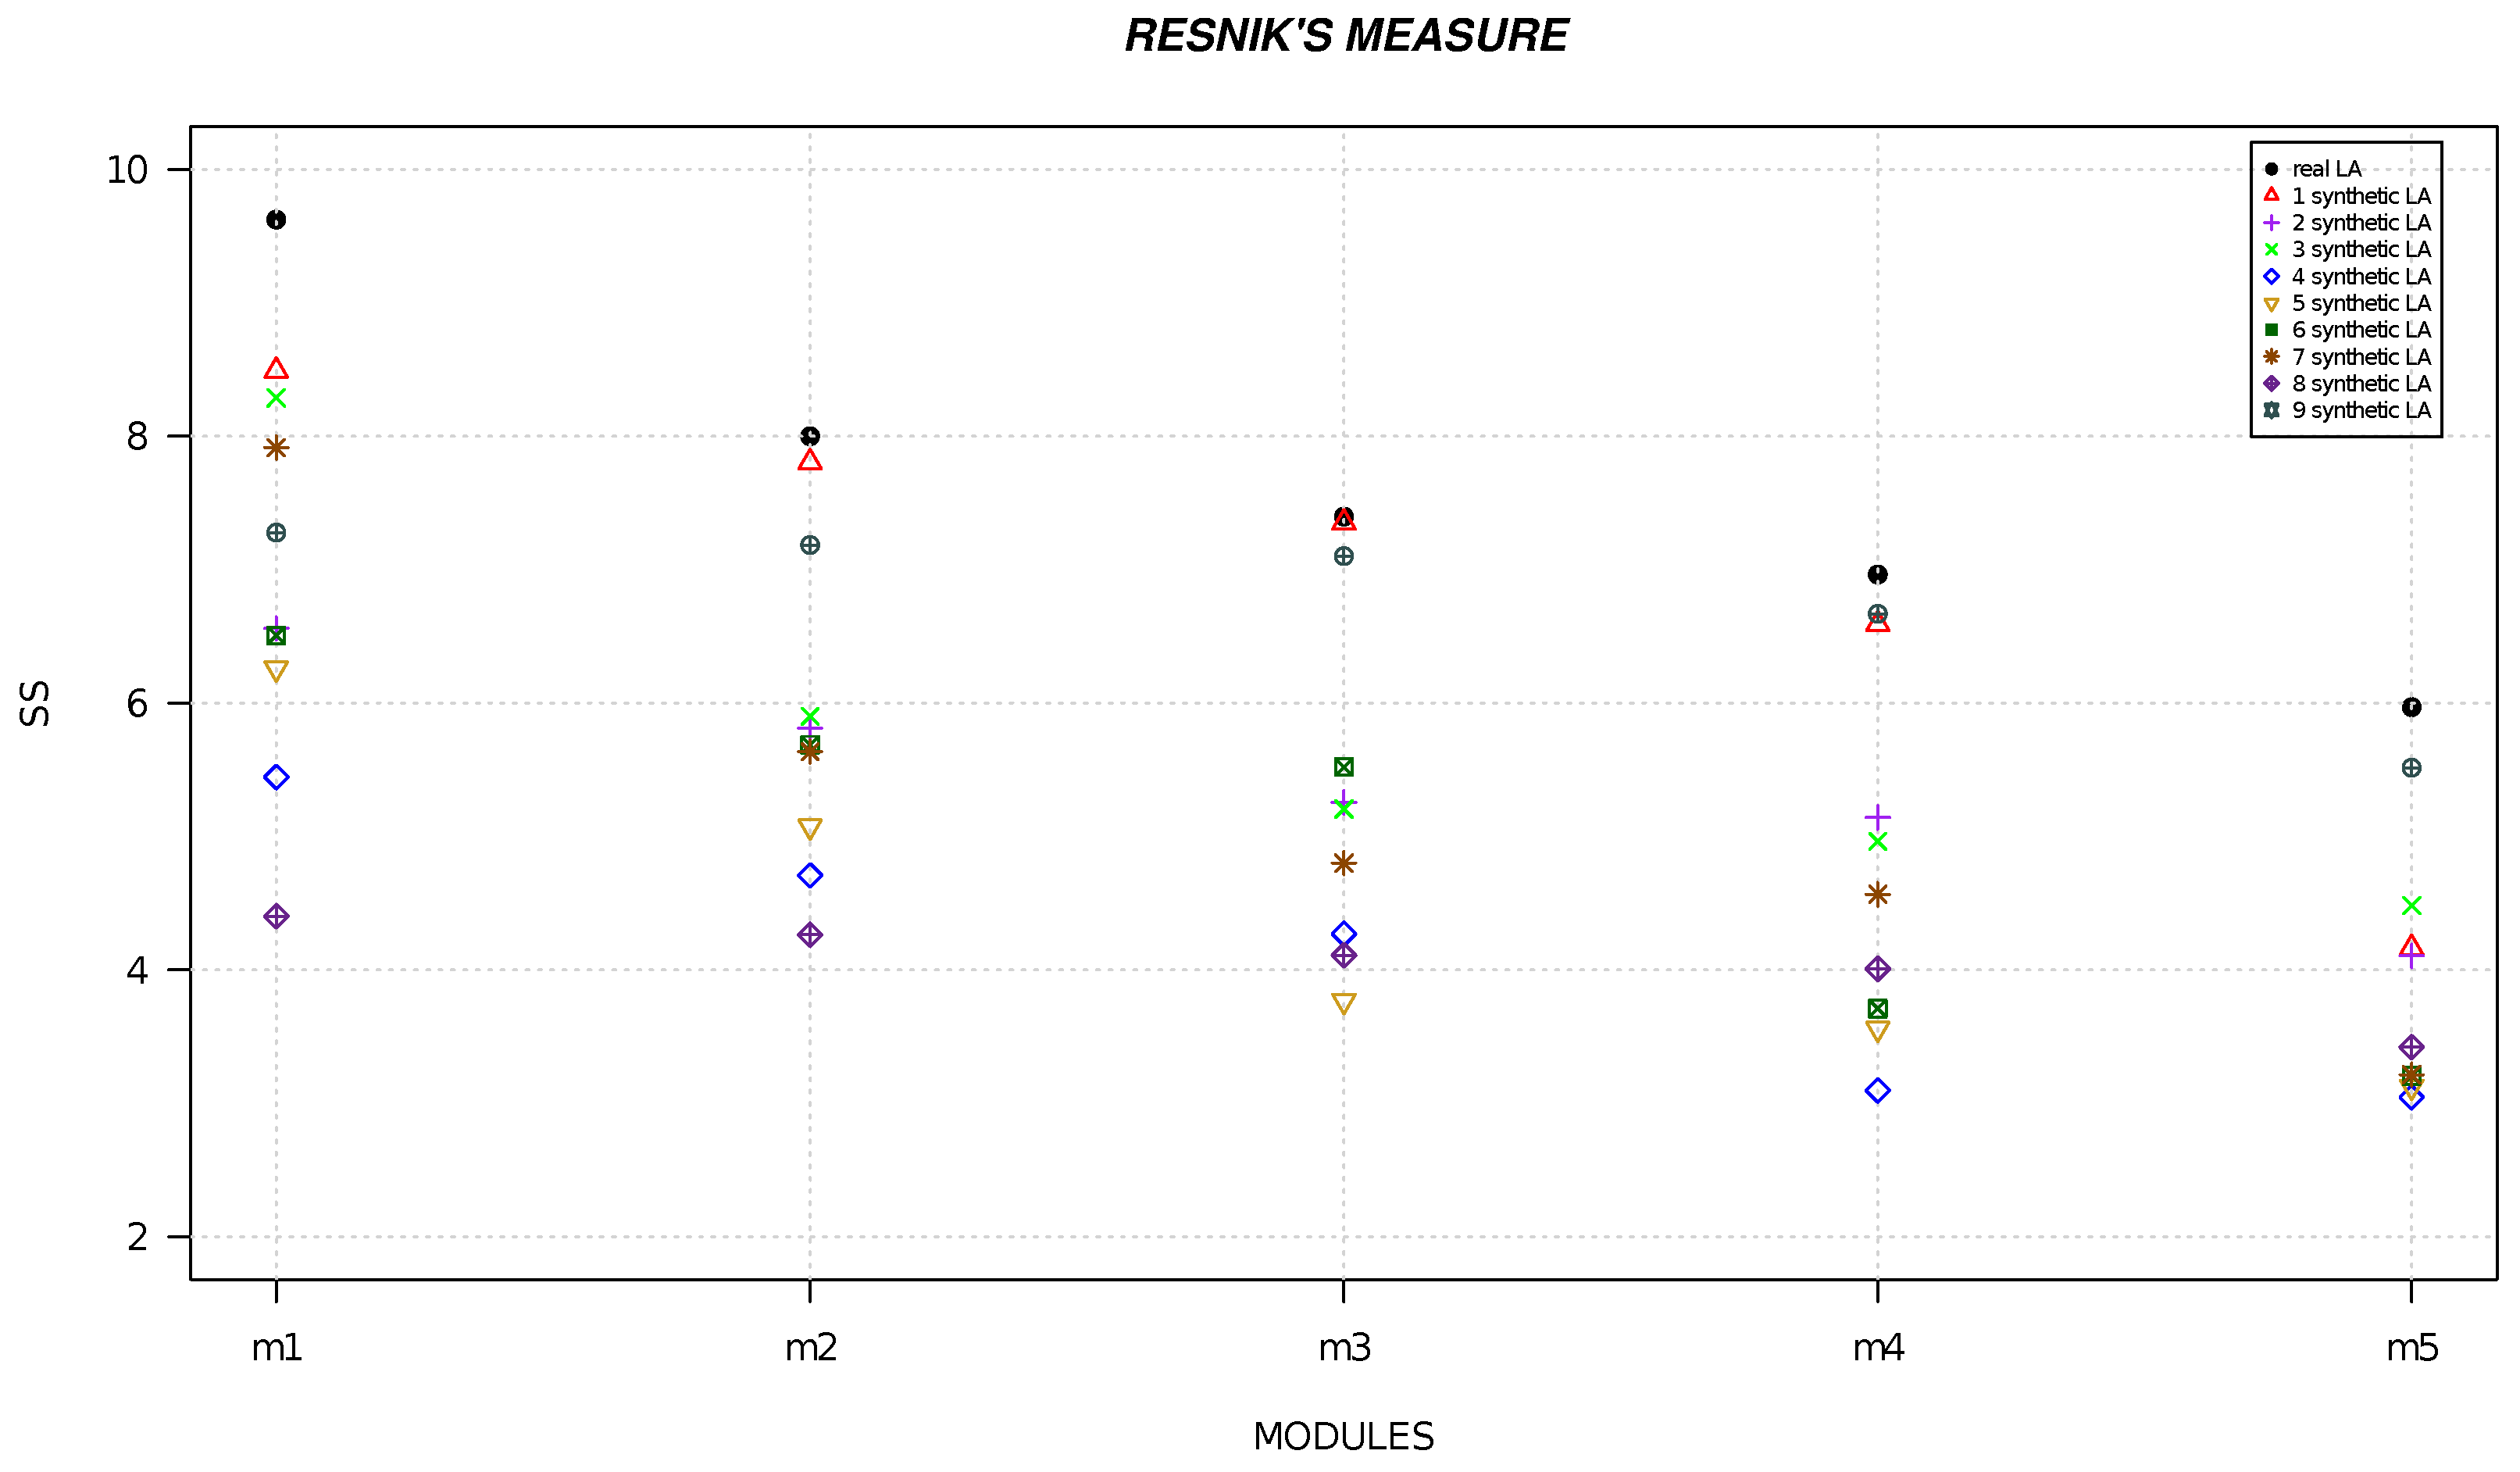
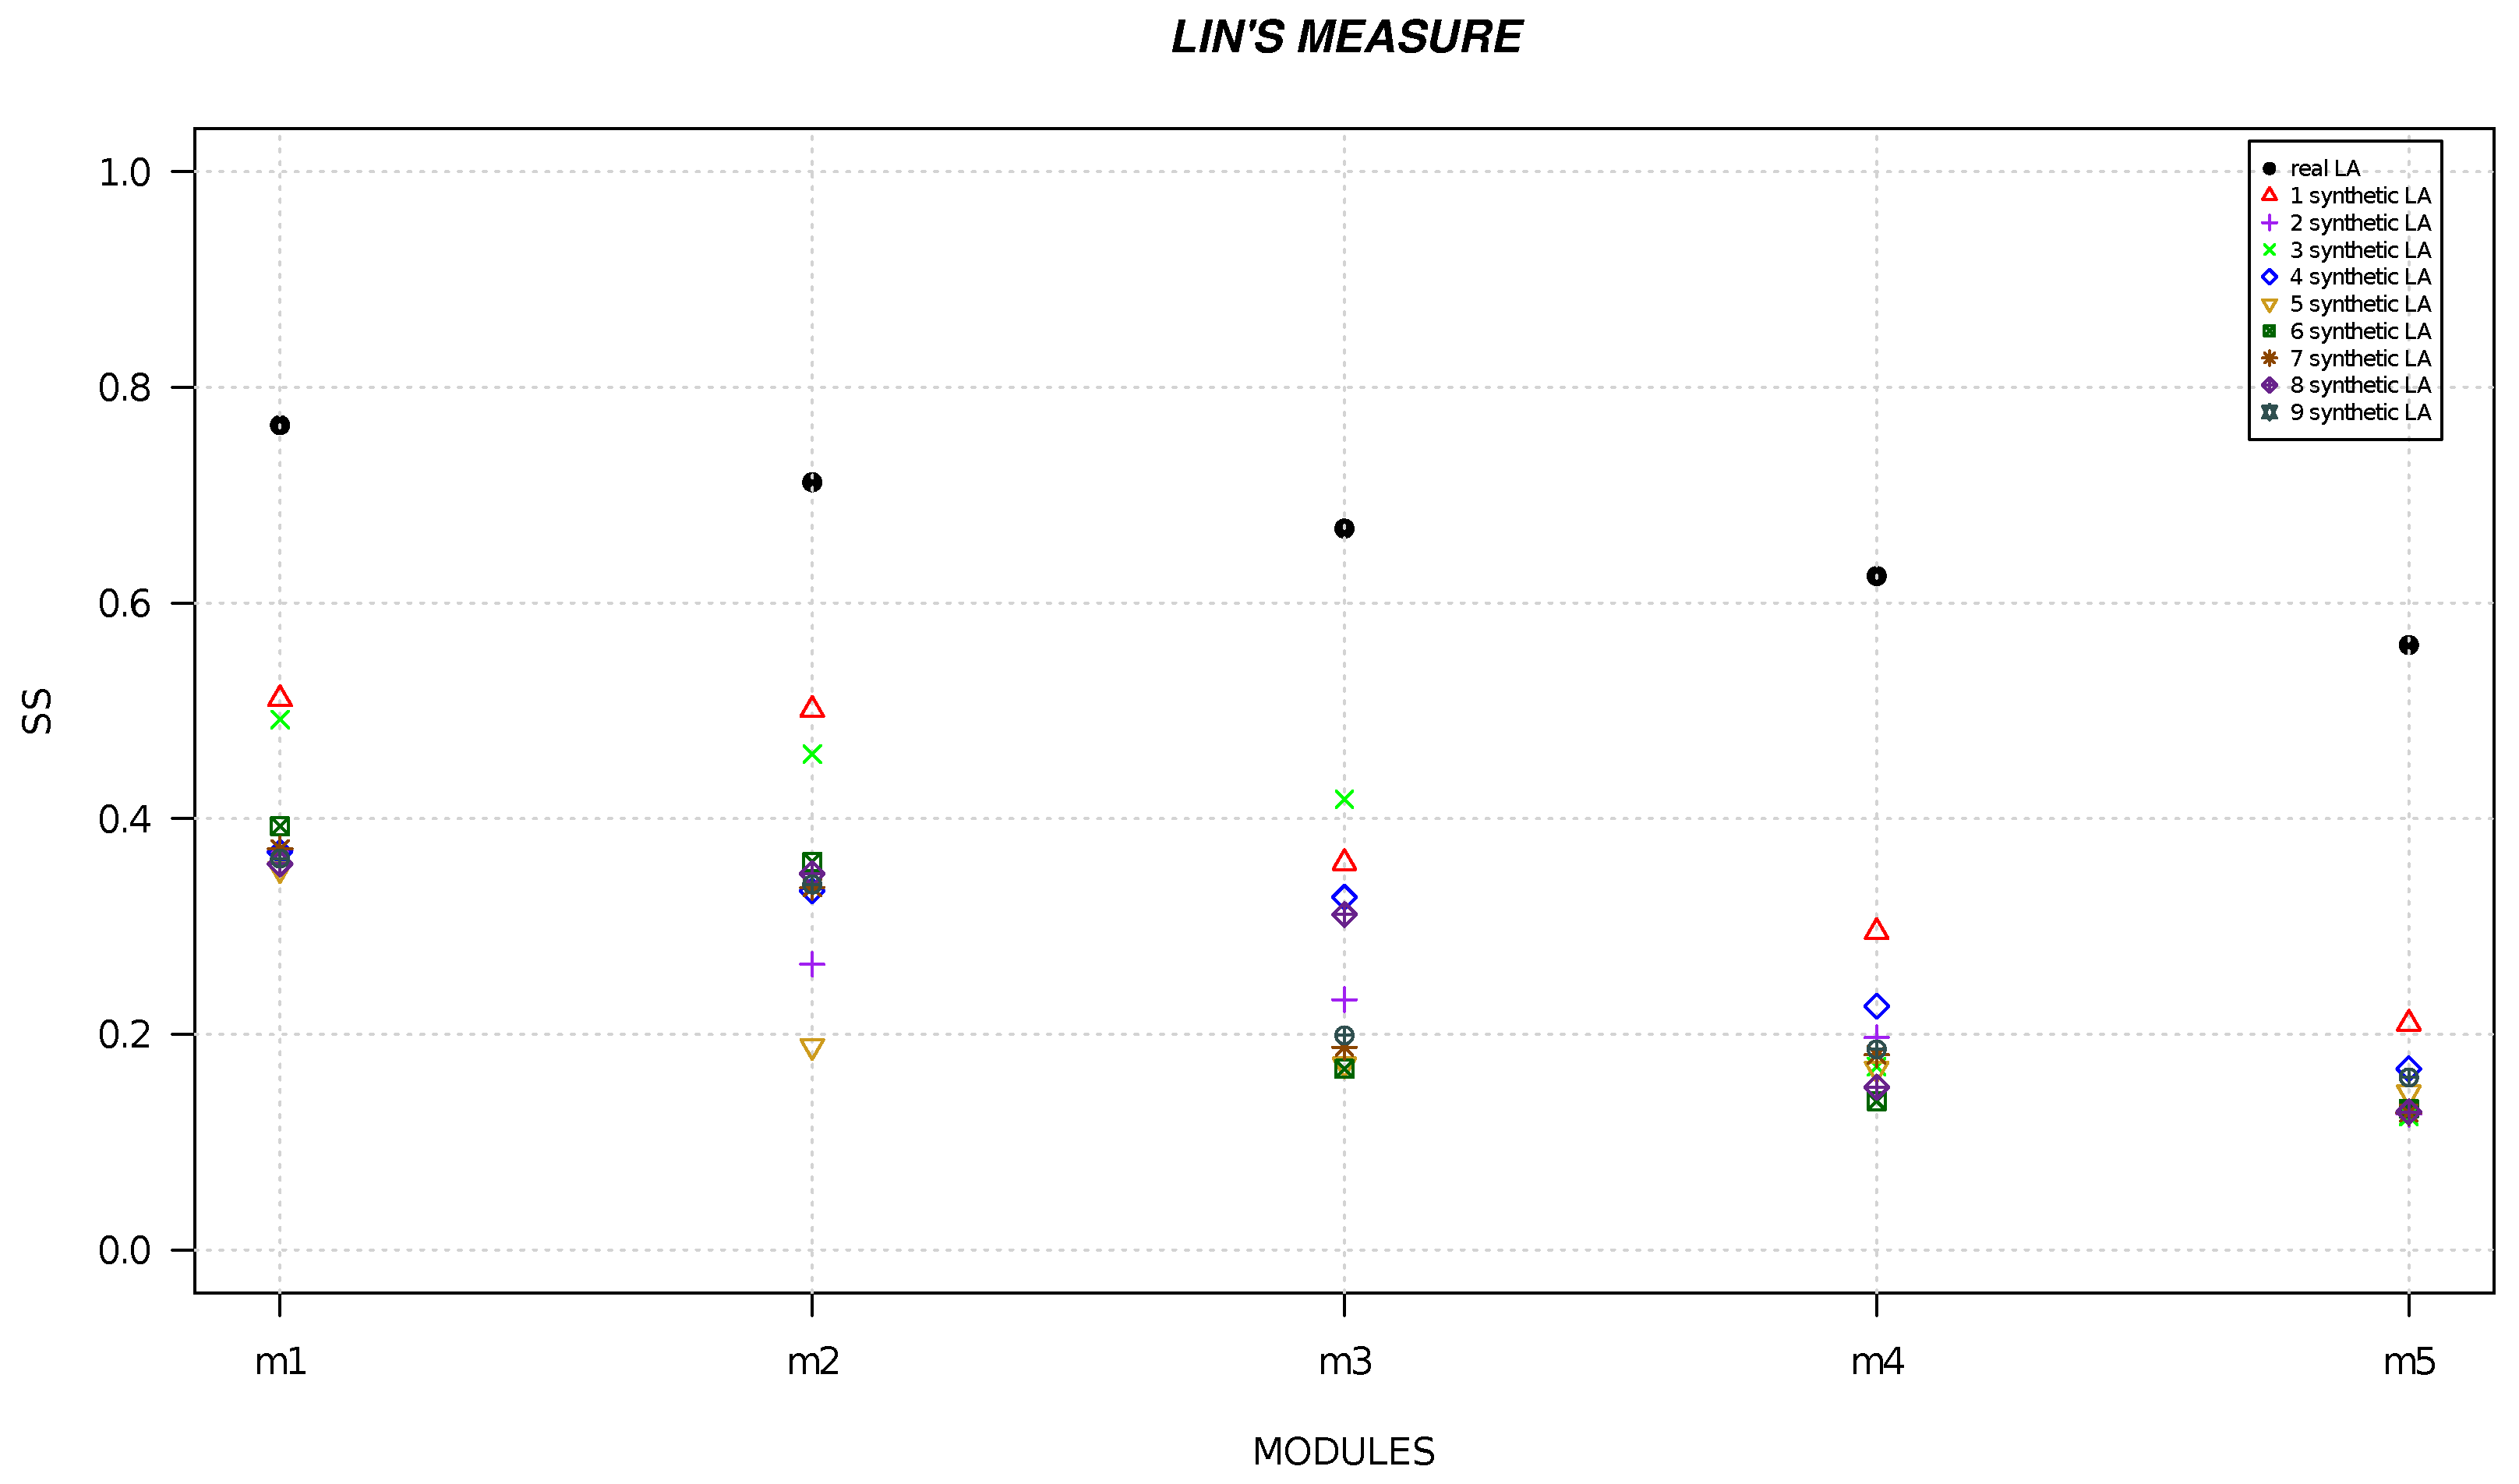
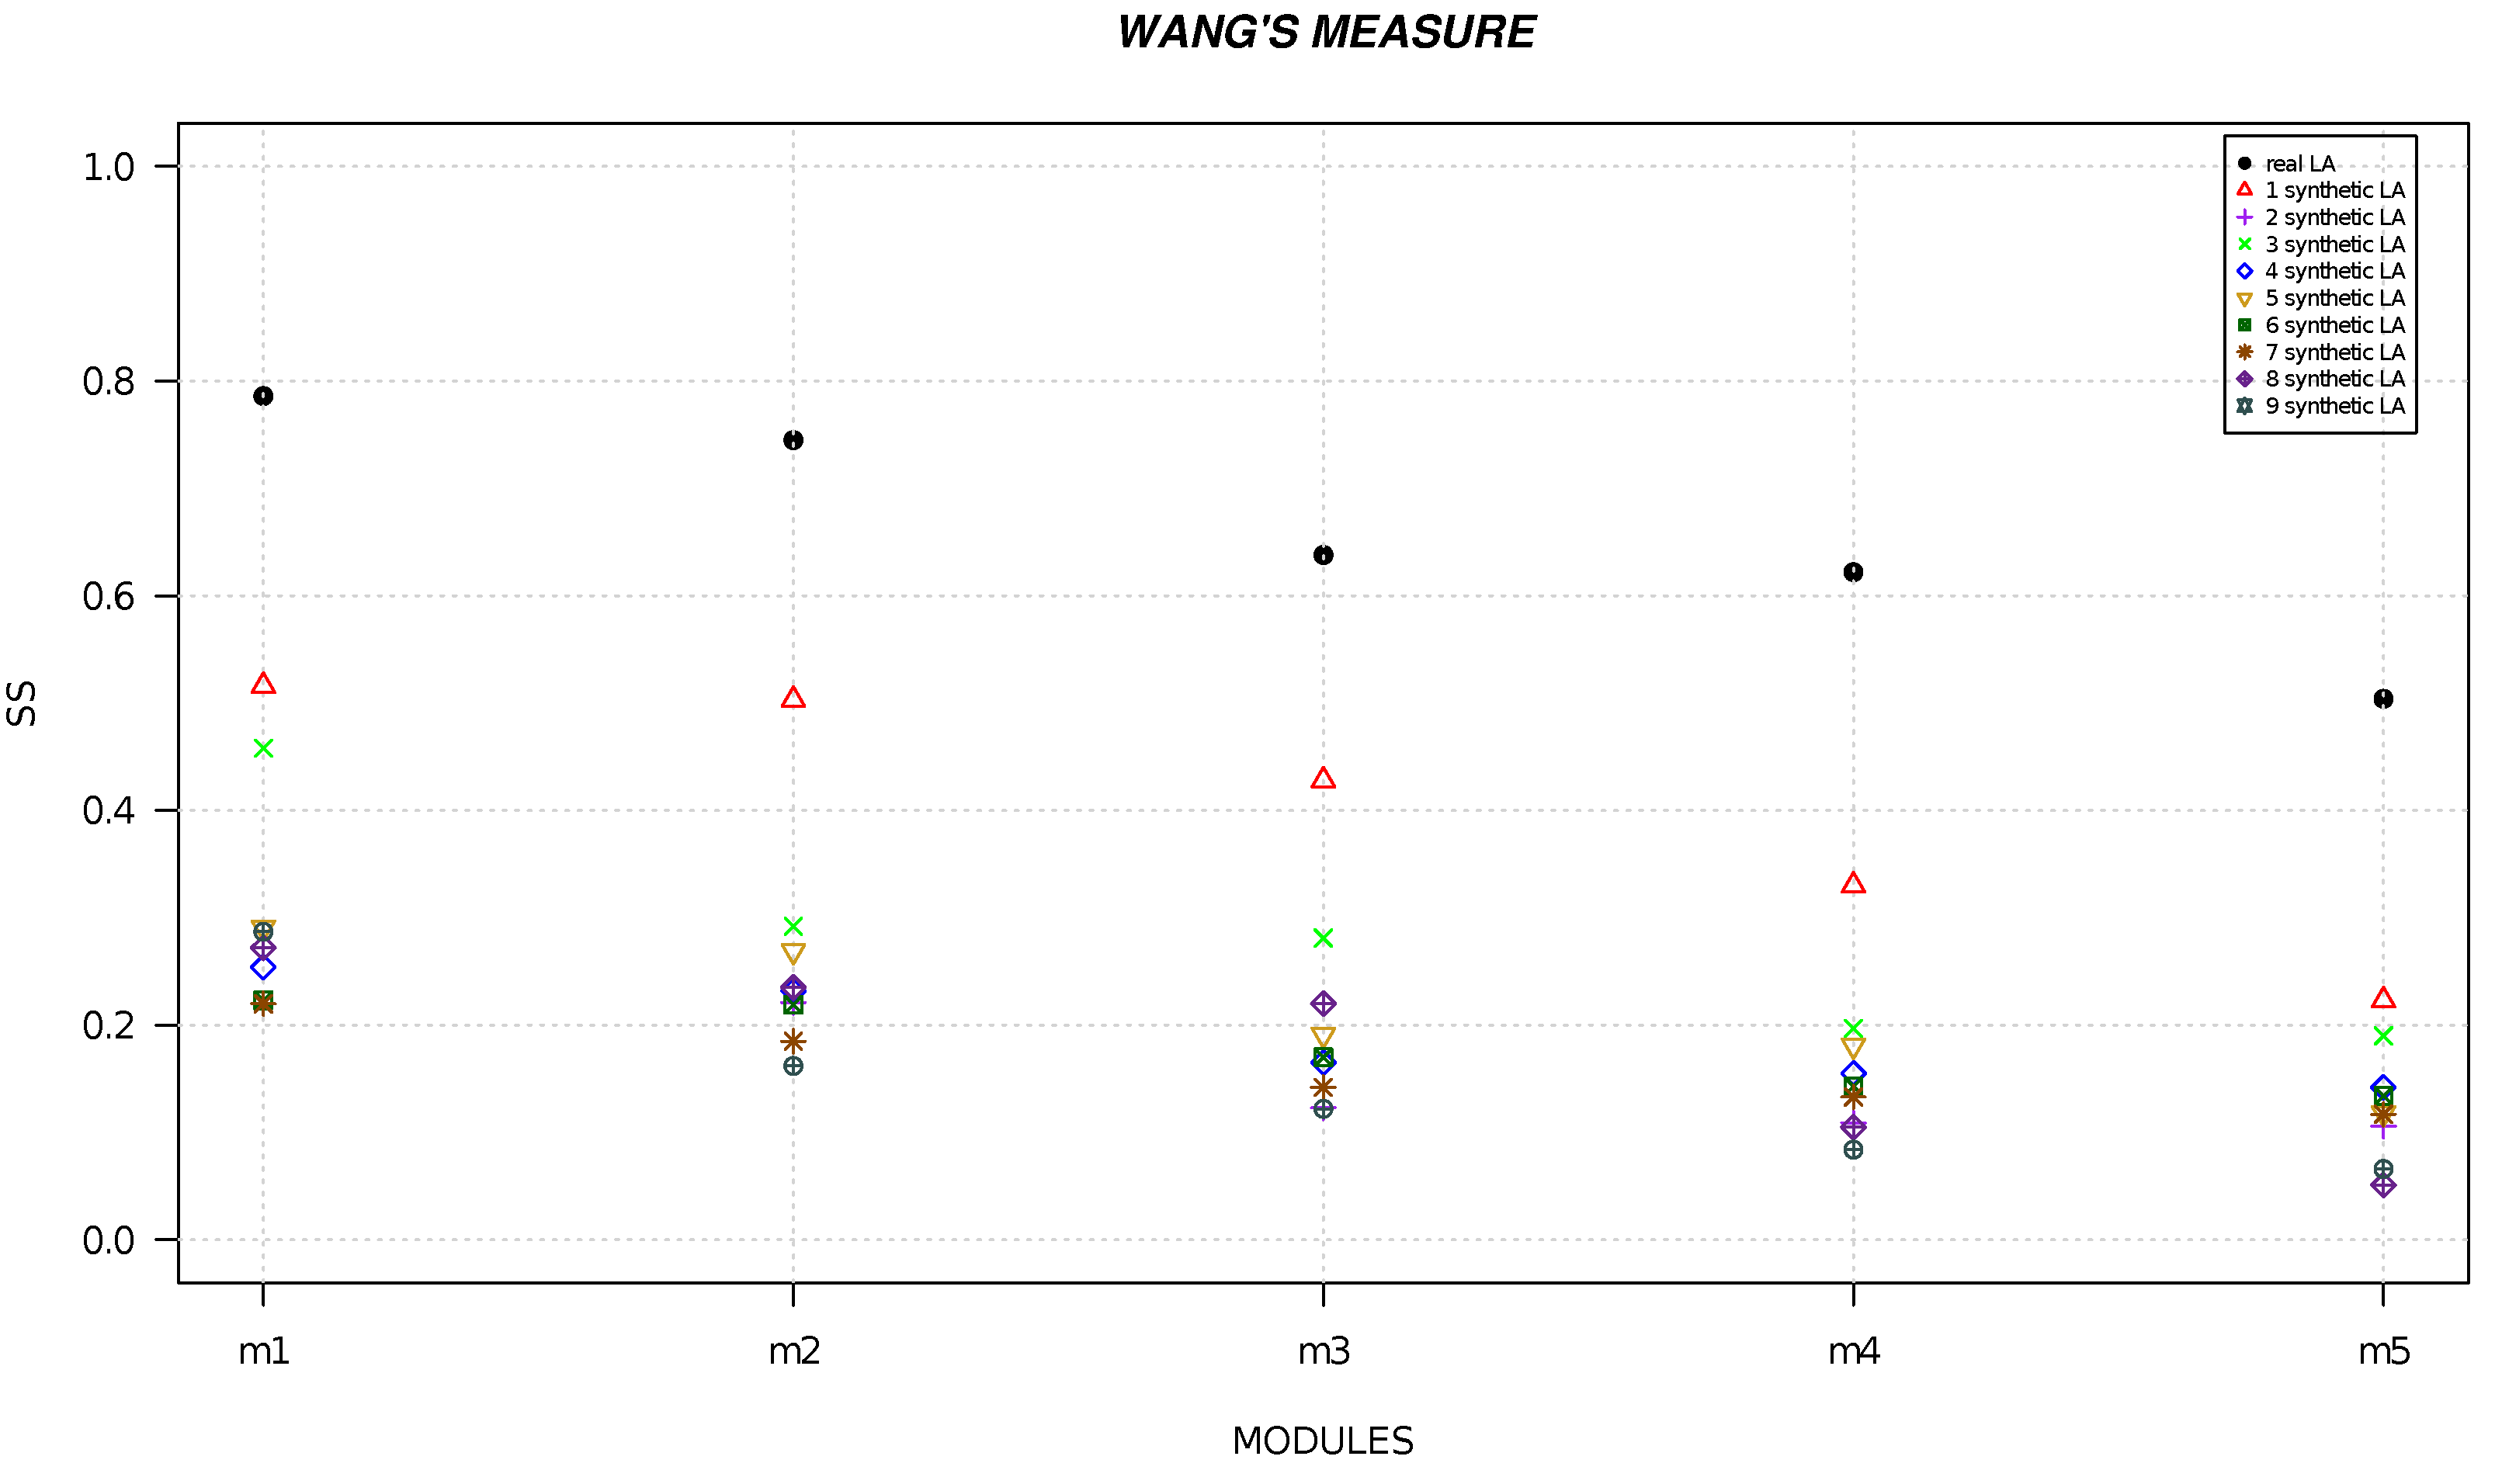
We randomly generated six local alignments and five local alignments by using R software [49] and we calculated the semantic similarity for each alignment. Figure 1, Figure 2, Figure 3, Figure 4, Figure 5 and Figure 6 show the comparison of semantic similarity values of real local alignment and synthetic alignments. It is possible to note that for each module the semantic similarity values are greater in the case of real local alignment (report in the figure with the black marker). Furthermore, it is possible to find the same trend for each of the applied measures.
In conclusion, the real local alignment, i.e., the relevant modules, show a relatedness significantly higher than by chance.

5. Discussion

The study presented in the article explores the application of LNA to analyze PPI networks associated with AD and PD in model organisms such as C. elegans and humans. The goal of the study is to discover proteins related to AD and PD and investigate their functional relevance in both species.
The researchers constructed in silico PPI networks for C. elegans and humans, focusing on proteins associated with AD, such as APP and TAU in humans and their orthologs APL-1 and PTL-1 in C. elegans. Also, they constructed in silico PPI networks for C. elegans and humans, focusing on proteins associated with PD, such as PARK-2 and it ortholog PDR-1 in C. elegans. The L-HetNetAligner algorithm was then applied to perform local network alignment between the two PPI networks.
The results of the study demonstrate that the extracted modules are functionally related and possess a biological relevance higher than what would be expected by chance. This suggests that there are conserved biological pathways and interactions involved in AD and PD across these two species.
The findings of this study are significant for several reasons. Firstly, they highlight the potential of using network alignment techniques, specifically LNA, to compare PPI networks and gain insights into complex diseases such as AD and PD. By identifying conserved modules and interactions, researchers can uncover key proteins and pathways involved in the disease, leading to a better understanding of its underlying mechanisms.
Furthermore, the study demonstrates the utility of model organisms like C. elegans in studying neurodegenerative diseases such as AD and PD. Despite lacking certain features of the human brain and not developing AD and PD, C. elegans has orthologs of genes associated with AD and PD, making it a valuable tool for investigating aspects of the disease. The successful application of LNA to compare PPI networks in C. elegans and humans further supports the use of model organisms in disease research.
It is important to note that the study focused on local network alignment, which allows for the discovery of conserved functional network modules rather than a global comparison of entire interactomes. This approach enables the identification of specific protein complexes and interactions that are relevant to AD and PD, providing targeted insights into the disease processes.
Overall, the results of this study contribute to the growing field of network analysis in disease research. By combining computational techniques and biological knowledge, researchers can uncover conserved molecular mechanisms and pathways associated with AD and PD. This knowledge can potentially lead to the development of new therapeutic strategies and interventions for the treatment of AD and PD.
The use of C. elegans data to make inferences about humans has some drawbacks to consider. First, C. elengans has a relatively simple nervous system, while humans have a more complex nervous system with billions of neurons. Second, there are significant structural and functional differences between the two systems. Finally, humans also present differences among individuals due to environmental factors as well as genes and sex [50].
In conclusion, the study demonstrates the effectiveness of local network alignment in comparing PPI networks associated with AD and PD in C. elegans and humans. The findings highlight the importance of conserved interactions and pathways in the disease and provide valuable insights for further research and the development of targeted interventions.

6. Conclusions

AD is a complex neurodegenerative disorder due to the extracellular and intracellular accumulation of proteins, and its progression is still under study. Different research studies have applied the protein–protein interaction (PPI) networks to understand different aspects of disease progression. The aim of this study is to provide a network analysis approach to the study of AD. We built in silico the AD-related and PD-related human and the model organism C. elegans PPI networks. AD-related PPI networks were constructed for the human proteins APP and Tau and for their respective C. elegans orthologs APL-1 and PTL-1. PD-related PPI networks were constructed for the human protein PARK-2 and for its respective C. elegans ortholog PDR-1. Then, we compare the PPI networks by applying L-HetNetAligner. The results show that L-HetNetAligner is able to extract modules, representing the local alignment, that are functionally related and that present a biological relevance. In future works, we plan to extend the use of L-HetNetAligner to study different complex chronic diseases.

Author Contributions

Conceptualization, P.H.G. and M.M.; methodology, P.H.G. and M.M.; software, M.M.; data curation, M.M.; writing—original draft preparation, P.H.G., P.C. and M.C.; writing—review and editing, P.H.G., M.M., P.C. and M.C. All authors have read and agreed to the published version of the manuscript.

Funding

This work was funded by the Next Generation EU—Italian NRRP, Mission 4, Component 2, Investment 1.5, call for the creation and strengthening of ’Innovation Ecosystems’, building ’Territorial R&D Leaders’ (Directorial Decree n. 2021/3277)—project Tech4You—Technologies for climate change adaptation and quality of life improvement, n. ECS0000009. This work reflects only the authors’ views and opinions, neither the Ministry for University and Research nor the European Commission can be considered responsible for them.

Institutional Review Board Statement

Not applicable.

Informed Consent Statement

Not applicable.

Conflicts of Interest

The authors declare no conflict of interest.

Abbreviations

The following abbreviations are used in this manuscript:
NDNeurodegenerative diseases
ADAlzheimer’s disease
PDParkinson’s disease
PPIProtein-Protein Interaction
NANetwork Alignment
LNALocal Network Alignment
GNAGlobal Network Alignment
GOGene Ontology
SSSemantic Similarity

References

  1. Uwishema, O.; Mahmoud, A.; Sun, J.; Correia, I.F.S.; Bejjani, N.; Alwan, M.; Nicholas, A.; Oluyemisi, A.; Dost, B. Is Alzheimer’s disease an infectious neurological disease? A review of the literature. Brain Behav. 2022, 12, e2728. [Google Scholar] [CrossRef] [PubMed]
  2. Fragkiadaki, S.; Kontaxopoulou, D.; Stanitsa, E.; Angelopoulou, E.; Pavlou, D.; Šemrov, D.; Colnar, S.; Lustrek, M.; Blažica, B.; Vučica, I.; et al. How Well Did the Healthcare System Respond to the Healthcare Needs of Older People with and without Dementia during the COVID-19 Pandemic? The Perception of Healthcare Providers and Older People from the SI4CARE Project in the ADRION Region. Geriatrics 2023, 8, 21. [Google Scholar] [CrossRef] [PubMed]
  3. Wang, H.; Yang, F.; Zhang, S.; Xin, R.; Sun, Y. Genetic and environmental factors in Alzheimer’s and Parkinson’s diseases and promising therapeutic intervention via fecal microbiota transplantation. npj Park. Dis. 2021, 7, 70. [Google Scholar] [CrossRef]
  4. Smith, M.A.; Casadesus, G.; Joseph, J.A.; Perry, G. Amyloid-β and τ serve antioxidant functions in the aging and Alzheimer brain. Free Radic. Biol. Med. 2002, 33, 1194–1199. [Google Scholar] [CrossRef]
  5. Mandelkow, E.M.; Mandelkow, E. Tau in Alzheimer’s disease. Trends Cell Biol. 1998, 8, 425–427. [Google Scholar] [CrossRef]
  6. Eratne, D.; Loi, S.M.; Farrand, S.; Kelso, W.; Velakoulis, D.; Looi, J.C. Alzheimer’s disease: Clinical update on epidemiology, pathophysiology and diagnosis. Australas Psychiatry 2018, 26, 347–357. [Google Scholar] [CrossRef]
  7. Kalia, L.V.; Lang, A.E. Parkinson’s disease. Lancet 2015, 386, 896–912. [Google Scholar] [CrossRef]
  8. Emamzadeh, F.N.; Surguchov, A. Parkinson’s disease: Biomarkers, treatment, and risk factors. Front. Neurosci. 2018, 12, 612. [Google Scholar] [CrossRef] [PubMed] [Green Version]
  9. Konovalova, E.; Lopacheva, O.; Grivennikov, I.; Lebedeva, O.; Dashinimaev, E.; Khaspekov, L.; Fedotova, E.Y.; Illarioshkin, S. Mutations in the Parkinson’s disease-associated PARK2 gene are accompanied by imbalance in programmed cell death systems. Acta Nat. 2015, 7, 146–149. [Google Scholar] [CrossRef]
  10. Elkouzi, A.; Vedam-Mai, V.; Eisinger, R.S.; Okun, M.S. Emerging therapies in Parkinson disease—Repurposed drugs and new approaches. Nat. Rev. Neurol. 2019, 15, 204–223. [Google Scholar] [CrossRef]
  11. Armstrong, M.J.; Okun, M.S. Diagnosis and treatment of Parkinson disease: A review. JAMA 2020, 323, 548–560. [Google Scholar] [CrossRef]
  12. Calabrese, G.; Molzahn, C.; Mayor, T. Protein interaction networks in neurodegenerative diseases: From physiological function to aggregation. J. Biol. Chem. 2022, 298, 102062. [Google Scholar] [CrossRef] [PubMed]
  13. Hu, Y.S.; Xin, J.; Hu, Y.; Zhang, L.; Wang, J. Analyzing the genes related to Alzheimer’s disease via a network and pathway-based approach. Alzheimer’s Res. Ther. 2017, 9, 29. [Google Scholar] [CrossRef] [PubMed] [Green Version]
  14. Tomkins, J.E.; Manzoni, C. Advances in protein-protein interaction network analysis for Parkinson’s disease. Neurobiol. Dis. 2021, 155, 105395. [Google Scholar] [CrossRef] [PubMed]
  15. Cinaglia, P.; Cannataro, M. Network alignment and motif discovery in dynamic networks. Netw. Model. Anal. Health Inform. Bioinform. 2022, 11, 38. [Google Scholar] [CrossRef]
  16. Liu, Z.P.; Wang, Y.; Zhang, X.S.; Chen, L. Identifying dysfunctional crosstalk of pathways in various regions of Alzheimer’s disease brains. BMC Syst. Biol. 2010, 4, S11. [Google Scholar] [CrossRef] [Green Version]
  17. Krauthammer, M.; Kaufmann, C.A.; Gilliam, T.C.; Rzhetsky, A. Molecular triangulation: Bridging linkage and molecular-network information for identifying candidate genes in Alzheimer’s disease. Proc. Natl. Acad. Sci. USA 2004, 101, 15148–15153. [Google Scholar] [CrossRef]
  18. Goñi, J.; Esteban, F.J.; de Mendizábal, N.V.; Sepulcre, J.; Ardanza-Trevijano, S.; Agirrezabal, I.; Villoslada, P. A computational analysis of protein-protein interaction networks in neurodegenerative diseases. BMC Syst. Biol. 2008, 2, 52. [Google Scholar] [CrossRef] [Green Version]
  19. Lin, X.; Liu, M.; Chen, X.W. Assessing reliability of protein-protein interactions by integrative analysis of data in model organisms. BMC Bioinform. 2009, 10, S5. [Google Scholar] [CrossRef] [Green Version]
  20. Surguchov, A. Invertebrate models untangle the mechanism of neurodegeneration in Parkinson’s disease. Cells 2021, 10, 407. [Google Scholar] [CrossRef]
  21. Alexander, A.G.; Marfil, V.; Li, C. Use of Caenorhabditis elegans as a model to study Alzheimer’s disease and other neurodegenerative diseases. Front. Genet. 2014, 5, 279. [Google Scholar] [CrossRef] [Green Version]
  22. Milano, M.; Guzzi, P.H.; Tymofieva, O.; Xu, D.; Hess, C.; Veltri, P.; Cannataro, M. An extensive assessment of network alignment algorithms for comparison of brain connectomes. BMC Bioinform. 2017, 18, 235. [Google Scholar] [CrossRef] [PubMed] [Green Version]
  23. Chandler, R.J.; Cogo, S.; Lewis, P.A.; Kevei, E. Modelling the functional genomics of Parkinson’s disease in Caenorhabditis elegans: LRRK2 and beyond. Biosci. Rep. 2021, 41, BSR20203672. [Google Scholar] [CrossRef]
  24. Milano, M.; Agapito, G.; Cannataro, M. Challenges and limitations of biological network analysis. BioTech 2022, 11, 24. [Google Scholar] [CrossRef]
  25. Milano, M.; Guzzi, P.H.; Cannataro, M. Glalign: A novel algorithm for local network alignment. IEEE/ACM Trans. Comput. Biol. Bioinform. 2018, 16, 1958–1969. [Google Scholar] [CrossRef] [PubMed]
  26. Milano, M.; Hayes, W.; Veltri, P.; Cannataro, M.; Guzzi, P.H. SL-GLAlign: Improving local alignment of biological networks through simulated annealing. Netw. Model. Anal. Health Inform. Bioinform. 2020, 9, 10. [Google Scholar] [CrossRef]
  27. Apostolakou, A.E.; Sula, X.K.; Nastou, K.C.; Nasi, G.I.; Iconomidou, V.A. Exploring the conservation of Alzheimer-related pathways between H. sapiens and C. elegans: A network alignment approach. Sci. Rep. 2021, 11, 4572. [Google Scholar] [CrossRef]
  28. Cannataro, M.; Guzzi, P.H.; Veltri, P. Protein-to-protein interactions: Technologies, databases, and algorithms. ACM Comput. Surv. (CSUR) 2010, 43, 1–36. [Google Scholar] [CrossRef]
  29. Gao, X.; Xiao, B.; Tao, D.; Li, X. A survey of graph edit distance. Pattern Anal. Appl. 2010, 13, 113–129. [Google Scholar] [CrossRef]
  30. Guzzi, P.H.; Roy, S. Biological Network Analysis: Trends, Approaches, Graph Theory, and Algorithms; Elsevier: Amsterdam, The Netherlands, 2020. [Google Scholar]
  31. Gu, S.; Jiang, M.; Guzzi, P.H.; Milenković, T. Modeling multi-scale data via a network of networks. Bioinformatics 2022, 38, 2544–2553. [Google Scholar] [CrossRef]
  32. Elhesha, R.; Sarkar, A.; Cinaglia, P.; Boucher, C.; Kahveci, T. Co-evolving Patterns in Temporal Networks of Varying Evolution. In Proceedings of the 10th ACM International Conference on Bioinformatics, Computational Biology and Health Informatics, Bcb’19, Niagara Falls, NY, USA, 7–10 September 2019; ACM: New York, NY, USA, 2019; pp. 494–503. [Google Scholar] [CrossRef]
  33. Tian, Y.; Mceachin, R.C.; Santos, C.; States, D.J.; Patel, J.M. SAGA: A subgraph matching tool for biological graphs. Bioinformatics 2006, 23, 232–239. [Google Scholar] [CrossRef] [PubMed] [Green Version]
  34. Zager, L.A.; Verghese, G.C. Graph similarity scoring and matching. Appl. Math. Lett. 2008, 21, 86–94. [Google Scholar] [CrossRef] [Green Version]
  35. Raveaux, R.; Burie, J.C.; Ogier, J.M. A graph matching method and a graph matching distance based on subgraph assignments. Pattern Recognit. Lett. 2010, 31, 394–406. [Google Scholar] [CrossRef]
  36. Cinaglia, P.; Cannataro, M. A Method Based on Temporal Embedding for the Pairwise Alignment of Dynamic Networks. Entropy 2023, 25, 665. [Google Scholar] [CrossRef] [PubMed]
  37. Saraph, V.; Milenković, T. MAGNA: Maximizing accuracy in global network alignment. Bioinformatics 2014, 30, 2931–2940. [Google Scholar] [CrossRef] [PubMed] [Green Version]
  38. Milano, M.; Milenković, T.; Cannataro, M.; Guzzi, P.H. L-hetnetaligner: A novel algorithm for local alignment of heterogeneous biological networks. Sci. Rep. 2020, 10, 3901. [Google Scholar] [CrossRef] [Green Version]
  39. Satuluri, V.; Parthasarathy, S.; Ucar, D. Markov clustering of protein interaction networks with improved balance and scalability. In Proceedings of the First ACM International Conference on Bioinformatics and Computational Biology, Niagara Falls, NY, USA, 2–4 August 2010; pp. 247–256. [Google Scholar]
  40. Cannataro, M.; Guzzi, P.H.; Mazza, T.; Tradigo, G.; Veltri, P. Using ontologies for preprocessing and mining spectra data on the Grid. Future Gener. Comput. Syst. 2007, 23, 55–60. [Google Scholar] [CrossRef]
  41. Resnik, P. Semantic Similarity in a Taxonomy: An Information-Based Measure and its Application to Problems of Ambiguity in Natural Language. arXiv 2011, arXiv:1105.5444. [Google Scholar] [CrossRef] [Green Version]
  42. Lin, D. An information-theoretic definition of similarity. In Proceedings of the ICML ’98: Proceedings of the Fifteenth International Conference on Machine Learning, Madison, WI, USA, 24–27 July 1998; Volume 98, pp. 296–304. [Google Scholar]
  43. Jiang, J.J.; Conrath, D.W. Semantic Similarity Based on Corpus Statistics and Lexical Taxonomy. arXiv 1997, arXiv:cmp-lg/9709008. [Google Scholar]
  44. Szklarczyk, D.; Kirsch, R.; Koutrouli, M.; Nastou, K.; Mehryary, F.; Hachilif, R.; Gable, A.L.; Fang, T.; Doncheva, N.T.; Pyysalo, S.; et al. The STRING database in 2023: Protein–protein association networks and functional enrichment analyses for any sequenced genome of interest. Nucleic Acids Res. 2023, 51, D638–D646. [Google Scholar] [CrossRef]
  45. Kim, W.; Underwood, R.S.; Greenwald, I.; Shaye, D.D. OrthoList 2: A new comparative genomic analysis of human and Caenorhabditis elegans genes. Genetics 2018, 210, 445–461. [Google Scholar] [CrossRef] [PubMed] [Green Version]
  46. Consortium, G.O. The Gene Ontology (GO) database and informatics resource. Nucleic Acids Res. 2004, 32, D258–D261. [Google Scholar] [CrossRef] [PubMed] [Green Version]
  47. Resnik, P. Using information content to evaluate semantic similarity in a taxonomy. arXiv 1995, arXiv:cmp-lg/9511007. [Google Scholar]
  48. Wang, J.Z.; Du, Z.; Payattakool, R.; Yu, P.S.; Chen, C.F. A new method to measure the semantic similarity of GO terms. Bioinformatics 2007, 23, 1274–1281. [Google Scholar] [CrossRef] [PubMed] [Green Version]
  49. Milano, M. Computing Languages for Bioinformatics: R. In Encyclopedia of Bioinformatics and Computational Biology—Volume 1; Ranganathan, S., Gribskov, M., Nakai, K., Schönbach, C., Eds.; Elsevier: Amsterdam, The Netherlands, 2019; pp. 199–205. [Google Scholar] [CrossRef]
  50. Guzzi, P.H.; Cortese, F.; Mannino, G.C.; Pedace, E.; Succurro, E.; Andreozzi, F.; Veltri, P. Analysis of age-dependent gene-expression in human tissues for studying diabetes comorbidities. Sci. Rep. 2023, 13, 10372. [Google Scholar] [CrossRef]
Figure 1. The figure shows the semantic similarity of six real modules (AD-related) (black marker) and synthetic modules (red, purple, green, blue, golden, dark green, orange, orchid, gray markers) computed with Resnik’s measure.
Life 13 01520 g001
Figure 2. The figure shows the semantic similarity of real six modules (AD-related) (black marker) and synthetic modules (red, purple, green, blue, golden, dark green, orange, orchid, gray markers) computed with Lin’s measure.
Life 13 01520 g002
Figure 3. The figure shows the semantic similarity of real six modules (AD-related) (black marker) and synthetic modules (red, purple, green, blue, golden, dark green, orange, orchid, gray markers) computed with Wang’s measure.
Life 13 01520 g003
Figure 4. The figure shows the semantic similarity of real six modules (PD-related) (black marker) and synthetic modules (red, purple, green, blue, golden, dark green, orange, orchid, gray markers) computed with Resnik’s measure.
Life 13 01520 g004
Figure 5. The figure shows the semantic similarity of real six modules (PD-related) (black marker) and synthetic modules (red, purple, green, blue, golden, dark green, orange, orchid, gray markers) computed with Lin’s measure.
Life 13 01520 g005
Figure 6. The figure shows the semantic similarity of real six modules (PD-related) (black marker) and synthetic modules (red, purple, green, blue, golden, dark green, orange, orchid, gray markers) computed with Wang’s measure.
Life 13 01520 g006
Table 1. Local alignment consisting of six relevant modules built among C. elegans network and human network with L-HetNetAligner in AD. For each module, the table reports the number of proteins that form it.
Module# Protein
128
228
312
412
52
62
Table 2. Local alignment consisting of six relevant modules built among C. elegans network and human network with L-HetNetAligner in PD. For each module, the table reports the number of proteins that form it.
Module# Protein
150
230
335
421
515
Table 3. Semantic similarity values for each module forming the local alignment computed by applying Resnik’s, Lin’s and Wang’s measures for AD.
Local AlignmentResnikLinWang
module 1220.9130.870
module 221.6780.8190.810
module 316.9000.7660.567
module 415.4780.6640.552
module 514.0000.4440.400
module 612.0300.4050.387
Table 4. Semantic similarity values for each module forming the local alignment computed by applying Resnik’s, Lin’s and Wang’s measures for PD.
Local AlignmentResnikLinWang
module 19.6240.7650.786
module 280.7120.745
module 37.3980.6690.638
module 46.5920.6250.622
module 55.970.5610.504
Disclaimer/Publisher’s Note: The statements, opinions and data contained in all publications are solely those of the individual author(s) and contributor(s) and not of MDPI and/or the editor(s). MDPI and/or the editor(s) disclaim responsibility for any injury to people or property resulting from any ideas, methods, instructions or products referred to in the content.