Article

Orthologs of Human-Disease-Associated Genes in Plants Are Involved in Regulating Leaf Senescence

National Engineering Research Center for Tree Breeding and Ecological Restoration, College of Biological Sciences and Technology, Beijing Forestry University, Beijing 100083, China
*
Authors to whom correspondence should be addressed.
Life 2023, 13(2), 559; https://doi.org/10.3390/life13020559
Submission received: 21 January 2023 / Revised: 10 February 2023 / Accepted: 14 February 2023 / Published: 16 February 2023
(This article belongs to the Special Issue Natural Products on Health and Diseases)

Abstract

:
As eukaryotes, plants and animals have many commonalities on the genetic level, although they differ greatly in appearance and physiological habits. The primary goal of current plant research is to improve the crop yield and quality. However, plant research has a wider aim, exploiting the evolutionary conservatism similarities between plants and animals, and applying discoveries in the field of botany to promote zoological research that will ultimately serve human health, although very few studies have addressed this aspect. Here, we analyzed 35 human-disease-related gene orthologs in plants and characterized the genes in depth. Thirty-four homologous genes were found to be present in the herbaceous annual plant Arabidopsis thaliana and the woody perennial plant Populus trichocarpa, with most of the genes having more than two exons, including the ATM gene with 78 exons. More surprisingly, 27 (79.4%) of the 34 homologous genes in Arabidopsis were found to be senescence-associated genes (SAGs), further suggesting a close relationship between human diseases and cellular senescence. Protein–protein interaction network analysis revealed that the 34 genes formed two main subnetworks, and genes in the first subnetwork interacted with 15 SAGs. In conclusion, our results show that most of the 34 homologs of human-disease-associated genes in plants are involved in the leaf senescence process, suggesting that leaf senescence may offer a means to study the pathogenesis of human diseases and to screen drugs for the treat of diseases.

1. Introduction

The plant and animal kingdoms comprise highly contrasting life forms. The genome sequence of eukaryotes provides a powerful means and strategy that can be used to uncover the genetic basis of differences between organisms, and their detailed functional characterization can be further explored. Moreover, flowering plants have ancestral features that are conserved between plants and animals [1]. Arabidopsis thaliana is an ideal model for flowing plant genome and gene functional analysis because of its small nuclear genome as well as its small size, short generation time and large number of offspring. Multiple plant-specific biological processes have been uncovered including development [2,3], gene network regulation [4,5], metabolism [6,7], photomorphogenesis [8,9], immunity [10,11], DNA repair [12,13], environment responses, biotic and abiotic stress signaling [14,15,16,17,18]. The great number of advances made in Arabidopsis research not only support plant biology studies but also shed light on agricultural breeding, and directly contribute to comparative genomics, bioinformatics, molecular genetics, evolutionary biology, combinatorial chemistry and chemical genetics research. Most importantly, the progress of research in Arabidopsis supports the development and application of medicine.
By BLAST and comparing the list of human disease genes [19] with the Arabidopsis genome, we can observe that most of the functional and representative protein domains are conserved in similar proportions for both humans and Arabidopsis [1]. In fact, 48.1% (139/289) of human disease genes show hits for Arabidopsis with E < 10−10 using the BLASTP threshold method. In total, 36 (12.5%) had scores better than E < 10−70, including 17 that were highly conserved in Arabidopsis compared to yeast, Drosophila or C. elegans [1]. As multiple non-communicable human diseases and their severity are closely related to certain underlying risk factors, as well as ageing, cellular senescence is gaining increasing attention and is considered to be a potential target in treating human diseases [20]. Cellular senescence can be triggered by multiple factors, such as inflammation, oncogenes, reactive metabolites, mitogens, proteotoxic stress, DNA damage and damage-associated molecular patterns [21,22]. DNA damage is the key inducer of cellular senescence [23]. Dysfunction, mutations, radiation, and alkylating agents can cause DNA damage, and most DNA damage-related genes are senescence-associated genes, such as ataxia telangiectasia mutated (ATM) [24,25]. The p53 pathways is central for the inducers triggered cellular senescence phenotype, and p53 is a key mediator of adipogenesis and the glucose response gene [26], known as its cell cycle- and senescence-associated regulator property. Reducing the expression of p53 can delay cellular senescence but might also increase the risk of cancer [27]. The senescence-associated secretory phenotype (SASP) is one of the significant hallmarks. The ‘jumping genes’ (transposons) contribute to the SASP, as they are produced within senescent cells and re-inserted into the senescent cell DNA [28,29]. Senescence-targeting interventions represent promising strategies for clinical use across the lifespan [30], and ‘senolytic’ drugs, which can kill senescent cells or inhibit ASAP, can be was applied [27].
Plant senescence shares partial similarity with human senescence. Almost all plants undergo cell, tissue and organ senescence before they eventually die. Plant fitness is founded on timely senescence, which is considered as an evolutionarily acquired process [31]. During senescence, plants integrate information related to their developmental age with multiple internal and external signals via intricate regulatory pathways [32,33]. Leaf senescence, which has been widely studied, is the most representative and well-visualized type of senescence in plants. Currently, 31,214 genes and 1037 mutants of 86 species related to leaf senescence were summarized [34], and complex regulating signaling network analysis was conducted 30]. The circadian rhythm and aging clock, defined as endogenous time-keeping mechanisms which are closely related to human disease [35], are also linked to leaf senescence via cross-regulatory networks. Leaf age affects the circadian clock, and a shorter circadian period was observed in old leaves, as it is regulated by the circadian clock oscillator TIMING OF CAB EXPRESSION1 (TOC1) [36]. CIRCADIAN CLOCK–ASSOCIATED 1 (CCA1) is an evident regulator of leaf senescence, and the loss of function of CCA1 leads to early leaf senescence [37]. Specifically, CCA1 targets the leaf senescence master regulator ORE1 by repressing its expression and activates the expression of the chloroplast maintenance gene GLK2. ORE1 integrates the circadian clock with age-dependent senescence through PSEUDO-RESPONSE REGULATOR9 (PRR9), and PRR9 promotes the expression of ORE1 while repressing its upstream gene, miR164 [38]. Moreover, RECEPTOR PROTEIN KINASE 1 (RPK1) affects leaf development but depends on leaf age, and inducing RPK1 in old leaves results in enhanced senescence, while the induction of RPK1 in young leaves leads to no signs of senescence but arrested growth [39].
Age-related DNA damage is considered as one of the main triggers of animal senescence [40]. Plants share similarities in DNA-damage-triggered senescence with animals. Endogenous factors such as age can induce leaf senescence, and this may due to increased DNA damage and a decreased DNA repair capacity [41]. The inducible overexpression of I-PpoI restriction endonuclease results in double-strand DNA breaks (DSBs) and leads to an accelerated leaf senescence phenotype [24,25]. DSB-triggered gene expression shares similarities with senescence, and DNA repair genes are also related to leaf senescence, as revealed by transcriptomic data. ATAXIA TELANGIECT ASIA MUTATED (ATM), a human disease related gene [1], is known for its primary DSB signal transducer role [42]. The homolog hit for Arabidopsis is involved in leaf senescence and acts as a negative regulator. ATM suppresses the DSB-induced expression of SAGs via the modulation of histone lysine methylation [25].
In this study, we selected 35 disease-associated genes [1] and identified 34 orthologs genes in the Arabidopsis and Populus. Comparative genomic and molecular docking analysis revealed that orthologs of human-disease-associated genes in plants are involved in regulating leaf senescence.

2. Materials and Methods

2.1. Identification of Homologous Genes in Arabidopsis and Populus

The Arabidopsis genes with similarities to human disease genes were identified from the previous research, an analysis of the genomic sequence of Arabidopsis [1]. The name of human disease genes, transcript ID and gene function description in Arabidopsis were displayed in the literature [1] (Table 3 on page 7 (volume page 802), which named ‘Table 3 Arabidopsis genes with similarities to human disease genes’). The homolog genes of Populus were identified on the Populus trichocarpa v3 database using BLAST, and the most similar transcript and protein sequences were used for further analysis (https://phytozome-next.jgi.doe.gov/ (accessed on 5 September 2022)) [43].

2.2. Synteny Analysis, Gene Structure and Phylogenetic Tree Analysis

The protein and annotation files of human (Homo sapiens) GRCh38 were downloaded from Ensembl database (https://www.ensembl.org/Homo_sapiens/Info/Index (accessed on 5 January 2023)). The protein and annotation files of A. thaliana TAIR10 and P. trichocarpa v3 were downloaded from EnsemblPlants database (https://plants.ensembl.org/index.html (accessed on 5 January 2023)). The DIAMOND algorithm [44] was applied for protein sequence alignment between human and A. thaliana, as well as human and P. trichocarpa, with E-value < 1 × 10⁻³ cutoff. Then, the alignment results were visualized in TBtools [45] via Multiple Synteny Plot plugin. The structural maps of the 34 candidate A. thaliana and P. trichocarpa genes were constructed using the GSDS2.0 tool (http://gsds.gao-lab.org/ (accessed on 5 September 2022)) [46], and the UTR, exon and intron were visualized with different colors. For the phylogenetic tree analysis, the amino acid sequences of the 34 candidate genes were aligned using ClustalX2 tool [47], and then visualized using MEGA-X software with the Maximum-Likelihood algorithm and Bootstrap test of 100 replications [48].

2.3. Expression Pattern during Leaf Senescence

The expression values of the 34 genes during the leaf senescence process were extracted from A. thaliana [49] and Populus tomentosa [50]. The A. thaliana data included 14 time points for the leaf development process, tracked from the growth-to-maturation stage (G-to-M; 4–18 d) to the maturation-to-senescence stage (M-to-S; 16–30 d). The P. tomentosa data contains 16 time points for autumn leaf senescence process, tracked over the mature stage (M; L1-10), early senescence stage (ES; L11-L13) and later senescence stage (LS; L14-L16). Furthermore, the raw RNA-Seq data of A. thaliana and P. tomentosa was downloaded from NCBI’s Sequence Read Archive (SRA) database (https://www.ncbi.nlm.nih.gov/sra/ (accessed on 5 September 2022)) [51], with the SRA study accession number PRJNA186843 for A. thaliana [49] and PRJNA561520 for P. tomentosa [50], and the detailed information was displayed in Supplemental Dataset 1. The ‘SRR’ format data downloaded using SRAToolkit package tool was transformed to ‘fastq’ format via ‘fastq-dump’ command. For data quality control and reads cleaning, the adapter in the reads were removed, and then the low-quality reads (reads with Qphred <= 20 bases account for more than 50% of the entire read) and reads with a ratio of N (N means that the base information cannot be determined) greater than 10% were also removed. Then, the clean reads were aligned to the Arabidopsis genome [52] and Populus v3 genome [43] using HISAT2 algorithm, respectively [53]. Transcripts Per Million (TPM) [54] was used to measure gene expression levels and log-transformed values for visualization. The heatmaps were generated by using the ‘pheatmap’ package [55] in R v4.1.2 program. The red and blue color represent the high and low expression levels, respectively.

2.4. Construction of Protein–Protein Interaction Network

The online STRING tool (https://cn.string-db.org/ (accessed on 7 December 2022)) was applied for the protein–protein interaction (PPI) data analysis, and then the interaction data were visualized in Cytoscape v3.7. The large circles represent the 34 candidate genes, while the small circles or rectangles represent the potential interacting proteins, and the SAGs are marked in yellow.

2.5. Molecular Docking of Drugs and Proteins

The data files of all the proteins used for molecular docking were downloaded from the AlphaFold Protein Structure Database (https://alphafold.com/ (accessed on 7 December 2022)) [56]. The data file of chemical drugs was downloaded from the National Center for Biotechnology Information (NCBI) PubChem Substance Database (https://www.ncbi.nlm.nih.gov/pcsubstance/ (accessed on 7 December 2022)) [57]. The molecular docking was performed using the SwissDock tool (http://www.swissdock.ch/docking (accessed on 7 December 2022)).

2.6. Statistical Analyses

GraphPad Prism v8.3.0 software ((Dr. Harvey Motulsky Founder) (Boston, MA 02001, USA) https://www.graphpad.com/scientific-software/prism/ accessed on 7 August 2022) was used to visualize the statistical data, including the exon number, average exon, initial exon, internal exon and terminal exon length.

3. Results

3.1. Identification of Human Disease-like Genes in A. thaliana and P. trichocarpa

A previous study using BLASTP analysis identified genes with high sequence similarity to human disease genes in the Arabidopsis genome [1]. Unlike A. thaliana, poplar is a perennial plant. To investigate whether the poplar genome also contains genes with highly similar sequences to human-disease-associated genes, we analyzed the poplar genome using sequence comparisons. To this end, we selected 35 disease-associated genes with high similarity to Arabidopsis genes (Table 1). Among these, the Arabidopsis homologous gene of both ‘HDL deficiency 1, ABCA1’ and ‘Stargardt’s, ABCA4’ is At2g41700. Thus 34 homologs were identified in the Arabidopsis genome. By sequence comparison, we also identified 34 homologs in the poplar genome (P. trichocarpa v3.1) (Table 1), with E-values ranging 5.9 × 10−272 and 6.9 × 10−72, indicating that human-disease-related genes are highly conserved in annual and perennial plants. This table was modified and updated from Table 3 of previous research [1].

3.2. Synteny Analysis and Gene Structure Visualization

To explore the evolutionary relationship between these genes, a collinear graph was constructed comparing human, A.thaliana and P. trichocarpa (Figure 1A), and protein pairs highlight in green confirmed the ortholog relationships between human and A.thaliana, as well as human and P. trichocarpa. The protein alignment results between human and Arabidopsis or Populus were displayed in Supplemental Dataset 2 and Supplemental Dataset 3, respectively. The phylogenetic tree of the 35 genes in human, and 34 genes in A.thaliana and P. trichocarpa was constructed based on the amino acid sequence to analyze the ortholog relationship (Figure 1B). The structures of the UTR, exons and introns were also displayed using the Gene Structure Display Server 2.0 (GSDS 2.0) tool (Figure 2A,B). Expect for ROOT HAIR SPECIFIC 8 (RHS8), all other genes contained more than two exons, whether in Arabidopsis (Figure 2A) or Populus (Figure 2B). The average number of exons was 5.1 and 5.0 in A.thaliana [58] and Homo sapiens [59], respectively. Surprisingly, 26 (76.5%) of the 34 genes had a greater number of exons than the average number (Figure 2C). Among them, the ATAXIA TELANGIECTASIA-MUTATED GENE (ATM) gene contained the largest number of exons, with 78. More interestingly, we found that the number of exons of the ATM gene in humans is identical to that of the homologs in A. thaliana and P. trichocarpa. Furthermore, the average exon length of these 34 genes were also analyzed. The exon lengths of the homologous genes in A. thaliana and P. trichocarpa are similar. Moreover, the average exon length of the 34 candidate genes is much larger than the average on the whole-genome level (50 bp) (Figure 2D). In particular, RHS8 contains a super-sized exon, with 1994 bp.
Furthermore, the lengths of the initial, internal and terminal exons of each gene were also calculated. The initial exon lengths differed greatly between A. thaliana and P. trichocarpa, while the internal and terminal exon lengths were similar (Figure 3A–C). In particular, the initial exon length of AGC, ATM, CLC-D ERCC4, MLH1, MSH6, MSH3, S6K1 and S6K2 in A. thaliana were significantly larger than those in P. trichocarpa (Figure 3A).

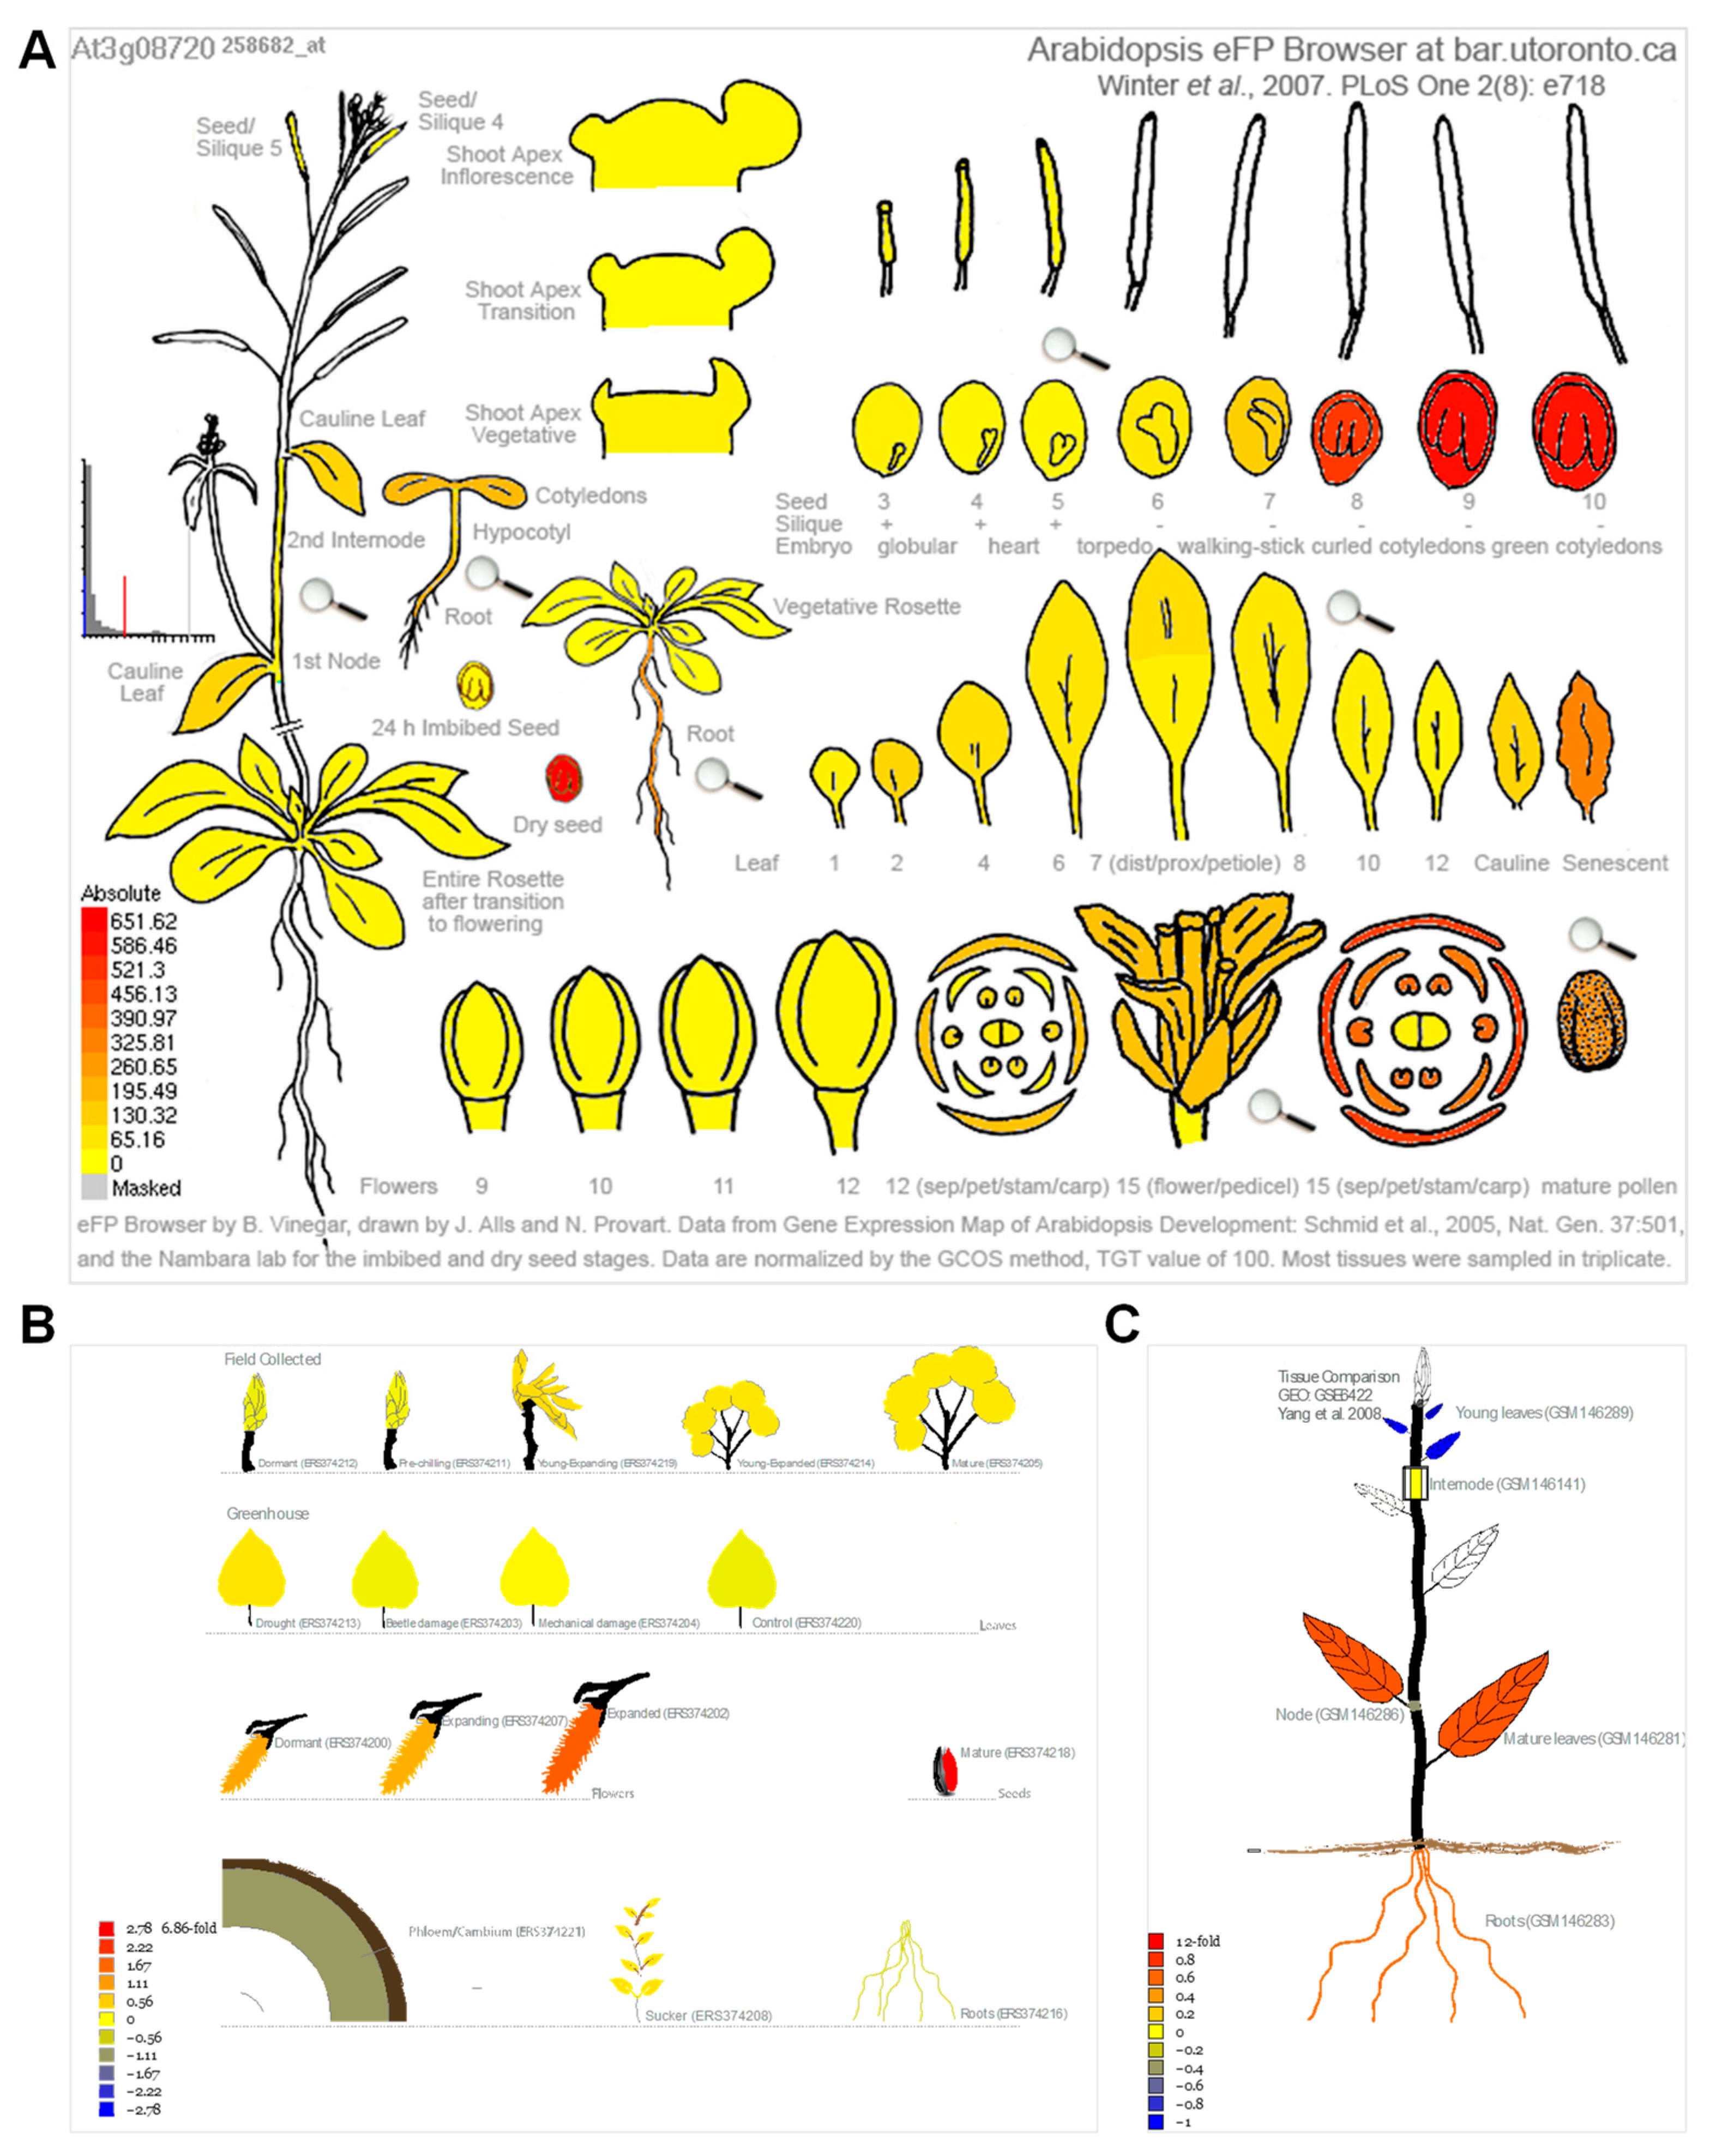
3.3. Gene Expression Analysis Reveals That Most of the Homologous Genes Are Involved in Leaf Senescence Process

Because cellular senescence is closely related to human diseases, next, we next investigated whether the homologous genes of disease-associated genes are also involved in the senescence process in plants. To this end, we analyzed the expression pattern of the 34 genes in Arabidopsis [49] and Populus [50] during leaf senescence. The TPM (transcripts per kilobase of exon model per million mapped reads) value was log-transformed and applied for the data visualization. Gene expression analysis revealed that 27 (79.4%) of the 34 genes were continuously up-regulated during leaf senescence in Arabidopsis (Figure 4A). Two genes, ATM and PhzC were up-regulated during early senescence but decreased during later senescence. The expression of four genes, including MYO5, ASF, RECQI4A and YUC3, was continuously decreased during leaf senescence. Interestingly, the peak expression of MRP10 occurred in the G-to-M and M-to-S transitional period of leaf development (Figure 4A). Unexpectedly, the expression levels of most of genes were decreased as leaf aged in poplar. Only 5 (14.7%) of the 34 genes were continuously up-regulated during leaf senescence in Populus (Figure 4B). Four of five genes, including ABCA1, S6K1, S6K2 and PEX1, were up-regulated during leaf senescence in Arabidopsis and Populus. ATM and PhzC showed increased expression patterns that suddenly decreased in the last leaf developmental stage. YUC3 displayed contrasting expression patterns between in Arabidopsis and Populus. Furthermore, we found that S6K2 is highly expressed in senescent and cauline leaves, according to the Arabidopsis electronic fluorescent pictograph (eFP) browser (Figure 5A) [60], a pattern which is similar with the expression in Populus (Figure 5B,C) [61,62]. S6K2 shows gradient expression from the apical leaf to the basal leaf stages (Figure 5C) [62]. These results confirm that the expression of S6K2 may be conserved between Arabidopsis and Populus.

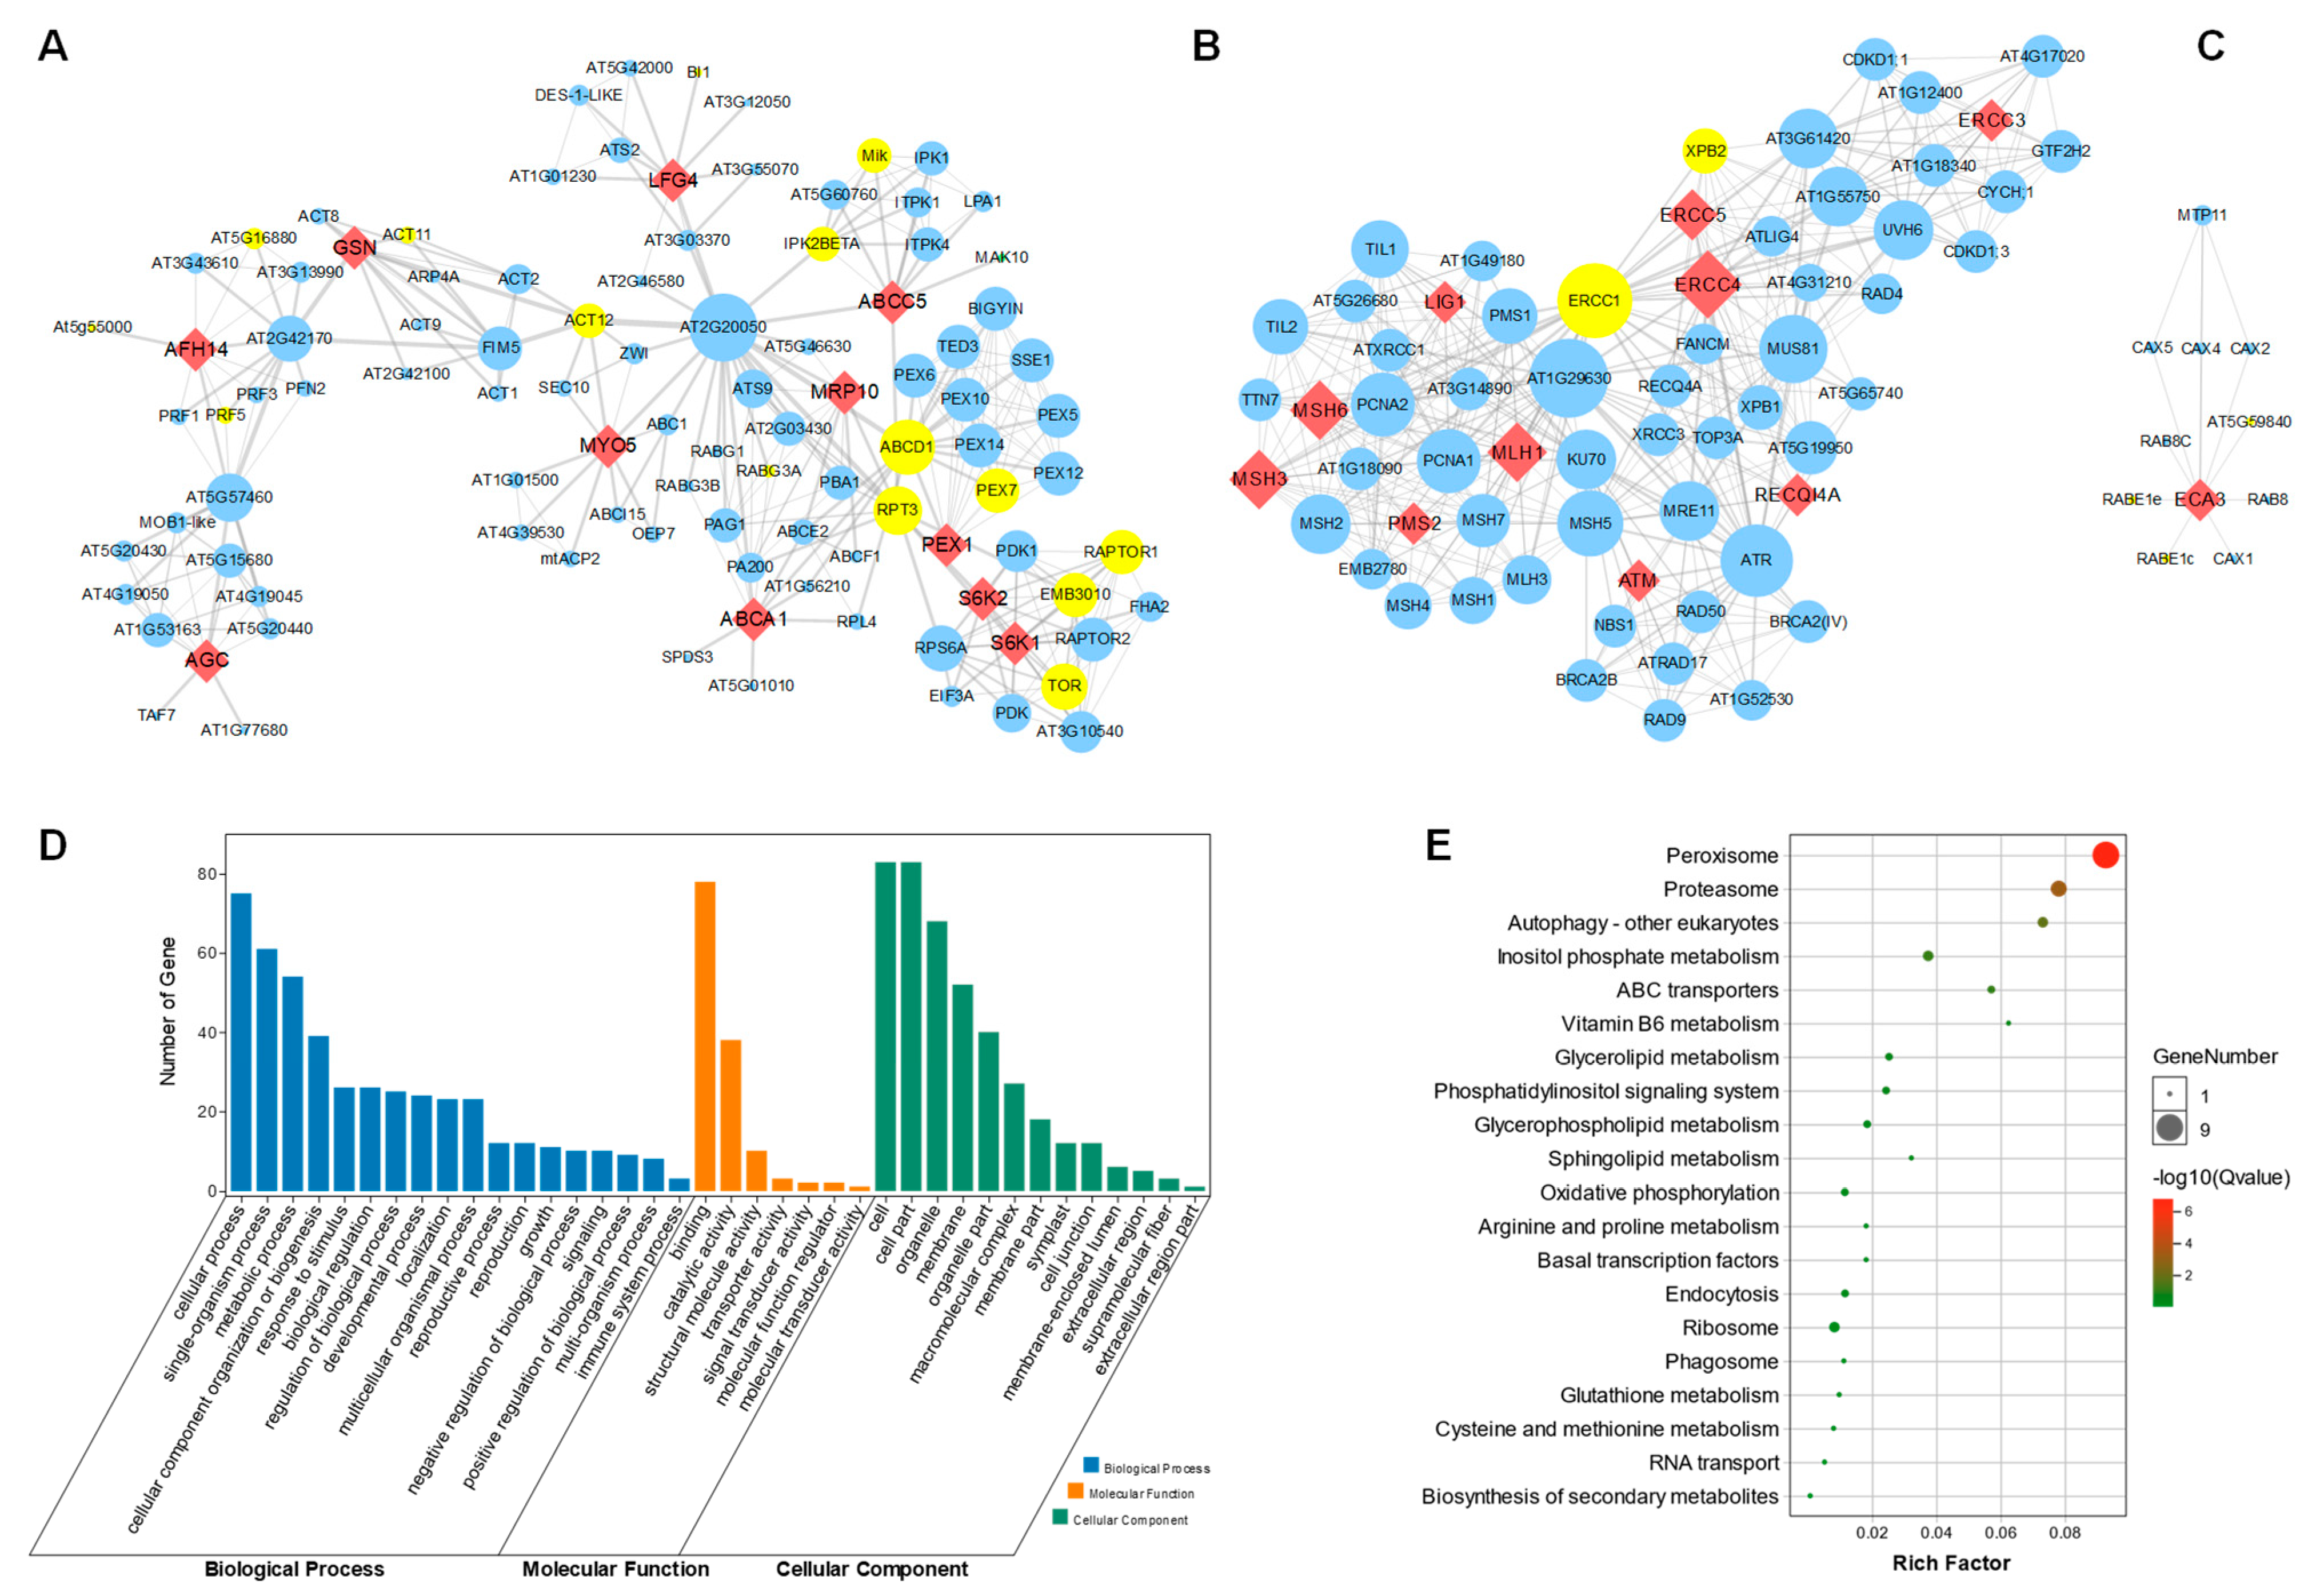
3.4. Protein–Protein Interaction Network Analysis Reveals That 34 Homologous Genes Are Integrated with SAGs

To analyze the interactions between the 34 homologous genes in Arabidopsis, we further constructed the protein–protein interaction (PPI) network. Each of the genes were blasted using the online STRING tool, and the PPI data were further visualized in cytoscape v3.7 software. Interestingly, 11 (32.3%) of the 34 genes formed a first large sub-network (Figure 6A), while 10 (29.4%) of the 34 genes formed second big sub-network (Figure 6B). The ABCA1, LFG4, ABCC5, MRP10, S6K1, S6K2, MYO5, PEX1, GSN, AFH14 and AGC were integrated with 90 other genes in the PPI. Interestingly, 15 of the 90 genes were senescence-associated genes (SAGs), marked in the yellow circle. In addition, LIG1, MSH3, MSH6, PMS2, MLH1, ERCC3, ERCC4, ERCC5, RECQI4A and ATM were integrated with 52 other genes, including 2 SAGs (Figure 6B). ECA3 was integrated integrates with three SAGs, including AT5G59840, RABE1e and RABE1c (Figure 6C). To further explore the detailed pathways of the central genes involved in regulating leaf senescence, we analyzed all these genes in the first sub-network, shown in Figure 6A, via GO (Gene Ontology) and KEGG (Kyoto Encyclopedia of Genes and Genomes) enrichment. We found that the involved genes may participate in regulating the cellular process with binding and catalytic activity functions (Figure 6D). Moreover, these genes are specifically enriched in peroxisome signaling pathways, as well as proteasome, autophagy and inositol-phosphate-metabolism-related processes (Figure 6E), which might provide key clues for further functional study of these human-disease-related genes.
Meanwhile, 13 genes (38.2%) formed an individual PPI network, itself in performing central role. The ECA3 (Figure 6C), CLC-D (Figure 7B), RAN1 (Figure 7E), and NPC1 (Figure 7F) were found to interact with more than two SAGs. The RAN1 interacts with four SAGs, occupying 40% of the predicted network (Figure 7E). Together, the PPI analyses further suggested that these homologous genes are involved in regulating leaf senescence in Arabidopsis.

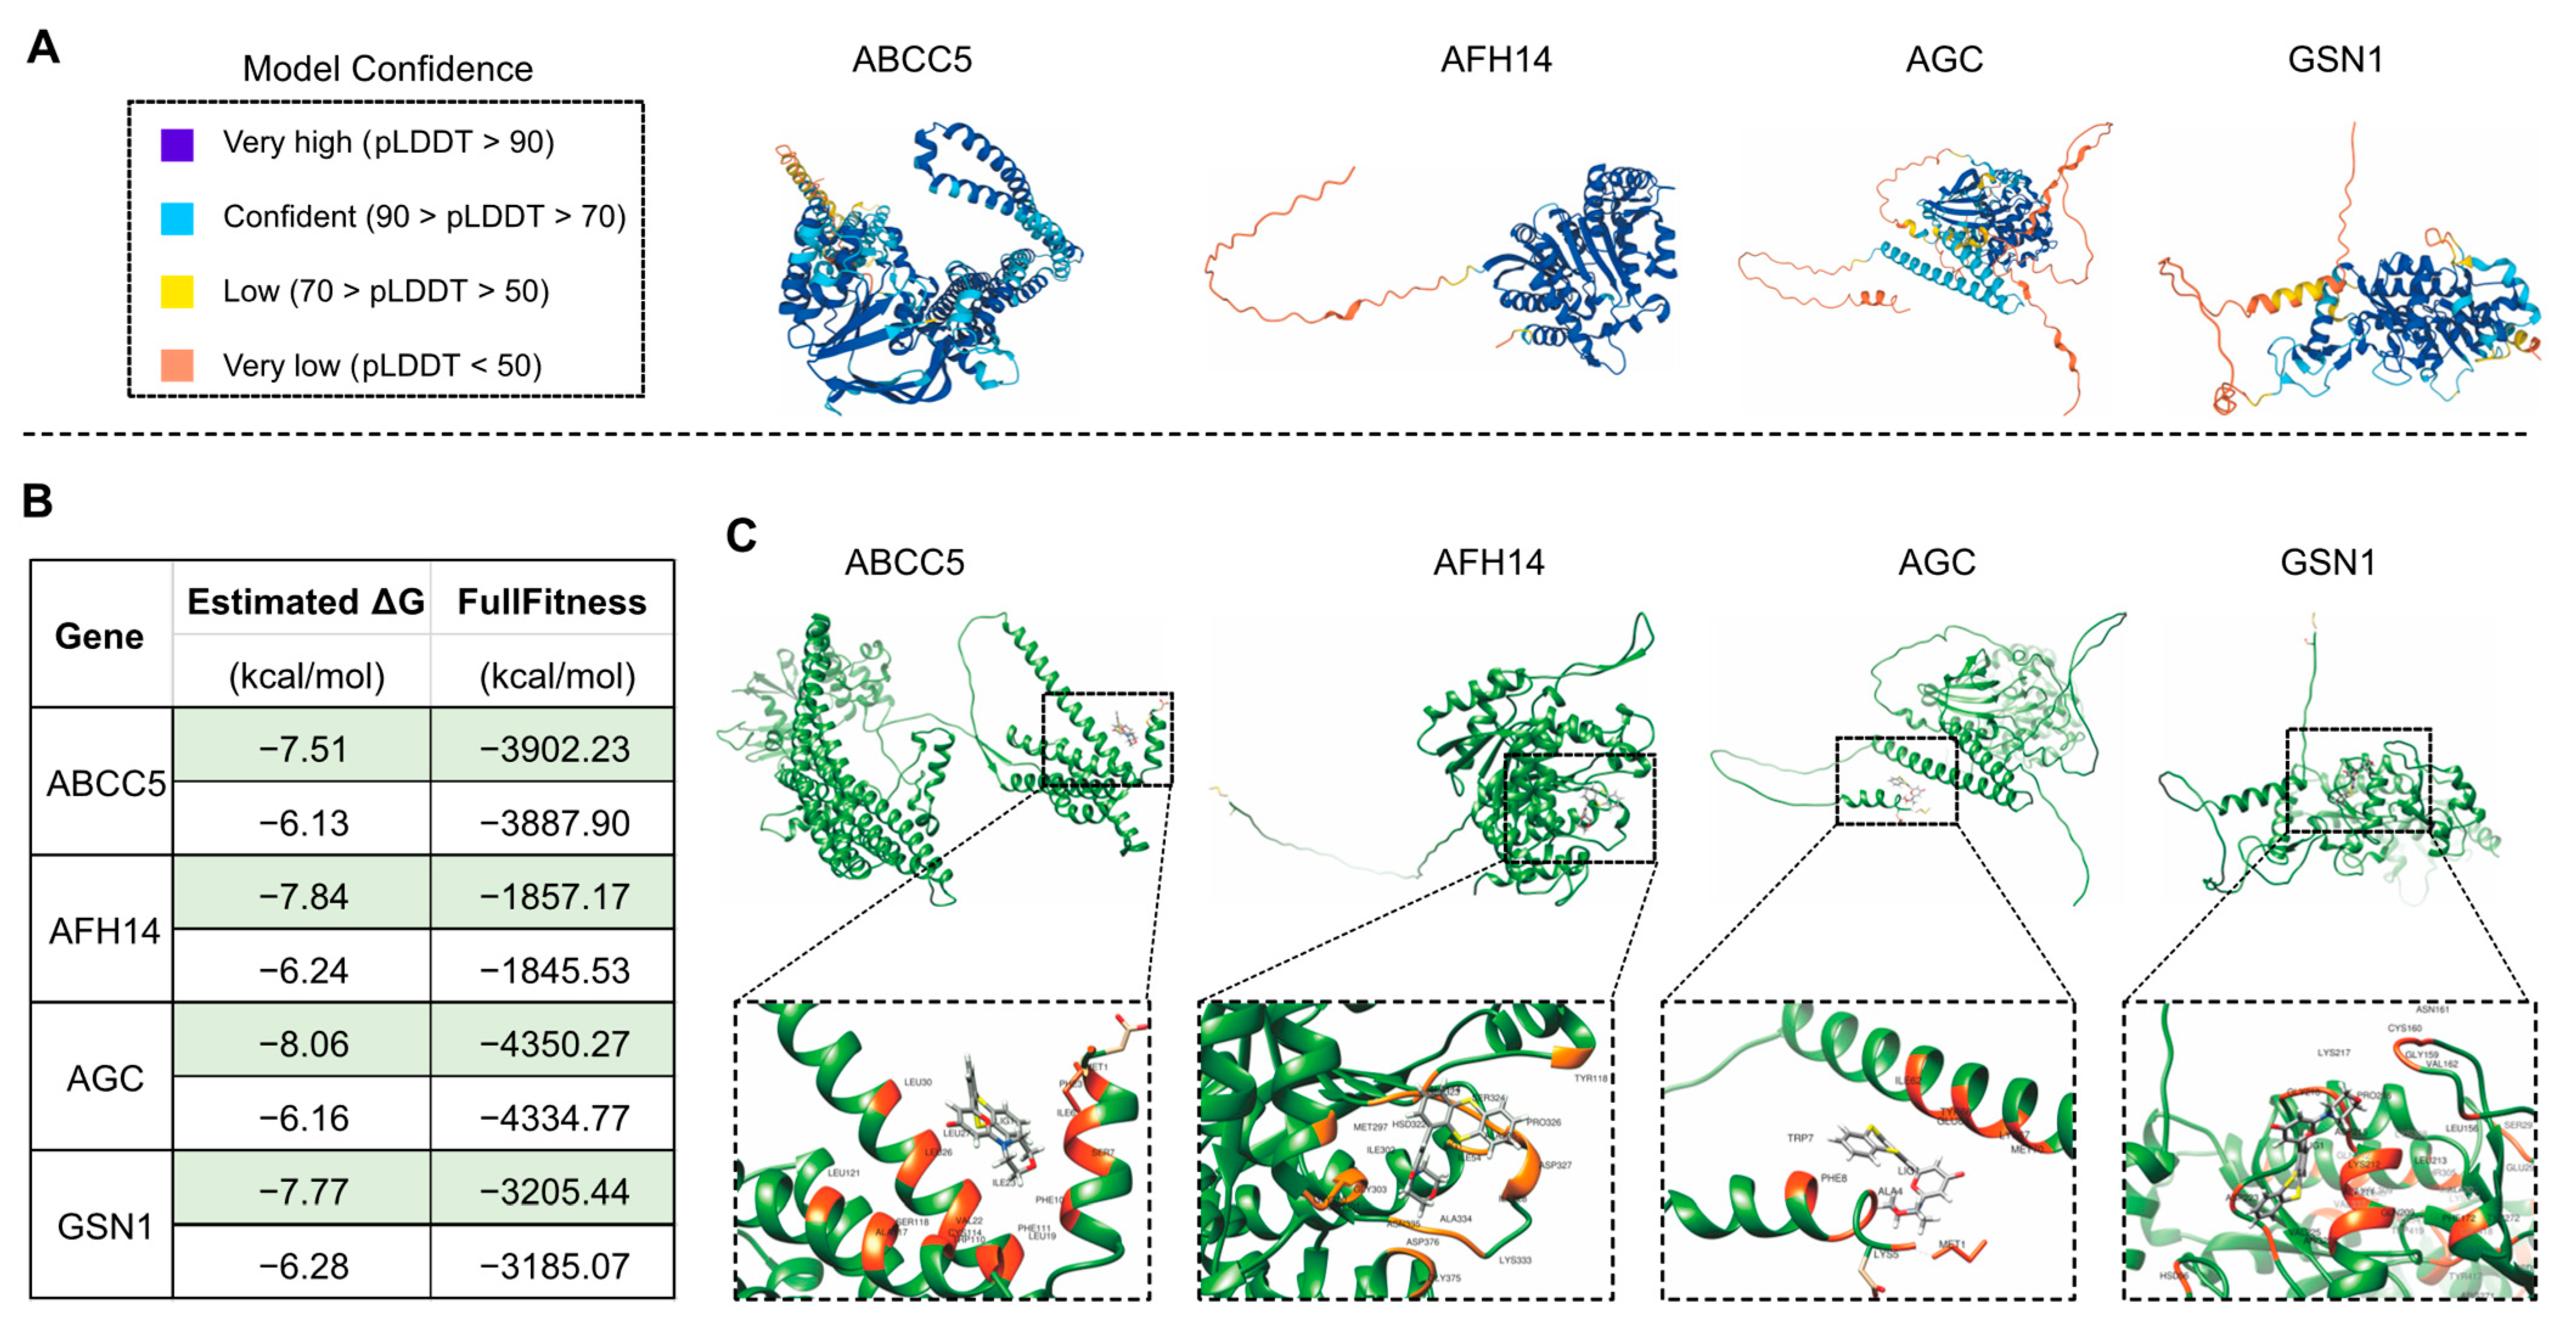
3.5. Molecular Docking Investigation Provides Information and Potential Clues and Approaches for Human Disease Cures by Drug Screening Using the Leaf Senescence Process

Our findings revealed that 27 (79.4%) of the 34 human-disease-related genes were continuously up-regulated during leaf senescence in Arabidopsis, which raised the possibility of using the leaf senescence system to study the mechanisms of action of these homologs, which could then be used to unravel the pathogenesis of human diseases and to screen for possible drugs that can be used to treat these diseases. This analysis might increase the value of research on plants such as Arabidopsis in understanding human disease states [1,63]. Molecular docking is always used to predict the binding sites of drugs to proteins so as to provide the additional important information regarding the experimental results [64,65]. In the present study, the computational structure modeling of the candidate proteins was downloaded from the AlphaFold Protein Structure Database, and the chemical drug data file was downloaded from the National Center for Biotechnology Information (NCBI) PubChem Substance Database. The molecular docking was performed using SwissDock tool [66,67].
The drug KU-55933 was identified as an inhibitor of ATM [68] and was reported to suppresses cell proliferation and induce apoptosis [69], as well as increasing the TMZ responsiveness [70] and sensitizing radioresistant bladder cancer cells [71]. In our study, the molecular docking attempt between Arabidopsis ATM and KU-55933 failed. However, we found that several other candidate proteins, including S6K1 and S6K2 (Figure 8), ABCC5, AFH14, AGC and GSN1 (Figure 9), had primary substrate binding pockets on the molecular surface, which might effectively capture KU-55933. The predicted structure of S6K1 shows a high per-residue confidence score (pLDDT) (Figure 8A). KU-55933 (Figure 8B) has great selectivity for ATM but also has selectivity for other related kinases, such as PI3K [69]. There are more than 20 potential binding combinations between KU-55933 and S6K1, with the estimated ΔG varying from −8.01 to −5.18 kcal/mol (Figure 8C). For SK62, KU-55933 has a minimum and maximum estimated ΔG of −7.61 and −6.24, respectively. Therefore, KU-55933 might have selectivity for S6K1 that is greater than that of S6K2. Moreover, the visualization data show the binding site of Arabidopsis S6K1, with KU-55933 located in a linearization region, and S6K2, with KU-55933 located at a constricted cleft with loop regions (Figure 8D). In addition, the docking results demonstrated that residue GLY63, as well as LYS237 and THR453 of S6K1, can form hydrogen bonds with KU-55933. Thus, the hydrogen bonds between the amino acids of S6K1 and the oxygen atoms of KU-55933 are the major factors in the complex formation. For S6K2, the two contiguous amino acid regions, ASN184 to LEU191 and PHE383 to ASP389, might form hydrogen bonds with KU-55933. Moreover, KU-55933 might also have selectivity for ABCC5, AFH14, AGC and GSN1 (Figure 9). KU-55933 might bind the initial position of ABCC5 and AGC, with contiguous amino acids regions. Moreover, KU-55933 has greater selectivity for AGC than the other three proteins, depending on the estimated ΔG value (Figure 9B).
Furthermore, we also performed the molecular docking of seven drugs, and some were reported to be related to human disease and senescence [72], including (-)-Rapamycin [73,74], FT-0674848, Nadide [75,76], M2698 [77], Spermidine [78,79], HY-147542, and Unii-qkh7mle47U. The molecular formulae are displayed in Figure 10A. The molecular docking results showed that five of the drugs can bind S6K1 (Figure 10B–D), and Nadide can bind S6K1, with a minimum estimated ΔG value of −10.73, indicating that treatment with nadide will most likely lead to an altered leaf senescence altered phenotype. Moreover, there are more than 20 potential binding sites on the surface of S6K1 (Figure 10E–G), and the visualized docking results exhibited that residue GLY63 as well as ARG238, ILE302, GLY303, THR452 and THR453 of S6K1 can form hydrogen bonds with Nadide. More interestingly, Nadide shares the same analyzed residues as KU-55933, such as GLY63 and THR453, indicating that this region of S6K1 might form a general capture pocket.

3.6. Role of Leaf Senescence Research in Understanding Human Disease States

A. thaliana is widely used as a key model organism for plant biology due to its excellent features such as its small genome, rapid reproduction, and multiple ecotypes. The natural process of leaf senescence occurs after growth for 24 days (Figure 5). One can easily observe the leaf senescence phenotype of the 27 up-regulated genes via the genetic mutant. The study of these 27 genes and their roles in regulating leaf senescence, especially the signaling pathways, might provide ideas for this human disease research. Moreover, the development of human-disease-related drugs or signaling pathway models might benefit from transcriptomics, proteomics, metabolomics, genomics, ionomics and epigenomics analyses performed on the genetic material in Arabidopsis. Furthermore, drugs delaying or promoting the leaf senescence process through the repression or activation the functions of these 27 genes might also be used as candidates for human disease research (Figure 11).

4. Discussion

Plants are traditionally considered to produce food and scientific research using plants generally aimed to render this production process efficient with a high quality. However, it is becoming increasingly clear that plants are invaluable experimental tools that can enable humans to live better [80]. For example, plants such as Arabidopsis can be used to understand the molecular mechanisms that underpin human disease states [63]. A high percentage of human-disease-related genes are also present in Arabidopsis, as indicated by genome sequence comparison [1,63]. Protein function and cellular processes are conserved between humans and Arabidopsis, even though they are seemingly distant species. Some human diseases have been examined using Arabidopsis, such as Alzheimer’s and Parkinson’s disease and the neurological disorder Friedreich Ataxia (FRDA). Half of the genes associated with Alzheimer’s disease (AD) [81] have orthologs in Arabidopsis based on genetic identification [63]. AtPreP1 (Arabidopsis pre-sequence protease 1) and AtPreP2 (Arabidopsis pre-sequence protease 2) are orthologs to PITRM1, a human-AD-related protein that degrades Aβ in the human brain mitochondria [82]. AtPrePs share 48% sequence similarity with Human PreP (hPreP). Unstructured small peptides ranging between 10 and 65 amino acids (AA) in length can be digested by AtPreP1 and AtPreP2, and free transit peptides (TP) from chloroplast proteins and pre-signal peptides from mitochondrial proteins are the degradation targets [83,84,85]. Furthermore, the direction and ultimately new findings of human PreP research related to AD are derived from plant PrePs, especially the fundamental research on 3D structural analysis, subcellular localization and substrate specificity [63]. The low abundance (less than 70%) of a mitochondrial iron-binding protein Frataxin (FXN), which is involved in iron–sulfur cluster ([Fe–S]) biosynthesis, leads to a severe neurodegenerative disorder, Friedreich ataxia (FRDA) [86]. A study on Arabidopsis frataxin (AtFH) uncovered that a low abundance of FXN causes increased ROS production and high sensitivity to oxidative stress, and this oxidative stress can be counteracted by high levels of nitric oxide (NO) [87]. Consistent with AD, the understanding or treatment of FRDA could also benefit from fundamental research results on Arabidopsis.
The previous analysis found that 139 (48%) of 289 human-disease-associated genes were similar to genes in Arabidopsis, indicating evolutionary conservation in plants and animals. In this study, we selected 35 disease-associated genes and identified 34 homologous genes in the annual Arabidopsis and perennial poplar for the purpose of in-depth analysis. The gene structure and exon analysis revealed that both in Arabidopsis and in poplar, these 34 genes had many exons, being well above the average number. These genes have multiple transcripts, which are typical of variable shearing phenomena, mainly exon skipping and intron lagging, and may be a direction for future research. Moreover, 27 of the 34 genes are continuously up-regulated during leaf senescence in Arabidopsis, while in Populus, this gene number is 5 (Figure 4). One of the possible reasons for this is that Arabidopsis was cultured inside a greenhouse, and the growth conditions were controlled. On the other hand, the Populus trees grew in a wild field and were subject to various biotic and abiotic stresses. Regarding this specificity, Arabidopsis is more suitable for the establishment of leaf-senescence-regulating model that can be used to study human disease. Moreover, we could also conduct environment controlled leaf senescence tracking process in Populus for future comparison. The PPI network identified 15 SAGs (Figure 6A), including TARGET OF RAPAMYCIN (TOR) integrated two proteins S6K1 and S6K2 which were up-regulated during leaf senescence in both Arabidopsis and Populus. TOR has been widely studied in both mammals [88,89,90] and plants [91,92,93,94]. Fundamental research on the human diseases Coffin–Lowry (RPS6KA3) and AKT2, caused by S6K1 and S6K2, respectively, might benefit from TOR, especially in regard to future research directions for TOR focusing on leaf senescence regulation.
Molecular docking is a powerful method of drug-protein screening. The two genes S6K1 and S6K2, which are up-regulated in both Arabidopsis and poplar during leaf senescence, displayed different binding pockets when analyzed with KU-55933 (Figure 8), and this could be further studied through experiments. Moreover, 27 of the 34 genes could be studied by molecular docking for drug screening, and the identified drugs could be applied if they can delay or promote the leaf senescence process. The 27 genes could be genetically studied and manipulated using the excellent features of the small Arabidopsis genome, including its rapid reproduction, and multiple ecotypes. The screened small molecule compounds which can alter leaf senescence process might provide good candidates for curing human diseases. Many human diseases arise as a consequence of localized cellular senescence, and if drugs can be developed to directly accelerate the progression of these cells from senescence to apoptosis, this may also provide indications to develop cures for human diseases.

5. Conclusions

Our analysis revealed that the similar genes associated with human diseases in Arabidopsis and Populus display greatly more exon number and longer average exon length than the whole-genome average level. Moreover, our study uncovered that in Arabidopsis most of the human disease-related genes were continuously up-regulated during leaf senescence, while in Populus most of the human disease-related genes were continuously down-regulated during leaf senescence. ABCA1, S6K1, S6K2 and PEX1, were up-regulated during leaf senescence both in Arabidopsis and Populus. This study uncovered that human-disease-associated genes in Arabidopsis and Populus are involved in the process of leaf senescence regulation, which was further confirmed by PPI network and molecular docking analysis. In conclusion, understanding of the leaf senescence fundamental mechanisms might be of central importance to human disease treatment.

Supplementary Materials

The following supporting information can be downloaded at: https://www.mdpi.com/article/10.3390/life13020559/s1. Supplemental Dataset 1. Dataset and sequencing project used in this study; Supplemental Dataset 2. Protein alignment results between human and Arabidopsis; Supplemental Dataset 3. Protein alignment results between human and Populus.

Author Contributions

H.-L.W., X.X. and Z.L. conceptualized the study. H.-L.W. contributed to methodology, data analysis and visualization. H.-L.W. and Z.L. wrote the original draft. Z.L., W.Y., H.-L.W. and X.X. contributed to revision and editing. All authors have read and agreed to the published version of the manuscript.

Funding

This work was supported by the National Natural Science Foundation of China (31900173 to H.-L.W.; 32170345, 31970196 and 32011540381 to Z.L.; 32071734 to X.X.). The Fundamental Research Funds for the Central Universities (BLX202115 to H.-L.W.), and Open Fund of State Key Laboratory of Tree Genetics and Breeding, Chinese Academy of Forestry (TGB2021007 to H.-L.W.).

Institutional Review Board Statement

Not applicable.

Informed Consent Statement

Not applicable.

Data Availability Statement

Not applicable.

Conflicts of Interest

The authors declare no conflict of interest.

References

  1. The Arabidopsis Genome Initiative. Arabidopsis Genome, Analysis of the genome sequence of the flowering plant Arabidopsis thaliana. Nature 2000, 408, 796–815. [Google Scholar] [CrossRef] [Green Version]
  2. Petricka, J.J.; Winter, C.M.; Benfey, P.N. Control of Arabidopsis root development. Annu. Rev. Plant Biol. 2012, 63, 563–590. [Google Scholar] [CrossRef] [Green Version]
  3. Fredes, I.; Moreno, S.; Diaz, F.P.; Gutierrez, R.A. Nitrate signaling and the control of Arabidopsis growth and development. Curr. Opin. Plant Biol. 2019, 47, 112–118. [Google Scholar] [CrossRef]
  4. Mittler, R.; Vanderauwera, S.; Gollery, M.; Van Breusegem, F. Reactive oxygen gene network of plants. Trends Plant Sci. 2004, 9, 490–498. [Google Scholar] [CrossRef]
  5. Kim, H.J.; Park, J.-H.; Kim, J.; Kim, J.J.; Hong, S.; Kim, J.; Kim, J.H.; Woo, H.R.; Hyeon, C.; Lim, O.P.; et al. Time-evolving genetic networks reveal a NAC troika that negatively regulates leaf senescence in Arabidopsis. Proc. Natl. Acad. Sci. USA 2018, 115, E4930–E4939. [Google Scholar] [CrossRef] [Green Version]
  6. D’Auria, J.C.; Gershenzon, J. The secondary metabolism of Arabidopsis thaliana: Growing like a weed. Curr. Opin. Plant Biol. 2005, 8, 308–316. [Google Scholar] [CrossRef]
  7. Fan, J.; Yu, L.; Xu, C. Dual role for autophagy in lipid metabolism in Arabidopsis. Plant Cell 2019, 31, 1598–1613. [Google Scholar] [CrossRef] [Green Version]
  8. Liu, M.J.; Wu, S.H.; Wu, J.F.; Lin, W.D.; Wu, Y.C.; Tsai, T.Y.; Tsai, H.L.; Wu, S.H. Translational landscape of photomorphogenic Arabidopsis. Plant Cell 2013, 25, 3699–3710. [Google Scholar] [CrossRef] [Green Version]
  9. Paik, I.; Chen, F.; Pham Ngoc, V.; Zhu, L.; Kim, J.I.; Huq, E. A phyB-PIF1-SPA1 kinase regulatory complex promotes photomorphogenesis in Arabidopsis. Nature Commun. 2019, 10, 4216. [Google Scholar] [CrossRef] [Green Version]
  10. Pruitt, R.N.; Locci, F.; Wanke, F.; Zhang, L.; Saile, S.C.; Joe, A.; Nürnberger, T. The EDS1–PAD4–ADR1 node mediates Arabidopsis pattern-triggered immunity. Nature 2021, 598, 495–499. [Google Scholar] [CrossRef]
  11. Asai, T.; Tena, G.; Plotnikova, J.; Willmann, M.R.; Chiu, W.L.; Gomez-Gomez, L.; Sheen, J. MAP kinase signalling cascade in Arabidopsis innate immunity. Nature 2002, 415, 977–983. [Google Scholar] [CrossRef]
  12. Liu, Z.; Hossain, G.S.; Islas-Osuna, M.A.; Mitchell, D.L.; Mount, D.W. Repair of UV damage in plants by nucleotide excision repair: Arabidopsis UVH1 DNA repair gene is a homolog of Saccharomyces cerevisiae Rad1. Plant J. 2000, 21, 519–528. [Google Scholar] [CrossRef]
  13. Qi, Y.; Zhang, Y.; Zhang, F.; Baller, J.A.; Cleland, S.C.; Ryu, Y.; Voytas, D.F. Increasing frequencies of site-specific mutagenesis and gene targeting in Arabidopsis by manipulating DNA repair pathways. Genome Res. 2013, 23, 547–554. [Google Scholar] [CrossRef] [Green Version]
  14. Zhu, J.K. Abiotic stress signaling and responses in plants. Cell 2016, 167, 313–324. [Google Scholar] [CrossRef] [Green Version]
  15. Zhang, H.; Zhu, J.; Gong, Z.; Zhu, J.K. Abiotic stress responses in plants. Nat. Rev. Genet. 2022, 23, 104–119. [Google Scholar] [CrossRef]
  16. Kumari, P.; Rastogi, A.; Yadav, S. Effects of heat stress and molecular mitigation approaches in orphan legume, Chickpea. Mol. Biol. Rep. 2020, 47, 4659–4670. [Google Scholar] [CrossRef]
  17. Kumari, P.; Gupta, A.; Yadav, S. Thioredoxins as Molecular Players in Plants, Pests, and Pathogens. In Plant-Pest Interactions: From Molecular Mechanisms to Chemical Ecology: Chemical Ecology; Springer: Berlin/Heidelberg, Germany, 2021; pp. 107–125. [Google Scholar]
  18. Kumari, P.; Singh, S.; Yadav, S. Analysis of thermotolerance behaviour of five chickpea genotypes at early growth stages. Braz. J. Bot. 2018, 41, 551–565. [Google Scholar] [CrossRef]
  19. Rubin, G.M.; Yandell, M.D.; Wortman, J.R.; Gabor, G.L.; Miklos; Nelson, C.R.; Lewis, S. Comparative genomics of the eukaryotes. Science 2000, 287, 2204–2215. [Google Scholar] [CrossRef] [Green Version]
  20. Khosla, S.; Farr, J.N.; Tchkonia, T.; Kirkland, J.L. The role of cellular senescence in ageing and endocrine disease. Nat. Rev. Endocrinol. 2020, 16, 263–275. [Google Scholar] [CrossRef]
  21. Chapman, J.; Fielder, E.; Passos, J.F. Mitochondrial dysfunction and cell senescence: Deciphering a complex relationship. FEBS Lett. 2019, 593, 1566–1579. [Google Scholar] [CrossRef] [Green Version]
  22. Childs, B.G.; Baker, D.J.; Kirkland, J.L.; Campisi, J.; Van Deursen, J.M. Senescence and apoptosis: Dueling or complementary cell fates? EMBO Rep. 2014, 15, 1139–1153. [Google Scholar] [CrossRef] [PubMed] [Green Version]
  23. D’Adda di Fagagna, F.; Reaper, P.M.; Clay-Farrace, L.; Fiegler, H.; Carr, P.; Von Zglinicki, T.; Jackson, S.P. A DNA damage checkpoint response in telomere-initiated senescence. Nature 2003, 426, 194–198. [Google Scholar] [CrossRef] [PubMed]
  24. Li, Z.; Zhang, Y.; Zou, D.; Zhao, Y.; Wang, H.-L.; Zhang, Y.; Xia, X.; Luo, J.; Guo, H.; Zhang, Z.; et al. LSD 3.0: A comprehensive resource for the leaf senescence research community. Nucleic Acids Res. 2020, 48, D1069–D1075. [Google Scholar] [CrossRef]
  25. Li, Z.; Kim, J.H.; Kim, J.; Lyu, J., II; Zhang, Y.; Guo, H.; Nam, H.G.; Woo, H.R. ATM suppresses leaf senescence triggered by DNA double-strand break through epigenetic control of senescence-associated genes in Arabidopsis. New Phytol. 2020, 227, 473–484. [Google Scholar] [CrossRef] [PubMed]
  26. Krstic, J.; Reinisch, I.; Schupp, M.; Schulz, T.J.; Prokesch, A. p53 functions in adipose tissue metabolism and homeostasis. Int. J. Mol. Sci. 2018, 19, 2622. [Google Scholar] [CrossRef] [Green Version]
  27. Faget, D.V.; Ren, Q.; Stewart, S.A. Unmasking senescence: Context-dependent effects of SASP in cancer. Nat. Rev. Cancer. 2019, 19, 439–453. [Google Scholar] [CrossRef] [PubMed]
  28. De Cecco, M.; Criscione, S.W.; Peckham, E.J.; Hillenmeyer, S.; Hamm, E.A.; Manivannan, J.; Peterson, A.L.; Kreiling, J.A.; Neretti, N.; Sedivy, J.M. Genomes of replicatively senescent cells undergo global epigenetic changes leading to gene silencing and activation of transposable elements. Aging Cell 2013, 12, 247–256. [Google Scholar] [CrossRef] [PubMed] [Green Version]
  29. De Cecco, M.; Ito, T.; Petrashen, A.P.; Elias, A.E.; Skvir, N.J.; Criscione, S.W.; Caligiana, A.; Brocculi, G.; Adney, E.M.; Boeke, J.D.; et al. L1 drives IFN in senescent cells and promotes age-associated inflammation. Nature 2019, 566, 73–78. [Google Scholar] [CrossRef]
  30. Chaib, S.; Tchkonia, T.; Kirkland, J.L. Cellular senescence and senolytics: The path to the clinic. Nat. Med. 2022, 28, 1556–1568. [Google Scholar] [CrossRef]
  31. Woo, H.R.; Masclaux-Daubresse, C.; Lim, P.O. Plant senescence: How plants know when and how to die. J. Exp. Bot. 2018, 69, 715–718. [Google Scholar] [CrossRef]
  32. Lim, P.O.; Kim, H.J.; Nam, H.G. Leaf senescence. Annu. Rev. Plant Biol. 2007, 58, 115–136. [Google Scholar] [CrossRef] [PubMed] [Green Version]
  33. Woo, H.R.; Kim, H.J.; Lim, P.O.; Nam, H.G. Leaf senescence: Systems and dynamics aspects. Annu. Rev. Plant Biol. 2019, 70, 347–376. [Google Scholar] [CrossRef] [PubMed] [Green Version]
  34. Cao, J.; Zhang, Y.; Tan, S.; Yang, Q.; Wang, H.-L.; Xia, X.; Luo, J.; Guo, H.; Zhang, Z.; Li, Z. LSD 4.0: An improved database for comparative studies of leaf senescence. Mol. Hortic. 2022, 2, 24. [Google Scholar] [CrossRef]
  35. Maury, E.; Ramsey, K.M.; Bass, J. Circadian rhythms and metabolic syndrome: From experimental genetics to human disease. Circ. Res. 2010, 106, 447–462. [Google Scholar] [CrossRef] [Green Version]
  36. Kim, H.; Kim, Y.; Yeom, M.; Lim, J.; Nam, H.G. Age-associated circadian period changes in Arabidopsis leaves. J. Exp. Bot. 2016, 67, 2665–2673. [Google Scholar] [CrossRef] [PubMed] [Green Version]
  37. Wang, Y.; Zhang, Y.; Wang, L. Cross regulatory network between circadian clock and leaf senescence is emerging in higher plants. Front. Plant Sci. 2018, 9, 700. [Google Scholar] [CrossRef] [PubMed]
  38. Kim, H.; Kim, H.J.; Vu, Q.T.; Jung, S.; McClung, C.R.; Hong, S.; Nam, H.G. Circadian control of ORE1 by PRR9 positively regulates leaf senescence in Arabidopsis. Proc. Natl. Acad. Sci. USA 2018, 115, 8448–8453. [Google Scholar] [CrossRef] [Green Version]
  39. Lee, I.C.; Hong, S.W.; Whang, S.S.; Lim, P.O.; Nam, H.G.; Koo, J.C. Age-dependent action of an ABA-inducible receptor kinase, RPK1, as a positive regulator of senescence in Arabidopsis leaves. Plant Cell Physiol. 2011, 52, 651–662. [Google Scholar] [CrossRef] [Green Version]
  40. Vijg, J. Somatic mutations and aging: A re-evaluation. Mutat. Res-Fund. Mol. M. 2000, 447, 117–135. [Google Scholar] [CrossRef]
  41. Guo, Y.; Ren, G.; Zhang, K.; Li, Z.; Miao, Y.; Guo, H. Leaf senescence: Progression, regulation, and application. Mol. Hortic. 2021, 1, 5. [Google Scholar]
  42. Shiloh, Y.; Ziv, Y. The ATM protein kinase: Regulating the cellular response to genotoxic stress, and more. Nat. Rev. Mol. Cell Biol. 2013, 14, 197–210. [Google Scholar] [CrossRef]
  43. Tuskan, G.A.; DiFazio, S.; Jansson, S.; Bohlmann, J.; Grigoriev, I.; Hellsten, U.; Putnam, N.; Ralph, S.; Rombauts, S.; Salamov, A.; et al. The genome of black cottonwood, Populus trichocarpa (Torr. & Gray). Science 2006, 313, 1596–1604. [Google Scholar]
  44. Buchfink, B.; Xie, C.; Huson, D.H. Fast and sensitive protein alignment using DIAMOND. Nat. Methods 2015, 12, 59–60. [Google Scholar] [CrossRef]
  45. Chen, C.; Chen, H.; Zhang, Y.; Thomas, H.R.; Frank, M.H.; He, Y.; Xia, R. TBtools: An integrative toolkit developed for interactive analyses of big biological data. Mol. Plant 2020, 13, 1194–1202. [Google Scholar] [CrossRef]
  46. Hu, B.; Jin, J.; Guo, A.Y.; Zhang, H.; Luo, J.; Gao, G. GSDS 2.0: An upgraded gene feature visualization server. Bioinformatics 2015, 31, 1296–1297. [Google Scholar] [CrossRef] [Green Version]
  47. Larkin, M.A.; Blackshields, G.; Brown, N.P.; Chenna, R.; McGettigan, P.A.; McWilliam, H.; Valentin, F.; Wallace, I.M.; Wilm, A.; Lopez, R.; et al. Clustal W and Clustal X version 2.0. Bioinformatics 2007, 23, 2947–2948. [Google Scholar] [CrossRef] [Green Version]
  48. Kumar, S.; Stecher, G.; Tamura, K. MEGA7: Molecular evolutionary genetics analysis version 7.0 for bigger datasets. Mol. Biol. Evol. 2016, 33, 1870–1874. [Google Scholar] [CrossRef] [Green Version]
  49. Woo, H.R.; Koo, H.J.; Kim, J.; Jeong, H.; Yang, J.O.; Lee, H., II; Jun, J.H.; Choi, S.H.; Park, S.J.; Kang, B.; et al. Programming of plant leaf senescence with temporal and inter-organellar coordination of transcriptome in Arabidopsis. Plant Physiol. 2016, 171, 452–467. [Google Scholar] [CrossRef] [Green Version]
  50. Wang, H.-L.; Zhang, Y.; Wang, T.; Yang, Q.; Yang, Y.; Li, Z.; Li, B.; Wen, X.; Li, W.; Yin, W.; et al. An alternative splicing variant of PtRD26 delays leaf senescence by regulating multiple NAC transcription factors in Populus. Plant Cell 2021, 33, 1594–1614. [Google Scholar] [CrossRef]
  51. Kodama, Y.; Shumway, M.; Leinonen, R. The Sequence Read Archive: Explosive growth of sequencing data. Nucleic Acids Res. 2012, 40, D54–D56. [Google Scholar] [CrossRef] [Green Version]
  52. Lamesch, P.; Berardini, T.Z.; Li, D.; Swarbreck, D.; Wilks, C.; Sasidharan, R.; Muller, R.; Dreher, K.; Alexander, D.L.; Garcia-Hernandez, M.; et al. The Arabidopsis Information Resource (TAIR): Improved gene annotation and new tools. Nucleic Acids Res. 2012, 40, D1202–D1210. [Google Scholar] [CrossRef]
  53. Kim, D.; Paggi, J.M.; Park, C.; Bennett, C.; Salzberg, S.L. Graph-based genome alignment and genotyping with HISAT2 and HISAT-genotype. Nat. Biotechnol. 2019, 37, 907–915. [Google Scholar] [CrossRef] [PubMed]
  54. Wagner, G.P.; Kin, K.; Lynch, V.J. Measurement of mRNA abundance using RNA-seq data: RPKM measure is inconsistent among samples. Theor Biosci. 2012, 131, 281–285. [Google Scholar] [CrossRef] [PubMed]
  55. Kolde, R.; Kolde, M.R. Package ‘pheatmap’. R Package 2018, 1, 10. [Google Scholar]
  56. Jumper, J.; Evans, R.; Pritzel, A.; Green, T.; Figurnov, M.; Ronneberger, O.; Tunyasuvunakool, K.; Bates, R.; Žídek, A.; Potapenko, A.; et al. Highly accurate protein structure prediction with AlphaFold. Nature 2021, 596, 583–589. [Google Scholar] [CrossRef]
  57. Kim, S.; Thiessen, P.A.; Bolton, E.E.; Chen, J.; Fu, G.; Gindulyte, A.; Han, L.; He, J.; He, S.; Shoemaker, B.A.; et al. PubChem substance and compound databases. Nucleic Acids Res. 2016, 44, D1202–D1213. [Google Scholar] [CrossRef]
  58. Alexandrov, N.N.; Troukhan, M.E.; Brover, V.V.; Tatarinova, T.; Flavell, R.B.; Feldmann, K.A. Features of Arabidopsis genes and genome discovered using full-length cDNAs. Plant Mol. Biol. 2006, 60, 69–85. [Google Scholar] [CrossRef]
  59. Long, M.; Deutsch, M. Intron—Exon structures of eukaryotic model organisms. Nucleic Acids Res. 1999, 27, 3219–3228. [Google Scholar] [CrossRef] [Green Version]
  60. Winter, D.; Vinegar, B.; Nahal, H.; Ammar, R.; Wilson, G.V.; Provart, N.J. An “Electronic Fluorescent Pictograph” browser for exploring and analyzing large-scale biological data sets. PLoS ONE 2007, 2, e718. [Google Scholar] [CrossRef]
  61. Sundell, D.; Mannapperuma, C.; Netotea, S.; Delhomme, N.; Lin, Y.C.; Sjödin, A.; de Peer, Y.V.; Jansson, S.; Hvidsten, T.R.; Street, N.R. The plant genome integrative explorer resource: PlantGenIE. org. New Phytol. 2015, 208, 1149–1156. [Google Scholar] [CrossRef] [Green Version]
  62. Yang, X.; Kalluri, U.C.; Jawdy, S.; Gunter, L.E.; Yin, T.; Tschaplinski, T.J.; Weston, D.J.; Ranjan, P.; Tuskan, G.A. The F-box gene family is expanded in herbaceous annual plants relative to woody perennial plants. Plant Physiol. 2008, 148, 1189–1200. [Google Scholar] [CrossRef] [PubMed] [Green Version]
  63. Xu, X.M.; Møller, S.G. The value of Arabidopsis research in understanding human disease states. Curr. Opin. Biotechnol. 2011, 22, 300–307. [Google Scholar] [CrossRef] [PubMed]
  64. Gschwend, D.A.; Good, A.C.; Kuntz, I.D. Molecular docking towards drug discovery. J. Mol. Recognit. 1996, 9, 175–186. [Google Scholar] [CrossRef]
  65. Morris; Garrett, M.; Marguerita, L.-W. “Molecular Docking.” Molecular Modeling of Proteins; Humana Press: Totowa, NJ, USA, 2008; pp. 365–382. [Google Scholar]
  66. Grosdidier, A.; Zoete, V.; Michielin, O. SwissDock, a protein-small molecule docking web service based on EADock DSS. Nucleic Acids Res. 2011, 39 (Suppl. S2), W270–W277. [Google Scholar] [CrossRef] [PubMed] [Green Version]
  67. Bitencourt-Ferreira, G.; Azevedo, W.F.D. Docking with SwissDock. In Docking Screens for Drug Discovery; Humana: New York, NY, USA, 2019; pp. 189–202. [Google Scholar]
  68. Hickson, I.; Zhao, Y.; Richardson, C.J.; Green, S.J.; Martin, N.M.; Orr, A.I.; Smith, G.C. Identification and characterization of a novel and specific inhibitor of the ataxia-telangiectasia mutated kinase ATM. Cancer Res. 2004, 64, 9152–9159. [Google Scholar] [CrossRef] [Green Version]
  69. Li, Y.; Yang, D.Q. The ATM inhibitor KU-55933 suppresses cell proliferation and induces apoptosis by blocking Akt in cancer cells with overactivated AktAkt inhibition by ATM inhibitor KU-55933. Mol. Cancer Ther. 2010, 9, 113–125. [Google Scholar] [CrossRef] [Green Version]
  70. Nadkarni, A.; Shrivastav, M.; Mladek, A.C.; Schwingler, P.M.; Grogan, P.T.; Chen, J.; Sarkaria, J.N. ATM inhibitor KU-55933 increases the TMZ responsiveness of only inherently TMZ sensitive GBM cells. J. Neuro-Oncol. 2012, 110, 349–357. [Google Scholar] [CrossRef] [Green Version]
  71. Zhang, T.; Shen, Y.; Chen, Y.; Hsieh, J.T.; Kong, Z. The ATM inhibitor KU55933 sensitizes radioresistant bladder cancer cells with DAB2IP gene defect. Int. J. Radiat. Biol. 2015, 91, 368–378. [Google Scholar] [CrossRef]
  72. Wang, H.L.; Guo, H.; Li, Z. Gene network analysis of senescence-associated genes in annual plants and comparative assessment of aging in perennials and animals. Transl. Med. Aging 2019, 3, 6–13. [Google Scholar] [CrossRef]
  73. Ehninger, D.; Neff, F.; Xie, K. Longevity, aging and rapamycin. Cell. Mol. Life Sci. 2014, 71, 4325–4346. [Google Scholar] [CrossRef] [Green Version]
  74. Blagosklonny, M.V. Rapamycin for longevity: Opinion article. Aging 2019, 11, 8048. [Google Scholar] [CrossRef]
  75. Belenky, P.; Bogan, K.L.; Brenner, C. NAD+ metabolism in health and disease. Trends Biochem. Sci. 2007, 32, 12–19. [Google Scholar] [CrossRef] [PubMed]
  76. Covarrubias, A.J.; Perrone, R.; Grozio, A.; Verdin, E. NAD+ metabolism and its roles in cellular processes during ageing. Nat. Rev. Mol. Cell Biol. 2021, 22, 119–141. [Google Scholar] [CrossRef]
  77. Tsimberidou, A.M.; Shaw, J.V.; Juric, D.; Verschraegen, C.; Weise, A.M.; Sarantopoulos, J.; Kurzrock, R. Phase 1 study of M2698, a p70S6K/AKT dual inhibitor, in patients with advanced cancer. J. Hematol. Oncol. 2021, 14, 1–10. [Google Scholar] [CrossRef]
  78. Madeo, F.; Eisenberg, T.; Pietrocola, F.; Kroemer, G. Spermidine in health and disease. Science 2018, 359, eaan2788. [Google Scholar] [CrossRef] [PubMed] [Green Version]
  79. Al-Habsi, M.; Chamoto, K.; Matsumoto, K.; Nomura, N.; Zhang, B.; Sugiura, Y.; Honjo, T. Spermidine activates mitochondrial trifunctional protein and improves antitumor immunity in mice. Science 2022, 378, eabj3510. [Google Scholar] [CrossRef] [PubMed]
  80. Martin, C.; Butelli, E.; Petroni, K.; Tonelli, C. How can research on plants contribute to promoting human health? Plant Cell 2011, 23, 1685–1699. [Google Scholar] [CrossRef] [Green Version]
  81. Bettens, K.; Sleegers, K.; Van Broeckhoven, C. Current status on Alzheimer disease molecular genetics: From past, to present, to future. Hum. Mol. Genet. 2010, 19, R4–R11. [Google Scholar] [CrossRef] [Green Version]
  82. Alikhani, N.; Ankarcrona, M.; Glaser, E. Mitochondria and Alzheimer’s disease: Amyloid-β peptide uptake and degradation by the presequence protease, hPreP. J. Bioenerg. Biomembr. 2009, 41, 447–451. [Google Scholar] [CrossRef]
  83. Stahl, A.; Pavlov, P.F.; Szigyarto, C.; Glaser, E. Rapid degradation of the presequence of the F1β precursor of the ATP synthase inside mitochondria. Biochem. J. 2000, 349, 703–707. [Google Scholar] [CrossRef] [Green Version]
  84. Stahl, A.; Moberg, P.; Ytterberg, J.; Panfilov, O.; Von Lowenhielm, H.B.; Nilsson, F.; Glaser, E. Isolation and identification of a novel mitochondrial metalloprotease (PreP) that degrades targeting presequences in plants. J. Biol. Chem. 2002, 277, 41931–41939. [Google Scholar] [CrossRef] [PubMed] [Green Version]
  85. Stahl, A.; Nilsson, S.; Lundberg, P.; Bhushan, S.; Biverstahl, H.; Moberg, P.; Glaser, E. Two novel targeting peptide degrading proteases, PrePs, in mitochondria and chloroplasts, so similar and still different. J. Mol. Biol. 2005, 349, 847–860. [Google Scholar] [CrossRef]
  86. Puccio, H.; Koenig, M. Friedreich ataxia: A paradigm for mitochondrial diseases. Curr. Opin. Genet Dev. 2002, 12, 272–277. [Google Scholar] [CrossRef]
  87. Martin, M.; Colman, M.J.R.; Gómez-Casati, D.F.; Lamattina, L.; Zabaleta, E.J. Nitric oxide accumulation is required to protect against iron-mediated oxidative stress in frataxin-deficient Arabidopsis plants. FEBS Lett. 2009, 583, 542–548. [Google Scholar] [CrossRef] [PubMed] [Green Version]
  88. Raught, B.; Gingras, A.C.; Sonenberg, N. The target of rapamycin (TOR) proteins. Proc. Natl. Acad. Sci. USA 2001, 98, 7037–7044. [Google Scholar] [CrossRef] [PubMed] [Green Version]
  89. Loewith, R.; Hall, M.N. Target of rapamycin (TOR) in nutrient signaling and growth control. Genetics 2011, 189, 1177–1201. [Google Scholar] [CrossRef] [Green Version]
  90. Laplante, M.; Sabatini, D.M. mTOR signaling in growth control and disease. Cell 2012, 149, 274–293. [Google Scholar] [CrossRef] [Green Version]
  91. Couso, I.; Evans, B.S.; Li, J.; Liu, Y.; Ma, F.; Diamond, S.; Umen, J.G. Synergism between inositol polyphosphates and TOR kinase signaling in nutrient sensing, growth control, and lipid metabolism in Chlamydomonas. Plant Cell 2016, 28, 2026–2042. [Google Scholar] [CrossRef] [Green Version]
  92. Dobrenel, T.; Caldana, C.; Hanson, J.; Robaglia, C.; Vincentz, M.; Veit, B.; Meyer, C. TOR signaling and nutrient sensing. Annu. Rev. Plant Biol. 2016, 67, 261–285. [Google Scholar] [CrossRef]
  93. Fu, L.; Wang, P.; Xiong, Y. Target of rapamycin signaling in plant stress responses. Plant Physiol. 2020, 182, 1613–1623. [Google Scholar] [CrossRef] [Green Version]
  94. Fu, L.; Liu, Y.; Qin, G.; Wu, P.; Zi, H.; Xu, Z.; Xiong, Y. The TOR–EIN2 axis mediates nuclear signaling to modulate plant growth. Nature 2021, 591, 288–292. [Google Scholar] [CrossRef] [PubMed]
Figure 1. Synteny and phylogenetic tree analysis of 34 human-disease related genes in A. thaliana and P. trichocarpa. (A) The collinearity of 34 gene pairs is emphasized and highlighted in green lines while the synteny blocks between human and Arabidopsis or Populus are shown in gray lines. (B) Phylogenetic tree of 35 human genes and their 34 orthologs in Arabidopsis and Populus. The amino acid sequence was used for alignment and the human-disease-related genes were marked as green.
Life 13 00559 g001
Figure 2. Phylogenetic, gene structure and exon statistical analyses of 34 Arabidopsis and Populus genes which are similar to human disease genes. (A,B) The phylogenetic and gene structure of Arabidopsis (A) and Populus (B) genes. The genealogical tree was constructed using whole-length amino acid sequences. The sequences were aligned using the ClustalX2 tool and visualized by MEGA-X software. Blue boxes, orange boxes and blacklines indicate exons, UTRs and introns, respectively. (C) Exon number statistics of Arabidopsis and Populus genes, where the arrows indicate the average exon number of each gene on whole-genome level in Arabidopsis and Populus, respectively. (D) Average exon length statistics of Arabidopsis and Populus genes, where the arrow indicate the average exon length of each gene on whole-genome level in Arabidopsis.
Life 13 00559 g002
Figure 3. The human-disease-related genes in Arabidopsis and Populus display longer internal exons but shorter terminal exons. (AC) Length of the initial (A), internal (B) and terminal (C) exons of Arabidopsis and Populus genes. The arrows indicate the medium length of each type of exon.
Life 13 00559 g003
Figure 4. The expression patterns of 34 human-disease-related genes in Arabidopsis and Populus during the leaf senescence process. (A) Heatmap visualization of 34 genes during the leaf senescence process in Arabidopsis in a controlled indoor greenhouse environment. (B) Expression display of 34 genes during the autumn leaf senescence process of Populus in natural outdoor environment. The red/blue color bars indicate the range of expression, and the values are log-transformed from the TPM expression value.
Life 13 00559 g004
Figure 5. The S6K2 expression in Arabidopsis and Populus. (A) S6K2 expression in Arabidopsis according to the Arabidopsis electronic fluorescent pictograph (eFP) browser (bar.utoronto.ca/efp/cgi-bin/efpWeb.cgi (accessed on accessed on 13 December 2022)) [60]. (B) S6K2 expression in Populus tremula according to the popgenie exImage database (https://popgenie.org/eximage?eplant=enable (accessed on accessed on 13 December 2022)) [61]. (C) S6K2 expression in different tissues of P. trichocarpa according to the popgenie exImage database (https://popgenie.org/eximage?eplant=enable (accessed on accessed on 13 December 2022)) [62].
Life 13 00559 g005
Figure 6. Protein–protein interaction network construction of the candidate genes. (A) PPI network centered with LFG4, ABCC5, ABCA1, MRP10, S6K1, S6K2, MYO5, PEX1, GSN, AFH14 and AGC. Red diamond nodes indicate the human disease similarity genes in Arabidopsis. Small blue circle nodes are proteins that might interact with these genes. Yellow circle nodes are marked as senescence-associated genes (SAGs). The thickness of the line indicates the possibility of interaction, and a thicker line displays higher possibility of interaction. Larger size of the circle nodes indicate more interactions. (B) PPI network centered with LIG1, MSH3, MSH6, PMS2, MLH1, ERCC3, ERCC4, ERCC5, RECQ4A and ATM. (C) PPI network that is centered with ECA3. (D) GO function enrichment of all genes in (A). (E) KEGG enrichment of all genes in (A).
Life 13 00559 g006
Figure 7. Protein–protein interaction network construction of the candidate genes. (AL) PPI network centered with ASF (A), CLC-D (B), GLI1 (C), PhzC (D), RAN1 (E), NPC1 (F), YUC3 (G), RHS8 (H), G6PD6 (I), ABC27 (J), ATP6B (K) and HP (L). Red diamond nodes indicate the human-disease-related genes in Arabidopsis. Blue circle nodes are proteins that might interact with these genes. Yellow circle nodes are marked as senescence-associated genes (SAGs). The thickness of the line indicates the possibility of interaction, and a thicker line denotes higher possibility of interaction. Larger circle nodes indicate more interactions.
Life 13 00559 g007
Figure 8. Analysis of the predicted structures and molecular docking of Arabidopsis S6K1 and S6K2. (A) The predicated structures of S6K1 and S6K2. The data files used for 3D structure visualization were downloaded from the AlphaFold Protein Structure Database. (B) Molecular formula of chemical drug KU-55933 (2-Morpholino-6-(thianthren-1-yl)-4H-pyran-4-one). The data file used for molecular docking was downloaded from the PubChem Substance Database. (C) Molecular docking of KU-55933 with S6K1 and S6K2. The minimum (marked in green color) and maximum estimated ΔG and FullFitness data are displayed. (D) Visualized molecular docking with the minimum estimate ΔG of S6K1 and S6K2, respectively. The orange residues highlight the interaction between the protein and KU-55933.
Life 13 00559 g008
Figure 9. Analysis of the predicted structures and molecular docking of Arabidopsis ABCC5, AFH14, AGC and GSN1. (A) The predicated structures of ABCC5, AFH14, AGC and GSN1. (B) Molecular docking of KU-55933 with ABCC5, AFH14, AGC and GSN1. The minimum (marked in green color) and maximum estimated ΔG and FullFitness data are displayed. (C) Visualized molecular docking of the minimum estimated ΔG of ABCC5, AFH14, AGC and GSN1 with KU-55933. The orange residues highlight the interaction between the protein and KU-55933.
Life 13 00559 g009
Figure 10. Molecular docking of Arabidopsis S6K1 with seven chemicals for drug screening. (A) Molecular formula of seven chemical drugs. The data file used for molecular docking was downloaded from the PubChem Substance Database. (B,C) Visualized molecular docking of S6K1 with spermidine (B) and Unii-qkh7mle47U (C). The orange residues highlight the interaction between the protein and drug. (D) The minimum (marked in green color) and maximum estimated ΔG and FullFitness data are displayed. (E) Superposed models of the surface of S6K1. (F) All the potential interaction sites of S6K1 with Nadide. (G) The docking with minimum estimated ΔG. The orange residues highlight the interaction and the amino acid are marked in white.
Life 13 00559 g010
Figure 11. Model for using leaf senescence biological process to study human disease. As 27 of the 34 genes are SAGs, i.e., 79.4%, leaf senescence can be used as a critical biological process to study human disease. Multiple omics methods including transcriptomics, proteomics, metabolomics, genomics, ionomics and epigenomics can be used. Additionally, drug screening, mutant identification, ecotype diversity and signaling can be applied to analyze the gene function. The in-depth analysis of ATM, MSH3, ERCC5, MLH1, PMS2 and other genes might provide important information clue for human disease research.
Life 13 00559 g011
Table 1. Arabidopsis and Populus genes with similarities to human disease genes. This table was modified and updated from Table 3 of previous research [1].
Human Disease GeneArabidopsisPopulusGene DescriptionGene Name
Myotonic dystrophy, DM1AT2G20470.1Potri.005G226700.1AGC (cAMP, cGMP-dependent and protein kinase C)AGC
Deafness, hereditary, MYO15AT2G31900.1Potri.009G025300.1myosin-like protein XIF, myosin V (MYO5)MYO5
HDL deficiency 1, ABCA1AT2G41700.1Potri.006G049300.1ATP-binding cassette A1ABCA1
Stargardt’s, ABCA4AT2G41700.1Potri.006G049300.1ATP-binding cassette A1ABCA1
Coffin–Lowry, RPS6KA3AT3G08720.1Potri.016G138400.1p70 ribosomal S6 kinase (RPS6KB)S6K2
AKT2AT3G08730.1Potri.006G109600.1p70 ribosomal S6 kinase (RPS6KB)S6K1
Xeroderma Pigmentosum, G-XPGAT3G28030.1Potri.017G070500.1DNA excision repair protein ERCC-5 (ERCC5, XPG, RAD2)ERCC5
Ataxia telangiectasia, ATMAT3G48190.1Potri.015G076650.1ataxia telangiectasia mutated family protein (ATM, TEL1)ATM
Cystic fibrosis, ABCC7AT3G62700.1Potri.014G130500.1Multidrug resistance-associated protein 10MRP10
HNPCC, MSH6AT4G02070.1Potri.T171400.1DNA MISMATCH REPAIR PROTEIN MSH6MSH6
HNPCC, PMS2AT4G02460.1Potri.014G130800.1DNA mismatch repair protein PMS2 (PMS2)PMS2
HNPCC*, MLH1AT4G09140.1Potri.019G078700.2DNA mismatch repair protein MLH1 (MLH1)MLH1
Citrullinemia, type I, ASSAT4G24830.1Potri.008G020200.1Argininosuccinate synthase/Citrulline--aspartate ligaseASF
HNPCC, MSH3AT4G25540.1Potri.015G142900.1DNA mismatch repair protein MSH3 (MSH3)MSH3
Renal tubul. acidosis, ATP6B1AT4G38510.1Potri.004G177500.1V-type H+-transporting ATPase subunit B (ATPeV1B, ATP6B)ATP6B
Zellweger, PEX1AT5G08470.1Potri.001G174100.4peroxin-1 (PEX1)PEX1
Dents, CLCN5AT5G26240.1Potri.010G090100.1H(+)/CL(-) EXCHANGE TRANSPORTER 7CLC-D
Bare lymphocyte, ABCB3AT5G39040.1Potri.017G097200.1ABC TRANSPORTER B FAMILY MEMBER 27ABC27
G6PD deficiency, G6PDAT5G40760.1Potri.017G070200.1glucose-6-phosphate 1-dehydrogenaseG6PD6
Xeroderma Pigmentosum, F-XPFAT5G41150.1Potri.001G150400.1DNA excision repair protein ERCC-4 (ERCC4, XPF)ERCC4
Xeroderma pigment, B-ERCC3AT5G41360.1Potri.001G101300.3DNA excision repair protein ERCC-3 (ERCC3, XPB)ERCC3
Wilson, ATP7BAT5G44790.1Potri.001G158900.1Cu(+) exporting ATPase/copper-exporting ATPaseRAN1
Finnish amyloidosis, GSNAT5G57320.1Potri.006G165300.1villin/gelsolin (GSN)GSN
Darier–White, SERCAAT1G10130.1Potri.014G014700.2endoplasmic reticulum-type calcium-transporting ATPase 3ECA3
Xeroderma Pigmentosum, D-XPDAT1G03210.1Potri.010G175700.1Phenazine biosynthesis PhzC/PhzF proteinPhzC
Hyperinsulinism, ABCC8AT1G04120.1Potri.002G255800.4multidrug resistance-associated protein 5ABCC5
Immunodeficiency, DNA Ligase 1AT1G08130.1Potri.009G005900.2DNA ligase 1LIG1
Niemann–Pick, NPC1AT1G42470.1Potri.002G009600.2Niemann-Pick C1 protein (NPC1)NPC1
Menkes, ATP7AAT1G63450.1Potri.001G105300.2root hair specific 8RHS8
Fam, cardiac myopathy, MYH7AT1G04610.1Potri.008G174600.1Probable indole-3-pyruvate monooxygenase YUCCA3YUC3
Glycerol kinase defic, GKAT1G80460.1Potri.003G030900.1Actin-like ATPase superfamily proteinGLI1
Bloom, BLMAT1G10930.1Potri.003G015800.1DNA helicase isologRECQl4A
Chediak–Higashi, CHS1AT1G03070.1Potri.002G049000.1Bax inhibitor-1 family proteinLFG4
Bartter’s, SLC12A1AT1G30475.1Potri.011G163901.1hypothetical proteinHP
Diaphanous 1, DAPH1AT1G31810.1Potri.003G103800.1Formin Homology 14AFH14
Disclaimer/Publisher’s Note: The statements, opinions and data contained in all publications are solely those of the individual author(s) and contributor(s) and not of MDPI and/or the editor(s). MDPI and/or the editor(s) disclaim responsibility for any injury to people or property resulting from any ideas, methods, instructions or products referred to in the content.

