Simple Summary
In pulmonary artery hypertension, right ventricular (RV) afterload is increased, which requires the cardiomyocytes to contract with greater force against the additional pulmonary artery pressure. In response, RV cardiomyocytes increase contractile protein content to maintain greater workload, consuming larger amounts of energy (supplied by the mitochondria) on a beat-to-beat basis. Failing hearts have been described as an “engine out of fuel”, but it is unclear how the mitochondria match ATP supply to demand in hypertrophic hearts prior to failure. Therefore, our aims were (i) to measure beat-to-beat mitochondrial Ca2+ fluxes, and (ii) to determine mitochondrial abundance and function in hypertrophied cardiomyocytes prior to the onset of heart failure. To identify the early adaptive changes in energy supply prior to failure, we utilised a rat model of pulmonary artery hypertension to investigate RV cardiomyocytes during compensated hypertrophy in comparison to their normotensive controls. Mitochondrial Ca2+ fluxes were increased in hypertrophied cardiomyocytes, but no difference was found in oxidative phosphorylation between the groups. This suggests that the larger mitochondrial Ca2+ transients are a compensatory mechanism to match ATP supply to the increased energy demands of hypertrophic cardiomyocytes.
Abstract
Pulmonary artery hypertension causes right ventricular hypertrophy which rapidly progresses to heart failure with underlying cardiac mitochondrial dysfunction. Prior to failure, there are alterations in cytosolic Ca2+ handling that might impact mitochondrial function in the compensatory phase of RV hypertrophy. Our aims, therefore, were (i) to measure beat-to-beat mitochondrial Ca2+ fluxes, and (ii) to determine mitochondrial abundance and function in non-failing, hypertrophic cardiomyocytes. Male Wistar rats were injected with either saline (CON) or monocrotaline (MCT) to induce pulmonary artery hypertension and RV hypertrophy after four weeks. Cytosolic Ca2+ ([Ca2+]cyto) transients were obtained in isolated right ventricular (RV) cardiomyocytes, and mitochondrial Ca2+ ([Ca2+]mito) was recorded in separate RV cardiomyocytes. The distribution and abundance of key proteins was determined using confocal and stimulated emission depletion (STED) microscopy. The RV mitochondrial function was also assessed in RV homogenates using oxygraphy. The MCT cardiomyocytes had increased area, larger [Ca2+]cyto transients, increased Ca2+ store content, and faster trans-sarcolemmal Ca2+ extrusion relative to CON. The MCT cardiomyocytes also had larger [Ca2+]mito transients. STED images detected increased mitochondrial protein abundance (TOM20 clusters per μm2) in MCT, yet no difference was found when comparing mitochondrial respiration and membrane potential between the groups. We suggest that the larger [Ca2+]mito transients compensate to match ATP supply to the increased energy demands of hypertrophic cardiomyocytes.
1. Introduction
In pulmonary artery hypertension (PAH), right ventricular (RV) afterload is increased, which requires RV cardiomyocytes to contract with greater force to eject a sufficient stroke volume. In response, RV cardiomyocytes hypertrophy, thus increasing their contractile protein content. This allows the RV to contract against greater pressures [1]. Due to this chronic increase in workload, hypertrophic hearts constantly require larger amounts of ATP to achieve an adequate cardiac output on a beat-to-beat basis. We have previously shown that, when RV hypertrophy progresses to failure, there is significant mitochondrial dysfunction [2,3]; however there are changes in Ca2+ handling that precede failure [4,5,6], which can affect both energy supply and force development. Previous evaluation of cardiomyocyte ATP, ADP, and Pi in vivo has shown that their concentrations remain relatively constant over a wide range of cardiac outputs [7]. The mitochondria play an important role in matching ATP supply to meet the ever-changing demands of the heart by utilising two key regulatory mechanisms. The first is an ADP metabolic feedback mechanism [8], and the second senses the magnitude of cytosolic Ca2+ changes during EC coupling [9]. Ca2+ can diffuse from the cytosol into the mitochondria via the voltage-dependent anion channel 1 on the outer mitochondrial membrane [10], where it then gets taken up into the mitochondrial matrix via the mitochondrial Ca2+ uniporter (MCU) on the inner mitochondrial membrane [11]. Ca2+ can then enhance the activity of various Ca2+ sensitive enzymes of the Krebs cycle, ultimately increasing ATP production [12]. Extrusion of mitochondrial Ca2+ occurs via the mitochondrial Na+/Li+/Ca2+ exchanger (mNLCX), which prevents mitochondrial Ca2+ overload and the pathological opening of the mitochondrial transition pores (mPTP) [13]. It is known that the mitochondria undergo a number of changes in the failing heart (for a review see Xu et al [14], one of which is attributed to Ca2+ overload [15]. It was thought that increased MCU Ca2+ re-uptake during relaxation could be protective by reducing arrhythmias caused by elevated levels of [Ca2+]cyto [16]. On the other hand, high levels of [Ca2+]mito can also stimulate the opening of the mPTP, which can cause significant damage to the mitochondria and disrupt ATP production, interfering with energy supply-and-demand matching [13]. Nonetheless, if the cardiomyocyte mitochondria cannot match the heart’s energetic demands, cardiac output can become compromised, which is a cardinal feature of heart failure (HF).
Prior to the onset of HF, there is an earlier state of compensatory cardiac hypertrophy. During compensated cardiac hypertrophy, cardiomyocytes require greater amounts of ATP to be produced per cell. However, it is currently unclear whether this stage is associated with an increased abundance of mitochondria per hypertrophied cell, or whether the mitochondria present are simply required to work harder to supply the ATP required. In addition, the kinetics of mitochondrial Ca2+ fluxes remain poorly understood, primarily due to the challenges of measuring mitochondrial Ca2+ in intact muscle preparations [17]. The main aim of our study was, therefore, to measure mitochondrial Ca2+ fluxes in healthy cardiomyocytes and also in hypertrophied cardiomyocytes prior to the onset of heart failure. Additionally, we aimed to determine whether cytosolic Ca2+ handling also had an impact on mitochondrial Ca2+ fluxes. Our second aim was to compare the distribution and relative abundance of the myofilaments, mitochondria, and ryanodine receptors between groups using confocal and stimulated emission depletion (STED) microscopy of fixed RV tissue sections. Our final aim was to examine mitochondrial oxidative phosphorylation during compensated hypertrophy. To achieve our aims, we utilised the monocrotaline rat model of pulmonary artery hypertension (PAH) during compensated right ventricular hypertrophy and their normotensive controls [6,18].
2. Materials and Methods
2.1. Animal Model and Ethical Approval
Pulmonary artery hypertension was induced in male Wistar rats of body weight 306.4 ± 6.6 g (mean ± SEM) by subcutaneous injection of 60 mg kg−1 monocrotaline (MCT, Sigma Aldrich, Castle Hill, Australia). Control (CON) rats were injected with the same volume of sterile saline. Post injection, rats were monitored and weighed regularly, as previously described [18]. Approval for this research was provided by the University of Auckland Animal Ethics Committee (AEC: 001807 and 001412) in accordance with the Code of Ethical Conduct of The University of Auckland and the New Zealand Animal Welfare Act 1999.
2.2. Cell Isolation
On the day of experimentation (30 ± 2 days post injection), the rats were euthanised, and their hearts were removed, weighed, and rapidly cannulated via the aorta. Dissociation of quiescent, rod-shaped cardiomyocytes was carried out using standard enzymatic digestion, as previously described [17]. The livers and lungs were also removed, blotted, and weighed for subsequent morphometric analysis.
2.3. Loading of Ca2+ Indicators
Isolated RV myocytes from each heart were divided into aliquots for the different measurements carried out. For cytosolic Ca2+, cells were loaded with 10 µM Fura-2/AM (Invitrogen, Thermo Fisher Scientific, Waltham, MA, USA) dissolved in 20 µL dimethyl sulphoxide anhydrous (DMSO, ThermoFisher) with 20% pluronic Invitrogen (Scientific, Life Technologies NZ, Auckland, New Zealand) for 20 min at room temperature. Cells were then washed with 1 mM Ca2+ Tyrode’s solution for at least 10 min prior to imaging. Mitochondrial Ca2+ measurements were taken in cells loaded with di-hydroRhod-2 (dhRhod-2), as previously described [17]. Briefly, a single 50 µg vial of Rhod-2 indicator (Invitrogen, Scientific, Life Technologies NZ) was dissolved in DMSO and 20% pluronic in DMSO was added. The smallest possible amount of Na+ borohydride (reducing agent) was dissolved in 20 µL methanol, and 10 µL was added to the Rhod-2 vial. After 5–10 min, 1 mL of cell suspension was added to 5 µM dhRhod-2 and left for 1 h at 37 °C. Cells were then washed for at least 30 min prior to imaging.
2.4. Experimental Solutions and Protocols
Cytosolic Ca2+ transients were recorded in RV cardiomyocytes loaded with Fura-2 (as described in Section 2.3). Cells were field-stimulated at 1 Hz (room temperature) and continuously superfused with Tyrode’s solution containing (in mM): 140 NaCl, 4 KCl, 10 Hepes, 1 MgCl2, 10 Glucose, and 1 CaCl2 (all Sigma-Aldrich Co. Merck, Darmstadt, Germany). Myocytes were imaged using a 20× fluorescent objective lens (0.75 NA) and illuminated with alternating 340 nm and 380 nm excitation wavelengths every 5 ms using an Optoscan monochromator and a spectrofluorometric PMT-based system (Cairn, Faversham, the UK). Emitted 510 ± 15 nm fluorescence was acquired at 400 Hz using Acquisition Engine Software (Cairn, Faversham, the UK) from whole cells as a measure of cytosolic [Ca2+] fluxes. Myocytes were subjected to 1 Hz stimulation until steady state was achieved. At this point, both the flow and the stimulation were switched off, and a 20 mM bolus of caffeine (Sigma-Aldrich) in Tyrode’s solution was applied to the bath to determine Ca2+ store content and sarcolemmal NCX activity. Superfusion with caffeine-free Tyrode’s solution and stimulation at 1 Hz were then re-commenced. The response to β-adrenergic stimulation with 1 mM Ca2+ Tyrode’s solution containing 1 µM isoproterenol (ISO, Sigma-Aldrich, cat no. 16504) was then determined.
Mitochondrial Ca2+ measurements were taken from dhRhod-2 loaded myocytes using the same spectrofluorometric system described above. Cells were field-stimulated at 0.1, 0.5, and 1 Hz (room temperature) and continuously superfused with 1.5 mM [Ca2+] Tyrode’s solution containing 1 µM isoproterenol and 150 µM spermine (Cayman Chemical, Ann Arbor, MI, USA, cat no. 136587-13-8). Myocytes were illuminated with a 542 ± 10 nm excitation wavelength and emitted fluorescence was collected at 581 nm (±10 nm) from whole cells as a measure of mitochondrial Ca2+ fluxes.
2.5. Labelling, Fixation, and Imaging of RV Tissue Sections
For details on fixation and labelling of isolated cardiomyocytes and tissue sections, refer to the Supplementary Data file. Confocal and STED images of RV sections dual-labelled with translocator of the outer mitochondrial membrane/ryanodine receptors (TOM20/RyR2) were obtained with an Olympus IX83 Abberior Facility Line STED microscope using a 60× oil immersion objective lens (NA 1.42). To show a larger portion of the tissue being analysed, confocal images were first captured with a 70 µm × 70 µm frame size at 80 nm pixel resolution. Then, both confocal and STED images were captured from a smaller portion of the tissue section (15 µm × 15 µm frame size) at a 15 nm pixel resolution with 594 nm and 640 nm lasers simultaneously at excitation laser powers 3–6% for confocal and STED images. Power for the STED depletion laser, emitted at 775 nm, was between 6% and 10%. Furthermore, confocal images of RV sections co-labelled for F-actin (Alexa Fluor 488 Phalloidin conjugate, 1:50, A12379, Thermofisher Scientific, Waltham, MA, USA) and mitochondria (TOM20) were obtained with a Zeiss LSM800 laser-scanning confocal microscope using a 63× oil-immersion objective lens (NA of 1.4). Images were captured at a 50 nm pixel resolution with 488 nm and 594 nm lasers simultaneously at 0.4% laser power.
2.6. Mitochondrial Respiration and Membrane Potential
Mitochondrial respiration and membrane potential (ΔΨ) were measured in a separate cohort of saline and monocrotaline-injected rats (300–350 g; n = 20; AEC: R1403). Following rat euthanasia and cardiac excision, an RV sample was processed for high-resolution respirometry coupled to fluorometry with an Oxygraph-O2K™ respirometer (Oroboros™, Innsbruck, Austria). Approximately 20 mg of tissue was homogenised for 10 s in 25 volumes of ice-cold respiration buffer (RB; containing (in mM): MgCl2.6H2O (3), K-lactobionate (60), taurine (20), KH2PO4 (10), HEPES (20) and sucrose (110), with essential fatty acid free bovine serum albumin (BSA; 1 g L−1) and adjusted to pH 7.1 with KOH at 37 °C.). RV homogenate (1 mg mL−1) was added in duplicate to each chamber of the oxygraph containing 2 mL of RB prior to the addition of 2 µM safranine-O. ΔΨ was measured by following safranine-O fluorescence using a filter set for excitation/emission wavelengths of 495/587 nm in the oxygraph fluorometers [19]. Complex I substrates were added and left to achieve a stable ΔΨ. Oxidative phosphorylation (OXPHOS) was then initiated by the addition of 0.1 mM ADP along with 5 mM glucose and 2 U mL−1 of hexokinase to keep mitochondria in a phosphorylating state [20]. Then, 0.3 mM CaCl2 was added to each chamber followed by 0.25 mM titrations to achieve free [Ca2+] from 0.39 µM to 52 µM (calculated using the MAXCHELATOR CaMgADPEGTA program). Then, 2 µM carbonyl cyanide p- (trifluoro-methoxy) phenyl-hydrazone (FCCP) was added to achieve a zero-membrane potential for safranine-O calibration. To calculate the ΔΨ, the Nernst equation (Equation (3)) was used as previously described [21]. Here, R is the gas constant, F is the Faraday constant, T is the temperature in Kelvin, and z is the valence state of safranine-O (+1). Cin is the concentration of safranine-O within the mitochondria and Cout is the concentration of safranine-O in the RB. CRB is the concentration of safranine-O measured in the RB at any point during the assay. Non-mitochondrial safranine-O uptake was subtracted from the total concentration of safranine-O (Ctotal − CFCCP) determined by the signal following the addition of FCCP, which did not return to baseline which is normally seen with isolated mitochondria [21]. VRB is the volume of respiration buffer (2 mL), and Vmito is the mitochondrial volume, which was estimated to be 3.1 μL mg−1 based on our previous assumptions [22].
2.7. Data Analysis
For further details of our data analysis, refer to the Supplementary Data file. Briefly, morphometric data were analysed by unpaired, two-tailed, t-tests to determine the differences in body and organ weights between groups. Cytosolic and mitochondrial Ca2+ transient data from RV myocytes were acquired using the Acquisition Engine (Cairn Research, Faversham, UK), and subsequently analysed using a custom-written IDL program (IDL version 6.2, Research Systems Inc., Boulder, CO, USA) to determine the various Ca2+ transient parameters. Parameters were subsequently analysed using two-way ANOVA for multiple comparisons between groups and interventions. Additionally, confocal images of RV sections co-labelled with phalloidin and TOM20 were acquired on Zen Blue software and subsequently analysed on Image J FIJI. Data from these images were also statistically analysed using a two-way ANOVA for multiple comparisons between groups (MCT vs. CON) and between labels (phalloidin vs. TOM20). Simultaneous confocal and STED images of RV sections immunolabelled for TOM20 and RyR2 were acquired using Lightbox Software (Abberior Instruments, Göttingen, Germany). STED images of RV tissue sections were also analysed using ImageJ FIJI to determine (i) the area of single clusters and (ii) the number of visible clusters per 1 µm2. These parameters were subsequently analysed by unpaired, two-tailed t-tests between groups. All statistical tests were performed using GraphPad Prism 9 Analysis software. The number of animals or hearts investigated is presented as “N”, while the number of cardiomyocytes is presented as “n”, unless otherwise stated.
3. Results
3.1. Evidence of Hypertrophy from Morphometric Data
At 30 ± 2 days (mean ± SEM) post injection, CON and MCT rats were sacrificed, and morphometric measurements were obtained. Table 1 shows that the CON body weights were higher than the MCT body weights on the day of experimentation (p < 0.001). The MCT animals had higher wet/dry lung weights compared to the CON animals (p < 0.01), with no difference in wet/dry liver weights, heart weight, or tibial length between groups. The heart weight:body weight (%) was not different between CON and MCT animals (p = 0.06). The cardiomyocyte area was calculated by measuring the perimeter of isolated cells, as illustrated by the grey outlines around representative cardiomyocytes in Figure 1A,B. Figure 1C shows that the LV CON myocytes were larger (mean ± SEM, 3963.54 ± 159.66 μm2) relative to the CON RV myocytes (3252.55 ± 152.08 μm2, p < 0.01). However, the MCT RV myocyte area (4134.29 ± 152.56 μm2) was higher than both the CON RV (p < 0.001) and the MCT LV myocyte areas (3578.31 ± 137.93 μm2, p < 0.05). There were no differences between CON and MCT LV myocytes or CON LV myocytes vs. MCT RV myocytes.

Table 1.
Morphometric data from CON and MCT rats obtained on the day of experimentation. Heart weight:body weight (HW:BW %). Results are presented as mean ± SEM. N = number of rats/group. ** p < 0.01, *** p < 0.001.
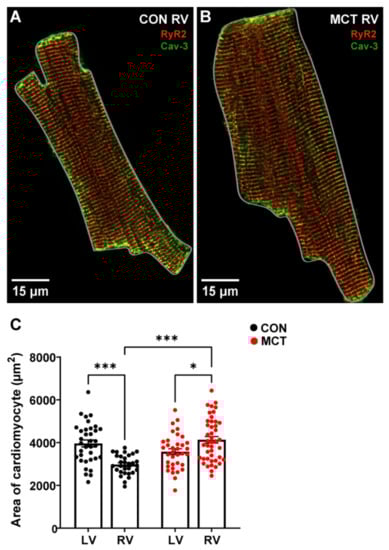
Figure 1.
Area of left ventricular (LV) and right ventricular (RV) cardiomyocytes isolated from control (CON) and monocrotaline (MCT) rat hearts. (A,B) show fixed isolated RV cardiomyocytes from CON (A) and MCT (B) hearts immunolabelled for ryanodine receptors (RyR2, red) and Caveolin-3 (Cav-3, green). The grey outlines around the cardiomyocytes in (A,B) show how the cardiomyocyte area was measured. The myocyte in (A) (CON) had an area of 2047.20 μm2, whereas the hypertrophied myocyte in (B) (MCT) had an area of 3503.05 μm2. Data in (C) show cardiomyocyte areas from CON LV and RV cardiomyocytes (black) and MCT LV and RV cardiomyocytes (red). Bar graphs show mean ± SEM areas. N = 3 CON hearts with n = 35 LV, and n = 34 RV myocytes. N = 3 MCT hearts, with n = 35 LV, and n = 44 RV myocytes. * p < 0.05, *** p < 0.001.
3.2. Response to β-Adrenergic Stimulation
Cytosolic Ca2+ fluxes were measured in response to β-adrenergic stimulation in RV myocytes subjected to 1 µM isoproterenol (ISO). Figure 2 shows the mean ± SEM data recorded from the CON and MCT RV cardiomyocytes before ISO (−) and during response to ISO (+ISO). Figure 2A shows that ISO increased the amplitude of [Ca2+]cyto transients for CON RV myocytes (mean ± SEM 340/380 ratio, 1.99 ± 0.15 a.u.) vs. before ISO (1.41 ± 0.14 a.u., p < 0.01), whereas MCT myocytes showed no change in [Ca2+]cyto amplitude in response to ISO (1.67 ± 0.16 a.u.) relative to pre-ISO (1.51 ± 0.16 a.u.). However, MCT RV myocytes had larger baseline [Ca2+]cyto transients (1.58 ± 0.46 a.u.) relative to CON RV myocytes (1.26 ± 0.31 a.u., p < 0.05) before the introduction of ISO. Figure 2B shows that CON RV myocyte [Ca2+]cyto transients had faster maximum rate-of-rise in response to ISO (0.09 ± 0.01 a.u. ms−1) compared to pre-ISO (0.06 ± 0.01 a.u. ms−1, p < 0.01). MCT RV myocytes showed no change in maximum rate-of-rise in response to ISO; yet the maximum rate-of-rise before ISO was faster for MCT cardiomyocytes (0.10 ± 0.11 a.u. ms−1) in comparison to CON (0.06 ± 0.09 a.u. ms−1). In addition, neither CON nor MCT RV myocytes showed a change in the time-to-peak fluorescence in response to ISO (Figure 2C). ISO reduced the time constant of decay in CON RV myocytes (Figure 2D) from the baseline (0.27 ± 0.02 s) to (0.22 ± 0.014 s, p < 0.01), whereas ISO had no effect on the time constant of decay of MCT RV cardiomyocytes.
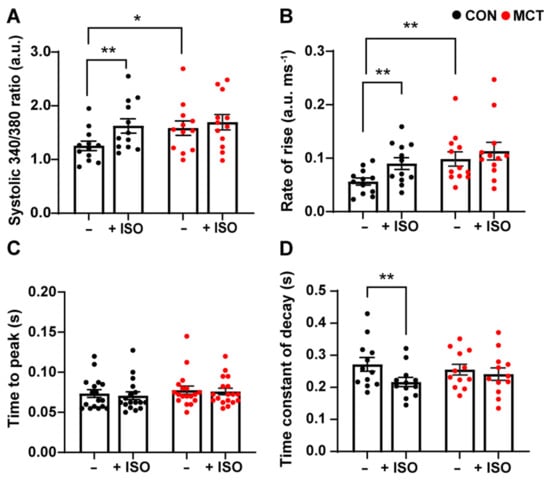
Figure 2.
Cytosolic Ca2+ response of control (CON, black) and monocrotaline (MCT, red) right ventricular (RV) cardiomyocytes to 1 µM isoproterenol. Myocytes were stimulated at 1 Hz and super-fused with 1 mM Ca2+ Tyrode’s solution before (–) and during isoproterenol (+ISO). (A) shows peak systolic 340/380 ratio, while (B,C) show maximum rate-of-rise, and time-to-peak 340/380 fluorescence, respectively. The time constant of fluorescence decay is shown in (D). Results are presented as mean ± SEM, n = 12 RV myocytes from N = 4 CON hearts, and n = 12 RV myocytes from N = 4 MCT hearts. * p < 0.05, ** p < 0.01.
3.3. Sarcoplasmic Reticulum Ca2+ Store Content
SR Ca2+ store content was assessed by addition of a 20 mM caffeine bolus to the solution bathing the CON and MCT RV cardiomyocytes. Figure 3A shows a representative caffeine-induced [Ca2+]cyto transient recorded from a single CON RV myocyte. The amplitude of the caffeine transient (340/380 ratio) in the absence of stimulation gave a measure of total [Ca2+]SR, while the time constant of the caffeine [Ca2+]cyto transient decay in the continued presence of caffeine gave a measure of trans-sarcolemmal Ca2+ efflux. Figure 3B shows that the MCT RV myocytes had larger caffeine-induced [Ca2+]cyto transients (0.78 ± 0.06 a.u.) in comparison to the CON RV myocytes (0.59 ± 0.03 a.u., p < 0.01). The MCT RV myocytes also showed a decreased time constant of decay (Figure 3C, 4.75 ± 0.20 s) relative to the CON RV myocytes (6.07 ± 0.42 s, p < 0.05).
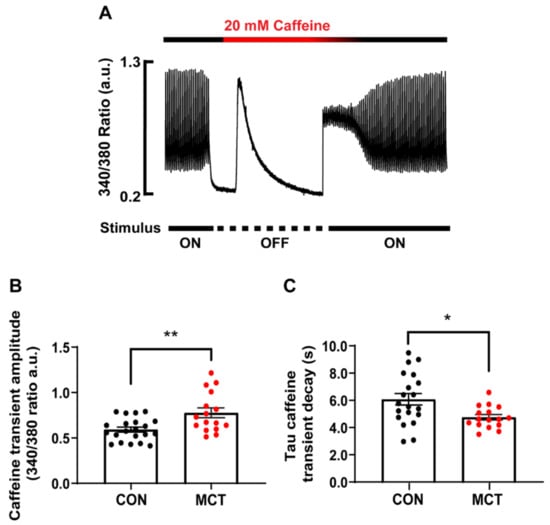
Figure 3.
Ca2+ store content of isolated right ventricular (RV) cardiomyocytes from control (CON, black) and monocrotaline (MCT, red) rat hearts. (A) shows the response of a CON cardiomyocyte before, during and after application of 20 mM caffeine during the absence of stimulation. (B) shows mean ± SEM caffeine-induced Ca2+ transient amplitude of CON and MCT cardiomyocytes, while (C) shows the mean ± SEM time constant of caffeine-induced Ca2+ transient decay. Results are from n = 21 RV myocytes from N = 5 CON hearts, and n = 16 RV cardiomyocytes from N = 4 MCT hearts. * p < 0.05, ** p < 0.01.
3.4. Beat-to-Beat Mitochondrial Ca2+ Fluxes
Beat-to-beat mitochondrial Ca2+ transients (Figure 4A) were recorded in the CON and MCT RV cardiomyocytes loaded with di-hydroRhod-2. The MCT RV cardiomyocytes had larger mitochondrial Ca2+ transient ([Ca2+]mito) amplitude (ΔF/F0, Figure 4B) at 0.1 Hz (mean ± SEM, 0.033 ± 0.002 a.u.) and 0.5 Hz stimulation (0.032 ± 0.002 a.u.) in comparison to the CON RV cardiomyocytes (0.1 Hz, 0.025 ± 0.002 a.u., p < 0.001 and 0.5 Hz 0.026 ± 0.001 a.u., p < 0.05). Figure 4C,D shows no change in the maximum rate-of-rise of [Ca2+]mito and time-to-peak fluorescence in MCT RV myocytes relative to CON RV myocytes at any stimulation frequency. The MCT RV myocytes had a time-to-peak fluorescence of 0.201 ± 0.015 s at 0.1 Hz, and 0.206 ± 0.021 s at 0.5 Hz, relative to the CON RV myocytes, which had a time-to-peak fluorescence of 0.165 ± 0.011 s at 0.1 Hz and 0.166 ± 0.010 at 0.5 Hz (p = 0.15, Figure 4D). No difference in the time constant of fluorescence decay (Figure 4E) was found between groups, or between stimulation frequencies.
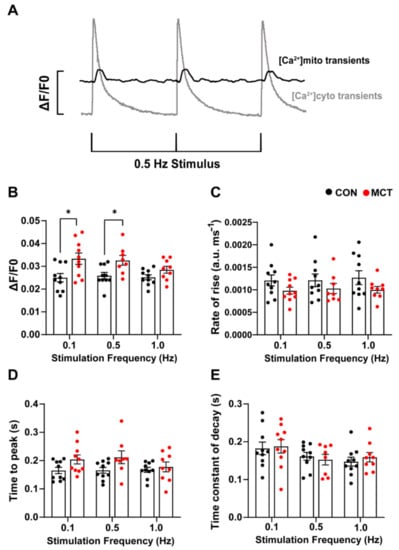
Figure 4.
Response of mitochondrial Ca2+ transients to 0.1, 0.5, and 1 Hz stimulation frequencies obtained from control (CON, black) and monocrotaline (MCT, red) isolated right ventricular (RV) cardiomyocytes. Myocytes were continuously superfused with 1.5 mM Ca2+ Tyrode’s solution containing 1 µM isoproterenol and 150 µM spermine. (A) shows representative mitochondrial Ca2+ transients (black) superimposed with cytosolic Ca2+ transients (grey) from a separate cell in response to 0.5 Hz stimulation, to demonstrate differences in the time courses between cytosolic and mitochondrial Ca2+ measurements. (B,C) show the mean [Ca2+]mito amplitude (ΔF/F0) and maximum rate-of-rise in fluorescence, respectively, between CON and MCT RV myocytes. (D) shows the time-to-peak for mitochondrial fluorescence, and (E) displays the mitochondrial time constant of decay. Results are expressed as mean ± SEM, n = 10 RV myocytes from N = 3 CON hearts, and n = 10 RV myocytes from N = 3 MCT hearts. * p < 0.05.
3.5. Mitochondrial Abundance in RV Fixed Tissue
The area of cardiomyocyte occupied by mitochondria relative to the area occupied by the myofilaments was compared in longitudinal sections from healthy and hypertrophic RV tissue sections. Figure 5 shows confocal images of representative CON and MCT RV longitudinal sections co-labelled with phalloidin (red, for F-actin) and TOM20 (green, for mitochondria). Superimposed F-actin and TOM20 labelling of both CON (Figure 5C) and MCT (Figure 5F) RV tissue showed that TOM20 labelling was parallel to, and in close association with, F-actin labelling, indicating that the myofibrils were sandwiched between mitochondria. The mean data (Figure 5G) show the fractional area of TOM20 and phalloidin labelling in tissue sections from N = 3 CON and N = 3 MCT hearts. Figure 5G shows that the MCT RV sections had increased area of F-actin labelling per myocyte (59.7 ± 1.8%) relative to the CON sections (43.8 ± 3.1%, p < 0.001), with no difference in the mitochondrial area between CON (37.2 ± 1.0%) and MCT (43.6 ± 0.9%, p = 0.16) per myocyte. The ratio of the mitochondrial area relative to the F-actin area was therefore less for MCT RV myocytes (p < 0.001), whereas mitochondria and F-actin occupied equal areas of the myocytes in CON sections (p = 0.11).
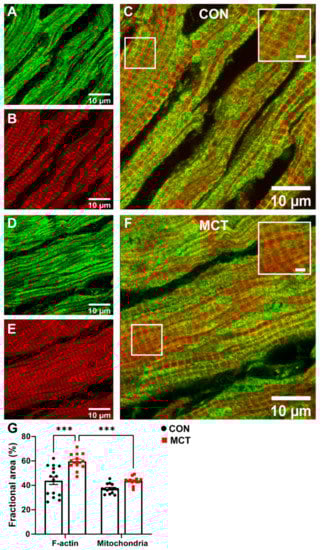
Figure 5.
Representative confocal images of contractile protein and mitochondria in longitudinal right ventricular (RV) tissue sections. (A,D) show TOM20 labelling for mitochondria (green) in CON (A) and MCT (D), while (B,E) show phalloidin labelling for F-actin (red) in the same longitudinal sections in CON (B) and MCT (E). Images in (C,F) display superimposed TOM20 and phalloidin labelling in CON (C) and MCT (F) hearts. Scale bars of 2 µm are shown for the inset images within (C,F). The fractional area of the cardiomyocyte occupied by F-actin (i.e., % of phalloidin labelling) and mitochondria (i.e., % of TOM20 labelling) in CON (black) and MCT (red) RV tissue is presented in (G). Results are expressed as mean ± SEM from 3–5 50 µm × 50 µm sections/heart, for N = 3 CON and N = 3 MCT hearts. *** p < 0.001.
Mitochondrial and RyR2 distribution were also compared in longitudinal RV tissue sections between groups using confocal and STED microscopy (Figure 6). The large-scale confocal images show the longitudinal mitochondria (TOM20) and transverse distribution of the RyR2 in both CON and MCT tissue (Figure 6A,D), which was also evident in small-scale confocal and STED images (Figure 6B,C,E,F). However, the STED images also showed an increased number of TOM20 and RyR2 clusters (Figure 6C,F) in comparison to the confocal images for both groups (Figure 6B,E). Associations between RyR2 and TOM20 clusters were also evident in the small-scale STED images (Figure 6C,F). Mean data calculated from the STED images showed a trend towards decreased TOM20 cluster size in MCT RV myocytes (0.027 ± 0.01 µm2) relative to CON RV myocytes (0.034 ± 0.01 µm2, p = 0.07). Despite smaller TOM20 cluster sizes, the MCT RV myocytes had an increased number of TOM20 clusters per µm2 (Figure 6H, 14.9 ± 3.2 clusters/1 µm2 regions) vs. CON RV myocytes (11.2 ± 4.2 clusters/1 µm2 regions, p = 0.06). The MCT RV myocytes also showed smaller RyR2 cluster size (Figure 6I, 0.016 ± 0.007 µm2) in comparison to CON (0.022 ± 0.005 µm2, p = 0.02) but with no difference in the number of RyR2 clusters per 1 µm2 between groups (Figure 6J, p = 0.2).
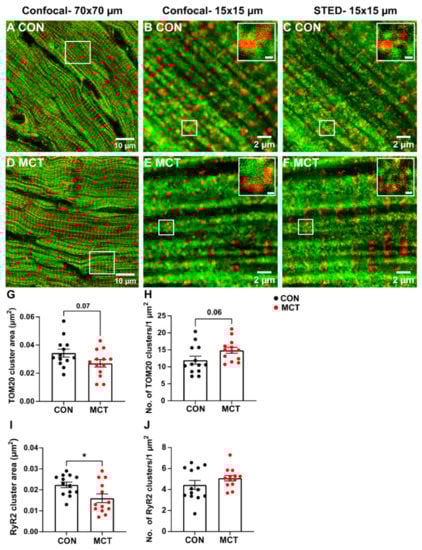
Figure 6.
Confocal and stimulated emission depletion (STED) microscopy of RyR2 and TOM20 distribution in control (CON) and monocrotaline (MCT) right ventricular (RV) tissue sections. (A,D) are large-scale confocal images (70 µm × 70 µm frame size) showing control (CON, A) and monocrotaline (MCT, D) RV sections dual-labelled with TOM20 for mitochondria (green) and ryanodine receptors (RyR2, red). The white squares in (A,D) correspond to the small-scale confocal images (15 µm × 15 µm frame size) presented in (B,E) and the images displayed in (C,F), which were captured using STED microscopy. Scale bars of the insets in (B,C,E,F) are 200 nm. (G–J) show the mean data from STED images only. (G,H) indicate mean TOM20 cluster size, and the number of TOM20 clusters (per 1 µm2), respectively, in CON (black) and MCT (red) RV tissue. Likewise, (I,J) show the area and number of RyR2 clusters (per 1 µm2). Data are presented as mean ± SEM from N = 3 CON and N = 3 MCT hearts, and n = 3–5 RV sections/heart. * p < 0.05.
3.6. Mitochondrial Respiration and Membrane Potential
To test for any difference in mitochondrial function between CON and MCT hearts, concurrent measurements of O2 consumption and mitochondrial membrane potential were recorded in RV homogenates in the oxygraph. The driving force for ATP production via oxidative phosphorylation is from the electrochemical potential across the inner mitochondrial membrane, the majority of which is made up of the mitochondrial membrane potential (ΔΨ). This was measured using ΔΨ fluorescence indicator safranine-O with increasing free [Ca2+]. Figure 7A shows a representative trace from the control RV homogenate. Following the addition of CI substrates, a high ΔΨ is developed which was partially depolarised following the addition of ADP, with hexokinase and glucose, which regenerates ADP to reach a steady-state ΔΨ. An initial titration of 0.3 mM CaCl2 (free [Ca2+] of 0.39 μM) depolarises the ΔΨ and stimulates the O2 flux; however, further titrations of CaCl2 result in the inhibition of O2, and ΔΨ repolarises until opening of the mitochondrial permeability transition pore (mPTP) and depolarisation of the ΔΨ. This can be accelerated by the addition of FCCP. Mitochondrial respiration was not different between CON and MCT RV homogenates for all respiratory states before or after the addition of CaCl2 (Figure 7B). After the initial addition of CaCl2, there was a small (non-significant p = 0.06) stimulatory effect of respiration. The developed ΔΨ did not differ between the groups and the addition of ADP and CaCl2 similarly depolarised the ΔΨ.
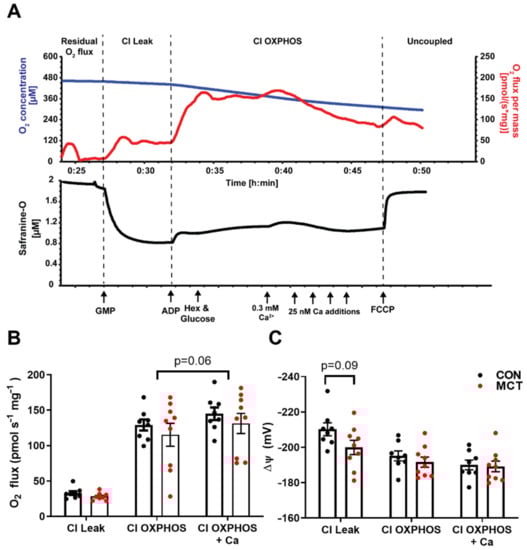
Figure 7.
Mitochondrial respiration and membrane potential in control (CON) and monocrotaline (MCT) right ventricle homogenates. (A) is a representative oxygraph recording where the upper trace shows the change in O2 concentration (µM; blue) and the O2 flux (pmols s–1 mg−1; red) over time, and the lower trace shows concurrent measurement of safranine-O fluorescence (µM; black) which follows changes in mitochondrial membrane potential. Arrows indicate the addition of complex I substrates glutamate, pyruvate, and malate (GMP; CI Leak); 100 µM ADP with glucose and hexokinase (Hex) to keep the mitochondria in a phosphorylating state (CI OXPHOS); followed by additions of CaCl2 and, finally, the mitochondrial uncoupler carbonyl cyanide p- (trifluoro-methoxy) phenyl-hydrazone (FCCP). (B) shows steady-state O2 consumption (pmols s–1 m–1) for each respiratory state and at peak respiration with CaCl2, while (C) shows the corresponding mitochondrial membrane potential (mV) calculated from safranine-O fluorescence (see methods). Data are presented as mean ± SEM from N = 8 CON and N = 9 MCT hearts.
4. Discussion
4.1. Evidence of Hypertrophy from Morphometric Data
Changes in myocardial Ca2+ were studied in hypertrophic cardiomyocytes using the monocrotaline (MCT) rat model of pulmonary artery hypertension (PAH) and their saline-injected controls (CON). Morphometric data confirmed that MCT rats four weeks post-injection were not in heart failure, and there was no difference in heart weight to body weight between CON and MCT animals on the day of experimentation. This was unexpected as the hypertrophic RV was expected to increase the mass of the whole heart. However, LV atrophy has been previously reported in MCT myocardium [18,23], which can explain the lack of change in the HW:BW ratio between groups. Furthermore, measurements of cardiomyocyte area confirmed that isolated RV myocytes from MCT were hypertrophied with larger perimeters relative to CON RV and LV myocytes, and to MCT LV myocytes (Figure 1A–C).
4.2. Response to β-Adrenergic Stimulation
The response of RV cardiomyocytes to the non-selective β-AR agonist isoproterenol (ISO) showed that ISO increased peak systolic [Ca2+]cyto in CON RV myocytes (Figure 2A) but not in MCT RV myocytes, although MCT RV myocytes had larger [Ca2+]cyto transients in the absence of ISO relative to CON (Figure 2A). The time-to-peak fluorescence (Figure 2C) and diastolic [Ca2+]cyto (Supplementary Figure S1) were unaffected by ISO in both groups, but only CON myocytes showed increased cytosolic Ca2+ transient kinetics during ISO (maximum rate-of-rise (Figure 2B) and time constant of decay (Figure 2D)). Overall, MCT myocytes did not show the expected response to β-AR stimulation [24,25]. The increased [Ca2+]cyto transient amplitudes from MCT in comparison to CON (in the absence of ISO) is unlikely to be a result of endogenous β-AR activation in isolated cells stored in the physiological buffer following isolation. Instead, we suggest that the diminished MCT response to ISO might be a result of the SR Ca2+ stores already being at capacity prior to β-AR stimulation. A decreased response to ISO can also be due to the distribution of β-ARs, whereby spatially diverse cAMP diffusion occurs depending on the receptor subtype that is activated. For example, activation of β1-AR induces cell-wide cAMP diffusion and PKA activation, whereas the β2-AR subtype has been shown to be present specifically in the T-tubules, inducing a more localised cAMP diffusion/PKA activation [26]. MCT-induced RV hypertrophy is associated with T-tubular disorganisation [6,27], which might affect the distribution of β2-ARs [28], thereby altering cAMP diffusion and PKA activation of Ca2+ handling proteins localised to the T-tubules (i.e., the LTCC). The blunted response to ISO might also be due to either β-AR receptor downregulation or desensitisation, which has previously been reported in hypertrophic and failing MCT hearts [6,29,30].
4.3. Increased Ca2+ Store Content in Hypertrophy
Caffeine increases the opening probability of the RyR2, which makes it a useful tool for measuring the SR Ca2+ content of isolated cardiomyocytes. The continued presence of caffeine in the buffer solution prevents the accumulation of SR Ca2+ [31,32], while the sarcolemmal Ca2+ removal mechanisms eventually restore cytosolic [Ca2+] concentration to the diastolic level [33]. Therefore, subjecting myocytes to prolonged caffeine provided measurements of both total SR Ca2+ store content (amplitude) and NCX trans-sarcolemmal Ca2+ extrusion (from the time constant of the caffeine transient decay, Figure 3A). NCX accounts for the bulk of trans-sarcolemmal Ca2+ extrusion, and, in the rat, only ~5–10% is normally extruded across the NCX, while MCU and Ca2+ ATPase also provide minor contributions [32]. Hypertrophic MCT RV myocytes had increased SR Ca2+ store content in comparison to the CON RV myocytes (Figure 3B), resulting in larger baseline Ca2+ transient amplitudes and faster rates-of-rise in comparison to the CON myocytes (Figure 2A,B and Figure 3B). Since measurements of cytosolic [Ca2+] were made using a ratiometric fluorescent indicator, the higher amplitude transients must, therefore, indicate an increased cytosolic Ca2+ concentration rather than merely due to the hypertrophied MCT cardiomyocytes being larger in size than CON. Caffeine-induced Ca2+ transients from MCT RV cardiomyocytes also had a decreased time constant of decay relative to CON RV myocytes (Figure 3C), providing evidence that trans-sarcolemmal Ca2+ extrusion rate (flux) via NCX activity was increased in the MCT.
4.4. Beat-to-Beat Mitochondrial Ca2+ Fluxes
Ca2+ uptake via the mitochondrial calcium uniporter (MCU) is one of the key regulators of ATP production in the myocardium [34]. The MCU is a low-affinity Ca2+ transporter on the inner mitochondrial membrane, which is activated at high [Ca2+]cyto, such as at the peak of the [Ca2+]cyto transient during EC coupling [9]. An influx of Ca2+ into the mitochondrial matrix enhances the activity of various Ca2+ sensitive enzymes of the Krebs cycle, which ultimately promotes ATP production [12]. Mitochondrial Ca2+ concentration fluctuates on a beat-to-beat basis, i.e., mitochondrial “transients” [17], thus relaying the cellular energy requirements directly to match supply to demand. Mitochondrial transients have a slower time-to-peak and time constant of decay relative to cytosolic Ca2+ transients (Figure 4A). In addition, MCT RV cardiomyocytes had larger mitochondrial Ca2+ transient ([Ca2+]mito) amplitudes at 0.1 Hz and 0.5 Hz stimulation in comparison to CON RV cardiomyocytes (Figure 4B). These results indicate that hypertrophic cardiomyocytes have increased mitochondrial Ca2+ uptake, probably as a result of a higher [Ca2+]cyto/[Ca2+]SR [35]. This is consistent with our cytosolic Ca2+ measurements from MCT RV myocytes (Figure 2A,B and Figure 3B). It has been suggested that hypertrophic cardiomyocytes have a compensatory mechanism whereby the mitochondria act as a buffer of cytosolic Ca2+, reducing the incidence of delay after depolarisations and spontaneous Ca2+ release events [36,37,38]. However, others have proposed that the contribution of the MCU to cytosolic Ca2+ removal is approximately 1% [32,39]. The decay of [Ca2+]mito transients reported in the present study, and by others [40,41], suggests that the mitochondria only temporarily increase their Ca2+ content between myocyte contractions. Our findings showed no difference between groups in mitochondrial Ca2+ transient kinetics at the stimulation frequencies investigated (Figure 4C,D), including no changes to the time constant of decay (Figure 4E). These results suggest that mNLCX activity, which is the primary transporter for mitochondrial Ca2+ extrusion during the decay [42], was unchanged between CON and MCT RV myocytes.
4.5. Mitochondrial Abundance in RV Fixed Tissue
Cardiac hypertrophy is characterised by increased cell size due to a higher abundance of contractile proteins [1]. This means that hypertrophic cardiomyocytes are capable of increased work, which requires more energy than the healthy control cardiomyocytes. In the present study, confocal images showed that the fractional area of mitochondria calculated per RV tissue section was not different in MCT relative to CON, despite a 16% increase in myofilament content (Figure 5A–G), as previously described [2]. Figure 5C,F show that the longitudinal labelling pattern of F-actin (using phalloidin) was distributed in parallel to, and in close association with, the mitochondria (labelled with a marker for the translocator of the outer mitochondrial membrane; TOM20). TOM20 is a subunit of the large TOM protein complex located on the outer mitochondrial membrane, with linkages to the inner membrane. Its function is to translocate nuclear-encoded proteins from the cytosol destined for the mitochondria [43]. TOM20 is highly abundant on the outer membrane, making it difficult to resolve its exact distribution when imaging with a modality beyond the diffraction limit—i.e., with confocal microscopy [44]. While confocal images did not detect a change in mitochondrial abundance between CON and MCT RV tissue (Figure 5), we further investigated mitochondrial clusters using STED imaging, which enabled improved lateral resolution from ~250 nm to ~40–60 nm.
STED microscopy of fixed cardiac tissue enabled the size and number of individual TOM20 clusters to be identified (Figure 6). A clustered distribution of TOM20 has been previously reported in super-resolution imaging of different cell types, excluding cardiomyocytes [45,46,47,48]. In addition, it has been suggested that the cluster density of TOM20 is tightly regulated and correlated with both the activity and location of the mitochondria, and that the TOM20 distribution is finely tuned to match the energetic demands of the cell [44,47]. This would mean that, since hypertrophic cardiomyocytes are larger (Figure 1B,C) and have increased [Ca2+]mito transients (Figure 4B), larger TOM20 cluster densities would also be expected. In the present study, STED microscopy showed a trend toward decreased TOM20 cluster size in MCT RV tissue when compared to the control (Figure 6G), suggesting fewer TOM20 receptors per cluster. On the other hand, MCT RV tissue also showed a trend towards an increased number of clusters per µm2 relative to CON RV tissue (Figure 6H). This contradicts the data presented in Figure 5G, which showed no absolute change in mitochondrial content between CON and MCT hearts, despite an increase in contractile protein content. This is most probably due to the lack of resolution with standard confocal microscopy. An increased number of TOM20 clusters could either mean that more mitochondria are present or that TOM20 expression is increased in hypertrophic tissue. However, TOM20 expression has previously been shown to be unaffected in pathological cardiac hypertrophy [49]. Therefore, an increase in the number of mitochondria present in hypertrophic RV tissue could explain this result. Additionally, while our STED data showed a 24% increase in TOM20 clusters in hypertrophic RV tissue (Figure 6H), our functional data also showed that mitochondrial Ca2+ uptake was increased by 33% in MCT RV myocytes relative to CON RV myocytes (Figure 4B). Although the STED data from the present study showed a trend towards increased TOM20 cluster numbers, we cannot determine whether the mitochondrial distribution of TOM20 differed between groups.
Furthermore, it was evident that there was some overlap between the mitochondria and the RyR2 Ca2+ release sites in Figure 6, which was expected as this enables the mitochondria to immediately sense changes [Ca2+]cyto during EC coupling [50]. The present study showed reduced RyR2 cluster size in hypertrophic RV tissue relative to the controls (Figure 6I) which could be a sign of RyR2 cluster fragmentation as reported by Sheard et al. [51]. These data contradict findings from other studies investigating hypertrophic tissue using super resolution imaging techniques, which showed either no change in RyR2 signal density [52] or an increased mean RyR2 cluster density [53]. Despite the smaller RyR2 cluster areas determined in MCT RV tissue, there were also no differences in the number of RyR2 clusters per µm2 between groups (Figure 6J). This indicates a possible scattered distribution of the RyR2 clusters throughout the myocyte, increasing its “nearest neighbour distance” (see Supplementary Figure S2). However, functional data from CON and MCT isolated cells presented in this study show no change in the time-to-peak fluorescence (i.e., the time of L-Type Ca2+ channel activation following cardiomyocyte stimulation to RyR2 Ca2+ release, Figure 2C) between groups. This suggests that either sarcolemmal Ca2+ fluxes are upregulated in MCT RV myocytes or the SR volume of hypertrophic myocytes is more extensive, which could overcome any irregularities of the T-tubular network.
4.6. Mitochondrial Respiration and Membrane Potential
Since mitochondria are responsible for producing 95% of the ATP consumed by cardiomyocytes [54], they have been implicated in the energy deficits observed in models of pathological hypertrophy. Measurement of O2 flux in vitro by high-resolution respirometry is the gold standard measure for mitochondrial function. There was no difference in O2 flux measured in RV homogenates from CON or MCT hearts in any respiratory state measured. Therefore, although the MCT hearts had significant RV hypertrophy, their mitochondrial oxidative capacity was similar to the control per mg of tissue. Addition of Ca2+ to the RV homogenate had a slight stimulation of O2. Ca2+ uptake into the mitochondria through the MCU utilises the ΔΨ and may stimulate respiration flux through the ETS [55], although, at this concentration of free Ca2+ (0.39 µM) it is likely that any uptake would be through other uptake pathways that are not fully resolved [56]. The stimulatory effect of Ca2+ was similar for both MCT and control RV homogenates, suggesting that the mechanisms of Ca2+ uptake are unchanged between the groups. The Ca2+ transient is responsible for eliciting contraction and, in parallel, stimulates mitochondria [55]. However, prolonged mitochondrial exposure to high [Ca2+] triggers opening of the mPTP and irreversible depolarisation of the ΔΨ, causing cardiomyocyte death [20]. Unfortunately, for these in vitro mitochondrial assays, we could not mimic the oscillating Ca2+ conditions observed in vivo, and titration of Ca2+ above ~0.5 µM resulted in gradual inhibition of respiration before triggering the mPTP. Therefore, only one bolus of 0.3 mM CaCl2 was used in these experiments which results in a free Ca2+ concentration of 0.39 µM. We calculated ΔΨ from the uptake of fluorescent cation safranine-O which has been used previously [19,21,22]. Although it is documented to have some inhibitory effects on respiration [19], these are minimal at low safranine-O concentrations (2 µM) and are far less compared to routinely used ΔΨ indicators such as JC-1 [57] and TPP+ [58]. It could also be assumed that any inhibitory effects of safranine-O are the same for the control and MCT. The maximum ΔΨ that can be achieved in energized mitochondria is in the Leak state when no ADP is present. There was a slight (NS) depolarisation of the ΔΨ measured in MCT RV homogenate in the Leak state compared to the controls (CON: −210 ± 4 mV, MCT: −200 ± 4 mV, p = 0.09), suggesting that MCT RV mitochondria have a lower driving force for ATP production. However, in the phosphorylating OXPHOS state, there was no difference between groups. Given that MCT hearts will have greater energy demand due to their increased myofilament area, these data support the idea that increased mitochondrial energy supply is met by enhanced beat-to-beat mitochondrial Ca2+ uptake rather than by increased mitochondrial capacity.
5. Conclusions
Overall, MCT RV cardiomyocytes showed increased cytosolic Ca2+ fluxes with a blunted response to β-adrenergic stimulation, and an increased SR Ca2+ store content. In addition, MCT RV cardiomyocytes also had larger beat-to-beat mitochondrial Ca2+ fluxes, which, we speculate, indicates a compensatory mechanism developed to match ATP supply to the greater energetic demands of the hypertrophic myocytes. While confocal images confirmed an increase in contractile protein content in MCT RV tissue sections, STED microscopy also revealed an increased number of TOM20 clusters, which, in some regions, were closely associated with the RyR2 clusters. Our data show—for the first time—evidence of a link between augmented [Ca2+]mito uptake and increased mitochondrial abundance in hypertrophic cardiomyocytes. We conclude that this provides a potential mechanism by which hypertrophied cells compensate to match ATP supply to the increased energetic demands of additional contractile protein and bigger Ca2+ transients, prior to progression to heart failure.
Supplementary Materials
The following supporting information can be downloaded at: https://www.mdpi.com/article/10.3390/life13020540/s1, Methods: Labelling and fixation of tissue; Data Analysis; Figure S1: Diastolic response to isoproterenol; Figure S2: Distances between clusters.
Author Contributions
Conceptualization, M.-L.W., A.M.K. and A.S.P.; methodology, M.-L.W., A.M.K. and A.S.P.; formal analysis, A.M.K. and A.S.P.; investigation, A.M.K. and A.S.P.; resources, M.-L.W.; data curation, A.M.K. and A.S.P.; writing—original draft preparation, A.M.K.; writing—review and editing, M.-L.W., A.M.K. and A.S.P.; visualisation, M.-L.W., A.M.K. and A.S.P.; supervision, M.-L.W.; project administration, M.-L.W.; funding acquisition, M.-L.W. All authors have read and agreed to the published version of the manuscript.
Funding
This work was supported by the Auckland Medical Research Foundation [grant numbers 1118006 and 1121010] and the Maurice and Phyllis Paykel Trust [Research project]. A.M.K. was the recipient of a University of Auckland Health Research Doctoral Scholarship. A.S.P. is a recipient of NZ Heart Foundation Research Fellowship (Grant. Number 1873).
Institutional Review Board Statement
The study was conducted in accordance with the Declaration of Helsinki and approved by the Animal Ethics Committee of The University of Auckland (AEC 001807 on 12/12/16, and 001412 on 06/10/20).
Data Availability Statement
Data supporting reported results can be obtained on request.
Acknowledgments
The authors would like to acknowledge the assistance from Jacqueline Ross, in the Biomedical Research Unit (BIRU) at the Faculty of Medical and Health Sciences, University of Auckland. Jacqueline Ross assisted in the acquisition and analysis of the images acquired using the Abberior STED microscope.
Conflicts of Interest
The authors declare no conflict of interest.
Abbreviations
| dhRhod-2 | di-hydroRhod-2 |
| ISO | Isoproterenol |
| MCT | Monocrotaline |
| MCU | Mitochondrial calcium uniporter |
| mNLCX | Mitochondrial sodium lithium calcium exchanger |
| PAH | Pulmonary artery hypertension |
| STED | Stimulated emission depletion |
| TOM20 | Translocator of the outer mitochondrial membrane |
References
- Karsner, H.T.; Saphir, O.; Todd, T.W. The state of the cardiac muscle in hypertrophy and atrophy. Am. J. Pathol. 1925, 1, 351. [Google Scholar]
- Power, A.S.; Norman, R.; Jones, T.L.M.; Hickey, A.J.; Ward, M.L. Mitochondrial function remains impaired in the hypertrophied right ventricle of pulmonary hypertensive rats following short duration metoprolol treatment. PLoS ONE 2019, 14, e0214740. [Google Scholar] [CrossRef] [PubMed]
- Wüst, R.C.; de Vries, H.J.; Wintjes, L.T.; Rodenburg, R.J.; Niessen, H.W.; Stienen, G.J. Mitochondrial complex I dysfunction and altered NAD(P)H kinetics in rat myocardium in cardiac right ventricular hypertrophy and failure. Cardiovasc. Res. 2016, 111, 362–372. [Google Scholar] [CrossRef] [PubMed]
- Kögler, H.; Hartmann, O.; Leineweber, K.; Schott, P.; Brodde, O.-E.; Hasenfuss, G. Mechanical load-dependent regulation of gene expression in monocrotaline-induced right ventricular hypertrophy in the rat. Circ. Res. 2003, 93, 230–237. [Google Scholar] [CrossRef]
- Benoist, D.; Stones, R.; Benson, A.P.; Fowler, E.D.; Drinkhill, M.J.; Hardy, M.E.; Saint, D.A.; Cazorla, O.; Bernus, O.; White, E. Systems approach to the study of stretch and arrhythmias in right ventricular failure induced in rats by monocrotaline. Prog. Biophys. Mol. Biol. 2014, 115, 162–172. [Google Scholar] [CrossRef]
- Power, A.S.; Hickey, A.J.; Crossman, D.J.; Loiselle, D.S.; Ward, M.-L. Calcium mishandling impairs contraction in right ventricular hypertrophy prior to overt heart failure. Pflügers Arch-Eur. J. Physiol. 2018, 470, 1115–1126. [Google Scholar] [CrossRef]
- Balaban, R.S.; Kantor, H.L.; Katz, L.A.; Briggs, R.W. Relation between work and phosphate metabolite in the in vivo paced mammalian heart. Science 1986, 232, 1121–1123. [Google Scholar] [CrossRef]
- Opie, L.H. Heart Physiology: From Cell to Circulation; Lippincott Williams & Wilkins: Philadelphia, PA, USA, 2004. [Google Scholar]
- Zhou, Z.; Matlib, M.A.; Bers, D.M. Cytosolic and mitochondrial Ca2+ signals in patch clamped mammalian ventricular myocytes. J. Physiol. 1998, 507, 379–403. [Google Scholar] [CrossRef] [PubMed]
- Rosencrans, W.M.; Rajendran, M.; Bezrukov, S.M.; Rostovtseva, T.K. VDAC regulation of mitochondrial calcium flux: From channel biophysics to disease. Cell Calcium 2021, 94, 102356. [Google Scholar] [CrossRef]
- Hajnóczky, G.; Robb-Gaspers, L.D.; Seitz, M.B.; Thomas, A.P. Decoding of cytosolic calcium oscillations in the mitochondria. Cell 1995, 82, 415–424. [Google Scholar] [CrossRef]
- Korzeniewski, B. Regulation of oxidative phosphorylation through parallel activation. Biophys. Chem. 2007, 129, 93–110. [Google Scholar] [CrossRef]
- Halestrap, A.P.; Pasdois, P. The role of the mitochondrial permeability transition pore in heart disease. Biochim. Biophys. Acta Bioenerg. BBA-Bioenerg. 2009, 1787, 1402–1415. [Google Scholar] [CrossRef]
- Xu, H.X.; Cui, S.M.; Zhang, Y.M.; Ren, J. Mitochondrial Ca2+ regulation in the etiology of heart failure: Physiological and pathophysiological implications. Acta Pharmacol. Sin. 2020, 41, 1301–1309. [Google Scholar] [CrossRef]
- Gambardella, J.; Sorriento, D.; Ciccarelli, M.; Del Giudice, C.; Fiordelisi, A.; Napolitano, L.; Trimarco, B.; Iaccarino, G.; Santulli, G. Functional Role of Mitochondria in Arrhythmogenesis. In Mitochondrial Dynamics in Cardiovascular Medicine; Santulli, G., Ed.; Springer International Publishing: Cham, Switzerland, 2017; pp. 191–202. [Google Scholar]
- Drago, I.; De Stefani, D.; Rizzuto, R.; Pozzan, T. Mitochondrial Ca2+ uptake contributes to buffering cytoplasmic Ca2+ peaks in cardiomyocytes. Proc. Natl. Acad. Sci. USA 2012, 109, 12986–12991. [Google Scholar] [CrossRef] [PubMed]
- Krstic, A.M.; Power, A.S.; Ward, M.-L. Visualization of Dynamic Mitochondrial Calcium Fluxes in Isolated Cardiomyocytes. Front. Physiol. 2022, 12, 2573. [Google Scholar] [CrossRef] [PubMed]
- Krstic, A.M.; Kaur, S.; Ward, M.-L. Response of non-failing hypertrophic rat hearts to prostaglandin F2α. Curr. Res. Physiol. 2020, 2, 1–11. [Google Scholar] [CrossRef]
- Krumschnabel, G.; Eigentler, A.; Fasching, M.; Gnaiger, E. Use of safranin for the assessment of mitochondrial membrane potential by high-resolution respirometry and fluorometry. Methods Enzym. 2014, 542, 163–181. [Google Scholar] [CrossRef]
- Anderson, E.J.; Rodriguez, E.; Anderson, C.A.; Thayne, K.; Chitwood, W.R.; Kypson, A.P. Increased propensity for cell death in diabetic human heart is mediated by mitochondrial-dependent pathways. Am. J. Physiol. Heart Circ. Physiol. 2011, 300, H118–H124. [Google Scholar] [CrossRef] [PubMed]
- Power, A.; Pearson, N.; Pham, T.; Cheung, C.; Phillips, A.; Hickey, A. Uncoupling of oxidative phosphorylation and ATP synthase reversal within the hyperthermic heart. Physiol. Rep. 2014, 2, e12138. [Google Scholar] [CrossRef]
- Pham, T.; Loiselle, D.; Power, A.; Hickey, A.J. Mitochondrial inefficiencies and anoxic ATP hydrolysis capacities in diabetic rat heart. Am. J. Physiol. Cell Physiol. 2014, 307, C499–C507. [Google Scholar] [CrossRef]
- Han, J.-C.; Guild, S.-J.; Pham, T.; Nisbet, L.; Tran, K.; Taberner, A.J.; Loiselle, D.S. Left-Ventricular Energetics in Pulmonary Arterial Hypertension-Induced Right-Ventricular Hypertrophic Failure. Front. Physiol. 2018, 8, 1115. [Google Scholar] [CrossRef]
- Li, J.; Imtiaz, M.S.; Beard, N.A.; Dulhunty, A.F.; Thorne, R.; vanHelden, D.F.; Laver, D.R. ß-Adrenergic stimulation increases RyR2 activity via intracellular Ca2+ and Mg2+ regulation. PLoS ONE 2013, 8, e58334. [Google Scholar] [CrossRef] [PubMed]
- Tsien, R.W.; Bean, B.P.; Hess, P.; Lansman, J.B.; Nilius, B.; Nowycky, M.C. Mechanisms of calcium channel modulation by β-adrenergic agents and dihydropyridine calcium agonists. J. Mol. Cell. Cardiol. 1986, 18, 691–710. [Google Scholar] [CrossRef] [PubMed]
- Nikolaev, V.O.; Bünemann, M.; Schmitteckert, E.; Lohse, M.J.; Engelhardt, S. Cyclic AMP Imaging in Adult Cardiac Myocytes Reveals Far-Reaching β1-Adrenergic but Locally Confined β2-Adrenergic Receptor–Mediated Signaling. Circ. Res. 2006, 99, 1084–1091. [Google Scholar] [CrossRef]
- Fowler, E.D.; Drinkhill, M.J.; Norman, R.; Pervolaraki, E.; Stones, R.; Steer, E.; Benoist, D.; Steele, D.S.; Calaghan, S.C.; White, E. Beta1-adrenoceptor antagonist, metoprolol attenuates cardiac myocyte Ca(2+) handling dysfunction in rats with pulmonary artery hypertension. J. Mol. Cell. Cardiol. 2018, 120, 74–83. [Google Scholar] [CrossRef]
- Gorelik, J.; Wright, P.T.; Lyon, A.R.; Harding, S.E. Spatial control of the βAR system in heart failure: The transverse tubule and beyond. Cardiovasc. Res. 2013, 98, 216–224. [Google Scholar] [CrossRef]
- Leineweber, K.; Seyfarth, T.; Abraham, G.; Gerbershagen, H.P.; Heinroth-Hoffmann, I.; Ponicke, K.; Brodde, O.E. Cardiac beta-adrenoceptor changes in monocrotaline-treated rats: Differences between membrane preparations from whole ventricles and isolated ventricular cardiomyocytes. J. Cardiovasc. Pharmacol. 2003, 41, 333–342. [Google Scholar] [CrossRef] [PubMed]
- Seyfarth, T.; Gerbershagen, H.-P.; Giessler, C.; Leineweber, K.; Heinroth-Hoffmann, I.; Pönicke, K.; Brodde, O.-E. The Cardiac β -Adrenoceptor-G-protein(s)-adenylyl Cyclase System in Monocrotaline-treated Rats. J. Mol. Cell. Cardiol. 2000, 32, 2315–2326. [Google Scholar] [CrossRef]
- Bassani, R.A.; Bassani, J.W.; Bers, D.M. Mitochondrial and sarcolemmal Ca2+ transport reduce [Ca2+]i during caffeine contractures in rabbit cardiac myocytes. J. Physiol. 1992, 453, 591–608. [Google Scholar] [CrossRef]
- Negretti, N.; O’Neill, S.C.; Eisner, D.A. The relative contributions of different intracellular and sarcolemmal systems to relaxation in rat ventricular myocytes. Cardiovasc. Res. 1993, 27, 1826–1830. [Google Scholar] [CrossRef]
- Bers, D. Excitation-Contraction Coupling and Cardiac Contractile Force; Springer Science & Business Media: Berlin/Heidelberg, Germany, 2001; Volume 237. [Google Scholar]
- Maack, C.; O’Rourke, B. Excitation-contraction coupling and mitochondrial energetics. Basic Res. Cardiol. 2007, 102, 369–392. [Google Scholar] [CrossRef] [PubMed]
- Santulli, G.; Xie, W.; Reiken, S.R.; Marks, A.R. Mitochondrial calcium overload is a key determinant in heart failure. Proc. Natl. Acad. Sci. USA 2015, 112, 11389–11394. [Google Scholar] [CrossRef] [PubMed]
- Schweitzer, M.K.; Wilting, F.; Sedej, S.; Dreizehnter, L.; Dupper, N.J.; Tian, Q.; Moretti, A.; My, I.; Kwon, O.; Priori, S.G.; et al. Suppression of Arrhythmia by Enhancing Mitochondrial Ca2+ Uptake in Catecholaminergic Ventricular Tachycardia Models. JACC Basic Transl. Sci. 2017, 2, 737–747. [Google Scholar] [CrossRef]
- Maack, C.; Cortassa, S.; Aon, M.A.; Ganesan, A.N.; Liu, T.; O’Rourke, B. Elevated Cytosolic Na+ Decreases Mitochondrial Ca2+ Uptake During Excitation-Contraction Coupling and Impairs Energetic Adaptation in Cardiac Myocytes. Circ. Res. 2006, 99, 172–182. [Google Scholar] [CrossRef] [PubMed]
- Liu, T.; Yang, N.; Sidor, A.; O’Rourke, B. MCU Overexpression Rescues Inotropy and Reverses Heart Failure by Reducing SR Ca2+ Leak. Circ. Res. 2021, 128, 1191–1204. [Google Scholar] [CrossRef]
- Lu, X.; Ginsburg, K.S.; Kettlewell, S.; Bossuyt, J.; Smith, G.L.; Bers, D.M. Measuring local gradients of intramitochondrial [Ca(2+)] in cardiac myocytes during sarcoplasmic reticulum Ca(2+) release. Circ. Res. 2013, 112, 424–431. [Google Scholar] [CrossRef]
- Isenberg, G.; Han, S.; Schiefer, A.; Wendt-Gallitelli, M.-F. Changes in mitochondrial calcium concentration during the cardiac contraction cycle. Cardiovasc. Res. 1993, 27, 1800–1809. [Google Scholar] [CrossRef] [PubMed]
- Robert, V.; Gurlini, P.; Tosello, V.; Nagai, T.; Miyawaki, A.; Di Lisa, F.; Pozzan, T. Beat-to-beat oscillations of mitochondrial [Ca2+] in cardiac cells. EMBO J. 2001, 20, 4998–5007. [Google Scholar] [CrossRef]
- Palty, R.; Silverman, W.F.; Hershfinkel, M.; Caporale, T.; Sensi, S.L.; Parnis, J.; Nolte, C.; Fishman, D.; Shoshan-Barmatz, V.; Herrmann, S. NCLX is an essential component of mitochondrial Na+/Ca2+ exchange. Proc. Natl. Acad. Sci. USA 2010, 107, 436–441. [Google Scholar] [CrossRef] [PubMed]
- Zerbes, R.M.; Bohnert, M.; Stroud, D.A.; von der Malsburg, K.; Kram, A.; Oeljeklaus, S.; Warscheid, B.; Becker, T.; Wiedemann, N.; Veenhuis, M.; et al. Role of MINOS in Mitochondrial Membrane Architecture: Cristae Morphology and Outer Membrane Interactions Differentially Depend on Mitofilin Domains. J. Mol. Biol. 2012, 422, 183–191. [Google Scholar] [CrossRef]
- Jakobs, S.; Stephan, T.; Ilgen, P.; Brüser, C. Light Microscopy of Mitochondria at the Nanoscale. Annu. Rev. Biophys. 2020, 49, 289–308. [Google Scholar] [CrossRef] [PubMed]
- Schmidt, R.; Wurm, C.A.; Jakobs, S.; Engelhardt, J.; Egner, A.; Hell, S.W. Spherical nanosized focal spot unravels the interior of cells. Nat. Methods 2008, 5, 539–544. [Google Scholar] [CrossRef] [PubMed]
- Donnert, G.; Keller, J.; Wurm, C.A.; Rizzoli, S.O.; Westphal, V.; Schönle, A.; Jahn, R.; Jakobs, S.; Eggeling, C.; Hell, S.W. Two-Color Far-Field Fluorescence Nanoscopy. Biophys. J. 2007, 92, L67–L69. [Google Scholar] [CrossRef]
- Wurm Christian, A.; Neumann, D.; Lauterbach Marcel, A.; Harke, B.; Egner, A.; Hell Stefan, W.; Jakobs, S. Nanoscale distribution of mitochondrial import receptor Tom20 is adjusted to cellular conditions and exhibits an inner-cellular gradient. Proc. Natl. Acad. Sci. USA 2011, 108, 13546–13551. [Google Scholar] [CrossRef]
- Ilgen, P.; Stoldt, S.; Conradi, L.C.; Wurm, C.A.; Rüschoff, J.; Ghadimi, B.M.; Liersch, T.; Jakobs, S. STED super-resolution microscopy of clinical paraffin-embedded human rectal cancer tissue. PLoS ONE 2014, 9, e101563. [Google Scholar] [CrossRef] [PubMed]
- Li, J.; Qi, M.; Li, C.; Shi, D.; Zhang, D.; Xie, D.; Yuan, T.; Feng, J.; Liu, Y.; Liang, D. Tom70 serves as a molecular switch to determine pathological cardiac hypertrophy. Cell Res. 2014, 24, 977–993. [Google Scholar] [CrossRef]
- Rizzuto, R.; Brini, M.; Murgia, M.; Pozzan, T. Microdomains with high Ca2+ close to IP3-sensitive channels that are sensed by neighboring mitochondria. Science 1993, 262, 744–747. [Google Scholar] [CrossRef]
- Sheard, T.M.D.; Hurley, M.E.; Smith, A.J.; Colyer, J.; White, E.; Jayasinghe, I. Three-dimensional visualization of the cardiac ryanodine receptor clusters and the molecular-scale fraying of dyads. Philos. Trans. R. Soc. B Biol. Sci. 2022, 377, 20210316. [Google Scholar] [CrossRef] [PubMed]
- Medvedev, R.; Sanchez-Alonso, J.L.; Alvarez-Laviada, A.; Rossi, S.; Dries, E.; Schorn, T.; Abdul-Salam, V.B.; Trayanova, N.; Wojciak-Stothard, B.; Miragoli, M.; et al. Nanoscale Study of Calcium Handling Remodeling in Right Ventricular Cardiomyocytes Following Pulmonary Hypertension. Hypertension 2021, 77, 605–616. [Google Scholar] [CrossRef] [PubMed]
- Hadipour-Lakmehsari, S.; Driouchi, A.; Lee, S.H.; Kuzmanov, U.; Callaghan, N.I.; Heximer, S.P.; Simmons, C.A.; Yip, C.M.; Gramolini, A.O. Nanoscale reorganization of sarcoplasmic reticulum in pressure-overload cardiac hypertrophy visualized by dSTORM. Sci. Rep. 2019, 9, 7867. [Google Scholar] [CrossRef]
- Allard, M.F.; Schönekess, B.O.; Henning, S.L.; English, D.R.; Lopaschuk, G.D. Contribution of oxidative metabolism and glycolysis to ATP production in hypertrophied hearts. Am. J. Physiol. 1994, 267, H742–H750. [Google Scholar] [CrossRef]
- Williams, G.S.; Boyman, L.; Chikando, A.C.; Khairallah, R.J.; Lederer, W.J. Mitochondrial calcium uptake. Proc. Natl. Acad. Sci. USA 2013, 110, 10479–10486. [Google Scholar] [CrossRef]
- Jean-Quartier, C.; Bondarenko, A.I.; Alam, M.R.; Trenker, M.; Waldeck-Weiermair, M.; Malli, R.; Graier, W.F. Studying mitochondrial Ca(2+) uptake-a revisit. Mol. Cell. Endocrinol. 2012, 353, 114–127. [Google Scholar] [CrossRef] [PubMed]
- Dedkova, E.N.; Blatter, L.A. Measuring mitochondrial function in intact cardiac myocytes. J. Mol. Cell. Cardiol. 2012, 52, 48–61. [Google Scholar] [CrossRef] [PubMed]
- Kroemer, G.; Galluzzi, L.; Brenner, C. Mitochondrial membrane permeabilization in cell death. Physiol. Rev. 2007, 87, 99–163. [Google Scholar] [CrossRef] [PubMed]


Disclaimer/Publisher’s Note: The statements, opinions and data contained in all publications are solely those of the individual author(s) and contributor(s) and not of MDPI and/or the editor(s). MDPI and/or the editor(s) disclaim responsibility for any injury to people or property resulting from any ideas, methods, instructions or products referred to in the content. |
© 2023 by the authors. Licensee MDPI, Basel, Switzerland. This article is an open access article distributed under the terms and conditions of the Creative Commons Attribution (CC BY) license (https://creativecommons.org/licenses/by/4.0/).