
Using Machine Learning to Identify the Relationships between Demographic, Biochemical, and Lifestyle Parameters and Plasma Vitamin D Concentration in Healthy Premenopausal Chinese Women


Abstract
:1. Introduction
2. Methods
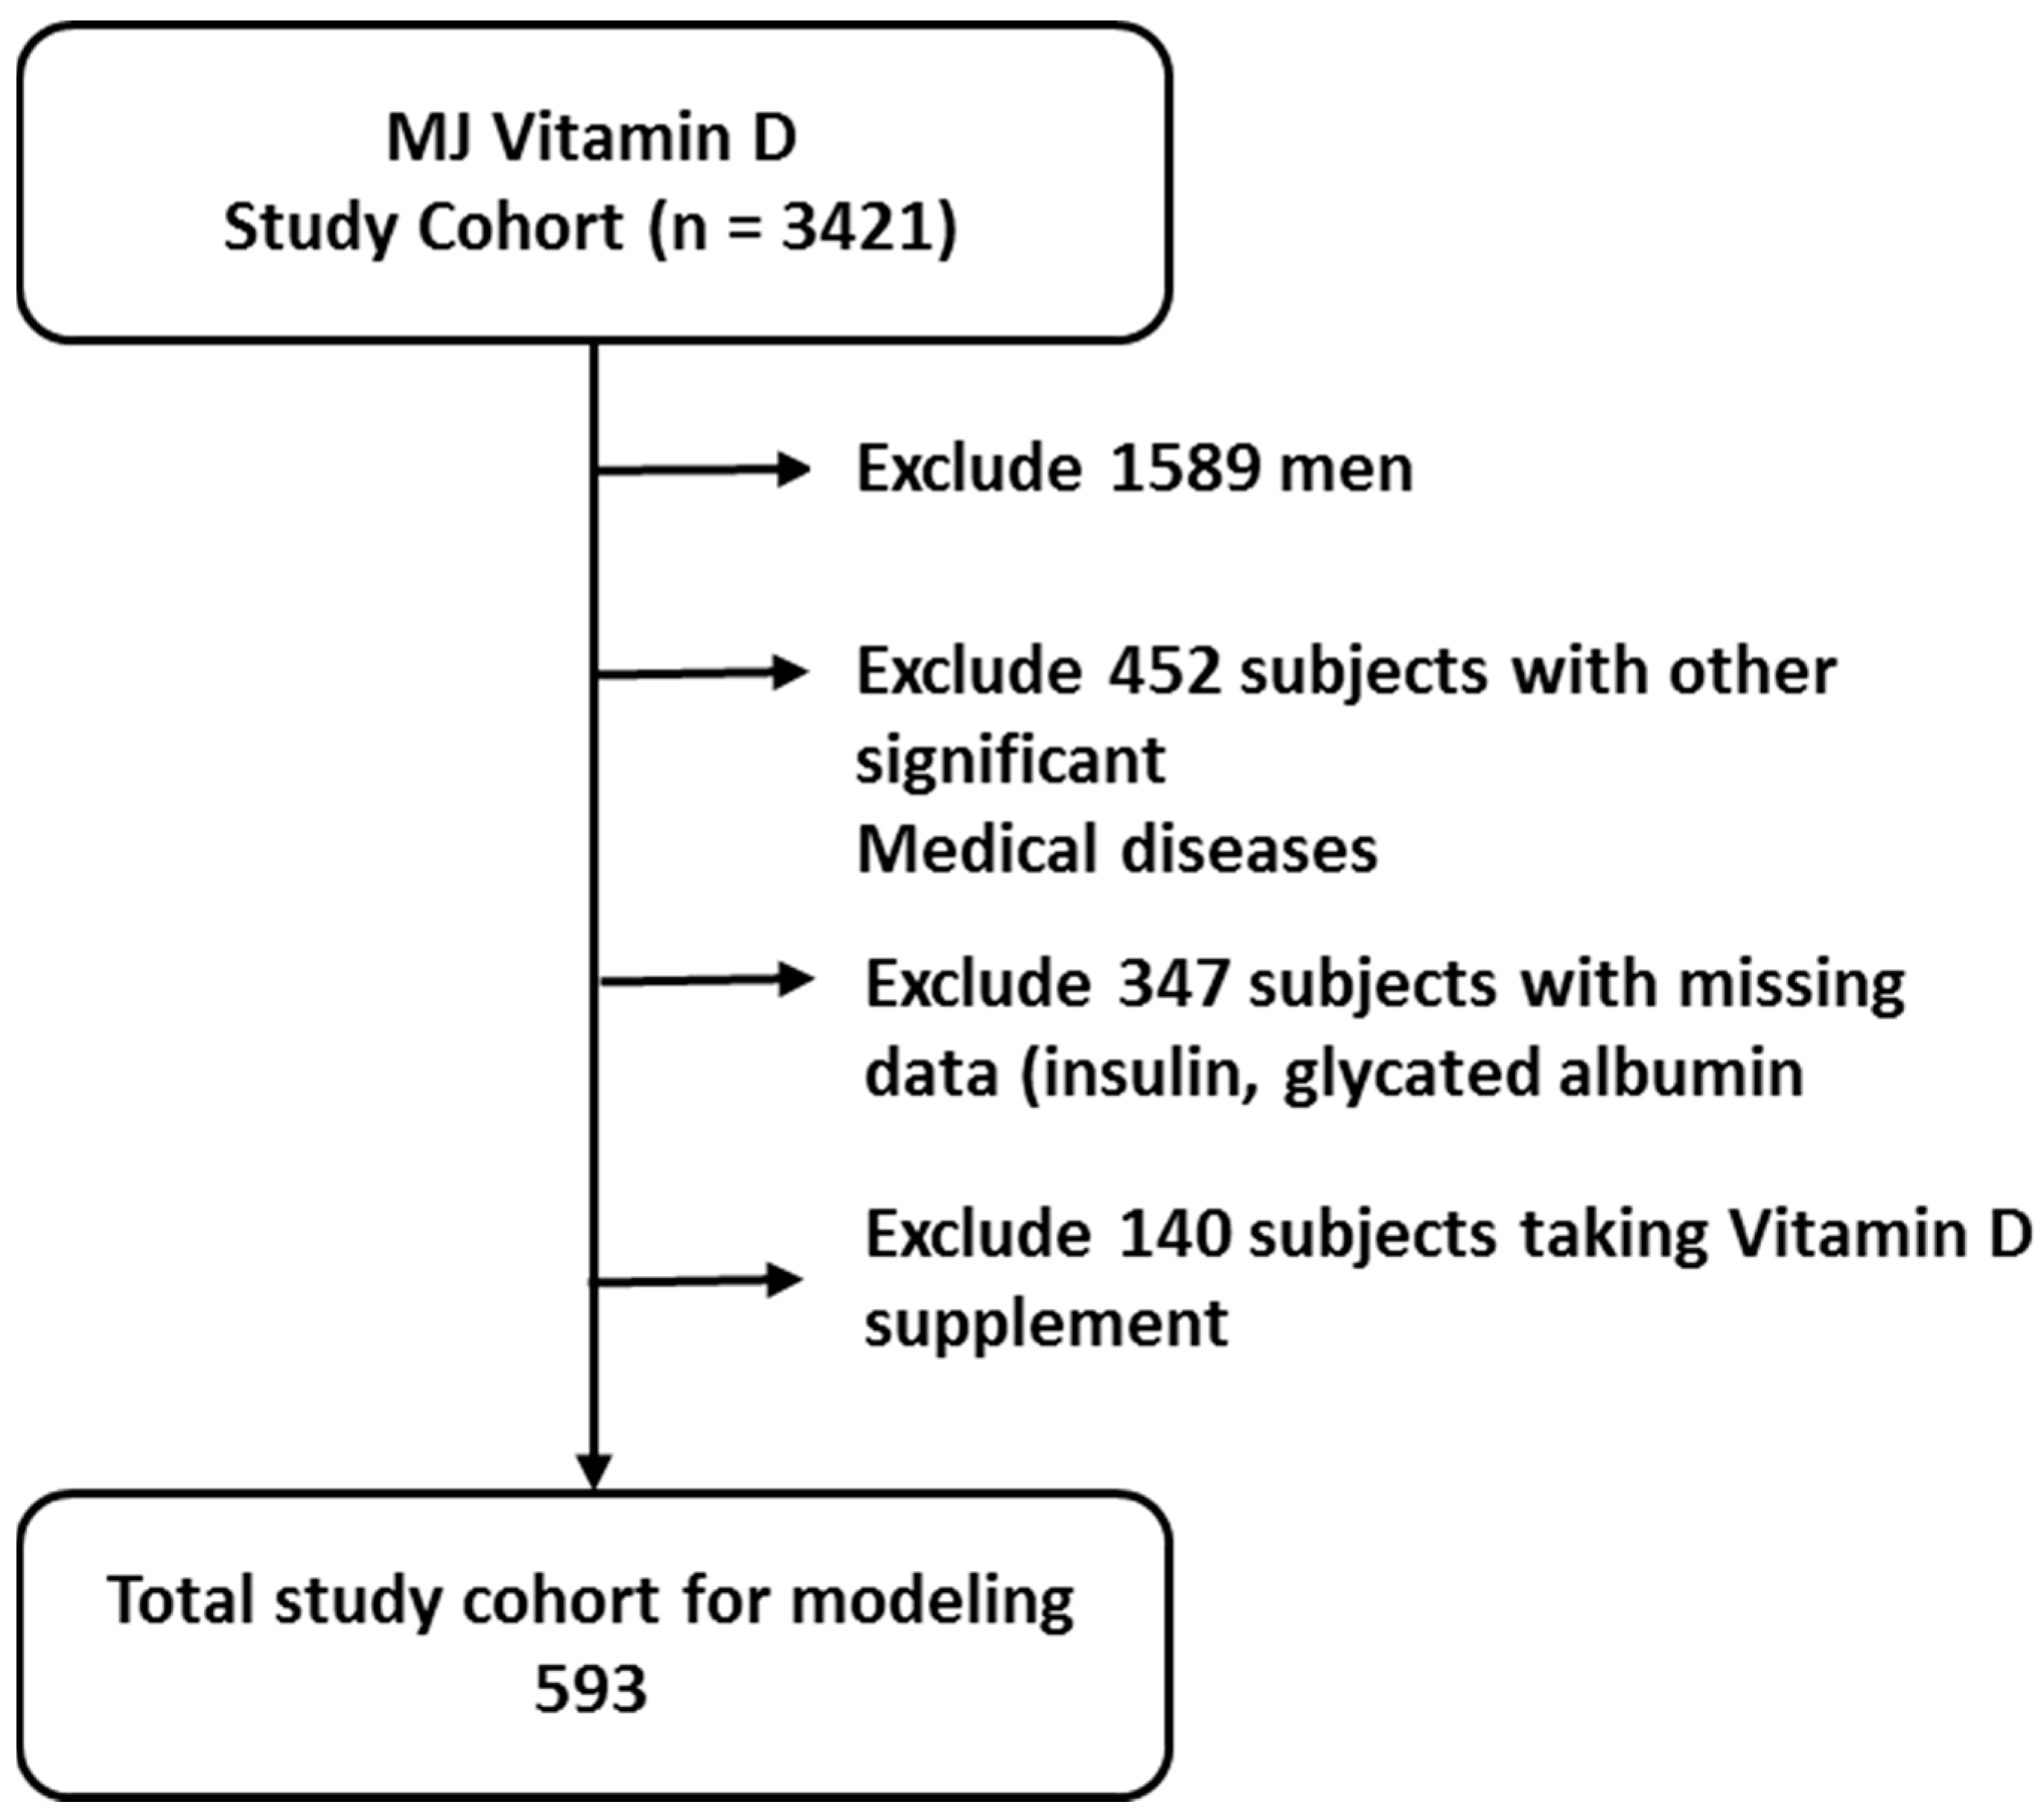
2.1. Participants and Study Design
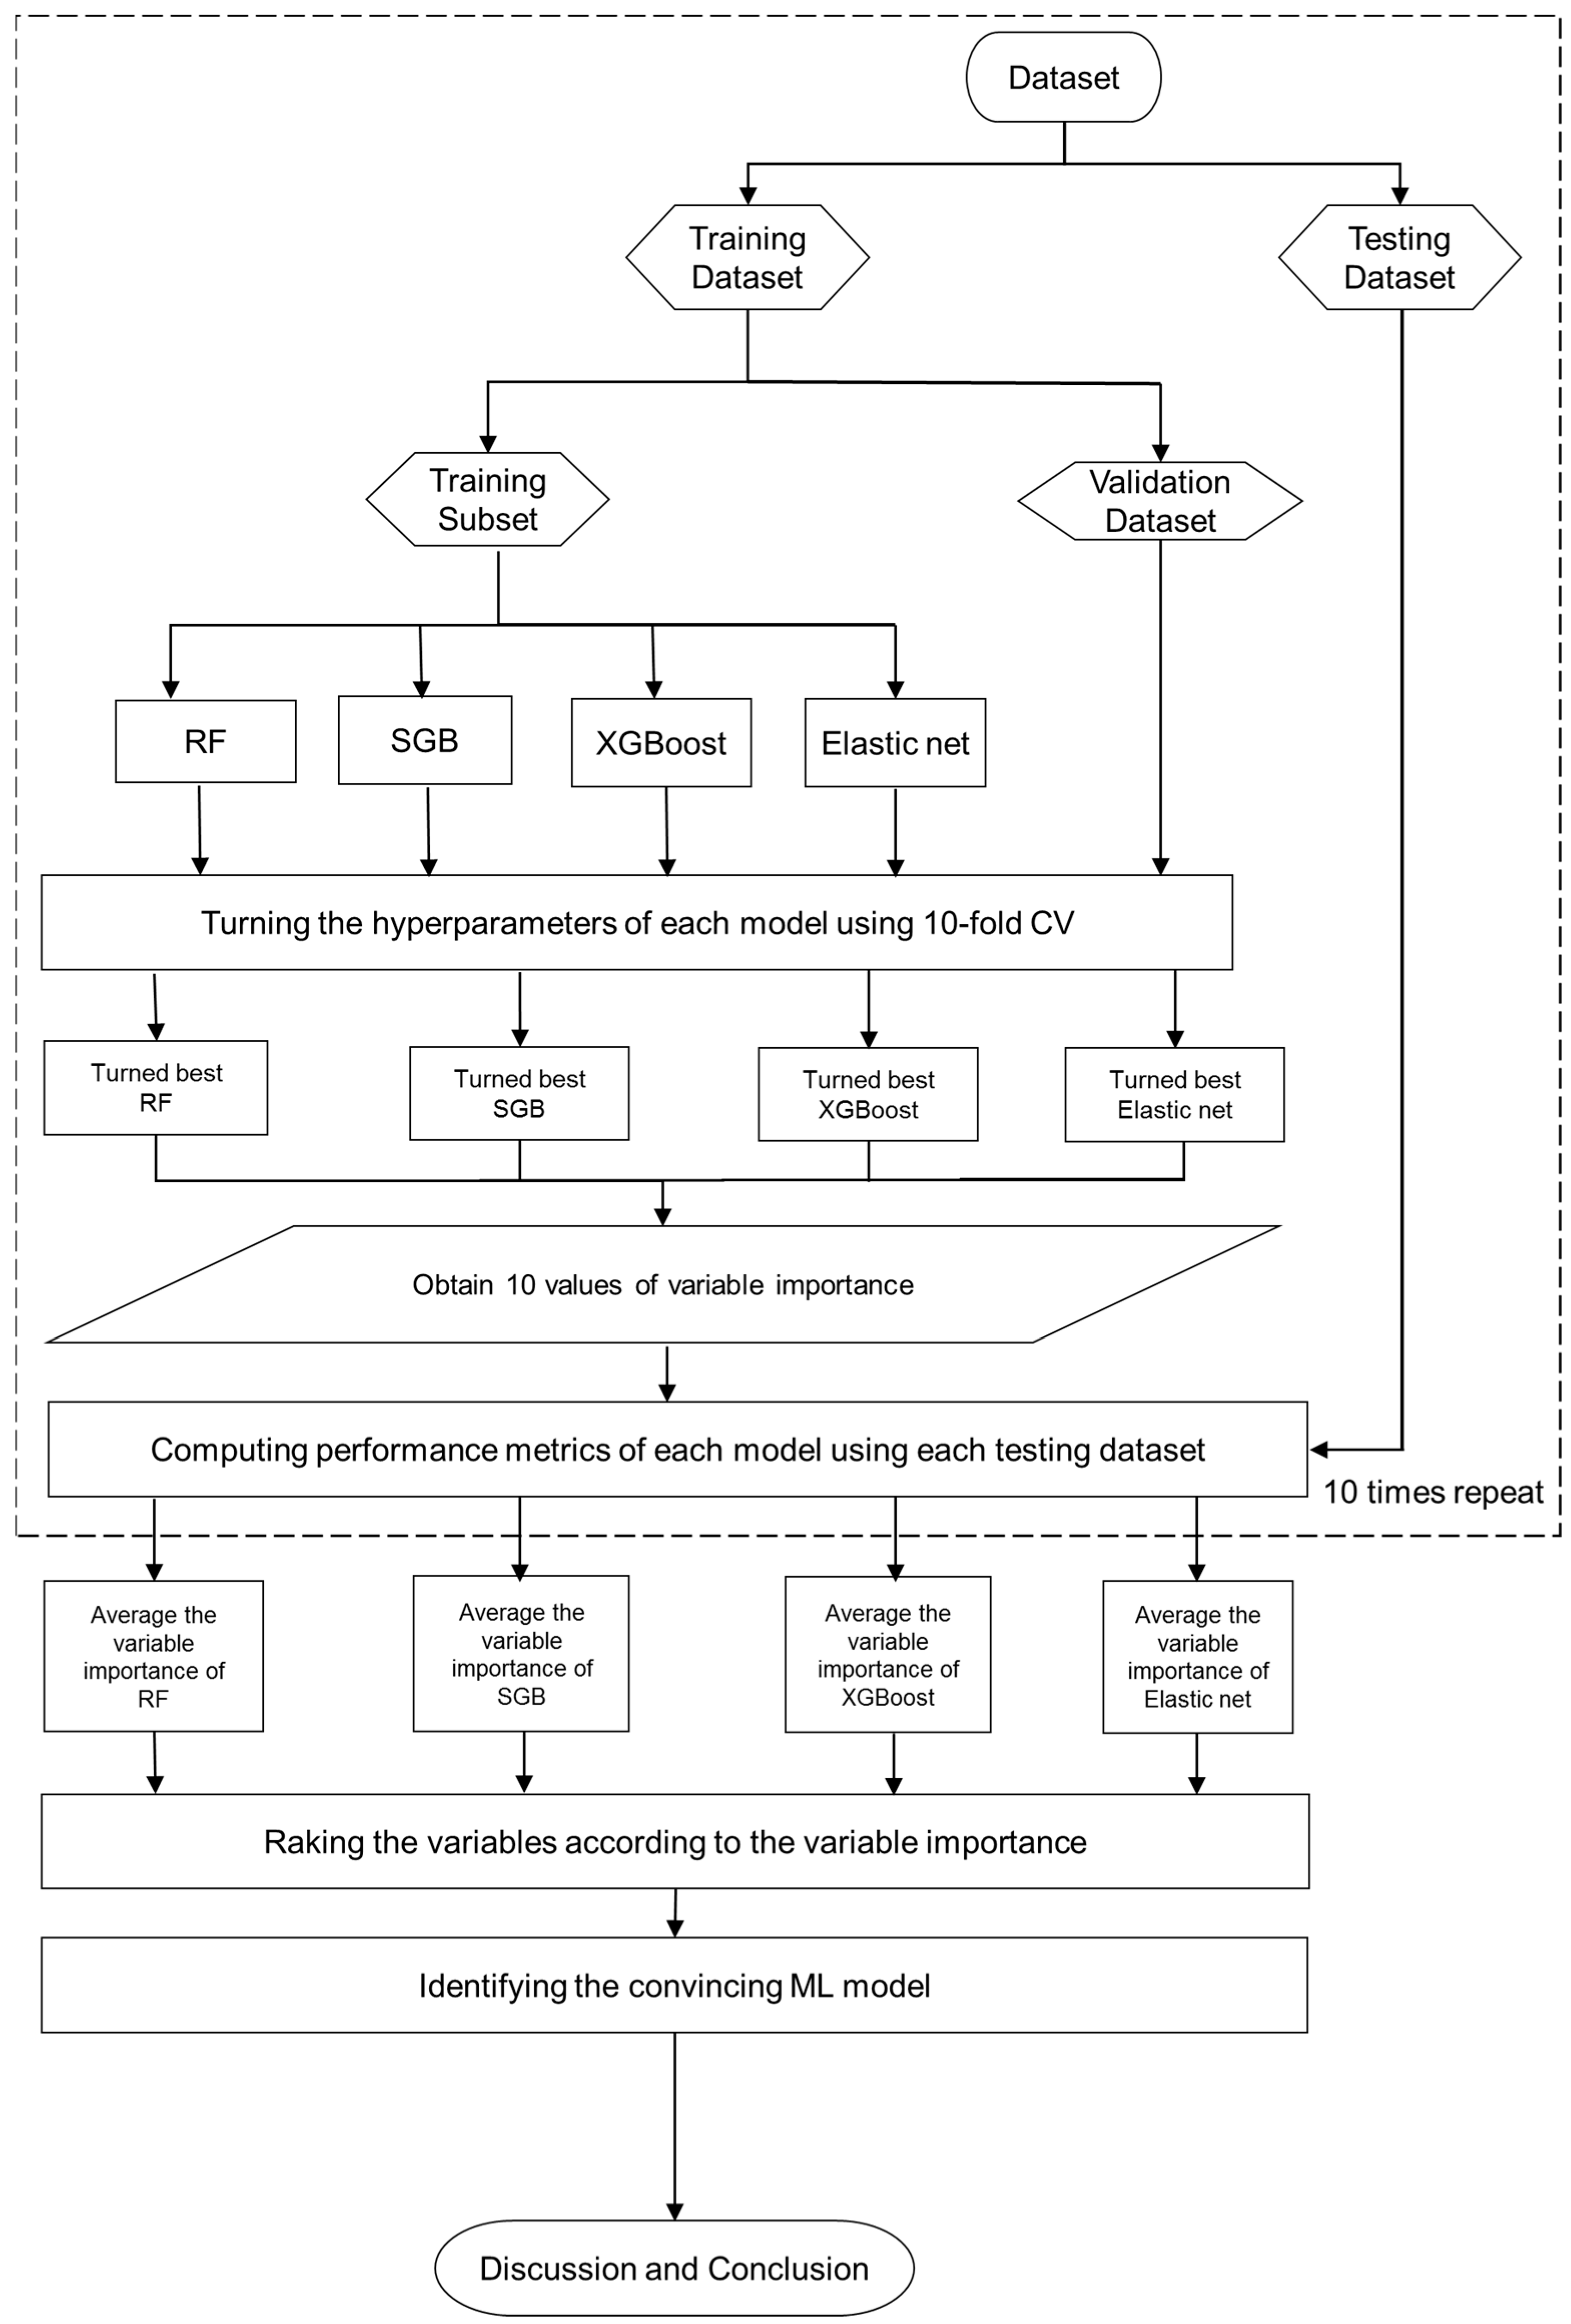
2.2. Proposed Mach-L Scheme
2.3. Statistical Methods
3. Results
4. Discussion
5. Conclusions
Author Contributions
Funding
Institutional Review Board Statement
Data Availability Statement
Conflicts of Interest
References
- Antonucci, R.; Locci, C.; Clemente, M.G.; Chicconi, E.; Antonucci, L. Vitamin D deficiency in childhood: Old lessons and current challenges. J. Pediatr. Endocrinol. Metab. 2018, 31, 247–260. [Google Scholar] [CrossRef]
- Uday, S.; Högler, W. Prevention of rickets and osteomalacia in the UK: Political action overdue. Arch. Dis. Child. 2018, 103, 901–906. [Google Scholar] [CrossRef] [PubMed]
- Hurst, E.A.; Homer, N.Z.; Mellanby, R.J. Vitamin D Metabolism and Profiling in Veterinary Species. Metabolites 2020, 10, 371. [Google Scholar] [CrossRef] [PubMed]
- Slominski, A.T.; Shehabi, H.Z.; Semak, I.; Tang, E.K.Y.; Nguyen, M.N.; Benson, H.A.E.; Korik, E.; Janjetovic, Z.; Chen, J.; Yates, C.R.; et al. In vivo evidence for a novel pathway of vitamin D3 metabolism initiated by P450scc and modified by CYP27B1. FASEB J. 2012, 26, 3901–3915. [Google Scholar] [CrossRef] [PubMed]
- Slominski, A.T.; Kim, T.-K.; Shehabi, H.Z.; Tang, E.K.; Benson, H.A.E.; Semak, I.; Lin, Z.; Yates, C.R.; Wang, J.; Li, W.; et al. In vivo production of novel vitamin D2 hydroxy-derivatives by human placentas, epidermal keratinocytes, Caco-2 colon cells and the adrenal gland. Mol. Cell Endocrinol. 2014, 383, 181–192. [Google Scholar] [CrossRef] [PubMed]
- Slominski, A.T.; Li, W.; Kim, T.-K.; Semak, I.; Wang, J.; Zjawiony, J.K.; Tuckey, R.C. Novel activities of CYP11A1 and their potential physiological significance. J. Steroid Biochem. Mol. Biol. 2015, 151, 25–37. [Google Scholar] [CrossRef] [PubMed]
- Slominski, A.T.; Kim, T.-K.; Li, W.; Postlethwaite, A.; Tieu, E.W.; Tang, E.K.Y.; Tuckey, R.C. Detection of novel CYP11A1-derived secosteroids in the human epidermis and serum and pig adrenal gland. Sci. Rep. 2015, 5, 14875. [Google Scholar] [CrossRef]
- Slominski, R.; Raman, C.; Elmets, C.; Jetten, A.; Slominski, A.; Tuckey, R. The significance of CYP11A1 expression in skin physiology and pathology. Mol. Cell Endocrinol. 2021, 530, 111238. [Google Scholar] [CrossRef]
- Slominski, A.T.; Kim, T.-K.; Slominski, R.M.; Song, Y.; Janjetovic, Z.; Podgorska, E.; Reddy, S.B.; Song, Y.; Raman, C.; Tang, E.K.Y.; et al. Metabolic activation of tachysterol(3) to biologically active hydroxyderivatives that act on VDR, AhR, LXRs, and PPARγ receptors. FASEB J. 2022, 36, e22451. [Google Scholar] [CrossRef]
- Buonsenso, D.; Pata, D.; Colonna, A.T.; Ferrari, V.; Salerno, G.; Valentini, P. Vitamin D and tuberculosis in children: A role in the prevention or treatment of the disease? Monaldi Arch. Chest Dis. 2022, 92, 2112. [Google Scholar] [CrossRef]
- Hughes, D.A.; Norton, R. Vitamin D and respiratory health. Clin. Exp. Immunol. 2009, 158, 20–25. [Google Scholar] [CrossRef] [PubMed]
- Nitzan, I.; Mimouni, F.B.; Nun, A.B.; Kasirer, Y.; Mendlovic, J. Vitamin D and Asthma: A Systematic Review of Clinical Trials. Curr. Nutr. Rep. 2022, 11, 311–317. [Google Scholar] [CrossRef] [PubMed]
- Huang, C.M.; Lara-Corrales, I.; Pope, E. Effects of Vitamin D levels and supplementation on atopic dermatitis: A systematic review. Pediatr. Dermatol. 2018, 35, 754–760. [Google Scholar] [CrossRef] [PubMed]
- Judd, S.E.; Tangpricha, V. Vitamin D deficiency and risk for cardiovascular disease. Am. J. Med. Sci. 2009, 338, 40–44. [Google Scholar] [CrossRef] [PubMed]
- Ullah, M.I.; Uwaifo, G.I.; Nicholas, W.C.; Koch, C.A. Does vitamin d deficiency cause hypertension? Current evidence from clinical studies and potential mechanisms. Int. J. Endocrinol. 2010, 2010, 579640. [Google Scholar] [CrossRef] [PubMed]
- Gupta, D.; Vashi, P.G.; Trukova, K.; Lis, C.G.; Lammersfeld, C.A. Prevalence of serum vitamin D deficiency and insufficiency in cancer: Review of the epidemiological literature. Exp. Ther. Med. 2011, 2, 181–193. [Google Scholar] [CrossRef] [PubMed]
- Nowaczewska, M.; Wicinski, M.; Osinski, S.; Kazmierczak, H. The role of vitamin D in primary headache- from potential mechanism to treatment. Nutrients 2020, 12, 243. [Google Scholar] [CrossRef]
- Herrick, K.A.; Storandt, R.J.; Afful, J.; Pfeiffer, C.M.; Schleicher, R.L.; Gahche, J.J.; Potischman, N. Vitamin D status in the United States, 2011–2014. Am. J. Clin. Nutr. 2019, 110, 150–157. [Google Scholar] [CrossRef]
- National Diet and Nutrition Survey. Available online: https://assets.publishing.service.gov.uk/government/uploads/system/uploads/attachment_data/file/772434/NDNS_UK_Y1-9_report.pdf (accessed on 5 January 2023).
- Komaroff, A.L. Vitamin D Deficiency Common Even in Southern U.S. N. Engl. J. Med. 2008, 87, 608–613. [Google Scholar]
- Marateb, H.R.; Mansourian, M.; Faghihimani, E.; Amini, M.; Farina, D. A hybrid intelligent system for diagnosing microalbuminuria in type 2 diabetes patients without having to measure urinary albumin. Comput. Biol. Med. 2014, 45, 34–42. [Google Scholar] [CrossRef]
- Ye, Y.; Xiong, Y.; Zhou, Q.; Wu, J.; Li, X.; Xiao, X. Comparison of Machine Learning Methods and Conventional Logistic Regressions for Predicting Gestational Diabetes Using Routine Clinical Data: A Retrospective Cohort Study. J. Diabetes Res. 2020, 2020, 4168340. [Google Scholar] [CrossRef] [PubMed]
- Nusinovici, S.; Tham, Y.C.; Yan, M.Y.C.; Ting, D.S.W.; Li, J.; Sabanayagam, C.; Wong, T.Y.; Cheng, C.-Y. Logistic regression was as good as machine learning for predicting major chronic diseases. J. Clin. Epidemiol. 2020, 122, 56–69. [Google Scholar] [CrossRef] [PubMed]
- Miller, D.D.; Brown, E.W. Artificial Intelligence in Medical Practice: The Question to the Answer? Am. J. Med. 2018, 131, 129–133. [Google Scholar] [CrossRef] [PubMed]
- Chen, C.-H.; Wang, C.-K.; Wang, C.-Y.; Chang, C.-F.; Chu, T.-W. Roles of biochemistry data, lifestyle, and inflammation in identifying abnormal renal function in old Chinese. World J. Clin. Cases 2023, 11, 7004–7016. [Google Scholar] [CrossRef]
- Tseng, C.J.; Lu, C.J.; Chang, C.C.; Chen, G.D.; Cheewakriangkrai, C. Integration of data mining classification techniques and ensemble learning to identify risk factors and diagnose ovarian cancer recurrence. Artif. Intell. Med. 2017, 78, 47–54. [Google Scholar] [CrossRef] [PubMed]
- Ting, W.-C.; Chang, H.-R.; Chang, C.-C.; Lu, C.-J. Developing a Novel Machine Learning-Based Classification Scheme for Predicting SPCs in Colorectal Cancer Survivors. Appl. Sci. 2020, 10, 1355. [Google Scholar] [CrossRef]
- Shih, C.-C.; Lu, C.-J.; Chen, G.-D.; Chang, C.-C. Risk Prediction for Early Chronic Kidney Disease: Results from an Adult Health Examination Program of 19,270 Individuals. Int. J. Environ. Res. Public Health 2020, 17, 4973. [Google Scholar] [CrossRef] [PubMed]
- Lee, T.-S.; Chen, I.-F.; Chang, T.-J.; Lu, C.-J. Forecasting Weekly Influenza Outpatient Visits Using a Two-Dimensional Hierarchical Decision Tree Scheme. Int. J. Environ. Res. Public Health 2020, 17, 4743. [Google Scholar] [CrossRef]
- Chang, C.-C.; Yeh, J.-H.; Chen, Y.-M.; Jhou, M.-J.; Lu, C.-J. Clinical Predictors of Prolonged Hospital Stay in Patients with Myasthenia Gravis: A Study Using Machine Learning Algorithms. J. Clin. Med. 2021, 10, 4393. [Google Scholar] [CrossRef]
- Chang, C.-C.; Huang, T.-H.; Shueng, P.-W.; Chen, S.-H.; Chen, C.-C.; Lu, C.-J.; Tseng, Y.-J. Developing a Stacked Ensemble-Based Classification Scheme to Predict Second Primary Cancers in Head and Neck Cancer Survivors. Int. J. Environ. Res. Public Health 2021, 18, 12499. [Google Scholar] [CrossRef]
- Chiu, Y.L.; Jhou, M.J.; Lee, T.S.; Lu, C.J.; Chen, M.S. Health Data-Driven Machine Learning Algorithms Applied to Risk Indicators Assessment for Chronic Kidney Disease. Risk Manag. Heal. Policy 2021, 14, 4401–4412. [Google Scholar] [CrossRef] [PubMed]
- Wu, T.-E.; Chen, H.-A.; Jhou, M.-J.; Chen, Y.-N.; Chang, T.-J.; Lu, C.-J. Evaluating the Effect of Topical Atropine Use for Myopia Control on Intraocular Pressure by Using Machine Learning. J. Clin. Med. 2021, 10, 111. [Google Scholar] [CrossRef] [PubMed]
- Wu, C.-W.; Shen, H.-L.; Lu, C.-J.; Chen, S.-H.; Chen, H.-Y. Comparison of Different Machine Learning Classifiers for Glaucoma Diagnosis Based on Spectralis OCT. Diagnostics 2021, 11, 1718. [Google Scholar] [CrossRef] [PubMed]
- Chang, C.C.; Yeh, J.H.; Chiu, H.C.; Chen, Y.M.; Jhou, M.J.; Liu, T.C.; Lu, C.J. Utilization of Decision Tree Algorithms for Supporting the Prediction of Intensive Care Unit Admission of Myasthenia Gravis: A Machine Learning-Based Approach. J. Pers. Med. 2022, 12, 32. [Google Scholar] [CrossRef] [PubMed]
- Breiman, L. Random Forests. Mach. Learn. 2001, 45, 5–32. [Google Scholar] [CrossRef]
- Calle, M.L.; Urrea, V. Letter to the Editor: Stability of Random Forest importance measures. Brief. Bioinform. 2010, 12, 86–89. [Google Scholar] [CrossRef] [PubMed]
- Friedman, J.H. Greedy function approximation: A gradient boosting machine. Ann. Stat. 2001, 29, 1189–1232. [Google Scholar] [CrossRef]
- Friedman, J.H. Stochastic gradient boosting. Comput. Stat. Data Anal. 2002, 38, 367–378. [Google Scholar] [CrossRef]
- Chen, T.; Guestrin, C. XGBoost: A Scalable Tree Boosting System. In Proceedings of the 22nd ACM SIGKDD International Conference on Knowledge Discovery and Data Mining, San Francisco, CA, USA, 13–17 August 2016; pp. 785–794. [Google Scholar]
- Torlay, L.; Perrone-Bertolotti, M.; Thomas, E.; Baciu, M. Machine learning–XGBoost analysis of language networks to classify patients with epilepsy. Brain Inform. 2017, 4, 159–169. [Google Scholar] [CrossRef]
- What Are Some Common Pitfalls and Challenges of Elastic Net Regression? Available online: https://www.linkedin.com/advice/0/what-some-common-pitfalls-challenges-elastic (accessed on 5 January 2023).
- Sancar, N.; Tabrizi, S.S. Machine learning approach for the detection of vitamin D level: A comparative study. BMC Med. Inform. Decis. Mak. 2023, 23, 219. [Google Scholar] [CrossRef]
- Sambasivam, G.; Amudhavel, J.; Sathya, G. A Predictive Performance Analysis of Vitamin D Deficiency Severity Using Machine Learning Methods. IEEE Access 2020, 8, 109492–109507. [Google Scholar] [CrossRef]
- Patino-Alonso, C.; Gómez-Sánchez, M.; Gómez-Sánchez, L.; Salgado, B.S.; Rodríguez-Sánchez, E.; García-Ortiz, L.; Gómez-Marcos, M.A. Predictive Ability of Machine-Learning Methods for Vitamin D Deficiency Prediction by Anthropometric Parameters. Mathematics 2022, 10, 616. [Google Scholar] [CrossRef]
- Giustina, A.; Bouillon, R.; Dawson-Hughes, B.; Ebeling, P.R.; Lazaretti-Castro, M.; Lips, P.; Marcocci, C.; Bilezikian, J.P. Vitamin D in the older population: A consensus statement. Endocrine 2023, 79, 31–44. [Google Scholar] [CrossRef] [PubMed]
- Gallagher, J.C. Vitamin D and aging. Endocrinol. Metab. Clin. N. Am. 2013, 42, 319–332. [Google Scholar] [CrossRef] [PubMed]
- Chalcraft, J.R.; Cardinal, L.M.; Wechsler, P.J.; Hollis, B.W.; Gerow, K.G.; Alexander, B.M.; Keith, J.F.; Larson-Meyer, D.E. Vitamin D Synthesis Following a Single Bout of Sun Exposure in Older and Younger Men and Women. Nutrients 2020, 12, 2237. [Google Scholar] [CrossRef]
- Wilcox, G. Insulin and insulin resistance. Clin. Biochem. Rev. 2005, 26, 19–39. [Google Scholar] [PubMed]
- Goodman, Z.D.; Makhlouf, H.R.; Liu, L.; Balistreri, W.; Gonzalez-Peralta, R.P.; Haber, B.; Jonas, M.M.; Mohan, P.; Molleston, J.P.; Murray, K.F.; et al. Pathology of chronic hepatitis C in children: Liver biopsy findings in the Peds-C Trial. Hepatology 2008, 47, 836–843. [Google Scholar] [CrossRef] [PubMed]
- Ruane, P.J.; Ain, D.; Stryker, R.; Meshrekey, R.; Soliman, M.; Wolfe, P.R.; Riad, J.; Mikhail, S.; Kersey, K.; Jiang, D.; et al. Sofosbuvir plus ribavirin for the treatment of chronic genotype 4 hepatitis C virus infection in patients of Egyptian ancestry. J. Hepatol. 2015, 62, 1040–1046. [Google Scholar] [CrossRef]
- Kim, D. The Role of Vitamin D in Thyroid Diseases. Int. J. Mol. Sci. 2017, 18, 1949. [Google Scholar] [CrossRef]
- McDonnell, D.P.; Pike, J.W.; O’Malley, B.W. The vitamin D receptor: A primitive steroid receptor related to thyroid hormone receptor. J. Steroid Biochem. 1988, 30, 41–46. [Google Scholar] [CrossRef]
- Lips, P. Vitamin D physiology. Prog. Biophys. Mol. Biol. 2006, 92, 4–8. [Google Scholar] [CrossRef] [PubMed]
- Canguven, O.; Talib, R.A.; El Ansari, W.; Yassin, D.J.; Al Naimi, A. Vitamin D treatment improves levels of sexual hormones, metabolic parameters and erectile function in middle-aged vitamin D deficient men. Aging Male 2017, 20, 9–16. [Google Scholar] [CrossRef] [PubMed]
- Kidir, V.; Altuntas, A.; Inal, S.; Akpinar, A.; Orhan, H.; Sezer, M.T. Sexual dysfunction in dialysis patients: Does vitamin D deficiency have a role? Int. J. Clin. Exp. Med. 2015, 8, 22491–22496. [Google Scholar] [PubMed]
- Wu, L.-W.; Kao, T.-W.; Lin, C.-M.; Yang, H.-F.; Sun, Y.-S.; Liaw, F.-Y.; Wang, C.-C.; Peng, T.-C.; Chen, W.-L. Examining the association between serum lactic dehydrogenase and all-cause mortality in patients with metabolic syndrome: A retrospective observational study. BMJ Open 2016, 6, e011186. [Google Scholar] [CrossRef] [PubMed]
- Mousa, A.; Misso, M.; Teede, H.; Scragg, R.; de Courten, B. Effect of vitamin D supplementation on inflammation: Protocol for a systematic review. BMJ Open 2016, 6, e010804. [Google Scholar] [CrossRef] [PubMed]
- Kovar, I.; Mayne, P.; Barltrop, D. Plasma alkaline phosphatase activity: A screening test for rickets in preterm neonates. Lancet 1982, 1, 308–310. [Google Scholar] [CrossRef] [PubMed]
- Peacey, S.R. Routine biochemistry in suspected vitamin D deficiency. J. R. Soc. Med. 2004, 97, 322–325. [Google Scholar] [CrossRef]
- Saraç, F.; Saygılı, F. Causes of High Bone Alkaline Phosphatase. Biotechnol. Biotechnol. Equip. 2007, 21, 194–197. [Google Scholar] [CrossRef]
- Allen, S.C.; Raut, S. Biochemical recovery time scales in elderly patients with osteomalacia. J. R. Soc. Med. 2004, 97, 527–530. [Google Scholar] [CrossRef]
- Shaheen, S.; Noor, S.S.; Barakzai, Q. Serum alkaline phosphatase screening for vitamin D deficiency states. J. Coll. Physicians Surg. Pak. 2012, 22, 424–427. [Google Scholar]
- van Straalen, J.P.; Sanders, E.; Prummel, M.F.; Sanders, G.T. Bone-alkaline phosphatase as indicator of bone formation. Clin. Chim. Acta 1991, 201, 27–33. [Google Scholar] [CrossRef] [PubMed]
- Boonen, S.; Lips, P.; Bouillon, R.; Bischoff-Ferrari, H.A.; Vanderschueren, D.; Haentjens, P. Need for additional calcium to reduce the risk of hip fracture with vitamin d supplementation: Evidence from a comparative metaanalysis of randomized controlled trials. J. Clin. Endocrinol. Metab. 2007, 92, 1415–1423. [Google Scholar] [CrossRef] [PubMed]
- Li, Y.; Tong, C.H.; Rowland, C.M.; Radcliff, J.; Bare, L.A.; McPhaul, M.J.; Devlin, J.J. Association of changes in lipid levels with changes in vitamin D levels in a real-world setting. Sci. Rep. 2021, 11, 21536. [Google Scholar] [CrossRef] [PubMed]
- Slominski, A.T.; Kim, T.-K.; Qayyum, S.; Song, Y.; Janjetovic, Z.; Oak, A.S.W.; Slominski, R.M.; Raman, C.; Stefan, J.; Mier-Aguilar, C.A.; et al. Vitamin D and lumisterol derivatives can act on liver X receptors (LXRs). Sci. Rep. 2021, 11, 8002. [Google Scholar] [CrossRef]

| Variable | Values | |
|---|---|---|
| n | 593 | |
| Age (year) | 37.98 ± 7.58 | |
| Body fat percentage (%) | 29.65 ± 7.42 | |
| Systolic blood pressure (mmHg) | 108.5 ± 13.87 | |
| Diastolic blood pressure (mmHg) | 70.92 ± 9.86 | |
| Fasting plasma glucose (mg/dL) | 95.14 ± 7.72 | |
| Glycated hemoglobin (%) | 5.3 ± 0.37 | |
| Plasma insulin level (μU/mL) | 6.67 ± 3.65 | |
| Triglyceride (mg/dL) | 77.1 ± 41.28 | |
| HDL-cholesterol (mg/dL) | 65.08 ± 14.15 | |
| LDL-cholesterol (mg/dL) | 109.34 ± 30.4 | |
| Hemoglobin (g/dL) | 13.06 ± 1.29 | |
| Platelet cell count (*103/μL) | 249.46 ± 58.51 | |
| White blood cell count (*103/μL) | 5.95 ± 1.56 | |
| Alkaline phosphatase (IU/L) | 50.02 ± 15.78 | |
| Glutamic oxaloacetic transaminase (IU/L) | 20.42 ± 7.29 | |
| Glutamic pyruvic transaminase (IU/L) | 20.43 ± 16.48 | |
| Total bilirubin (mg/dL) | 0.9 ± 0.31 | |
| γ-Glutamyltransferase (IU/L) | 19.16 ± 13.24 | |
| Plasma calcium level (mg/dL) | 9.59 ± 0.36 | |
| Plasma ferritin level (μg/dL) | 82.1 ± 35.97 | |
| Plasma phosphate level (mg/dL) | 3.88 ± 0.47 | |
| Uric acid (mg/dL) | 4.71 ± 1.06 | |
| Alfa-fetoprotein (ng/mL) | 3.15 ± 10.52 | |
| Carcinoembryonic antigen (ng/mL) | 1.34 ± 0.74 | |
| Estimated glomerular filtration rate (mL/min/1.73m2) | 86.54 ± 12.63 | |
| Lactic dehydrogenase (IU/L) | 150.41 ± 23.64 | |
| High-sensitivity C-reactive protein (mg/L) | 1.4 ± 2.28 | |
| Forced expiratory volume in one second (L) | 93.52 ± 15.07 | |
| Thyroid-stimulating hormone (uIU/mL) | 1.75 ± 1.03 | |
| Free-testosterone level (pg/mL) | 3.53 ± 1.93 | |
| 25-OH vitamin D (ng/mL) | 20.86 ± 7.69 | |
| Exercise hour | 7.58 ± 8.29 | |
| With or without spouse | ||
| Single | 211 (38.86) | 19.1 ± 7.4 * |
| With spouse | 332 (61.14) | 22.0 ± 7.6 |
| Sleep hours | ||
| 0–4 h/day | 7(1.25) | 21.6 ± 9.1 |
| 4–6 h/day | 147 (26.25) | 21.1 ±7.6 |
| 6–7 h/day | 267 (47.68) | 20.2 ± 7.5 |
| 7–8 h/day | 113 (20.18) | 18.9 ± 6.7 |
| 8–9 h/day | 23 (4.11) | 19.1 ±4.4 |
| >9 h/day | 3 (0.54) | 21.0 ± 5.0 |
| Education level | ||
| Junior high school | 9 (1.68) | 21.4 ± 8.4 |
| Senior high school | 82 (15.27) | 22.1 ± 7.2 |
| College | 97 (18.06) | 21.5 ± 7.9 |
| University | 266 (49.53) | 20.5 0 7.9± |
| Higher than master degree | 83 (15.46) | 20.4 ±6.8 |
| Family Income (thousand USD/year) | ||
| <6.1/year | 87 (16.93) | 26.6 ± 9.1 |
| <6.1–12.1/year | 128 (24.90) | 21.1 ± 7.6 |
| 12.1–24.2/year | 175 (34.05) | 20.2 ± 2.5 |
| 24.2–36.2/year | 79 (15.37) | 21.4 ± 7.4 |
| 36.2–48.3/year | 22 (4.28) | 18.9 ± 6.6 |
| 48.3–60.4/year | 12 (2.33) | 19.2 ± 4.4 |
| >60.4/year | 11 (2.14) | 210 ± 5.0 |
| Metrics | Description | Calculation |
|---|---|---|
| SMAPE | Symmetric Mean Absolute Percentage Error | |
| RAE | Relative Absolute Error | |
| RRSE | Root Relative Squared Error | |
| RMSE | Root Mean Squared Error |
| Age | Body Fat | SBP | DBP | HbA1c | PI | TG | HDL-C | LDL-C | Hb | Platelet | WBC | ALP | GOT | GPT | TB | GGT | Ca | P | Fe | UA | AFP | CEA | LDH | Hs-CRP | TSH | T |
|---|---|---|---|---|---|---|---|---|---|---|---|---|---|---|---|---|---|---|---|---|---|---|---|---|---|---|
| 0.187 ** | −0.032 | 0.045 | 0.052 | 0.113 | −0.030 | 0.058 | 0.090 * | 0.099 * | 0.094 * | 0.009 | −0.016 | −0.012 | −0.026 | −0.057 | 0.041 | 0.019 | 0.073 | 0.083 | 0.064 | 0.047 | −0.017 | 0.073 | 0.074 | −0.006 | −0.075 | −0.081 |
| MAPE | SMAPE | RAE | RRSE | RMSE | |
|---|---|---|---|---|---|
| LR | 0.3896 | 0.32 | 1.1245 | 1.1447 | 8.1507 |
| RF | 0.3721 | 0.277 | 1.0045 | 0.9818 | 6.9913 |
| SGB | 0.3728 | 0.2915 | 1.0495 | 0.97 | 6.9069 |
| XGboost | 0.3703 | 0.2816 | 1.0316 | 1.0679 | 7.6038 |
| Elastic net | 0.3579 | 0.2721 | 0.9805 | 0.9736 | 6.9325 |
| Variable | Linear | RF | SGB | XGBoost | Elastic net | Mean | MROI |
|---|---|---|---|---|---|---|---|
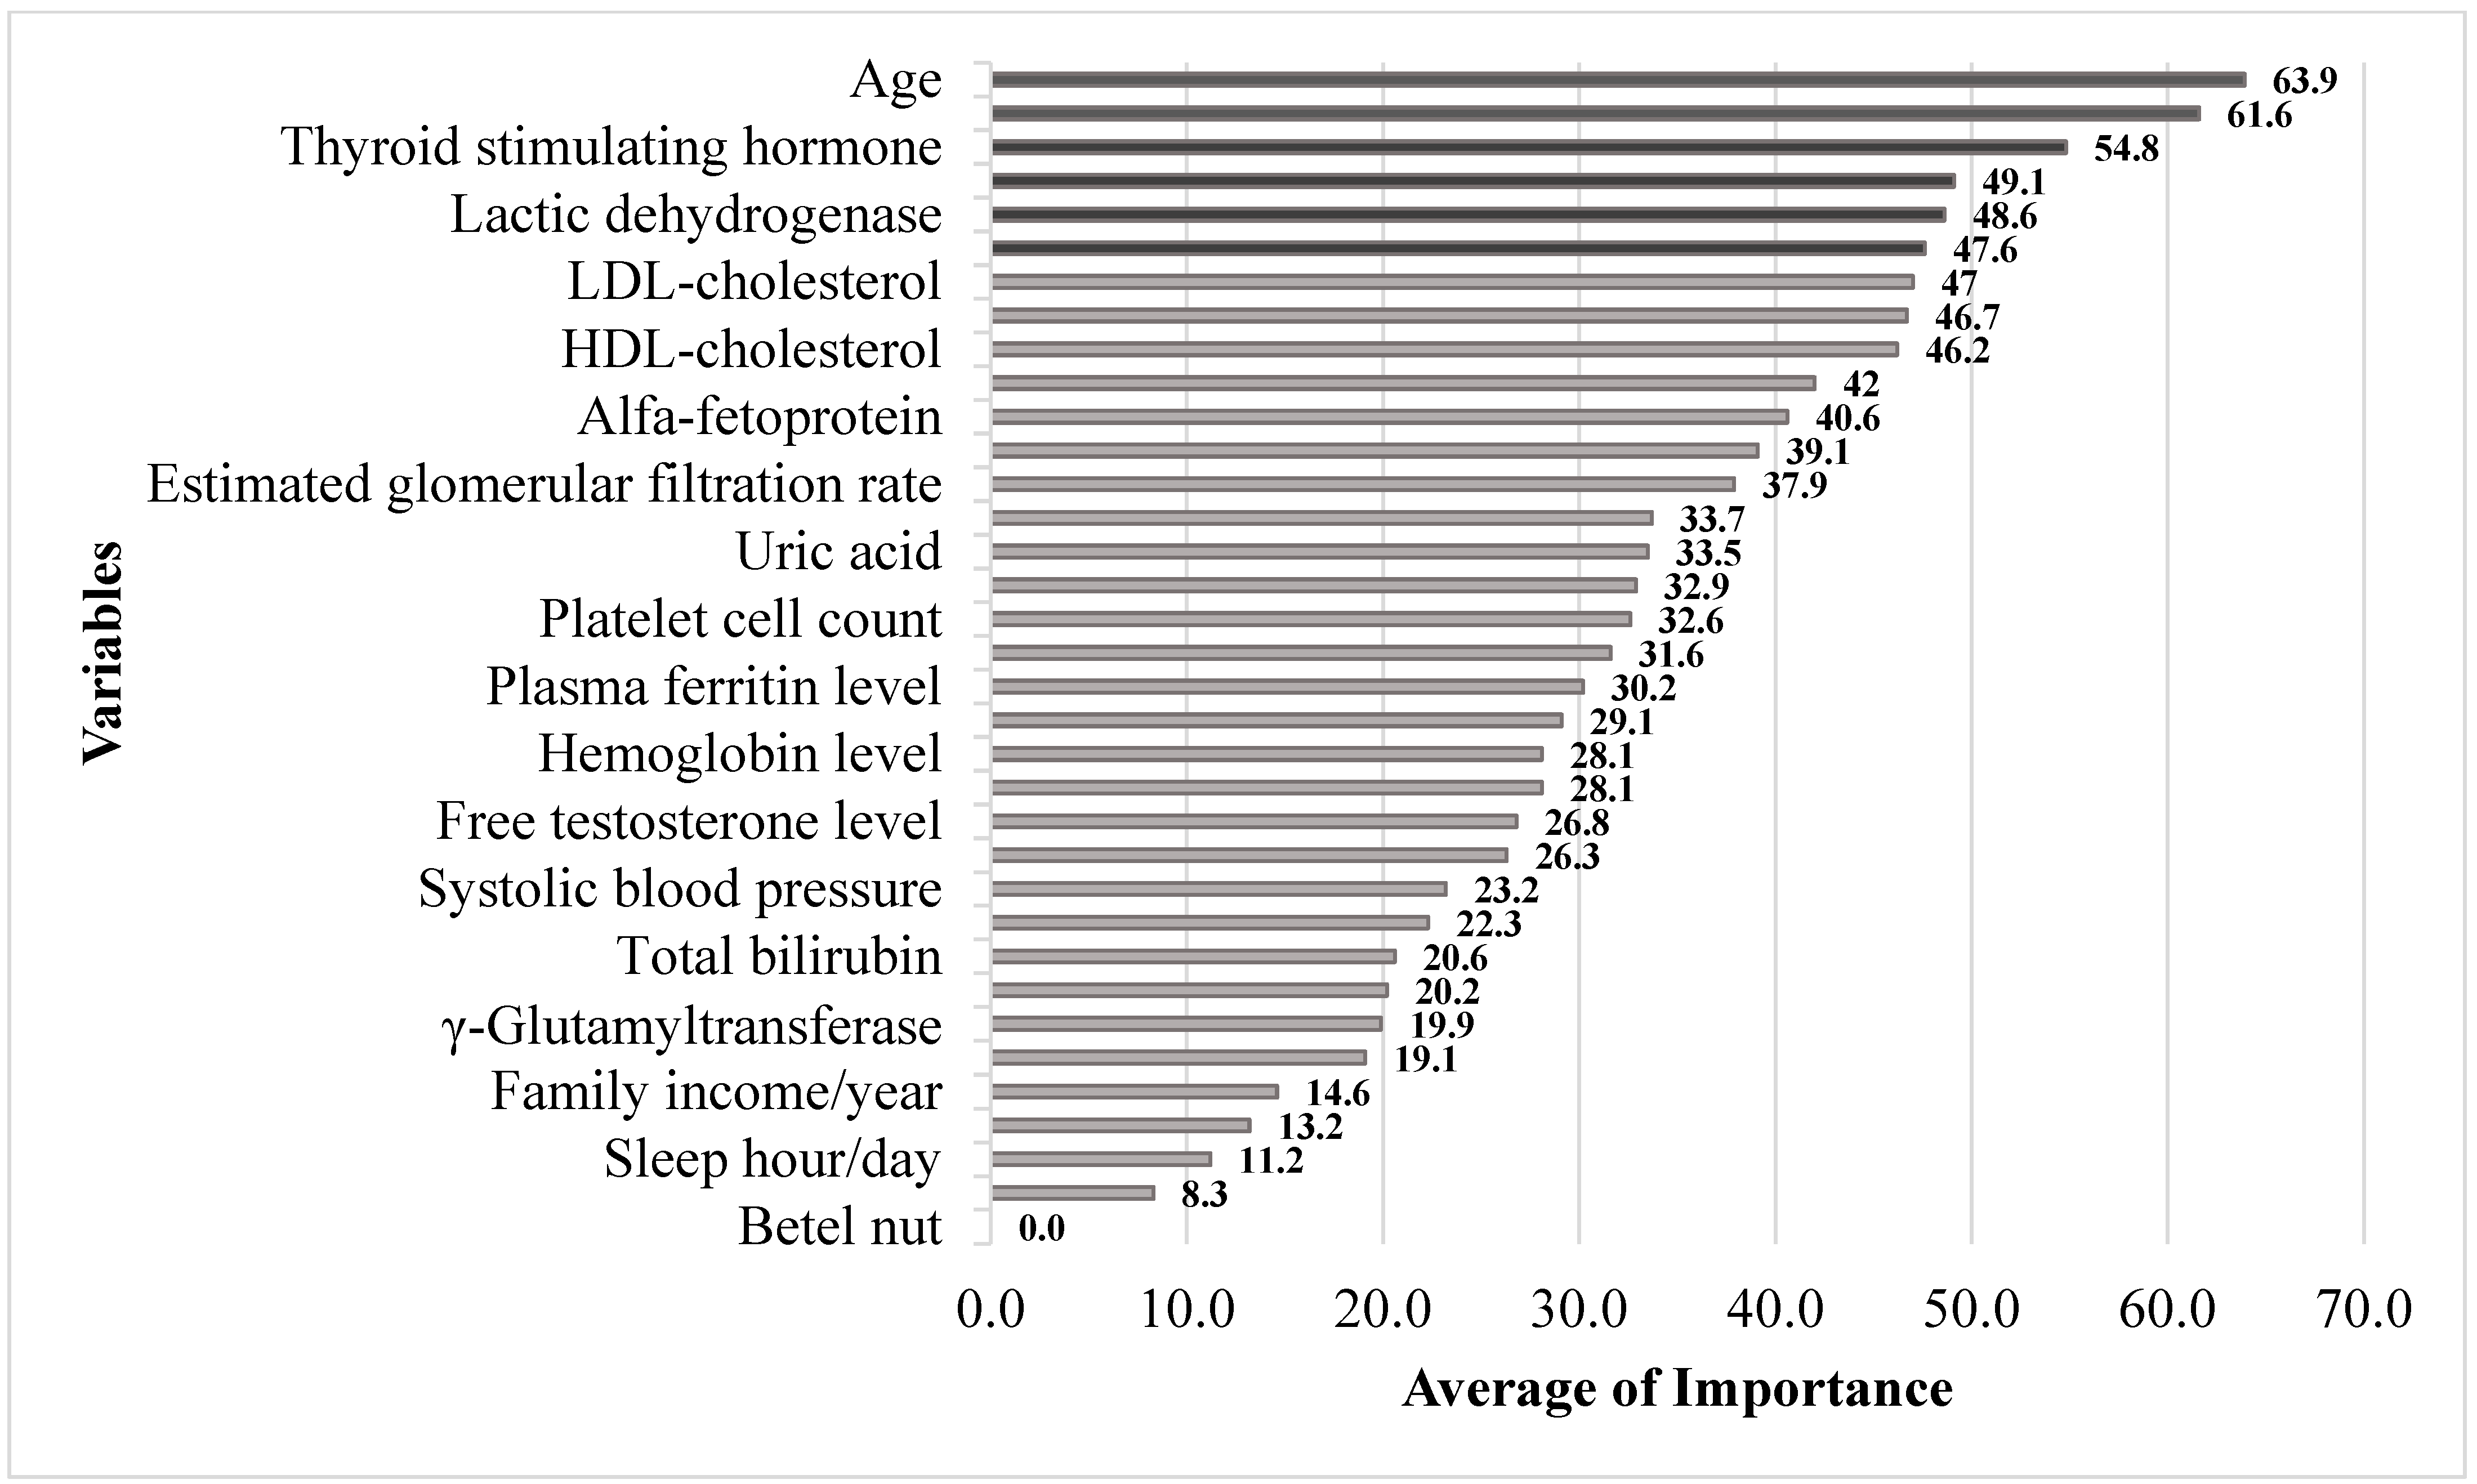
| Age | 77.7 | 100.0 | 100.0 | 51.2 | 4.6 | 63.9 | 1.0 |
| Plasma insulin level | 58.1 | 95.1 | 47.2 | 100.0 | 4.3 | 61.6 | 2.0 |
| Thyroid-stimulating hormone | 58.1 | 80.7 | 49.9 | 73.0 | 15.8 | 54.8 | 3.0 |
| Spouse status | 100.0 | 33.1 | 27.8 | 35.5 | 100.0 | 49.1 | 4.0 |
| Lactic dehydrogenase | 79.8 | 91.7 | 51.8 | 49.3 | 1.6 | 48.6 | 5.0 |
| Alkaline phosphatase | 41.0 | 89.4 | 25.7 | 75.2 | 0.0 | 47.6 | 6.0 |
| LDL-cholesterol | 0.9 | 91.0 | 30.9 | 66.1 | 0.0 | 47.0 | 7.0 |
| High-sensitivity CRP | 34.2 | 81.0 | 66.6 | 39.3 | 0.0 | 46.7 | 8.0 |
| HDL-cholesterol | 90.5 | 84.9 | 67.0 | 30.0 | 2.7 | 46.2 | 9.0 |
| Diastolic blood pressure | 27.4 | 78.4 | 36.2 | 52.5 | 0.7 | 42.0 | 10.0 |
| Alfa-fetoprotein | 61.0 | 84.1 | 34.4 | 33.0 | 10.9 | 40.6 | 11.0 |
| Glycated hemoglobin | 52.7 | 71.0 | 0.0 | 24.4 | 61.2 | 39.1 | 12.0 |
| Estimated glomerular filtration rate | 3.7 | 92.5 | 21.1 | 38.0 | 0.0 | 37.9 | 13.0 |
| FEV1 | 25.7 | 73.4 | 9.5 | 52.1 | 0.0 | 33.7 | 14.0 |
| Uric acid | 68.8 | 67.5 | 34.0 | 12.4 | 20.3 | 33.5 | 15.0 |
| White blood cell count | 21.5 | 73.0 | 15.5 | 43.1 | 0.0 | 32.9 | 16.0 |
| Platelet cell count | 25.9 | 73.2 | 35.8 | 21.4 | 0.0 | 32.6 | 17.0 |
| Glutamic oxaloacetic transaminase | 10.1 | 67.5 | 34.0 | 24.9 | 0.0 | 31.6 | 18.0 |
| Plasma ferritin level | 59.3 | 80.2 | 18.3 | 22.0 | 0.2 | 30.2 | 19.0 |
| Body fat percentage | 29.4 | 70.7 | 0.0 | 45.7 | 0.0 | 29.1 | 20.0 |
| Carcinoembryonic antigen | 22.0 | 68.1 | 0.0 | 44.5 | 0.0 | 28.1 | 21.0 |
| Hemoglobin level | 79.2 | 66.0 | 0.0 | 22.3 | 24.2 | 28.1 | 22.0 |
| Free-testosterone level | 49.7 | 66.9 | 9.4 | 28.9 | 2.1 | 26.8 | 23.0 |
| Triglyceride | 58.1 | 65.4 | 19.6 | 20.3 | 0.1 | 26.3 | 24.0 |
| Systolic blood pressure | 10.2 | 75.5 | 0.0 | 17.0 | 0.1 | 23.2 | 25.0 |
| Sport hours/day | 11.1 | 41.1 | 9.4 | 38.9 | 0.0 | 22.3 | 26.0 |
| Total bilirubin | 79.3 | 65.1 | 0.0 | 17.3 | 0.0 | 20.6 | 27.0 |
| Plasma phosphate level | 6.1 | 57.9 | 0.0 | 23.1 | 0.0 | 20.2 | 28.0 |
| γ-Glutamyltransferase | 30.2 | 61.9 | 0.0 | 17.8 | 0.0 | 19.9 | 29.0 |
| Glutamic pyruvic transaminase | 40.8 | 66.9 | 0.0 | 9.5 | 0.0 | 19.1 | 30.0 |
| Family income/year | 59.2 | 33.6 | 11.0 | 4.8 | 9.0 | 14.6 | 31.0 |
| Plasma calcium level | 11.9 | 44.2 | 0.0 | 8.8 | 0.0 | 13.2 | 32.0 |
| Sleep hours/day | 0.0 | 43.6 | 0.0 | 1.3 | 0.0 | 11.2 | 33.0 |
| Education level | 21.5 | 26.5 | 0.0 | 0.0 | 6.7 | 8.3 | 34.0 |
| Betel nut | 0.0 | 0.0 | 0.0 | 0.0 | 0.0 | 0.0 | 35.0 |
Disclaimer/Publisher’s Note: The statements, opinions and data contained in all publications are solely those of the individual author(s) and contributor(s) and not of MDPI and/or the editor(s). MDPI and/or the editor(s) disclaim responsibility for any injury to people or property resulting from any ideas, methods, instructions or products referred to in the content. |
© 2023 by the authors. Licensee MDPI, Basel, Switzerland. This article is an open access article distributed under the terms and conditions of the Creative Commons Attribution (CC BY) license (https://creativecommons.org/licenses/by/4.0/).
Share and Cite
Wang, C.-K.; Chang, C.-Y.; Chu, T.-W.; Liang, Y.-J. Using Machine Learning to Identify the Relationships between Demographic, Biochemical, and Lifestyle Parameters and Plasma Vitamin D Concentration in Healthy Premenopausal Chinese Women. Life 2023, 13, 2257. https://doi.org/10.3390/life13122257
Wang C-K, Chang C-Y, Chu T-W, Liang Y-J. Using Machine Learning to Identify the Relationships between Demographic, Biochemical, and Lifestyle Parameters and Plasma Vitamin D Concentration in Healthy Premenopausal Chinese Women. Life. 2023; 13(12):2257. https://doi.org/10.3390/life13122257
Chicago/Turabian StyleWang, Chun-Kai, Ching-Yao Chang, Ta-Wei Chu, and Yao-Jen Liang. 2023. "Using Machine Learning to Identify the Relationships between Demographic, Biochemical, and Lifestyle Parameters and Plasma Vitamin D Concentration in Healthy Premenopausal Chinese Women" Life 13, no. 12: 2257. https://doi.org/10.3390/life13122257
APA StyleWang, C.-K., Chang, C.-Y., Chu, T.-W., & Liang, Y.-J. (2023). Using Machine Learning to Identify the Relationships between Demographic, Biochemical, and Lifestyle Parameters and Plasma Vitamin D Concentration in Healthy Premenopausal Chinese Women. Life, 13(12), 2257. https://doi.org/10.3390/life13122257