
Hypothalamic A11 Nuclei Regulate the Circadian Rhythm of Spinal Mechanonociception through Dopamine Receptors and Clock Gene Expression

 ,
,  , , , and
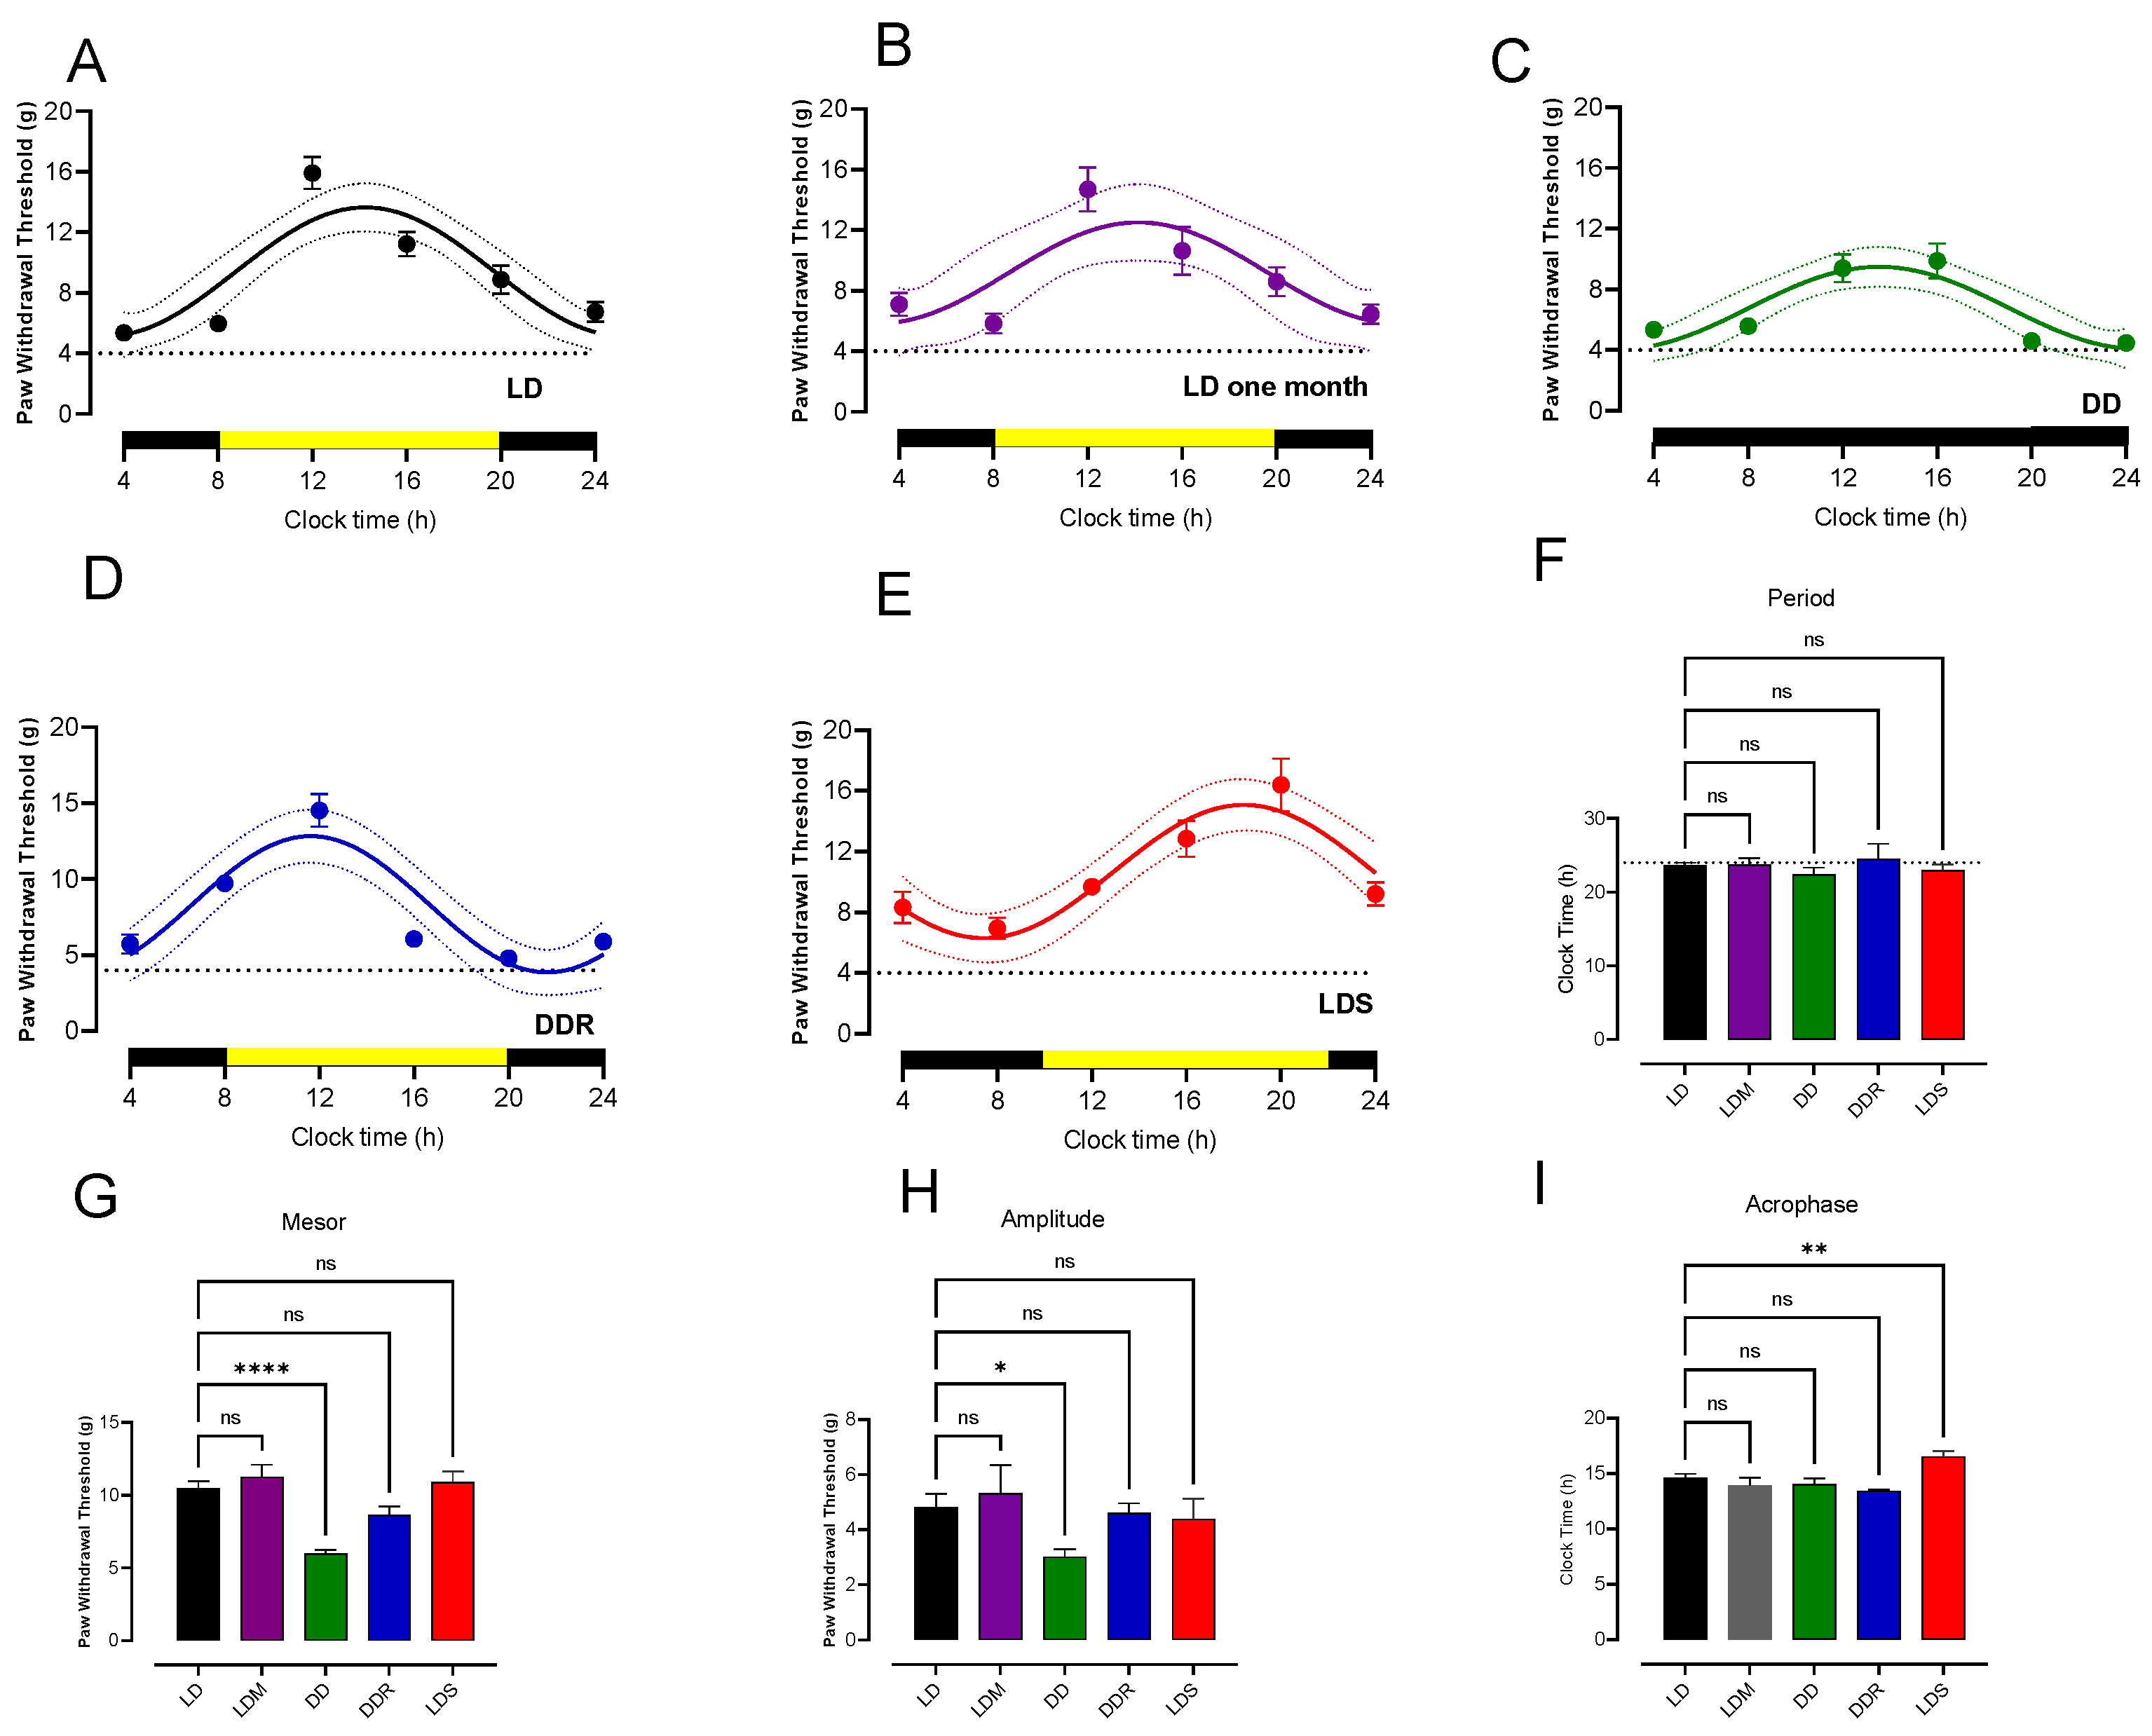
Abstract
:1. Introduction
2. Materials and Methods
2.1. Animals
2.2. Experimental Groups and PWT Measurement
2.3. Determination of DA Content in the Lumbar Spinal Cord of Rats
2.4. Determination of TH in the A11 Nucleus
2.5. Retrotranscription
2.6. Real-Time PCR Assay
2.7. Drugs
2.8. Circadian Analysis
2.9. Statistical Analysis
3. Results
3.1. Circadian Rhythmicity of Paw Withdrawal Threshold
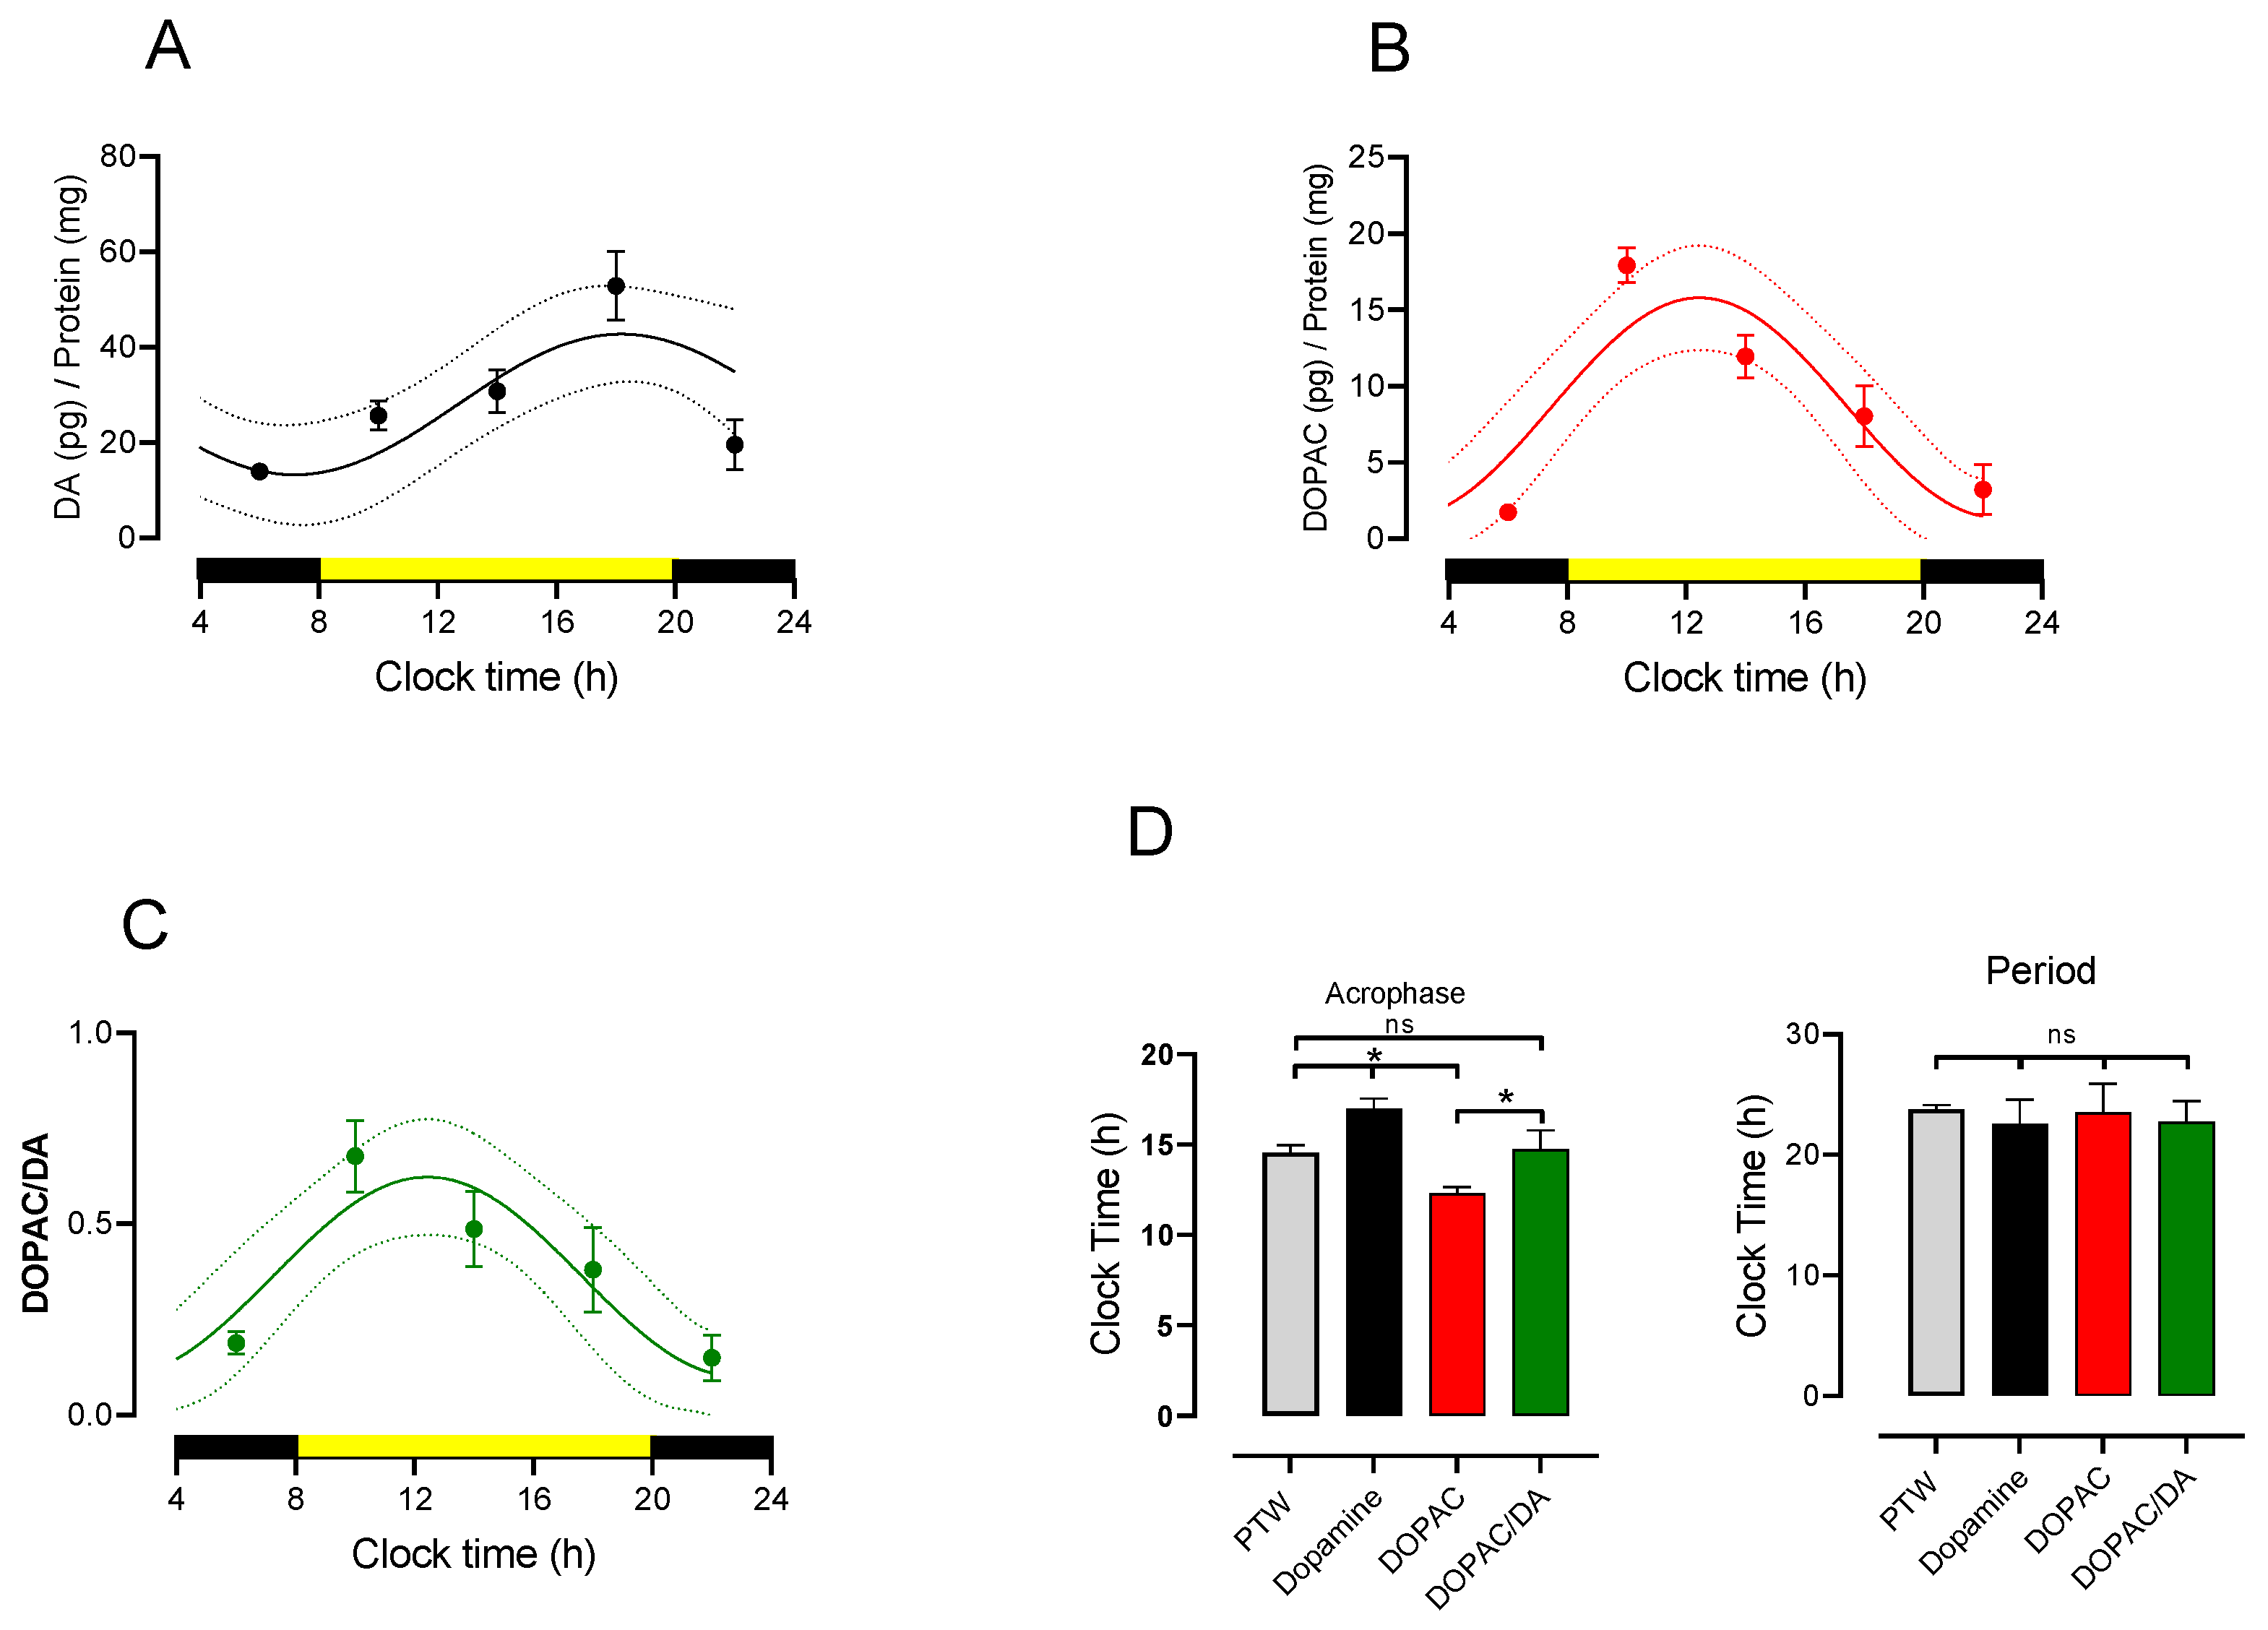
3.2. Circadian Rhythmicity of Lumbar DA and DOPAC Content and Turnover
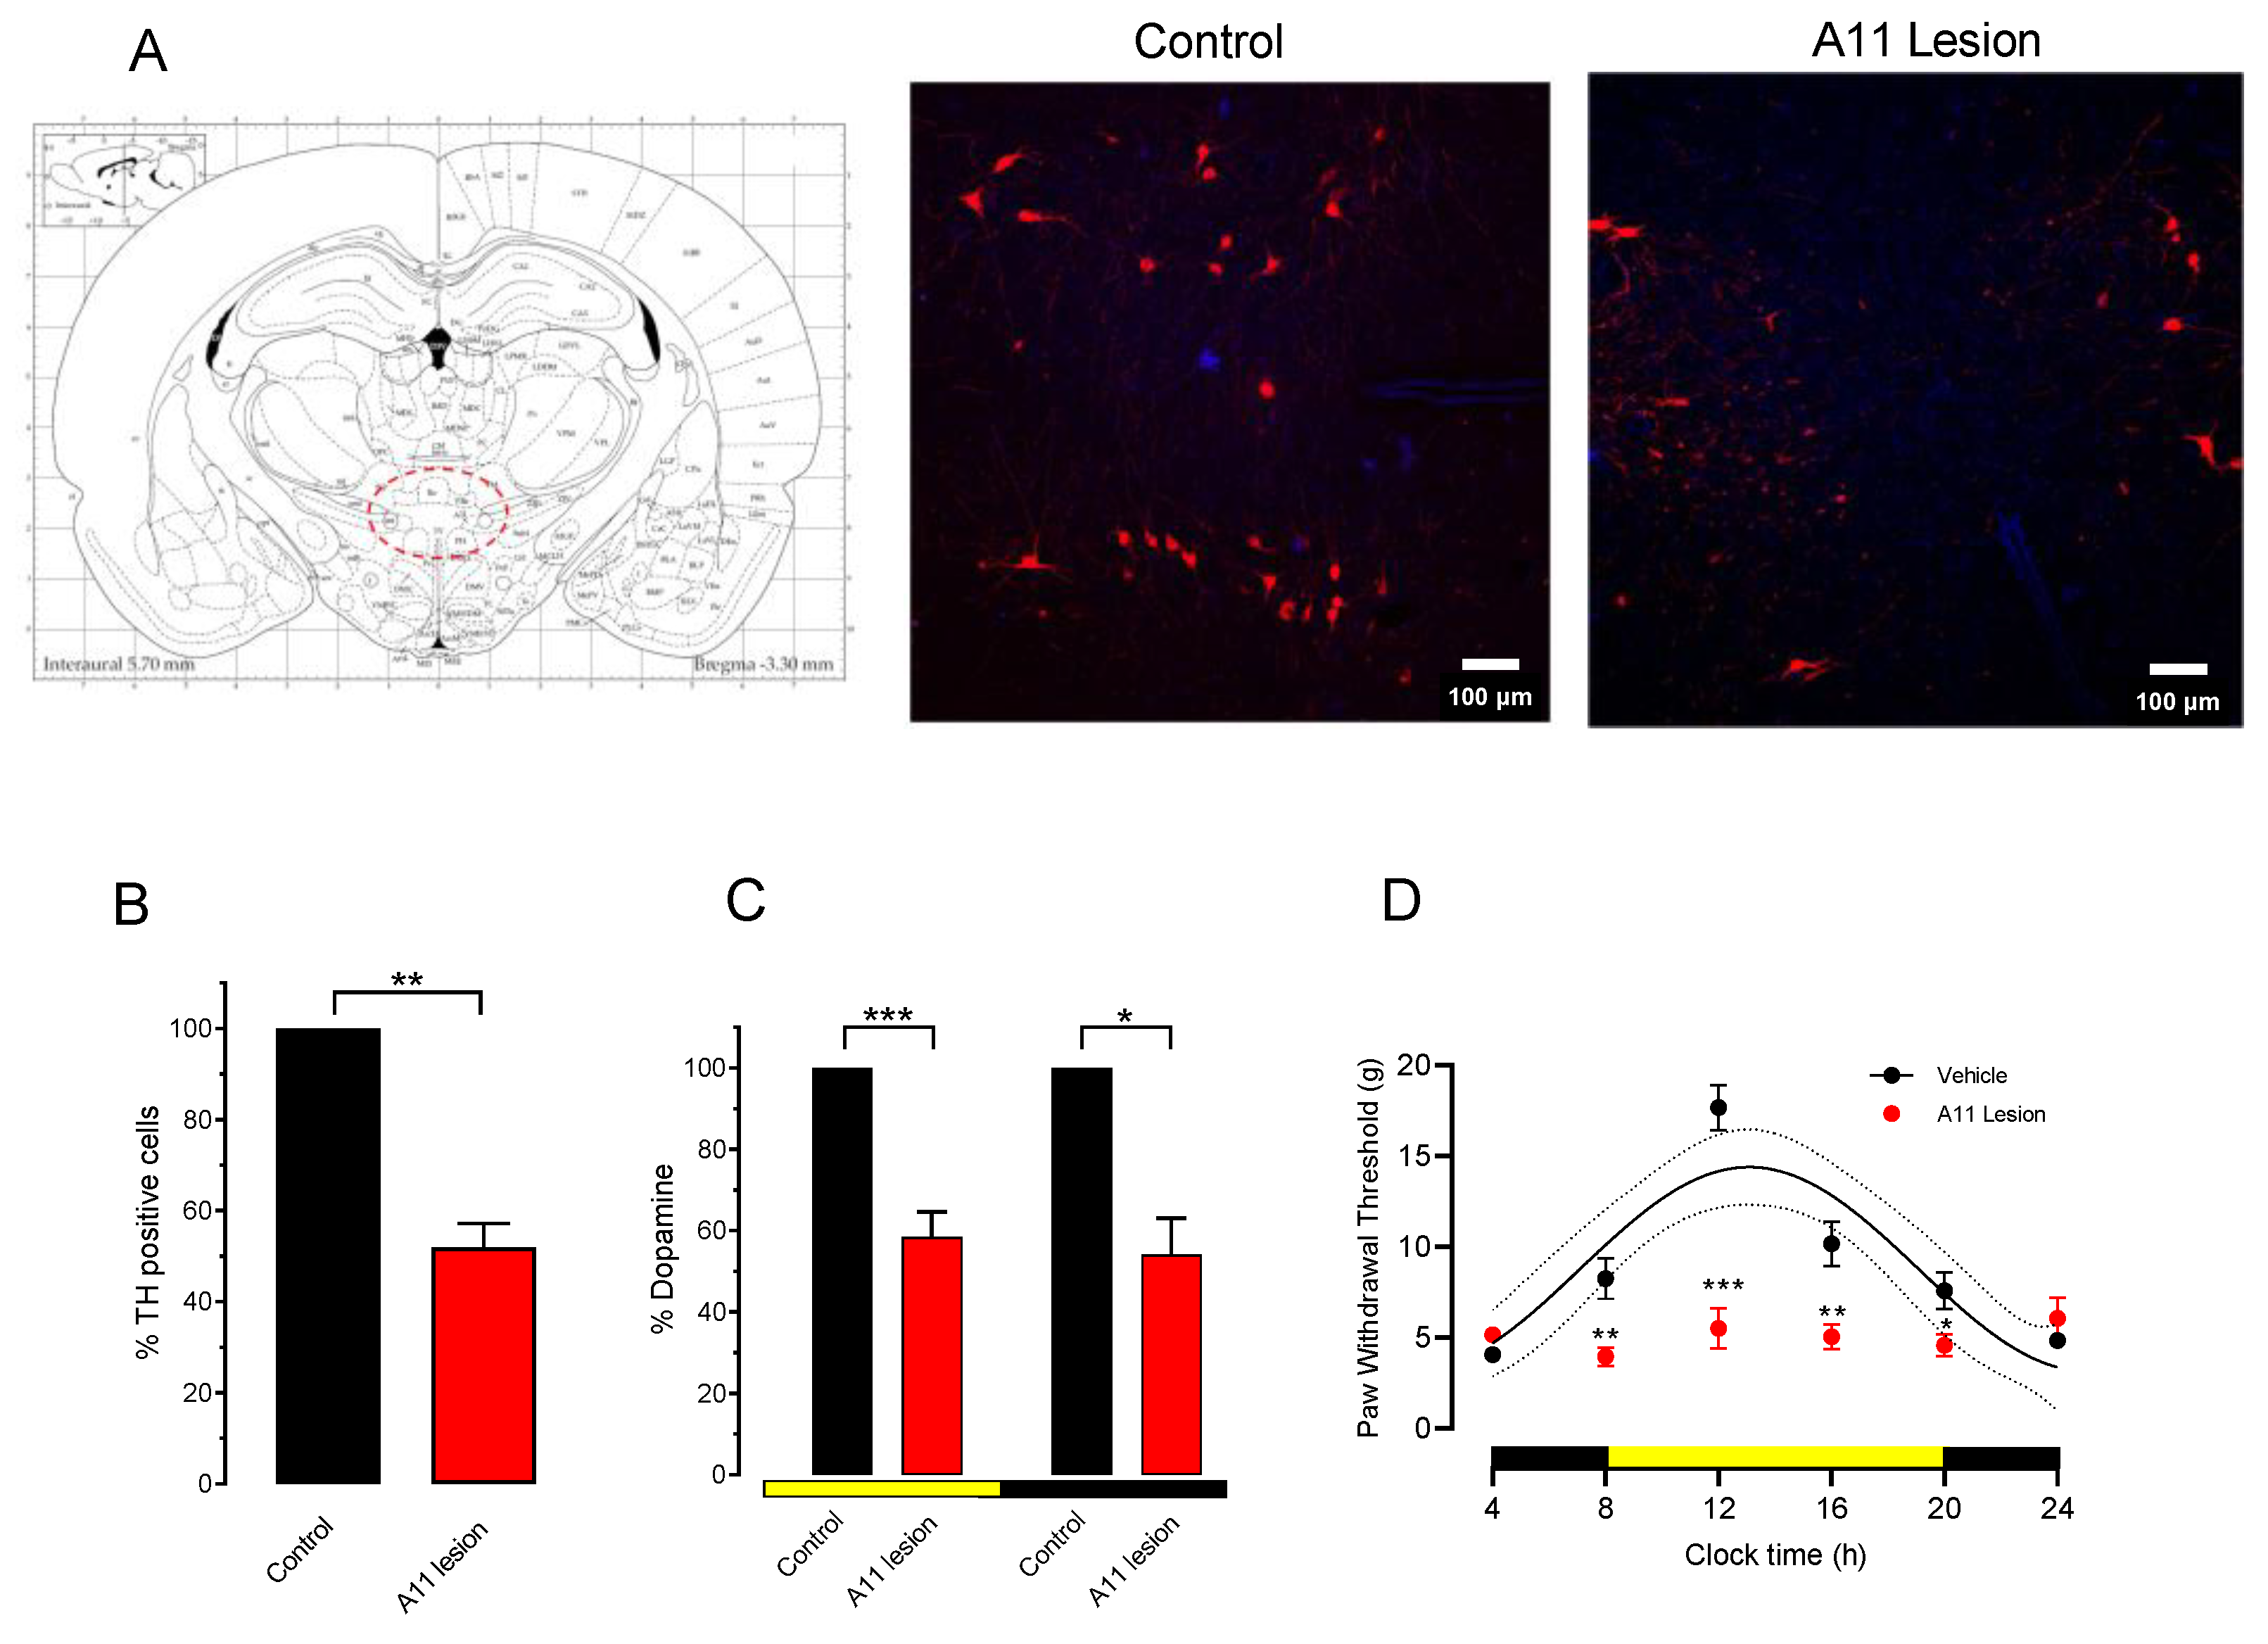
3.3. Effect of 6-OHDA Lesion of A11 on Paw Withdrawal Threshold
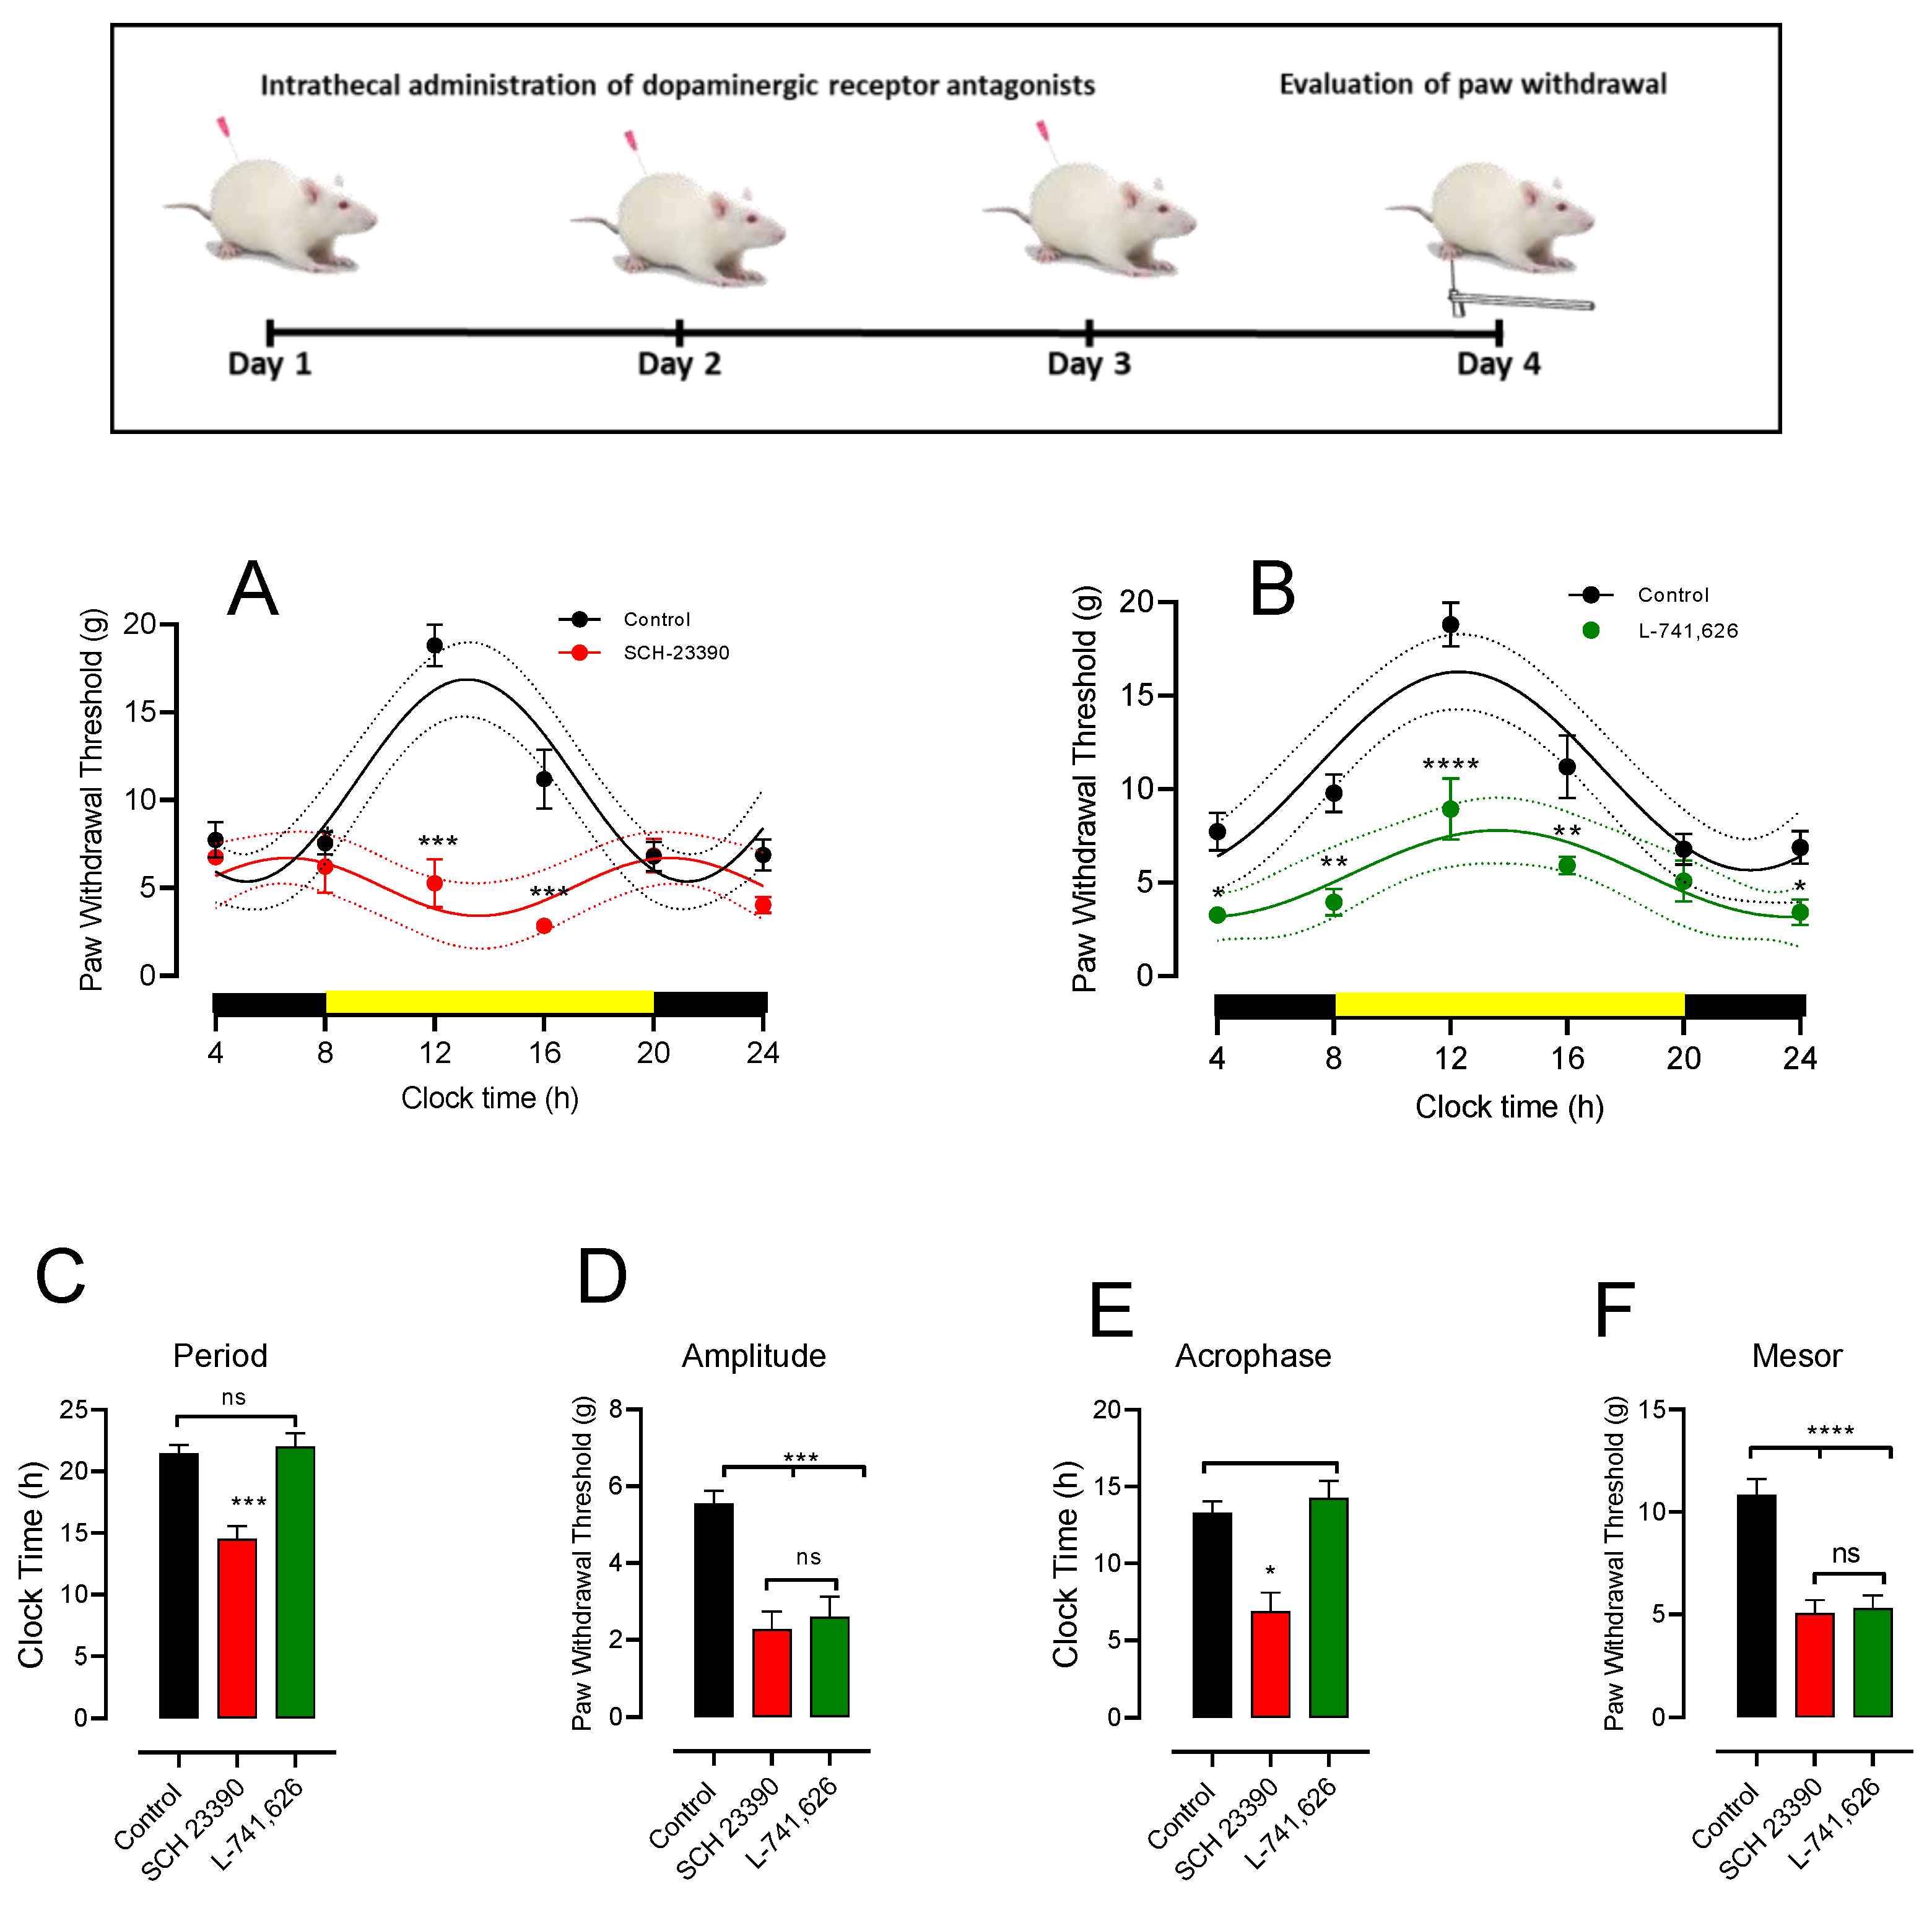
3.4. Intrathecal DA Receptor Antagonist Changes PWT Rhythmicity
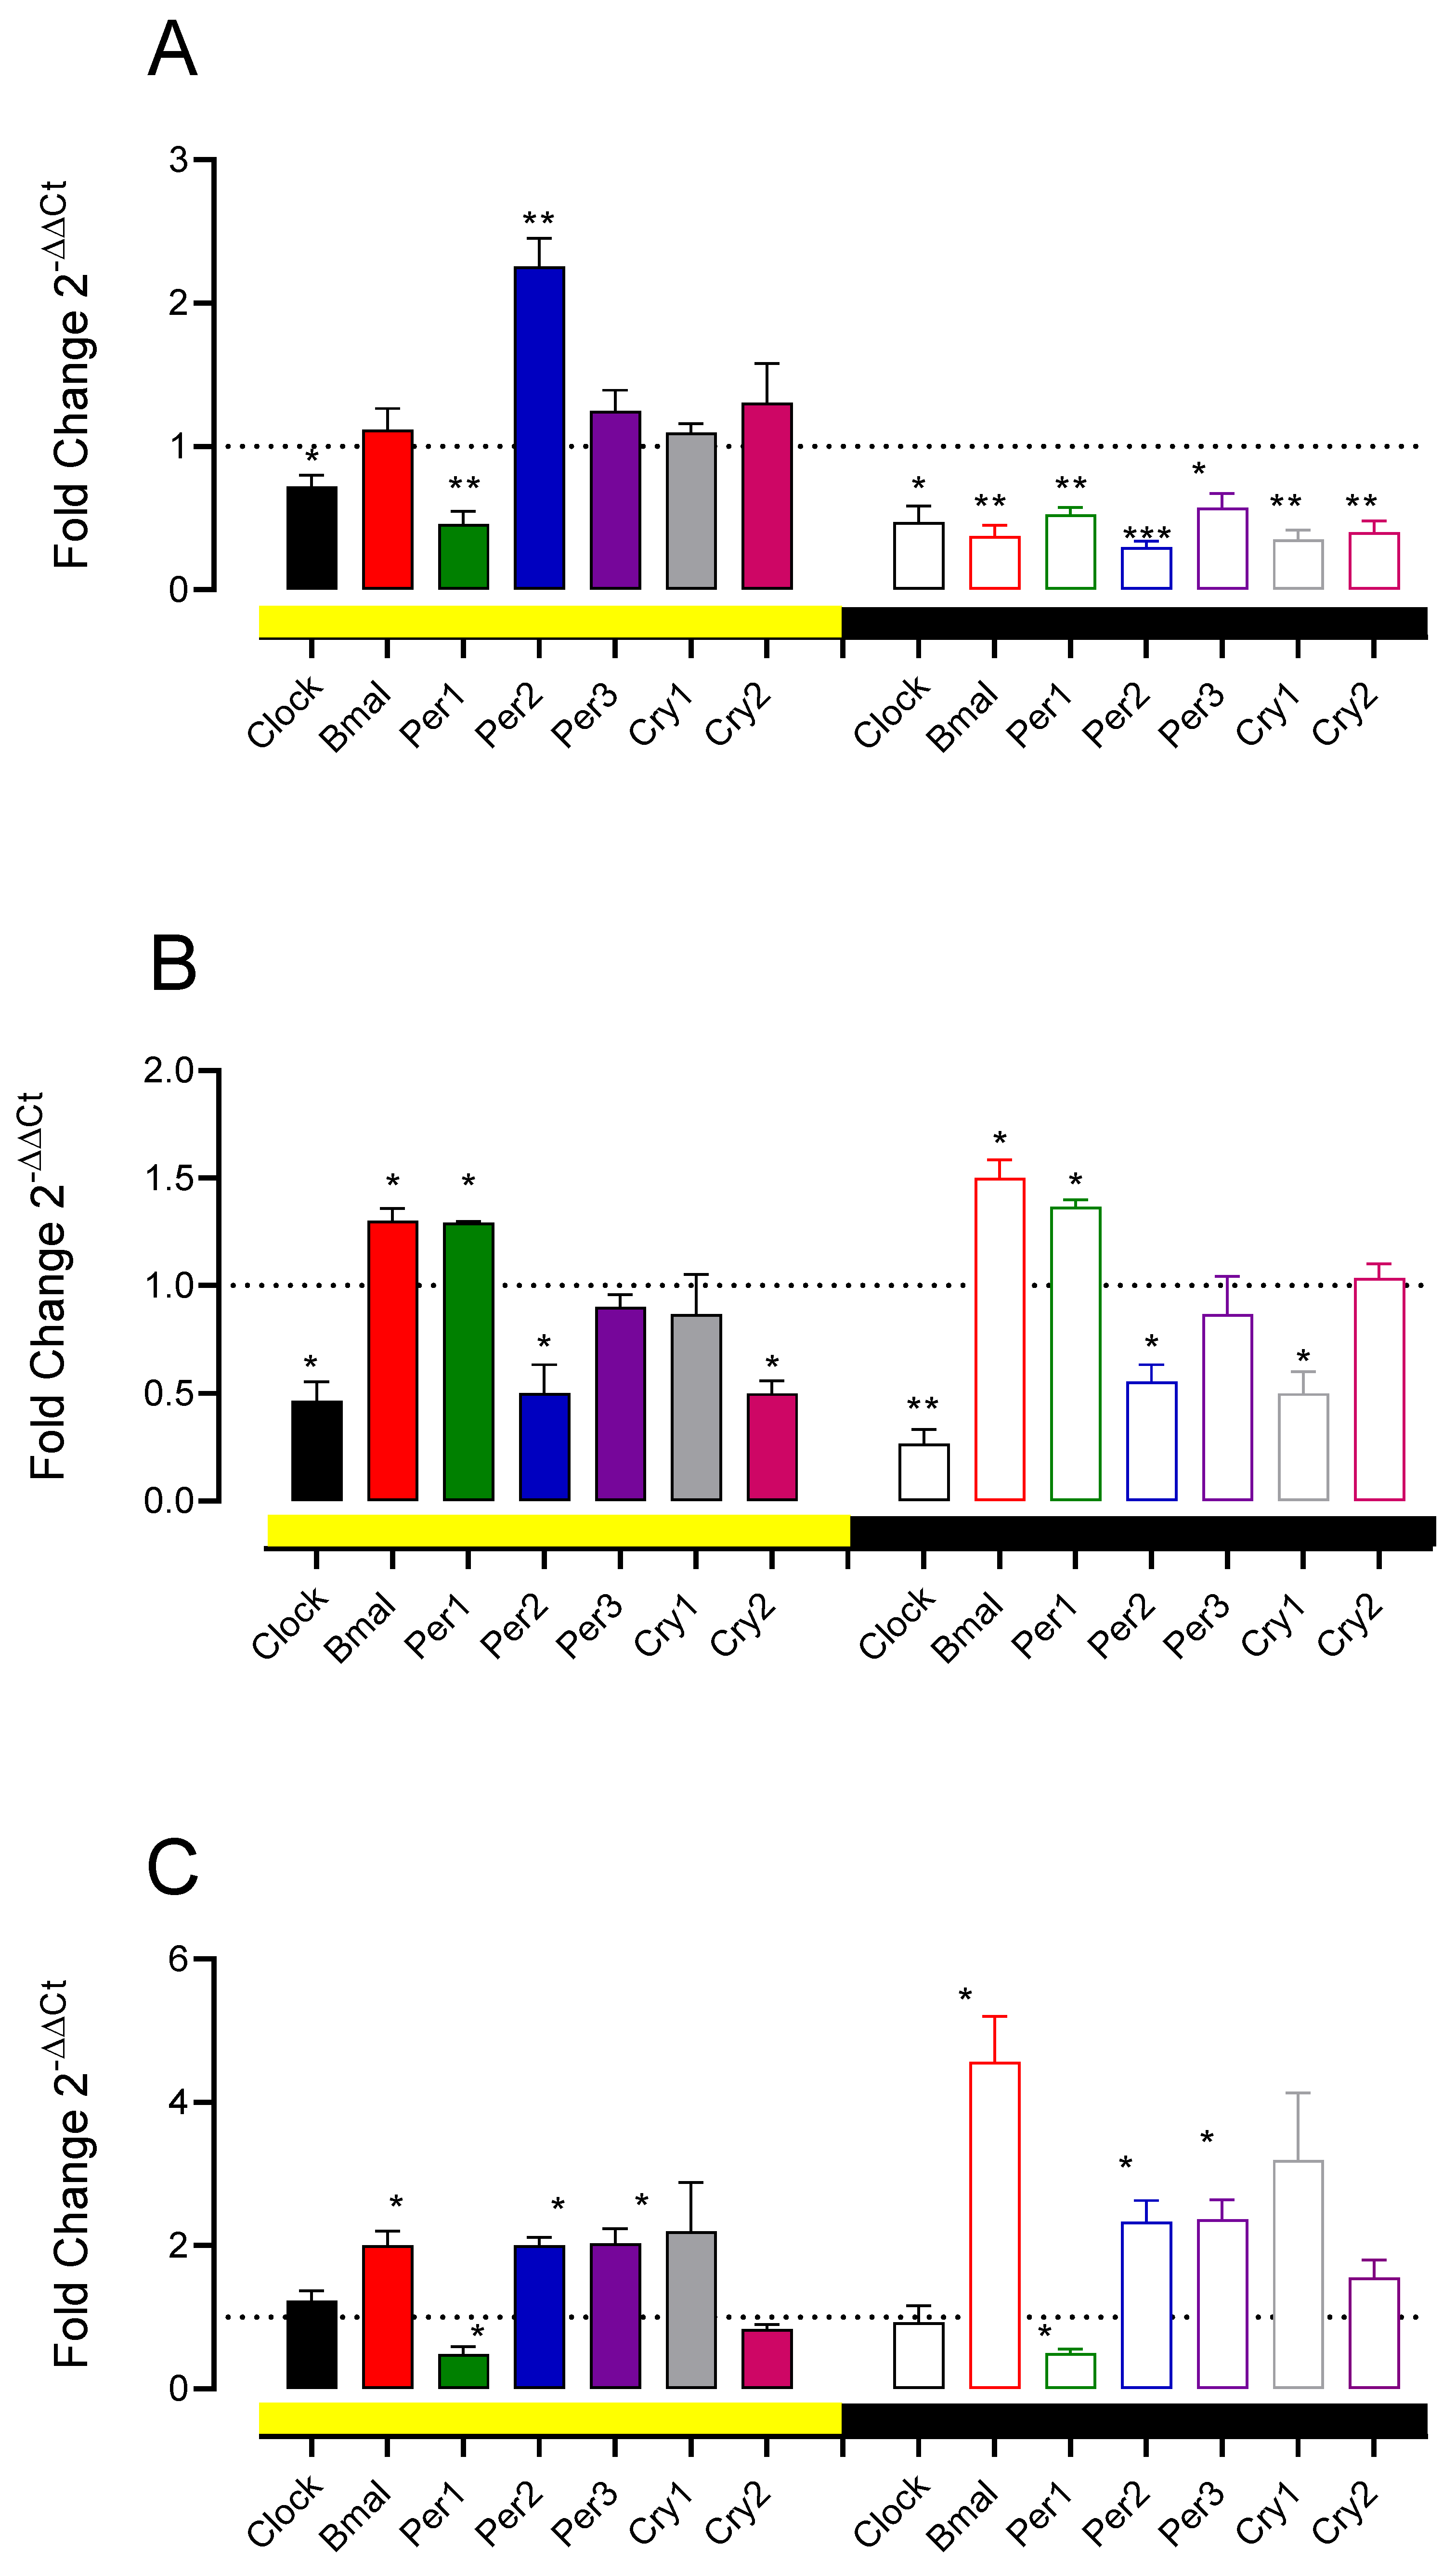
3.5. A11 Lesions and D1-like and D2 Receptor Antagonist Change Spinal Cord Clock Gene Expression
4. Discussion
4.1. Rhythmicity of PWT in Normal Rats
4.2. Dopaminergic Dependence of PWT Rhythms and Their Threshold
4.3. Role of D1-like and D2 Receptors on PWT Values and Its Rhythmicity
5. Conclusions
Author Contributions
Funding
Institutional Review Board Statement
Informed Consent Statement
Data Availability Statement
Acknowledgments
Conflicts of Interest
References
- Morioka, N.; Saeki, M.; Sugimoto, T.; Higuchi, T.; Zhang, F.F.; Nakamura, Y.; Hisaoka-Nakashima, K.; Nakata, Y. Downregulation of the spinal dorsal horn clock gene Per1 expression leads to mechanical hypersensitivity via c-jun N-terminal kinase and CCL2 production in mice. Mol. Cell. Neurosci. 2016, 72, 72–83. [Google Scholar] [CrossRef]
- Gaudet, A.D.; Fonken, L.K.; Ayala, M.T.; Bateman, E.M.; Schleicher, W.E.; Smith, E.J.; D’Angelo, H.M.; Maier, S.F.; Watkins, L.R. Spinal Cord Injury in Rats Disrupts the Circadian System. eNeuro 2018, 5, ENEURO.0328-18.2018. [Google Scholar] [CrossRef]
- Frederickson, R.C.A.; Burgis, V.; Edwards, J.D. Hyperalgesia Induced by Naloxone Follows Diurnal Rhythm in Responsivity to Painful Stimuli. Science 1977, 198, 756–758. [Google Scholar] [CrossRef]
- Castellano, C.; Puglisi-Allegra, S.; Renzi, P.; Oliverio, A. Genetic differences in daily rhythms of pain sensitivity in mice. Pharmacol. Biochem. Behav. 1985, 23, 91–92. [Google Scholar] [CrossRef]
- Brewer, K.L.; Baran, C.A.; Whitfield, B.R.; Jensen, A.M.; Clemens, S. Dopamine D3 receptor dysfunction prevents anti-nociceptive effects of morphine in the spinal cord. Front. Neural Circuits 2014, 8, 62. [Google Scholar] [CrossRef]
- Imbesi, M.; Yildiz, S.; Arslan, A.D.; Sharma, R.; Manev, H.; Uz, T. Dopamine receptor-mediated regulation of neuronal “clock” gene expression. Neuroscience 2009, 158, 537–544. [Google Scholar] [CrossRef]
- Hood, S.; Cassidy, P.; Cossette, M.-P.; Weigl, Y.; Verwey, M.; Robinson, B.; Stewart, J.; Amir, S. Endogenous Dopamine Regulates the Rhythm of Expression of the Clock Protein PER2 in the Rat Dorsal Striatum via Daily Activation of D2 Dopamine Receptors. J. Neurosci. 2010, 30, 14046–14058. [Google Scholar] [CrossRef]
- Yujnovsky, I.; Hirayama, J.; Doi, M.; Borrelli, E.; Sassone-Corsi, P. Signaling mediated by the dopamine D2 receptor potentiates circadian regulation by CLOCK:BMAL1. Proc. Natl. Acad. Sci. USA 2006, 103, 6386–6391. [Google Scholar] [CrossRef]
- Pozdeyev, N.; Tosini, G.; Li, L.; Ali, F.; Rozov, S.; Lee, R.H.; Iuvone, P.M. Dopamine modulates diurnal and circadian rhythms of protein phosphorylation in photoreceptor cells of mouse retina. Eur. J. Neurosci. 2008, 27, 2691–2700. [Google Scholar] [CrossRef]
- Verwey, M.; Dhir, S.; Amir, S. Circadian influences on dopamine circuits of the brain: Regulation of striatal rhythms of clock gene expression and implications for psychopathology and disease. F1000Research 2016, 5, 2062. [Google Scholar] [CrossRef]
- Puopolo, M. The hypothalamic-spinal dopaminergic system: A target for pain modulation. Neural Regen. Res. 2019, 14, 925–930. [Google Scholar] [CrossRef] [PubMed]
- Pappas, S.S.; Behrouz, B.; Janis, K.L.; Goudreau, J.L.; Lookingland, K.J. Lack of D2 receptor mediated regulation of dopamine synthesis in A11 diencephalospinal neurons in male and female mice. Brain Res. 2008, 1214, 1–10. [Google Scholar] [CrossRef] [PubMed]
- Barraud, Q.; Obeid, I.; Aubert, I.; Barrière, G.; Contamin, H.; McGuire, S.; Ravenscroft, P.; Porras, G.; Tison, F.; Bézard, E.; et al. Neuroanatomical Study of the A11 Diencephalospinal Pathway in the Non-Human Primate. PLoS ONE 2010, 5, e13306. [Google Scholar] [CrossRef]
- Charbit, A.R.; Akerman, S.; Holland, P.; Goadsby, P.J. Neurons of the Dopaminergic/Calcitonin Gene-Related Peptide A11 Cell Group Modulate Neuronal Firing in the Trigeminocervical Complex: An Electrophysiological and Immunohistochemical Study. J. Neurosci. 2009, 29, 12532–12541. [Google Scholar] [CrossRef]
- Koblinger, K.; Fuzesi, T.; Ejdrygiewicz, J.; Krajacic, A.; Bains, J.S.; Whelan, P.J. Characterization of A11 Neurons Projecting to the Spinal Cord of Mice. PLoS ONE 2014, 9, e109636. [Google Scholar] [CrossRef] [PubMed]
- Taniguchi, W.; Nakatsuka, T.; Miyazaki, N.; Yamada, H.; Takeda, D.; Fujita, T.; Kumamoto, E.; Yoshida, M. In vivo patch-clamp analysis of dopaminergic antinociceptive actions on substantia gelatinosa neurons in the spinal cord. Pain 2011, 152, 95–105. [Google Scholar] [CrossRef] [PubMed]
- Zhu, H.; Clemens, S.; Sawchuk, M.; Hochman, S. Expression and distribution of all dopamine receptor subtypes (D1–D5) in the mouse lumbar spinal cord: A real-time polymerase chain reaction and non-autoradiographic in situ hybridization study. Neuroscience 2007, 149, 885–897. [Google Scholar] [CrossRef]
- Ozawa, H.; Yamaguchi, T.; Hamaguchi, S.; Yamaguchi, S.; Ueda, S. Three Types of A11 Neurons Project to the Rat Spinal Cord. Neurochem. Res. 2017, 42, 2142–2153. [Google Scholar] [CrossRef]
- Fleetwood-Walker, S.M.; Hope, P.J.; Mitchell, R. Antinociceptive actions of descending dopaminergic tracts on cat and rat dorsal horn somatosensory neurones. J. Physiol. 1988, 399, 335–348. [Google Scholar] [CrossRef]
- Kim, R.; Reed, M.C. A mathematical model of circadian rhythms and dopamine. Theor. Biol. Med Model. 2021, 18, 8. [Google Scholar] [CrossRef]
- Li, C.; Liu, S.; Lu, X.; Tao, F. Role of Descending Dopaminergic Pathways in Pain Modulation. Curr. Neuropharmacol. 2019, 17, 1176–1182. [Google Scholar] [CrossRef] [PubMed]
- Clemens, S.; Sawchuk, M.; Hochman, S. Reversal of the circadian expression of tyrosine-hydroxylase but not nitric oxide synthase levels in the spinal cord of dopamine D3 receptor knockout mice. Neuroscience 2005, 133, 353–357. [Google Scholar] [CrossRef] [PubMed]
- Cahill, A.L.; Ehret, C.F. Circadian Variations in the Activity of Tyrosine Hydroxylase, Tyrosine Aminotransferase, and Tryptophan Hydroxylase: Relationship to Catecholamine Metabolism. J. Neurochem. 1981, 37, 1109–1115. [Google Scholar] [CrossRef] [PubMed]
- Jiménez-Zárate, B.S.; Piña-Leyva, C.; Rodríguez-Sánchez, M.; Florán-Garduño, B.; Jiménez-Zamudio, L.A.; Jiménez-Estrada, I. Day-Night Variations in the Concentration of Neurotransmitters in the Rat Lumbar Spinal Cord. J. Circadian Rhythm. 2021, 19, 9. [Google Scholar] [CrossRef]
- Chaplan, S.R.; Bach, F.W.; Pogrel, J.W.; Chung, J.M.; Yaksh, T.L. Quantitative assessment of tactile allodynia in the rat paw. J. Neurosci. Methods 1994, 53, 55–63. [Google Scholar] [CrossRef]
- Bonin, R.P.; Bories, C.; De Koninck, Y. A Simplified Up-Down Method (SUDO) for Measuring Mechanical Nociception in Rodents Using von Frey Filaments. Mol. Pain 2014, 10, 26. [Google Scholar] [CrossRef]
- Lolignier, S.; Eijkelkamp, N.; Wood, J.N. Mechanical allodynia. Pflugers Arch. 2015, 467, 133–139. [Google Scholar] [CrossRef]
- Paxinos, G.; Watson, C. The Rat Brain in Stereotaxic Coordinates: Hard Cover Edition; Elsevier: Amsterdam, The Netherlands, 2006. [Google Scholar]
- Slattery, D.; Hudson, A.; Nutt, D. Invited review: The evolution of antidepressant mechanisms. Fundam. Clin. Pharmacol. 2004, 18, 1–21. [Google Scholar] [CrossRef]
- Zimmermann, M. Ethical guidelines for investigations of experimental pain in conscious animals. Pain 1983, 16, 109–110. [Google Scholar] [CrossRef]
- Niklaus, S.; Albertini, S.; Schnitzer, T.K.; Denk, N. Challenging a Myth and Misconception: Red-Light Vision in Rats. Animals 2020, 10, 422. [Google Scholar] [CrossRef] [Green Version]
- Quiróz-González, S.; Escartín-Pérez, R.E.; Paz-Bermudez, F.; Segura-Alegría, B.; Reyes-Legorreta, C.; Guadarrama-Olmos, J.C.; Florán-Garduño, B.; Jiménez-Estrada, I. Endogenous Content and Release of [3H]-GABA and [3H]-Glutamate in the Spinal Cord of Chronically Undernourished Rat. Neurochem. Res. 2013, 38, 23–31. [Google Scholar] [CrossRef]
- Rodríguez-Sánchez, M.; Escartín-Pérez, R.E.; Leyva-Gómez, G.; Avalos-Fuentes, J.A.; Paz-Bermúdez, F.J.; Loya-López, S.I.; Aceves, J.; Erlij, D.; Cortés, H.; Florán, B. Blockade of Intranigral and Systemic D3 Receptors Stimulates Motor Activity in the Rat Promoting a Reciprocal Interaction among Glutamate, Dopamine, and GABA. Biomolecules 2019, 9, 511. [Google Scholar] [CrossRef]
- Livak, K.J.; Schmittgen, T.D. Analysis of relative gene expression data using real-time quantitative PCR and the 2(−Delta Delta C(T)) Method. Methods 2001, 25, 402–408. [Google Scholar] [CrossRef]
- Mestre, C.; Pélissier, T.; Fialip, J.; Wilcox, G.; Eschalier, A. A method to perform direct transcutaneous intrathecal injection in rats. J. Pharmacol. Toxicol. Methods 1994, 32, 197–200. [Google Scholar] [CrossRef]
- Paul, T.; Lemmer, B. Disturbance of Circadian Rhythms in Analgosedated Intensive Care Unit Patients with and without Craniocerebral Injury. Chronobiol. Int. 2007, 24, 45–61. [Google Scholar] [CrossRef]
- Rodríguez-Sosa, L.; Calderón-Rosete, G.; Calvillo, M.E.; Guevara, J.; Flores, G. Dopaminergic modulation of the caudal photoreceptor in crayfish. Synapse 2011, 65, 497–504. [Google Scholar] [CrossRef]
- Vitaterna, M.H.; Takahashi, J.S.; Turek, F.W. Overview of Circadian Rhythms. Alcohol Res. Health J. Natl. Inst. Alcohol Abus. Alcohol. 2001, 25, 85–93. [Google Scholar]
- Kwon, I.; Choe, H.K.; Son, G.H.; Kim, K. Mammalian Molecular Clocks. Exp. Neurobiol. 2011, 20, 18–28. [Google Scholar] [CrossRef] [PubMed]
- Meijer, J.; Watanabe, K.; Détàri, L.; Schaap, J. Circadian rhythm in light response in suprachiasmatic nucleus neurons of freely moving rats. Brain Res. 1996, 741, 352–355. [Google Scholar] [CrossRef]
- Granados-Fuentes, D.; Prolo, L.M.; Abraham, U.; Herzog, E. The Suprachiasmatic Nucleus Entrains, But Does Not Sustain, Circadian Rhythmicity in the Olfactory Bulb. J. Neurosci. 2004, 24, 615–619. [Google Scholar] [CrossRef]
- Kubynin, A.N.; Ignatov Iu, D. Study of chronobiological parameters of pain sensitivity in rats and mice. Biull. Eksp. Biol. Med. 1995, 119, 537–540. [Google Scholar] [CrossRef] [PubMed]
- Rosenfeld, J.P.; Rice, P.E. Diurnal rhythms in nociceptive thresholds of rats. Physiol. Behav. 1979, 23, 419–420. [Google Scholar] [CrossRef]
- Kusunose, N.; Koyanagi, S.; Hamamura, K.; Matsunaga, N.; Yoshida, M.; Uchida, T.; Tsuda, M.; Inoue, K.; Ohdo, S. Molecular Basis for the Dosing Time-Dependency of Anti-Allodynic Effects of Gabapentin in a Mouse Model of Neuropathic Pain. Mol. Pain 2010, 6, 83. [Google Scholar] [CrossRef] [PubMed]
- Koyanagi, S.; Kusunose, N.; Taniguchi, M.; Akamine, T.; Kanado, Y.; Ozono, Y.; Masuda, T.; Kohro, Y.; Matsunaga, N.; Tsuda, M.; et al. Glucocorticoid regulation of ATP release from spinal astrocytes underlies diurnal exacerbation of neuropathic mechanical allodynia. Nat. Commun. 2016, 7, 13102. [Google Scholar] [CrossRef]
- Woolf, C.J.; Mannion, R.J. Neuropathic pain: Aetiology, symptoms, mechanisms, and management. Lancet 1999, 353, 1959–1964. [Google Scholar] [CrossRef]
- Burish, M.J.; Chen, Z.; Yoo, S.-H. Emerging relevance of circadian rhythms in headaches and neuropathic pain. Acta Physiol. 2019, 225, e13161. [Google Scholar] [CrossRef]
- Xia, T.; Cui, Y.; Qian, Y.; Chu, S.; Song, J.; Gu, X.; Ma, Z. Regulation of the NR2B-CREB-CRTC1 Signaling Pathway Contributes to Circadian Pain in Murine Model of Chronic Constriction Injury. Anesth. Analg. 2016, 122, 542–552. [Google Scholar] [CrossRef]
- Wirz-Justice, A.; Da Prada, M.; Remé, C. Circadian rhythm in rat retinal dopamine. Neurosci. Lett. 1984, 45, 21–25. [Google Scholar] [CrossRef]
- Doyle, S.E.; McIvor, W.E.; Menaker, M. Circadian rhythmicity in dopamine content of mammalian retina: Role of the photoreceptors. J. Neurochem. 2002, 83, 211–219. [Google Scholar] [CrossRef]
- Corthell, J.; Stathopoulos, A.; Watson, C.; Bertram, R.; Trombley, P. Olfactory bulb monoamine concentrations vary with time of day. Neuroscience 2013, 247, 234–241. [Google Scholar] [CrossRef]
- Sellix, M.; Egli, M.; Poletini, M.; McKee, D.T.; Bosworth, M.D.; Fitch, C.A.; Freeman, M.E. Anatomical and functional characterization of clock gene expression in neuroendocrine dopaminergic neurons. Am. J. Physiol. Integr. Comp. Physiol. 2006, 290, R1309–R1323. [Google Scholar] [CrossRef] [PubMed]
- Khaldy, H.; León, J.; Escames, G.; Bikjdaouene, L.; García, J.J.; Acuña-Castroviejo, D. Circadian Rhythms of Dopamine and Dihydroxyphenyl Acetic Acid in the Mouse Striatum: Effects of Pinealectomy and of Melatonin Treatment. Neuroendocrinology 2002, 75, 201–208. [Google Scholar] [CrossRef] [PubMed]
- Schade, R.; Vick, K.; Sohr, R.; Ott, T.; Pfister, C.; Bellach, J.; Mattes, A.; Lemmer, B. Correlative circadian rhythms of cholecystokinin and dopamine content in nucleus accumbens and striatum of rat brain. Behav. Brain Res. 1993, 59, 211–214. [Google Scholar] [CrossRef]
- Paulson, P.E.; Robinson, T.E. Relationship between circadian changes in spontaneous motor activity and dorsal versus ventral striatal dopamine neurotransmission assessed with on-line microdialysis. Behav. Neurosci. 1994, 108, 624–635. [Google Scholar] [CrossRef]
- Smith, M.D.; Shearer, M.G.; Srivastava, S.; Scott, R.; Courtney, J.M. Quantitative evaluation of the growth of established cell lines on the surface of collagen, collagen composite and reconstituted basement membrane. Urol. Res. 1992, 20, 285–288. [Google Scholar] [CrossRef] [PubMed]
- Castañeda, T.R.; de Prado, B.M.; Prieto, D.; Mora, F. Circadian rhythms of dopamine, glutamate and GABA in the striatum and nucleus accumbens of the awake rat: Modulation by light. J. Pineal Res. 2004, 36, 177–185. [Google Scholar] [CrossRef]
- Ferris, M.J.; España, R.A.; Locke, J.L.; Konstantopoulos, J.K.; Rose, J.H.; Chen, R.; Jones, S.R. Dopamine transporters govern diurnal variation in extracellular dopamine tone. Proc. Natl. Acad. Sci. USA 2014, 111, E2751–E2759. [Google Scholar] [CrossRef]
- O’Neill, R.; Fillenz, M. Simultaneous monitoring of dopamine release in rat frontal cortex, nucleus accumbens and striatum: Effect of drugs, circadian changes and correlations with motor activity. Neuroscience 1985, 16, 49–55. [Google Scholar] [CrossRef]
- Bhaskaran, D.; Radha, E. Circadian variations in the monoamine levels and monoamine oxidase activity in different regions of the rat brain as a function of age. Exp. Gerontol. 1984, 19, 153–170. [Google Scholar] [CrossRef]
- Lemmer, B.; Berger, T. Diurnal rhythm in the central dopamine turnover in the rat. Naunyn-Schmiedebergs Arch. Exp. Pathol. Pharmakol. 1978, 303, 257–261. [Google Scholar] [CrossRef]
- Ondo, W.G.; He, Y.; Bs, S.R.; Le, W. Clinical correlates of 6-hydroxydopamine injections into A11 dopaminergic neurons in rats: A possible model for restless legs syndrome? Mov. Disord. 2000, 15, 154–158. [Google Scholar] [CrossRef]
- Zhao, H.; Zhu, W.; Pan, T.; Xie, W.; Zhang, A.; Ondo, W.G.; Le, W. Spinal cord dopamine receptor expression and function in mice with 6-OHDA lesion of the A11 nucleus and dietary iron deprivation. J. Neurosci. Res. 2007, 85, 1065–1076. [Google Scholar] [CrossRef] [PubMed]
- Sharma, S.; Kim, L.H.; Whelan, P.J. Towards a connectome of descending commands controlling locomotion. Curr. Opin. Physiol. 2019, 8, 70–75. [Google Scholar] [CrossRef]
- Sharples, S.; Koblinger, K.; Humphreys, J.M.; Whelan, P.J. Dopamine: A parallel pathway for the modulation of spinal locomotor networks. Front. Neural Circuits 2014, 8, 55. [Google Scholar] [CrossRef] [PubMed]
- Humphreys, J.M.; Whelan, P.J. Dopamine exerts activation-dependent modulation of spinal locomotor circuits in the neonatal mouse. J. Neurophysiol. 2012, 108, 3370–3381. [Google Scholar] [CrossRef]
- Clemens, S.; Belin-Rauscent, A.; Simmers, J.; Combes, D. Opposing modulatory effects of D1- and D2-like receptor activation on a spinal central pattern generator. J. Neurophysiol. 2012, 107, 2250–2259. [Google Scholar] [CrossRef]
- Koblinger, K.; Jean-Xavier, C.; Sharma, S.; Füzesi, T.; Young, L.; Eaton, S.E.A.; Kwok, C.H.T.; Bains, J.S.; Whelan, P.J. Optogenetic Activation of A11 Region Increases Motor Activity. Front. Neural Circuits 2018, 12, 86. [Google Scholar] [CrossRef]
- Tamae, A.; Nakatsuka, T.; Koga, K.; Kato, G.; Furue, H.; Katafuchi, T.; Yoshimura, M. Direct inhibition of substantia gelatinosa neurones in the rat spinal cord by activation of dopamine D2-like receptors. J. Physiol. 2005, 568, 243–253. [Google Scholar] [CrossRef]
- Reinig, S.; Driever, W.; Arrenberg, A.B. The Descending Diencephalic Dopamine System Is Tuned to Sensory Stimuli. Curr. Biol. 2017, 27, 318–333. [Google Scholar] [CrossRef]
- Peirs, C.; Williams, S.-P.G.; Zhao, X.; Arokiaraj, C.M.; Ferreira, D.W.; Noh, M.-C.; Smith, K.M.; Halder, P.; Corrigan, K.A.; Gedeon, J.Y.; et al. Mechanical Allodynia Circuitry in the Dorsal Horn Is Defined by the Nature of the Injury. Neuron 2020, 109, 73–90.e7. [Google Scholar] [CrossRef]
- Abdallah, K.; Monconduit, L.; Artola, A.; Luccarini, P.; Dallel, R. GABAAergic inhibition or dopamine denervation of the A11 hypothalamic nucleus induces trigeminal analgesia. Pain 2015, 156, 644–655. [Google Scholar] [CrossRef] [PubMed]
- Baier, P.; Trenkwalder, C. Circadian variation in restless legs syndrome. Sleep Med. 2007, 8, 645–650. [Google Scholar] [CrossRef] [PubMed]
- Garcia-Borreguero, D.; Larrosa, O.; Granizo, J.J.; De La Llave, Y.; Hening, W.A. Circadian variation in neuroendocrine response to L-dopa in patients with restless legs syndrome. Sleep 2004, 27, 669–673. [Google Scholar] [CrossRef] [PubMed]
- Clemens, S.; Rye, D.; Hochman, S. Restless legs syndrome: Revisiting the dopamine hypothesis from the spinal cord perspective. Neurology 2006, 67, 125–130. [Google Scholar] [CrossRef]
- Stiasny-Kolster, K.; Magerl, W.; Oertel, W.H.; Möller, J.C.; Treede, R.-D. Static mechanical hyperalgesia without dynamic tactile allodynia in patients with restless legs syndrome. Brain 2004, 127, 773–782. [Google Scholar] [CrossRef]
- Yang, H.W.; Zhou, L.J.; Hu, N.W.; Xin, W.J.; Liu, X.G. Activation of spinal d1/d5 receptors induces late-phase LTP of C-fiber-evoked field potentials in rat spinal dorsal horn. J. Neurophysiol. 2005, 94, 961–967. [Google Scholar] [CrossRef]
- Kim, J.Y.V.; Tillu, D.V.; Quinn, T.L.; Mejia, G.L.; Shy, A.; Asiedu, M.N.; Murad, E.; Schumann, A.P.; Totsch, S.K.; Sorge, R.E.; et al. Spinal dopaminergic projections control the transition to pathological pain plasticity via a D1/D5-mediated mechanism. J. Neurosci. 2015, 35, 6307–6317. [Google Scholar] [CrossRef]
- Megat, S.; Shiers, S.; Moy, J.K.; Barragan-Iglesias, P.; Pradhan, G.; Seal, R.P.; Dussor, G.; Price, T.J. A Critical Role for Dopamine D5 Receptors in Pain Chronicity in Male Mice. J. Neurosci. 2018, 38, 379–397. [Google Scholar] [CrossRef]
- Kawamoto, K.; Otsuguro, K.; Ishizuka, M.; Ito, S. Inhibitory effects of dopamine on spinal synaptic transmission via dopamine D1-like receptors in neonatal rats. J. Cereb. Blood Flow Metab. 2011, 166, 788–800. [Google Scholar] [CrossRef]
- Almanza, A.; Simón-Arceo, K.; Coffeen, U.; Fuentes-García, R.; Contreras, B.; Pellicer, F.; Mercado, F. A D2-like receptor family agonist produces analgesia in mechanonociception but not in thermonociception at the spinal cord level in rats. Pharmacol. Biochem. Behav. 2015, 137, 119–125. [Google Scholar] [CrossRef]
- Mercado-Reyes, J.; Almanza, A.; Segura-Chama, P.; Pellicer, F.; Mercado, F. D2-like receptor agonist synergizes the μ-opioid agonist spinal antinociception in nociceptive, inflammatory and neuropathic models of pain in the rat. Eur. J. Pharmacol. 2019, 853, 56–64. [Google Scholar] [CrossRef] [PubMed]
- Lu, Y.; Doroshenko, M.; Lauzadis, J.; Kanjiya, M.P.; Rebecchi, M.J.; Kaczocha, M.; Puopolo, M. Presynaptic Inhibition of Primary Nociceptive Signals to Dorsal Horn Lamina I Neurons by Dopamine. J. Neurosci. 2018, 38, 8809–8821. [Google Scholar] [CrossRef] [PubMed]
- Segura-Chama, P.; Luis, E.; Almanza, A.; Pellicer, F.; Hernández-Cruz, A.; Mercado, F. Modulation of intracellular calcium concentration by D2-like DA receptor agonists in non-peptidergic DRG neurons is mediated mainly by D4 receptor activation. Neurosci. Lett. 2020, 736, 135267. [Google Scholar] [CrossRef] [PubMed]
- Bao, Y.-N.; Dai, W.-L.; Fan, J.-F.; Ma, B.; Li, S.-S.; Zhao, W.-L.; Yu, B.-Y.; Liu, J.-H. The dopamine D1–D2DR complex in the rat spinal cord promotes neuropathic pain by increasing neuronal excitability after chronic constriction injury. Exp. Mol. Med. 2021, 53, 235–249. [Google Scholar] [CrossRef]
- González, S.; Moreno-Delgado, D.; Moreno, E.; Pérez-Capote, K.; Franco, R.; Mallol, J.; Cortés, A.; Casadó, V.; Lluís, C.; Ortiz, J.; et al. Circadian-Related Heteromerization of Adrenergic and Dopamine D4 Receptors Modulates Melatonin Synthesis and Release in the Pineal Gland. PLoS Biol. 2012, 10, e1001347. [Google Scholar] [CrossRef]
- Gravotta, L.; Gavrila, A.M.; Hood, S.; Amir, S. Global Depletion of Dopamine Using Intracerebroventricular 6-Hydroxydopamine Injection Disrupts Normal Circadian Wheel-Running Patterns and PERIOD2 Expression in the Rat Forebrain. J. Mol. Neurosci. 2011, 45, 162–171. [Google Scholar] [CrossRef]
- Hayashi, A.; Matsunaga, N.; Okazaki, H.; Kakimoto, K.; Kimura, Y.; Azuma, H.; Ikeda, E.; Shiba, T.; Yamato, M.; Yamada, K.-I.; et al. A Disruption Mechanism of the Molecular Clock in a MPTP Mouse Model of Parkinson’s Disease. NeuroMol. Med. 2013, 15, 238–251. [Google Scholar] [CrossRef]
- Li, S.Y.; Wang, Y.L.; Liu, W.W.; Lyu, D.J.; Wang, F.; Mao, C.J.; Yang, Y.-P.; Hu, L.-F.; Liu, C.-F. Long-term Levodopa Treatment Accelerates the Circadian Rhythm Dysfunction in a 6-hydroxydopamine Rat Model of Parkinson’s Disease. Chin. Med. J. 2017, 130, 1085–1092. [Google Scholar] [CrossRef]
- Shkodina, A.D.; Tan, S.C.; Hasan, M.M.; Abdelgawad, M.; Chopra, H.; Bilal, M.; Boiko, D.I.; Tarianyk, K.A.; Alexiou, A. Roles of clock genes in the pathogenesis of Parkinson’s disease. Ageing Res. Rev. 2021, 74, 101554. [Google Scholar] [CrossRef]
- Mesgar, S.; Jameie, S.B.; Aliaghaei, A.; Parvardeh, S.; Torabi, A.; Haghparast, A. Dopamine D1 Receptor-Mediated Regulation of Per1, Per2, CLOCK, and BMAL1 Expression in the Suprachiasmatic Nucleus in Adult Male Rats. J. Mol. Neurosci. 2022, 72, 618–625. [Google Scholar] [CrossRef]

Publisher’s Note: MDPI stays neutral with regard to jurisdictional claims in published maps and institutional affiliations. |
© 2022 by the authors. Licensee MDPI, Basel, Switzerland. This article is an open access article distributed under the terms and conditions of the Creative Commons Attribution (CC BY) license (https://creativecommons.org/licenses/by/4.0/).
Share and Cite
Piña-Leyva, C.; Lara-Lozano, M.; Rodríguez-Sánchez, M.; Vidal-Cantú, G.C.; Barrientos Zavalza, E.; Jiménez-Estrada, I.; Delgado-Lezama, R.; Rodríguez-Sosa, L.; Granados-Soto, V.; González-Barrios, J.A.; et al. Hypothalamic A11 Nuclei Regulate the Circadian Rhythm of Spinal Mechanonociception through Dopamine Receptors and Clock Gene Expression. Life 2022, 12, 1411. https://doi.org/10.3390/life12091411
Piña-Leyva C, Lara-Lozano M, Rodríguez-Sánchez M, Vidal-Cantú GC, Barrientos Zavalza E, Jiménez-Estrada I, Delgado-Lezama R, Rodríguez-Sosa L, Granados-Soto V, González-Barrios JA, et al. Hypothalamic A11 Nuclei Regulate the Circadian Rhythm of Spinal Mechanonociception through Dopamine Receptors and Clock Gene Expression. Life. 2022; 12(9):1411. https://doi.org/10.3390/life12091411
Chicago/Turabian StylePiña-Leyva, Celia, Manuel Lara-Lozano, Marina Rodríguez-Sánchez, Guadalupe C. Vidal-Cantú, Ericka Barrientos Zavalza, Ismael Jiménez-Estrada, Rodolfo Delgado-Lezama, Leonardo Rodríguez-Sosa, Vinicio Granados-Soto, Juan Antonio González-Barrios, and et al. 2022. "Hypothalamic A11 Nuclei Regulate the Circadian Rhythm of Spinal Mechanonociception through Dopamine Receptors and Clock Gene Expression" Life 12, no. 9: 1411. https://doi.org/10.3390/life12091411
APA StylePiña-Leyva, C., Lara-Lozano, M., Rodríguez-Sánchez, M., Vidal-Cantú, G. C., Barrientos Zavalza, E., Jiménez-Estrada, I., Delgado-Lezama, R., Rodríguez-Sosa, L., Granados-Soto, V., González-Barrios, J. A., & Florán-Garduño, B. (2022). Hypothalamic A11 Nuclei Regulate the Circadian Rhythm of Spinal Mechanonociception through Dopamine Receptors and Clock Gene Expression. Life, 12(9), 1411. https://doi.org/10.3390/life12091411