Abstract
Excessive alcohol consumption can cause alcoholic myopathy, but the molecular mechanism is still unclear. In this study, zebrafish were exposed to 0.5% alcohol for eight weeks to investigate the effect of alcohol on skeletal muscle and its molecular mechanism. The results showed that the body length, body weight, cross-sectional area of the skeletal muscle fibers, Ucrit, and MO2max of the zebrafish were significantly decreased after alcohol exposure. The expression of markers of skeletal muscle atrophy and autophagy was increased, and the expression of P62 was significantly reduced. The content of ROS, the mRNA expression of sod1 and sod2, and the protein expression of Nox2 were significantly increased. In addition, we found that the inflammatory factors Il1β and Tnfα were significantly enriched in skeletal muscle, and the expression of the HMGB1/TLR4/NF-κB signaling axis was also significantly increased. In summary, in this study, we established a zebrafish model of alcohol-induced skeletal muscle atrophy and further elucidated its pathogenesis.
1. Introduction
As the frequency of alcohol consumption gradually increases, the damage caused by excessive drinking to various organs in the body also continues to increase [1]. Skeletal muscle myopathy due to excessive alcohol ingestion, termed alcoholic myopathy [2], is characterized by progressive proximal weakness and skeletal muscle atrophy [3], which can significantly impair gait and mobility in this patient population. Alcoholic myopathy occurs in between 40 and 60% of individuals with chronic alcoholics [4,5], and the immediate cause is an imbalance between skeletal muscle protein synthesis and degradation [6,7,8,9]; however, the underlying cause is unclear. Therefore, extensive research is urgently needed to explore the underlying mechanisms of alcoholic myopathy and find effective interventions.
The regulation of protein degradation is mainly achieved by the ubiquitin‒proteasome system (UPS) and the autophagy‒lysosome system (ALS). Muscle RING finger 1 (MuRF1)/TRIM63 and muscle atrophy F-box (MAFbx), two E3 ligases in the UPS, are generally upregulated in alcoholic myopathy [2,4,10]. The ALS is also closely related to skeletal muscle atrophy [11,12], and autophagy levels were significantly increased in the skeletal muscle of chronic alcohol-drinking mice [6,13].
Inflammatory signaling leads to skeletal muscle atrophy by activating protein degradation [14,15,16,17,18]. The nuclear transcription factor NF-κB is a key regulator of inflammatory signaling pathways and promotes the expression of inflammatory factors [19,20]. NF-κB activity was significantly increased after the skeletal muscle of zebrafish was exposed to alcohol [21]. High mobility group box 1 (HMGB1), an essential mediator of chronic inflammation [22,23], activates NF-κB through Toll-like receptor 4 (TLR4) [24,25]. The expression of HMGB1 is significantly increased in patients with alcoholic liver disease who consume alcohol for long periods [26,27]. Therefore, we suspect that alcohol causes skeletal muscle atrophy by activating HMGB1/TLR4/NF-κB signaling.
Zebrafish, as a small and highly fecund vertebrate with a physiology and gene pool similar to those of humans, can be used to study the mechanism of action of ethanol in vivo [28,29]. The most significant advantage is the ease of administration, and water-soluble drugs such as ethanol can be directly mixed with water and subsequently absorbed by zebrafish [30]. In this study, we explore the molecular mechanisms of alcohol-induced skeletal muscle atrophy in zebrafish and provide new ideas for therapeutic targets of alcoholic myopathy.
2. Materials and Methods
2.1. Experimental Animals and Groups
The experimental animals were 8-month-old AB strain male zebrafish (n = 60) purchased from Wuhan Institute of Hydrobiology, Chinese Academy of Sciences, which were maintained under a light:dark cycle of 14 h:10 h. The operating procedures complied with the “Regulations on the Management and Use of Laboratory Animals of Hunan Normal University”. The experimental fish were divided into a control group (n = 30) and an alcohol exposure group (n = 30), which were reared in water or a 0.5 percent alcohol solution, respectively, for a total of 8 weeks of intervention. The control and alcohol exposure groups were fed fresh Artemia daily at 9:00 am, 1:00 pm, and 5:00 pm. The water or alcohol was changed every 24 h, and the alcohol concentration of the alcohol exposure group was measured daily. Hunan Normal University’s Laboratory Animal Ethics Committee approved this study (No. 2018-046).
2.2. Zebrafish Model Treated with Alcohol Exposure
Studies have shown that a 1% ethanol concentration can lead to the unnatural death of zebrafish, while zebrafish maintain a normal state in an ethanol concentration of 0.5% [31]. Therefore, a 0.5% ethanol concentration was selected in this experiment, which significantly changed the physiology of zebrafish without causing death.
2.3. Determination of Exercise Capacity and Maximal Oxygen Uptake
Ucrit is the maximum swimming speed achieved in the fish test protocol and it reflects the maximum ability of the fish to provide energy during continuous activity. It can be used as an evaluation index for fish’s swimming ability and metabolic performance [32]. Zebrafish’s motility and oxygen consumption were analyzed using a miniature swimming tunnel respirator (Loligo Systems, Viborg, Denmark). The specific test and calculation methods are as follows.
First, the body length and body weight of the zebrafish were measured and they fasted for 24 h. Second, the fasted zebrafish were transferred to the lane of the respirator for adaptive training at a rate of 0.8 body length per second (BL/S) for 2 h. After adaptation, the water speed in the respirator of the swimming lane was gradually increased according to the speed increment pattern of 1.35 BL/S every 7 min until the zebrafish reached the exhausted state (the standard of the exhausted state was that the zebrafish stopped at the water outlet of the swimming lane, ending 20 s above). Swimming lane respirator parameter settings during measurement were as follows: rinse for 90 s, wait for 30 s, and measure for 5 min. Finally, Ucrit was calculated based on the maximum swimming speed recorded by the instrument. The calculation formula was Ucrit = Uf + Us × (Tf/Ts), where Uf is the swimming speed of the experimental fish when it is exhausted; Us is the speed increment (1.35BL/S); Tf is the maximum swimming speed maintained before exhaustion time (min); Ts is the time interval (7 min) [32]. In order to eliminate the influence of zebrafish body length (BL) on swimming speed to a certain extent, the relative critical swimming speed (Ucrit-r) was used to calculate the maximum swimming speed of zebrafish, and the calculation formula was Ucrit-r = Ucrit/BL.
According to the real-time oxygen consumption MO2 (mmol/kg/h) recorded by the swimming lane respirator during the acceleration test, a graph was drawn between the acceleration nodes. Referring to the model equation calculated by Palstra, the oxygen consumption MO2 and velocity node equation were derived by regression analysis: MO2 = SMR + aUBL2 + bUBL, where SMR (basal metabolic rate, standard metabolic rate) represents the minimum oxygen consumption required to maintain metabolism in unfed zebrafish at rest; UBL represents the ratio of real-time swimming speed to body length; a and b are constants. The maximal oxygen consumption of zebrafish is the value of oxygen consumption at the critical swimming speed.
2.4. HE Staining
Skeletal muscles were dehydrated, clarified in xylene, and embedded in paraffin. Serial sections of paraffin were cut using an RM2016 microtome (Leica, Wetzlar, Germany) and mounted on glass slides (Servicebio, Wuhan, China). H&E staining images were acquired using a NIKON DS-U3 camera control unit (Nikon, Tokyo, Japan).
2.5. DHE Staining
Fresh skeletal muscle tissue was placed on frozen slides, and ROS staining (DHE) solution (D7008, Sigma, diluted 1:500) was added to the marked area. ROS-positive areas were stained red with fluorescein. Positive areas were scored using ImageJ (version 5.0).
2.6. Total RNA Extraction and qRT-PCR
The skeletal muscle of zebrafish was collected from the upper region of the line connecting the zebrafish anterior vertebra and caudal vertebrae. RNA was extracted from zebrafish muscle tissue by homogenization in TRIzol solution, according to the manufacturer’s protocol (Thermo Fisher Scientific, Waltham, MA, USA). A reverse transcription system kit (Takara, Tokyo, Japan) was used to convert RNA to cDNA. SYBR green master mix (Thermo Fisher Scientific, Waltham, MA, USA) was used to perform real-time PCR. A real-time PCR system (CFX96, Bio-Rad, Hercules, CA, USA) was used to determine relative mRNA expression. Sangon Biotech synthesized primers for the detected genes and the reference gene gapdh. The relative mRNA expression was determined by using the 2-ΔΔCT method with the primers listed in Table S1.
2.7. Western Blotting
The skeletal muscle was lysed in RIPA buffer (High) (Solarbio, Wuhan, China) containing one mM phenylmethylsulfonyl fluoride (PFMS) and 1× protease phosphatase inhibitor (Solarbio, Wuhan, China). After quantification with a BCA protein quantification kit (Vazyme, Nanjing, China), 20 g of protein lysate was loaded onto an SDS‒PAGE gel. The PAGE gel was cut according to the molecular weight of the target protein, and the protein was transferred to a PVDF membrane after electrophoresis. The membranes were blocked with 5% nonfat milk at room temperature and incubated with primary antibody at 4 °C overnight. See Table S2 for specific information on the primary antibodies. After washing in PBST, the membranes were incubated with a goat anti-rabbit IgG-HRP secondary antibody (1:10,000, Absin, Shanghai, China). Proteins were detected using a gel imaging system (Tanon, Shanghai, China). Immunoreactive bands were visualized and quantified using ImageJ software.
2.8. Data Analysis
Statistics were analyzed with GraphPad Prism 8 (GraphPad Software, San Diego, CA, USA). All data were normally distributed and are presented as the mean ± SD of three independent experiments. Significance was determined using an unpaired-samples t test. *, **, *** represent p < 0.05, p < 0.01, and p < 0.001, respectively; ns represents p > 0.05, with no statistical significance.
3. Results
3.1. Alcohol Exposure Alters Zebrafish Appearance, Skeletal Muscle Morphology, and Exercise Capacity
After 8 weeks of 0.5% alcohol exposure, compared with those of the control group, the alcohol-exposed zebrafish’s body size (Figure 1A), body length (Figure 1B), body weight (Figure 1C), and back muscle weight/body weight (Figure 1D) were significantly decreased. The results of HE staining showed that the size and arrangement of skeletal muscle fibers in the alcohol exposure group were significantly changed (Figure 1E), and the cross-sectional area of muscle fibers was significantly reduced (Figure 1F). Zebrafish exercise capacity indices Ucrit, Ucrit-r, and MO2max were significantly lower in the alcohol exposure group than in the control group (Figure 1G–I).
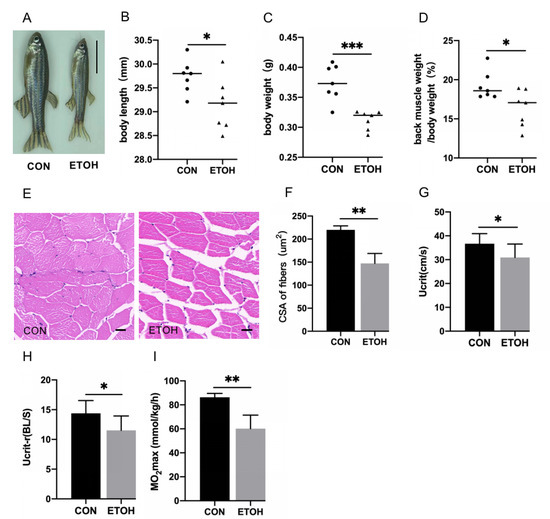
Figure 1.
Morphology, skeletal muscle histology, and exercise capacity analysis of alcohol-induced zebrafish. (A) Comparison of appearance. Bar = 10 mm. (B) Body length (mm). (C) Body weight (g). (D) Back muscle proportion of body weight (%). (E) Hematoxylin–eosin (HE) staining. Bar = 20 µm. (F) Cross-sectional area (CSA) of muscle fibers (μm2). (G) Absolute critical swimming speed (cm/s). (H) Relative critical swimming speed (body length/second). (I) Maximal oxygen uptake (mmol/kg/h). n = 7. * p < 0.05, ** p < 0.01, *** p < 0.001.
3.2. Alcohol Exposure Activates the UPS and ALS of Zebrafish Skeletal Muscle
The main pathways of protein degradation are the UPS and ALS, which are involved in the degradation of more than 80% of proteins in cells [33]. The results showed that the mRNA levels of the UPS marker factors trim63a, trim63b, and fbxo25 in the alcohol exposure group were significantly increased (Figure 2A). The protein levels of Mafbx and Murf1 were significantly increased (Figure 2B,C). The ALS mRNA levels of the marker factors atg7, beclin1, and lc3a were also significantly increased in the alcohol exposure group (Figure 2D), and the protein level of Beclin1 was significantly increased (Figure 2E), while the protein levels of the autophagy substrate P62 were decreased (Figure 2F).
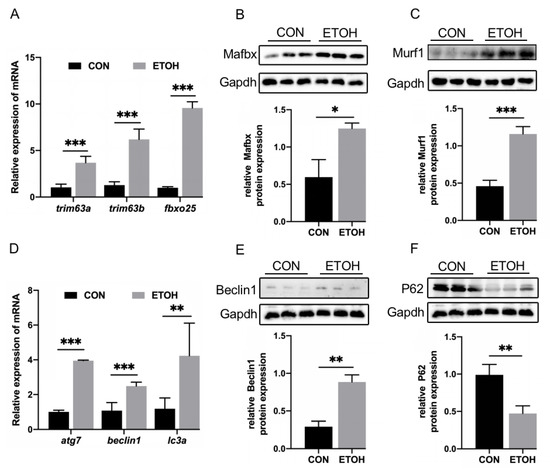
Figure 2.
The effect of alcohol exposure on protein degradation in skeletal muscle. (A) Changes in the mRNA levels of trim63a, trim63b, and fbxo25. (B) Western blot analysis of the difference in Mafbx protein levels. (C) Protein expression level of Murf1. (D) mRNA expression of atg7, beclin1, and lc3a. (E) Western blot analysis of changes in Beclin1 levels. (F) Western blot analysis of changes in P62 levels. * p < 0.05, ** p < 0.01, and *** p < 0.001.
3.3. Alcohol Exposure Increases ROS Generation and Redox System Dysregulation in Zebrafish Skeletal Muscle
We detected reactive oxygen species (ROS) in alcohol-exposed zebrafish skeletal muscle by DHE staining. The results showed that the content of ROS in the fibers of skeletal muscle in the alcohol exposure group was significantly increased (Figure 3A), and the fluorescence intensity of ROS was also significantly increased, as determined by ImageJ analysis (Figure 3B). The mRNA levels of the antioxidant enzymes sod1 and sod2 (Figure 3C) in the alcohol exposure group were significantly increased, and the protein expression of nicotinamide adenine dinucleotide phosphate oxidase 2 (Nox2) was significantly increased (Figure 3D).
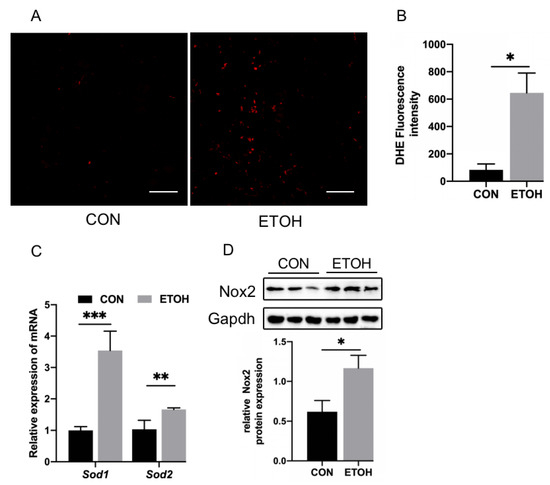
Figure 3.
Zebrafish skeletal muscle ROS, oxidation, and antioxidant levels. (A) DHE staining of zebrafish skeletal muscle. Bar = 20 µm. (B) Quantitation of DHE staining. (C) mRNA levels of sod1 and sod2. (D) Western blot analysis of Nox2 expression. * p < 0.05, ** p < 0.01, and *** p < 0.001.
3.4. Alcohol Exposure Activates Inflammation and the HMGB1/TLR4/NF-κB Signaling Pathway
Next, we tested alcohol-exposed zebrafish skeletal muscle for inflammatory factors and HMGB1/TLR4/NF-κB signaling. Compared with those in the control group, the mRNA levels of the inflammatory factors il1β and tnfα were significantly increased in the alcohol exposure group (Figure 4A). The expression of the Il1β and Tnfα proteins was also significantly increased (Figure 4B,C). Moreover, the protein levels of Hmgb1, Tlr4, and Nf-κb were significantly upregulated (Figure 4D–F).
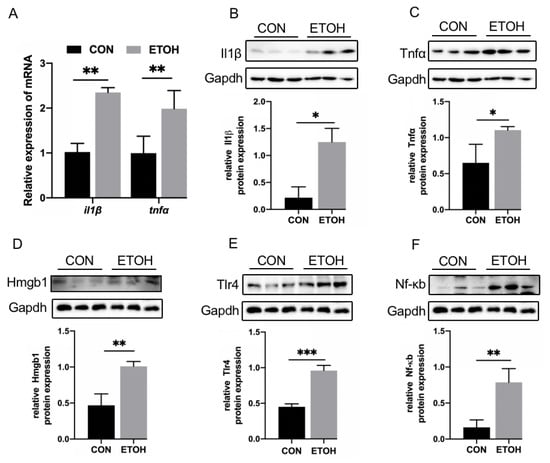
Figure 4.
Inflammatory factors and HMGB1/TLR4/NF-κB expression in zebrafish skeletal muscle. (A) mRNA levels of il1β and tnfα. (B) Il1β protein expression level. (C) Tnfα protein expression level. (D) Hmgb1 protein expression level. (E) Tlr4 protein expression level. (F) Nf-κb protein expression level. * p < 0.05, ** p < 0.01, and *** p < 0.001.
4. Discussion
Prolonged and excessive alcohol consumption reduces skeletal muscle mass and impairs skeletal muscle function [34], but its pathogenesis remains understudied. In the present study, alcohol-exposed zebrafish had significantly reduced skeletal muscle size and exercise capacity, and the UPS and ALS were activated. Skeletal muscle inflammatory factor and ROS production was significantly increased, and HMGB1/TLR4/NF-κB signaling, which regulates inflammation, was also significantly increased. These results suggest that alcohol exposure causes skeletal muscle atrophy in zebrafish and that HMGB1/TLR4/NF-κB signaling may mediate alcohol-induced skeletal muscle atrophy.
Body weight, lean body mass, and skeletal muscle weight/whole body weight loss, as obvious markers of skeletal muscle atrophy, are commonly observed in models of alcohol-induced skeletal muscle atrophy [35,36,37]. Decreased muscle strength and increased perception of exercise fatigue have been reported in alcohol-fed mice [38]. In this experiment, zebrafish’s body weight, back muscle/body weight, and skeletal muscle fiber cross-sectional area were significantly reduced. Ucrit and MO2max values were significantly reduced after alcohol exposure, indicating that alcohol exposure leads to skeletal muscle atrophy and reduced exercise ability in zebrafish.
Impaired protein synthesis is an important cause of skeletal muscle atrophy. We experimentally validated the canonical signaling IGF1/PI3K/AKT pathway for protein synthesis. The experimental results showed that there was no significant change in the IGF1/PI3K/AKT signaling axis. Similar to the results of this experiment, alcohol reduces protein synthesis in alcohol-fed mice through non-IGF1/PI3K/AKT signaling [39]. A similar situation may exist in alcohol-exposed zebrafish, which is the focus of our next study. The UPS and ALS are the main pathways of protein degradation [40]. Autophagy markers were significantly enriched in alcohol-fed rats [41]. The mRNA levels of murf1 and mafbx were also significantly increased in alcohol abuse patients [42]. In the present study, alcohol exposure increased UPS and ALS activity in zebrafish, similar to previous findings in rats [43]. This finding indicates that the protein degradation pathway dominated by the UPS and ALS was the direct cause of alcohol-induced skeletal muscle atrophy in zebrafish.
Inflammation is an essential cause of skeletal muscle atrophy [33,44]. NF-κB and the NF-κB-induced inflammatory factor TNFα can activate the transcription of murf1 and mafbx [40,45,46]. The mRNA levels of tnfα and il-6 were increased in the gastrocnemius muscle of adult rats fed alcohol [47]. In this study, the expression of the inflammatory factors Tnfα and Il1β was increased in the skeletal muscle of alcohol-exposed zebrafish, which may be the reason for the atrophy of the zebrafish’s skeletal muscle caused by alcohol exposure.
ROS production can be induced by the inflammatory factors Tnfα and Il1β [48,49], and TLR4 and TLR4/NF-KB are also closely related to ROS [50,51]. Nox is a common ROS-generating enzyme, and the expression of Nox2 is dependent on NF-κB activation [52]. In alcohol-exposed zebrafish’s skeletal muscle, Nox2 was activated, the ROS content was significantly increased, and the mRNA levels of sod1 and sod2 were elevated. This is similar to the experimental results and characteristics of alcohol consumption in rats and myotubes [9,53]. Although the expression levels of sod1 and sod2 were adaptively increased in this study, ROS levels were significantly increased in skeletal muscle, which may be due to the overactivation of Nox2, unbalancing the redox system and eventually generating a large amount of ROS in skeletal muscle.
HMGB1 is a DNA-binding protein, released extracellularly, that binds to TLR4, which triggers NF-κB signaling and induces an inflammatory response. The HMGB1 content was significantly increased in the serum of rats exposed to alcohol for a long period of time [54,55]. As a common receptor of HMGB1, TLR4 activation leads to the overexpression of MAFbx, MuRF1, and the autophagy markers LC3-II and P62 in C2C12 myotubes to induce skeletal muscle atrophy [17,56]. NF-κB, a downstream signal mediated by TLR4, is also closely associated with skeletal muscle atrophy [12,57]. HMGB1/TLR4/NF-KB is the primary signal regulating inflammation, and their protein expression was significantly increased in this experiment, indicating that they may be a potential regulatory mechanism in alcoholic myopathy.
In conclusion, we successfully constructed a model of alcohol-induced skeletal muscle atrophy in zebrafish, providing a model for the testing of treatments for human alcoholic myopathy. For the first time, in a zebrafish model, it was demonstrated that the process of alcohol-induced skeletal muscle atrophy is mediated by HMGB1/TLR4/NF-κB, which provides a reference for the treatment of alcoholic myopathy in humans.
Supplementary Materials
The following supporting information can be downloaded at: https://www.mdpi.com/article/10.3390/life12081211/s1, Table S1: List of primers used for RT-qPCR; Table S2: List of primary antibodies used for Western blotting.
Author Contributions
Writing—original draft preparation, W.W.; writing—review and editing, X.P.; supervision, Z.Z.; funding acquisition, C.T.; C.S., Z.C. and D.Y. assisted with experimental operation guidance; All authors have read and agreed to the published version of the manuscript.
Funding
This research was supported by State Key Laboratory of Developmental Biology of Freshwater Fish, the National Natural Science Foundation of China (reference numbers 81801392, 32100919, and 32071175), and the Key Project of Developmental Biology and Breeding from Hunan Province.
Institutional Review Board Statement
Hunan Normal University’s Laboratory Animal Ethics Committee approved this study (No. 2018-046).
Informed Consent Statement
Not applicable.
Data Availability Statement
The data are available from the corresponding author.
Conflicts of Interest
The authors declare that there are no conflict of interest.
References
- Rehm, J.; Baliunas, D.; Borges, G.L.; Graham, K.; Irving, H.; Kehoe, T.; Parry, C.D.; Patra, J.; Popova, S.; Poznyak, V.; et al. The relation between different dimensions of alcohol consumption and burden of disease: An overview. Addiction 2010, 105, 817–843. [Google Scholar] [CrossRef] [PubMed] [Green Version]
- Otis, J.S.; Brown, L.A.; Guidot, D.M. Oxidant-induced atrogin-1 and transforming growth factor-beta1 precede alcohol-related myopathy in rats. Muscle Nerve 2007, 36, 842–848. [Google Scholar] [CrossRef] [PubMed] [Green Version]
- Lang, C.H.; Kimball, S.R.; Frost, R.A.; Vary, T.C. Alcohol myopathy: Impairment of protein synthesis and translation initiation. Int. J. Biochem. Cell Biol. 2001, 33, 457–473. [Google Scholar] [CrossRef]
- Levitt, D.E.; Yeh, A.Y.; Prendergast, M.J.; Budnar, R.G., Jr.; Adler, K.A.; Cook, G.; Molina, P.E.; Simon, L. Chronic Alcohol Dysregulates Skeletal Muscle Myogenic Gene Expression after Hind Limb Immobilization in Female Rats. Biomolecules 2020, 10, 441. [Google Scholar] [CrossRef] [PubMed] [Green Version]
- Fernandez-Solà, J.; Preedy, V.R.; Lang, C.H.; Gonzalez-Reimers, E.; Arno, M.; Lin, J.C.; Wiseman, H.; Zhou, S.; Emery, P.W.; Nakahara, T.; et al. Molecular and cellular events in alcohol-induced muscle disease. Alcohol. Clin. Exp. Res. 2007, 31, 1953–1962. [Google Scholar] [CrossRef] [PubMed]
- Thapaliya, S.; Runkana, A.; McMullen, M.R.; Nagy, L.E.; McDonald, C.; Naga Prasad, S.V.; Dasarathy, S. Alcohol-induced autophagy contributes to loss in skeletal muscle mass. Autophagy 2014, 10, 677–690. [Google Scholar] [CrossRef] [PubMed]
- Lang, C.H.; Frost, R.A.; Svanberg, E.; Vary, T.C. IGF-I/IGFBP-3 ameliorates alterations in protein synthesis, eIF4E availability, and myostatin in alcohol-fed rats. Am. J. Physiol. Endocrinol. Metab. 2004, 286, E916–E926. [Google Scholar] [CrossRef] [Green Version]
- Lang, C.H.; Frost, R.A.; Vary, T.C. Skeletal muscle protein synthesis and degradation exhibit sexual dimorphism after chronic alcohol consumption but not acute intoxication. Am. J. Physiol. Endocrinol. Metab. 2007, 292, E1497–E1506. [Google Scholar] [CrossRef]
- Otis, J.S.; Guidot, D.M. Procysteine stimulates expression of key anabolic factors and reduces plantaris atrophy in alcohol-fed rats. Alcohol. Clin. Exp. Res. 2009, 33, 1450–1459. [Google Scholar] [CrossRef] [Green Version]
- Molina, P.E.; Lang, C.H.; McNurlan, M.; Bagby, G.J.; Nelson, S. Chronic alcohol accentuates simian acquired immunodeficiency syndrome-associated wasting. Alcohol. Clin. Exp. Res. 2008, 32, 138–147. [Google Scholar] [CrossRef] [Green Version]
- Sandri, M. Autophagy in health and disease. 3. Involvement of autophagy in muscle atrophy. Am. J. Physiol. Cell Physiol. 2010, 298, C1291–C1297. [Google Scholar] [CrossRef] [Green Version]
- Lee, J.H.; Jeon, J.H.; Lee, M.J. Docosahexaenoic Acid, a Potential Treatment for Sarcopenia, Modulates the Ubiquitin-Proteasome and the Autophagy-Lysosome Systems. Nutrients 2020, 12, 2597. [Google Scholar] [CrossRef]
- Singh, S.S.; Kumar, A.; Welch, N.; Sekar, J.; Mishra, S.; Bellar, A.; Gangadhariah, M.; Attaway, A.; Al Khafaji, H.; Wu, X.; et al. Multiomics-Identified Intervention to Restore Ethanol-Induced Dysregulated Proteostasis and Secondary Sarcopenia in Alcoholic Liver Disease. Cell Physiol. Biochem. 2021, 55, 91–116. [Google Scholar] [CrossRef]
- Cella, P.S.; Marinello, P.C.; Borges, F.H.; Ribeiro, D.F.; Chimin, P.; Testa, M.T.J.; Guirro, P.B.; Duarte, J.A.; Cecchini, R.; Guarnier, F.A.; et al. Creatine supplementation in Walker-256 tumor-bearing rats prevents skeletal muscle atrophy by attenuating systemic inflammation and protein degradation signaling. Eur. J. Nutr. 2020, 59, 661–669. [Google Scholar] [CrossRef]
- Patel, H.J.; Patel, B.M. TNF-α and cancer cachexia: Molecular insights and clinical implications. Life Sci. 2017, 170, 56–63. [Google Scholar] [CrossRef]
- Webster, J.M.; Kempen, L.; Hardy, R.S.; Langen, R.C.J. Inflammation and Skeletal Muscle Wasting During Cachexia. Front. Physiol. 2020, 11, 597675. [Google Scholar] [CrossRef]
- Fang, W.Y.; Tseng, Y.T.; Lee, T.Y.; Fu, Y.C.; Chang, W.H.; Lo, W.W.; Lin, C.L.; Lo, Y.C. Triptolide prevents LPS-induced skeletal muscle atrophy via inhibiting NF-κB/TNF-α and regulating protein synthesis/degradation pathway. Br. J. Pharmacol. 2021, 178, 2998–3016. [Google Scholar] [CrossRef]
- Caron, A.Z.; Drouin, G.; Desrosiers, J.; Trensz, F.; Grenier, G. A novel hindlimb immobilization procedure for studying skeletal muscle atrophy and recovery in mouse. J. Appl. Physiol. 2009, 106, 2049–2059. [Google Scholar] [CrossRef] [Green Version]
- Camargo, R.G.; Riccardi, D.M.; Ribeiro, H.Q.; Carnevali, L.C., Jr.; de Matos-Neto, E.M.; Enjiu, L.; Neves, R.X.; Lima, J.D.; Figuerêdo, R.G.; de Alcântara, P.S.; et al. NF-κBp65 and Expression of Its Pro-Inflammatory Target Genes Are Upregulated in the Subcutaneous Adipose Tissue of Cachectic Cancer Patients. Nutrients 2015, 7, 4465–4479. [Google Scholar] [CrossRef] [Green Version]
- Li, H.; Malhotra, S.; Kumar, A. Nuclear factor-kappa B signaling in skeletal muscle atrophy. J. Mol. Med. 2008, 86, 1113–1126. [Google Scholar] [CrossRef] [Green Version]
- Coffey, E.C.; Pasquarella, M.E.; Goody, M.F.; Henry, C.A. Ethanol Exposure Causes Muscle Degeneration in Zebrafish. J. Dev. Biol. 2018, 6, 7. [Google Scholar] [CrossRef] [Green Version]
- Kang, R.; Chen, R.; Zhang, Q.; Hou, W.; Wu, S.; Cao, L.; Huang, J.; Yu, Y.; Fan, X.G.; Yan, Z.; et al. HMGB1 in health and disease. Mol. Aspects Med. 2014, 40, 1–116. [Google Scholar] [CrossRef] [Green Version]
- Bae, J.S. Role of high mobility group box 1 in inflammatory disease: Focus on sepsis. Arch. Pharm. Res. 2012, 35, 1511–1523. [Google Scholar] [CrossRef]
- Yang, H.; Wang, H.; Andersson, U. Targeting Inflammation Driven by HMGB1. Front. Immunol. 2020, 11, 484. [Google Scholar] [CrossRef] [Green Version]
- Paudel, Y.N.; Angelopoulou, E.; Piperi, C.; Othman, I.; Shaikh, M.F. Implication of HMGB1 signaling pathways in Amyotrophic lateral sclerosis (ALS): From molecular mechanisms to pre-clinical results. Pharmacol. Res. 2020, 156, 104792. [Google Scholar] [CrossRef]
- Vannier, A.G.L.; Wardwell, B.; Fomin, V.; PeBenito, A.; Wolczynski, N.; Piaker, S.; Kedrin, D.; Chung, R.T.; Schaefer, E.; Goodman, R.; et al. Serum HMGB1 associates with liver disease and predicts readmission and mortality in patients with alcohol use disorder. Alcohol 2021, 95, 37–43. [Google Scholar] [CrossRef]
- Saha, B.; Tornai, D.; Kodys, K.; Adejumo, A.; Lowe, P.; McClain, C.; Mitchell, M.; McCullough, A.; Dasarathy, S.; Kroll-Desrosiers, A.; et al. Biomarkers of Macrophage Activation and Immune Danger Signals Predict Clinical Outcomes in Alcoholic Hepatitis. Hepatology 2019, 70, 1134–1149. [Google Scholar] [CrossRef] [PubMed]
- Dlugos, C.A.; Rabin, R.A. Ethanol effects on three strains of zebrafish: Model system for genetic investigations. Pharmacol. Biochem. Behav. 2003, 74, 471–480. [Google Scholar] [CrossRef]
- Damodaran, S.; Dlugos, C.A.; Wood, T.D.; Rabin, R.A. Effects of chronic ethanol administration on brain protein levels: A proteomic investigation using 2-D DIGE system. Eur. J. Pharmacol. 2006, 547, 75–82. [Google Scholar] [CrossRef] [PubMed]
- Morikane, D.; Zang, L.; Nishimura, N. Evaluation of the Percutaneous Absorption of Drug Molecules in Zebrafish. Molecules 2020, 25, 3974. [Google Scholar] [CrossRef] [PubMed]
- Khayrullin, A.; Smith, L.; Mistry, D.; Dukes, A.; Pan, Y.A.; Hamrick, M.W. Chronic alcohol exposure induces muscle atrophy (myopathy) in zebrafish and alters the expression of microRNAs targeting the Notch pathway in skeletal muscle. Biochem. Biophys. Res. Commun. 2016, 479, 590–595. [Google Scholar] [CrossRef] [PubMed]
- Chen, Z.; Zhou, Z.; Peng, X.; Sun, C.; Yang, D.; Li, C.; Zhu, R.; Zhang, P.; Zheng, L.; Tang, C. Cardioprotective responses to aerobic exercise-induced physiological hypertrophy in zebrafish heart. J. Physiol. Sci. 2021, 71, 33. [Google Scholar] [CrossRef] [PubMed]
- Bonaldo, P.; Sandri, M. Cellular and molecular mechanisms of muscle atrophy. Dis. Model Mech. 2013, 6, 25–39. [Google Scholar] [CrossRef] [PubMed] [Green Version]
- Preedy, V.R.; Paice, A.; Mantle, D.; Dhillon, A.S.; Palmer, T.N.; Peters, T.J. Alcoholic myopathy: Biochemical mechanisms. Drug Alcohol Depend. 2001, 63, 199–205. [Google Scholar] [CrossRef]
- Maddalozzo, G.F.; Turner, R.T.; Edwards, C.H.; Howe, K.S.; Widrick, J.J.; Rosen, C.J.; Iwaniec, U.T. Alcohol alters whole body composition, inhibits bone formation, and increases bone marrow adiposity in rats. Osteoporos. Int. 2009, 20, 1529–1538. [Google Scholar] [CrossRef] [PubMed]
- Gritsyna, Y.V.; Salmov, N.N.; Bobylev, A.G.; Ulanova, A.D.; Kukushkin, N.I.; Podlubnaya, Z.A.; Vikhlyantsev, I.M. Increased Autolysis of μ-Calpain in Skeletal Muscles of Chronic Alcohol-Fed Rats. Alcohol. Clin. Exp. Res. 2017, 41, 1686–1694. [Google Scholar] [CrossRef] [PubMed]
- Sylvain, N.J.; Brewster, D.L.; Ali, D.W. Zebrafish embryos exposed to alcohol undergo abnormal development of motor neurons and muscle fibers. Neurotoxicol. Teratol. 2010, 32, 472–480. [Google Scholar] [CrossRef]
- Laudato, J.A.; Tice, A.L.; Call, J.A.; Gordon, B.S.; Steiner, J.L. Effects of alcohol on skeletal muscle contractile performance in male and female mice. PLoS ONE 2021, 16, e0255946. [Google Scholar] [CrossRef]
- Davuluri, G.; Welch, N.; Sekar, J.; Gangadhariah, M.; Alsabbagh Alchirazi, K.; Mohan, M.L.; Kumar, A.; Kant, S.; Thapaliya, S.; Stine, M.; et al. Activated Protein Phosphatase 2A Disrupts Nutrient Sensing Balance Between Mechanistic Target of Rapamycin Complex 1 and Adenosine Monophosphate-Activated Protein Kinase, Causing Sarcopenia in Alcohol-Associated Liver Disease. Hepatology 2021, 73, 1892–1908. [Google Scholar] [CrossRef]
- Schiaffino, S.; Dyar, K.A.; Ciciliot, S.; Blaauw, B.; Sandri, M. Mechanisms regulating skeletal muscle growth and atrophy. FEBS J. 2013, 280, 4294–4314. [Google Scholar] [CrossRef]
- Chen, Y.H.; Chiu, W.C.; Xiao, Q.; Chen, Y.L.; Shirakawa, H.; Yang, S.C. Synbiotics Alleviate Hepatic Damage, Intestinal Injury and Muscular Beclin-1 Elevation in Rats after Chronic Ethanol Administration. Int. J. Mol. Sci. 2021, 22, 2547. [Google Scholar] [CrossRef]
- Shenkman, B.S.; Belova, S.P.; Zinovyeva, O.E.; Samkhaeva, N.D.; Mirzoev, T.M.; Vilchinskaya, N.A.; Altaeva, E.G.; Turtikova, O.V.; Kostrominova, T.Y.; Nemirovskaya, T.L. Effect of Chronic Alcohol Abuse on Anabolic and Catabolic Signaling Pathways in Human Skeletal Muscle. Alcohol. Clin. Exp. Res. 2018, 42, 41–52. [Google Scholar] [CrossRef]
- Li, Y.; Zhang, F.; Modrak, S.; Little, A.; Zhang, H. Chronic Alcohol Consumption Enhances Skeletal Muscle Wasting in Mice Bearing Cachectic Cancers: The Role of TNFα/Myostatin Axis. Alcohol. Clin. Exp. Res. 2020, 44, 66–77. [Google Scholar] [CrossRef]
- Carrero, J.J.; Chmielewski, M.; Axelsson, J.; Snaedal, S.; Heimbürger, O.; Bárány, P.; Suliman, M.E.; Lindholm, B.; Stenvinkel, P.; Qureshi, A.R. Muscle atrophy, inflammation and clinical outcome in incident and prevalent dialysis patients. Clin. Nutr. 2008, 27, 557–564. [Google Scholar] [CrossRef]
- Yamaki, T.; Wu, C.L.; Gustin, M.; Lim, J.; Jackman, R.W.; Kandarian, S.C. Rel A/p65 is required for cytokine-induced myotube atrophy. Am. J. Physiol. Cell Physiol. 2012, 303, C135–C142. [Google Scholar] [CrossRef] [Green Version]
- Zhang, J.; Zheng, J.; Chen, H.; Li, X.; Ye, C.; Zhang, F.; Zhang, Z.; Yao, Q.; Guo, Y. Curcumin Targeting NF-κB/Ubiquitin-Proteasome-System Axis Ameliorates Muscle Atrophy in Triple-Negative Breast Cancer Cachexia Mice. Mediat. Inflamm. 2022, 2022, 2567150. [Google Scholar] [CrossRef]
- Steiner, J.L.; Pruznak, A.M.; Navaratnarajah, M.; Lang, C.H. Alcohol Differentially Alters Extracellular Matrix and Adhesion Molecule Expression in Skeletal Muscle and Heart. Alcohol. Clin. Exp. Res. 2015, 39, 1330–1340. [Google Scholar] [CrossRef] [Green Version]
- Schulze-Osthoff, K.; Beyaert, R.; Vandevoorde, V.; Haegeman, G.; Fiers, W. Depletion of the mitochondrial electron transport abrogates the cytotoxic and gene-inductive effects of TNF. EMBO J. 1993, 12, 3095–3104. [Google Scholar] [CrossRef]
- Hwang, Y.S.; Jeong, M.; Park, J.S.; Kim, M.H.; Lee, D.B.; Shin, B.A.; Mukaida, N.; Ellis, L.M.; Kim, H.R.; Ahn, B.W.; et al. Interleukin-1beta stimulates IL-8 expression through MAP kinase and ROS signaling in human gastric carcinoma cells. Oncogene 2004, 23, 6603–6611. [Google Scholar] [CrossRef] [Green Version]
- Tang, J.; Xu, L.; Zeng, Y.; Gong, F. Effect of gut microbiota on LPS-induced acute lung injury by regulating the TLR4/NF-kB signaling pathway. Int. Immunopharmacol. 2021, 91, 107272. [Google Scholar] [CrossRef]
- Shen, X.; Luo, L.; Yang, M.; Lin, Y.; Li, J.; Yang, L. Exendin-4 inhibits lipotoxicity-induced oxidative stress in β-cells by inhibiting the activation of TLR4/NF-κB signaling pathway. Int. J. Mol. Med. 2020, 45, 1237–1249. [Google Scholar] [CrossRef] [PubMed]
- Anrather, J.; Racchumi, G.; Iadecola, C. NF-kappaB regulates phagocytic NADPH oxidase by inducing the expression of gp91phox. J. Biol. Chem. 2006, 281, 5657–5667. [Google Scholar] [CrossRef] [PubMed] [Green Version]
- Kumar, A.; Davuluri, G.; Welch, N.; Kim, A.; Gangadhariah, M.; Allawy, A.; Priyadarshini, A.; McMullen, M.R.; Sandlers, Y.; Willard, B.; et al. Oxidative stress mediates ethanol-induced skeletal muscle mitochondrial dysfunction and dysregulated protein synthesis and autophagy. Free Radic. Biol. Med. 2019, 145, 284–299. [Google Scholar] [CrossRef] [PubMed]
- Crews, F.T.; Lawrimore, C.J.; Walter, T.J.; Coleman, L.G., Jr. The role of neuroimmune signaling in alcoholism. Neuropharmacology 2017, 122, 56–73. [Google Scholar] [CrossRef] [PubMed]
- Crews, F.T.; Qin, L.; Sheedy, D.; Vetreno, R.P.; Zou, J. High mobility group box 1/Toll-like receptor danger signaling increases brain neuroimmune activation in alcohol dependence. Biol. Psychiatry 2013, 73, 602–612. [Google Scholar] [CrossRef] [PubMed] [Green Version]
- Doyle, A.; Zhang, G.; Abdel Fattah, E.A.; Eissa, N.T.; Li, Y.P. Toll-like receptor 4 mediates lipopolysaccharide-induced muscle catabolism via coordinate activation of ubiquitin-proteasome and autophagy-lysosome pathways. FASEB J. 2011, 25, 99–110. [Google Scholar] [CrossRef] [PubMed] [Green Version]
- Hunter, R.B.; Kandarian, S.C. Disruption of either the Nfkb1 or the Bcl3 gene inhibits skeletal muscle atrophy. J. Clin. Investig. 2004, 114, 1504–1511. [Google Scholar] [CrossRef] [Green Version]
Publisher’s Note: MDPI stays neutral with regard to jurisdictional claims in published maps and institutional affiliations. |
© 2022 by the authors. Licensee MDPI, Basel, Switzerland. This article is an open access article distributed under the terms and conditions of the Creative Commons Attribution (CC BY) license (https://creativecommons.org/licenses/by/4.0/).